UNIVERSIT `
A DEGLI STUDI DI CATANIA
FACOLT `A DI MEDICINA E CHIRURGIA
DOTTORATO DI RICERCA IN PATOLOGIA ED EMATOLOGIA CLINICA, SPERIMENTALE E COMPUTAZIONALE
XXV CICLO
Luciano Cascione
Application of computational and
statistical methods to
High-throughput gene and
microRNA expression to assess
their roles in cancer
Tesi di dottorato
Coordinatore:
Chiar.mo Prof. Alfredo Ferro
Relatori:
Dr. Pierluigi Gasparini
Dr. Kay Huebner
Dr. Carlo M. Croce
High throughput technologies have become a key tool in cancer research. The analysis of gene expression profiles can give insights into changes in proteins pathways that occur during malignant transformation and cancer progression. Transcriptional expression profiling has proven to be a useful and reliable tool for classifying cancers into subgroups that reflect different histopathological characteristics as well as differential prognostic outcome. In the last decades several studies have demonstrated the crucial role of microRNAs (miRNAs) in human disease in particular in cancer. MiRNAs are small non-protein coding RNAs, able to regulate gene expression at post-transcriptional level, binding the 3’UTR of target genes. A single miRNA can regulate the expression of hundreds of target genes, resulting in either theirs degradation or translational repression. The genome-wide profiling of gene expression and microRNAs will allow investigation of genomic changes in cancer development. When mRNA and microRNA levels are measured in the same sample, an integrative analysis can be performed to compare both profiles and determine their interactions. Here I present the integrated analysis of mRNA and miRNAs expression in tumor, adjacent non-tumor (normal) and lymph node metastatic lesion (mets) tissues, from 251 women with Triple Negative Breast Cancers (TNBC). Tissue specific deregulated miRNAs and mRNAs were identified for normal vs tumor vs mets com-parisons. We linked specific miRNA signatures to patient overall survival (OS) and distant disease free survival (DDFS). By multivariate analysis the signatures were independent predictors for OS and DDFS. We used miRNA/mRNA anti-correlations to identify clinically and genetically diffe-rent TNBC subclasses. We also identified miRNA signatures as potential re-gulators of TNBC subclass-specific gene expression networks defined by ex-pression of canonical signal pathways using IPA Ingenuity software. mRNA expression profiling resulted in clustering of genes expression into 4 molecular subclasses with different expression signatures anti-correlated with the pro-gnostic miRNAs. Our findings suggest that miRNAs have a key role in triple negative breast cancer development probably through their ability to regulate fundamental pathways such as: cellular growth and proliferation, cellular movement and migration. The results also define microRNA expres-sion signatures that characterize and contribute to the phenotypic diversity of TNBC and its metastasis.
Acknowledgements
I would like to thank all the people that have helped and supported me during the three-year PhD program; in particular I would like to express my gratitude to my thesis coordinator, Prof. Alfredo Ferro and Dr. Carlo M. Croce for offering me the opportunity to join his lab.
I thank Dr. Alfredo Pulvirenti, for supervising my master and bachelor degree projects. You paved my way to this PhD project.
I would like to thank Rosalba Giugno, Alessandro Lagana e Dario Veneziano for the research we did together.
I would like to thank the members of Carlo Croce’s Lab at The Ohio State University for welcoming me in Columbus. I have learned a lot from each one of you; You are great collaborators, it is a real pleasure to work and interact with you.
Many many thanks to Kay Huebner for involving me in the Triple Negative Breast Cancer project, supporting me during my visit in Ohio and always being optimistic about research.
Special thanks to Pierluigi Gasparini for believing in me as bioinformatician, trying to teach me the basic wet-lab techniques, making a tremendous work of editing of my thesis but more importantly for being a good friend. Finally, I thank my parents and my wife for their love, support and encou-ragement.
List of Figures v
List of Tables vii
1 Introduction 1
1.1 Cancer Biology . . . 1
1.2 Causes of Cancer . . . 2
1.3 microRNA in Human Cancer . . . 4
1.3.1 Bio-genesis and action of microRNAs . . . 4
1.3.2 Genetic abnormalities and miRNAs . . . 15
1.3.3 Epigenetics and miRNAs . . . 16
2 Data analysis 17 2.1 High-throughput profiling in Cancers . . . 17
2.2 Normalization of expression profiles . . . 18
2.2.1 Normalization approaches for RT-PCR . . . 19
2.2.2 Normalization methods for microarray experiments . . . 20
2.2.2.1 Quantile Normalization . . . 21
2.2.2.2 LOESS Normalization . . . 21
2.2.2.3 Variance stabilization normalization . . . 22
2.2.2.4 Scaling normalization . . . 23
2.3 Identification of differentially expressed genes and miRNA . . . 23
2.3.1 t-statistic . . . 24
2.3.2 SAM . . . 24
2.3.3 Empirical bayes method (Limma) . . . 24
2.3.4 ROC . . . 25
2.3.5 Rank Product . . . 26
2.4 Clustering . . . 26
2.5 Integrated analysis of miRNA and gene expression . . . 28
CONTENTS
3 Triple Negative Breast Cancer 31
3.1 Breast Cancer . . . 31
3.1.1 Invasive and Non-Invasive breast cancer . . . 31
3.2 Molecular Subtype . . . 32
3.3 Triple negative breast . . . 33
3.4 Integrated microRNA and mRNA Signatures Associated with Survival in Triple Negative Breast Cancer . . . 35
4 Research Papers 37 4.1 Papers . . . 37 4.2 Abstracts in Meeting . . . 40 4.3 Chapter in book . . . 41 5 Conclusion 43 5.1 . . . 43 References 45
1.1 The Hallmarks of Cancer. . . 1 1.2 The impact of genes and environment on the development of cancer. . . 3 1.3 A model for the miRNA biogenesis pathway and its action mechanism
in mammals. . . 4 2.1 The transfer of genetic information from DNA, through mRNA to proteins. 18 3.1 Venn Diagram between triple negative and basal-like tumors. . . 34
1.1 Tumor-suppressor miRNAs . . . 5 1.2 OncomiRs in action . . . 10 3.1 Breast Cancer molecular sub-types . . . 32
Introduction
1.1
Cancer Biology
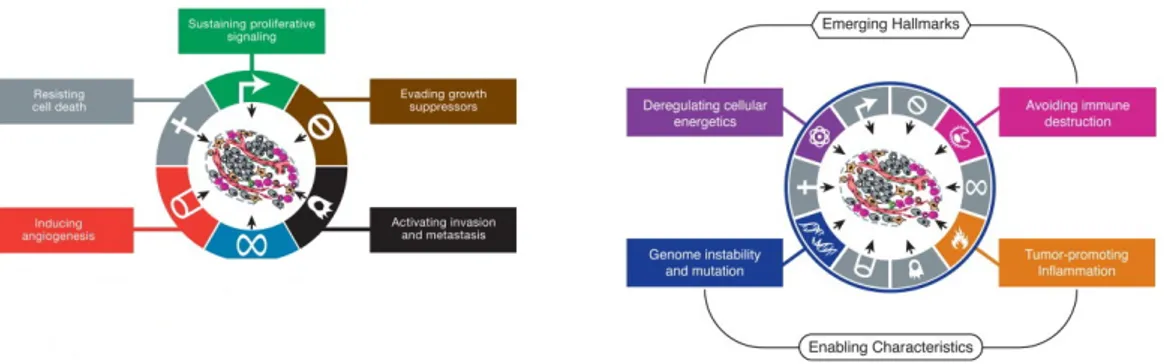
In a healthy condition our natural system controls the generation, growth and death (apoptosis) of cells in perfectly balanced equilibrium. In the natural cycle of their life, cells divide to make new tissues as older cells die. Cancer is a heterogeneous group of diseases where this natural system does not work right and cells do not die at the normal rate. This growing mass of cells, the tumor, can skip the entire cell checkpoints and grow uncontrolled. Cancers are generally classified by the type of cells or organ from which they originate. Since malignant growth can occur in virtually all locations of the body, there are over 100 different types of cancers. Cancer is an immensely complex and diverse disease; however, a set of characteristics are shared among almost all malignancies. Those characteristics, named hallmarks of cancer, are a unified set of capabilities that are acquired during tumorigenesis (Figure 1.1). The originally
Figure 1.1: The Hallmarks of Cancer. - Left: The original set of hallmarks of cancer). Right: Emerging Hallmarks and Enabling Characteristics. From Hanaham et al. 2000 (1) and Hanaham et al. 2011 (2).
proposed hallmarks of cancer include: growth signals, insensitivity to growth-inhibitory signals, evasion of programmed cell death, limitless replicative potential, sustained angiogenesis, and tissue invasion and metastasis (2). As a tumor grows, it develops
1. INTRODUCTION
amazing capabilities to survive, enlarge and spread. It promotes the growth of new blood vessels (angiogenesis) to bring in the oxygen and nutrients it needs. Cancer cells can leave the tumor site and travel through the blood stream and lymphatic system (the network connecting lymph nodes throughout the body) to other parts of the body, such as the liver, lungs or bones. In the new site, cancer cells again may begin to divide and create new tumors. The list of cancer hallmarks has been further extended with newly discovered properties of the tumor such as: deregulating cellular energy balance, decoy immune response, tumor promoting inflammation and genome instability and mutation (2).
1.2
Causes of Cancer
Cancer is often described as the disease of the genome because it acquires its hallmarks through the accumulation of DNA mutations and genome instability (1). Cells can go through uncontrolled growth if there are damages or mutations in their DNA which might compromise the function of the genes involved in cell division. Four types of genes are responsible for the cell division process:
• oncogenes, tell cells when to divide
• tumor suppressor genes, tell cells when not to divide
• suicide genes, control apoptosis and tell the cell to kill itself if something goes wrong
• DNA-repair genes, instruct a cell to repair damaged DNA
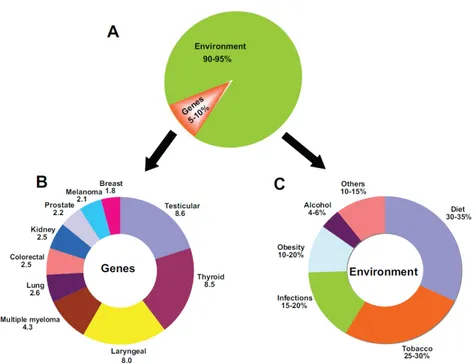
Cancer might occurs when mutations allow cells to skip one of these check points, mutations that inhibit oncogene and tumor suppressor gene functions will lead to uncontrolled cell growth. As we age, there is an increase in the number of possible cancer-causing mutations in our DNA. This makes age an important risk factor for cancer. However, it is estimated that only 5-10% of cancer are caused by inherited traits and the remaining 90-95 % are either caused or contributed to by environmental factors (Figure 1.2).
A wide range of substances, Carcinogens, are directly known to be responsible for damaging DNA, promoting or aiding cancer: tobacco, asbestos, arsenic, radiation such as gamma and x-rays. Cancer can also be the result of an inherited genetic predisposition, inherited from family own members. Some mutations are transmittable to the siblings which will make them statistically more likely to develop cancer later in life. Another possible cause of cancer can be virus infections. Worldwide, around 18% of cancers are caused by virus infections such as: human papillomavirus (a cause of cervical cancer), hepatitis B and C (a causes of liver cancer), and Epstein-Barr virus (a cause of some childhood cancers). Human immunodeficiency virus (HIV) -and anything else that suppresses or weakens the immune system, inhibits the body’s ability to fight and so increases the chance of developing cancer.
Figure 1.2: The impact of genes and environment on the development of cancer. - A) The percentage contribution of genetic and environmental factors to cancer. B) Numbers represent familial risk ratios - an age-adjusted risk ratio to first-degree relatives of cases compared with the general population. C) Numbers represent the attributable-fraction of cancer deaths due to the specified environmental risk factor. From Anand et al. 2008 (3).
1. INTRODUCTION
1.3
microRNA in Human Cancer
1.3.1 Bio-genesis and action of microRNAs
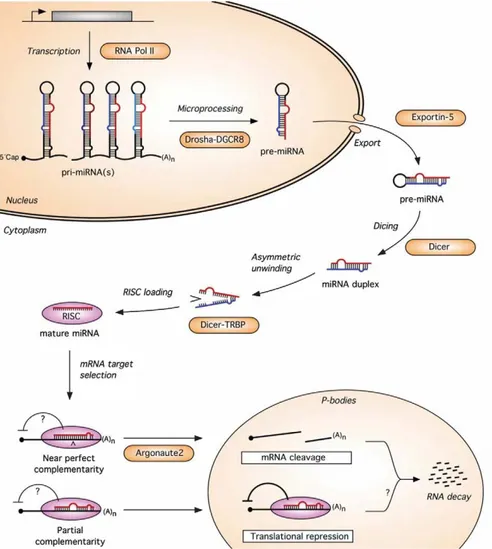
MiRNAs are non-coding single-stranded RNAs which are typically 20-25 nucleotides long. As non-coding genes, they are transcribed from DNA, but are not translated into proteins. The mature miRNA molecules are produced in a multi-step process. The DNA sequence is transcribed by RNA polymerase II into a single stranded RNA molecule by hairpin structures known as primary transcripts or pri-miRNAs. The primiRNAs are processed (cutted) into the nucleus by RNAse III Drosha into 70100 nucleotides long fragments called pre-miRNAs.
Figure 1.3: A model for the miRNA biogenesis pathway and its action
mechanism in mammals. - From Wienholds et al. 2005 (4)
The pre-miRNA molecule is then actively transported to the cytoplasm by a carrier protein. Here, an additional step mediated by the Dicer, generates a double strand
1.3
microRNA in Human Cancer
1.3.1 Bio-genesis and action of microRNAs
MiRNAs are non-coding single-stranded RNAs which are typically 20-25 nucleotides long. As non-coding genes, they are transcribed from DNA, but are not translated into proteins. The mature miRNA molecules are produced in a multi-step process. The DNA sequence is transcribed by RNA polymerase II into a single stranded RNA molecule by hairpin structures known as primary transcripts or pri-miRNAs. The primiRNAs are processed (cutted) into the nucleus by RNAse III Drosha into 70100 nucleotides long fragments called pre-miRNAs.
Figure 1.3: A model for the miRNA biogenesis pathway and its action
mechanism in mammals. - From Wienholds et al. 2005 (4)
The pre-miRNA molecule is then actively transported to the cytoplasm by a carrier protein. Here, an additional step mediated by the Dicer, generates a double strand
1.3 microRNA in Human Cancer
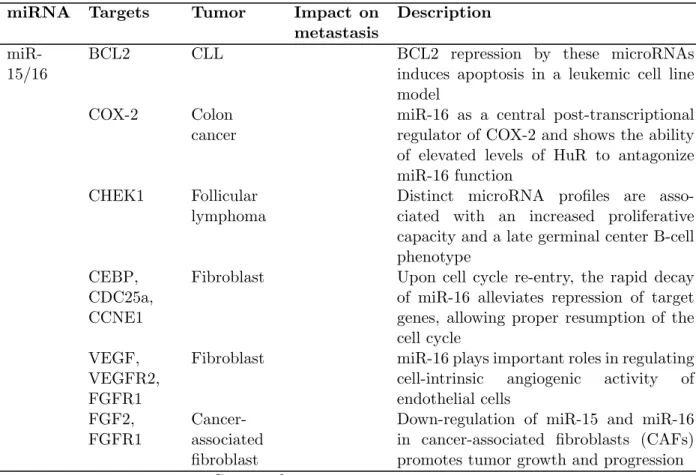
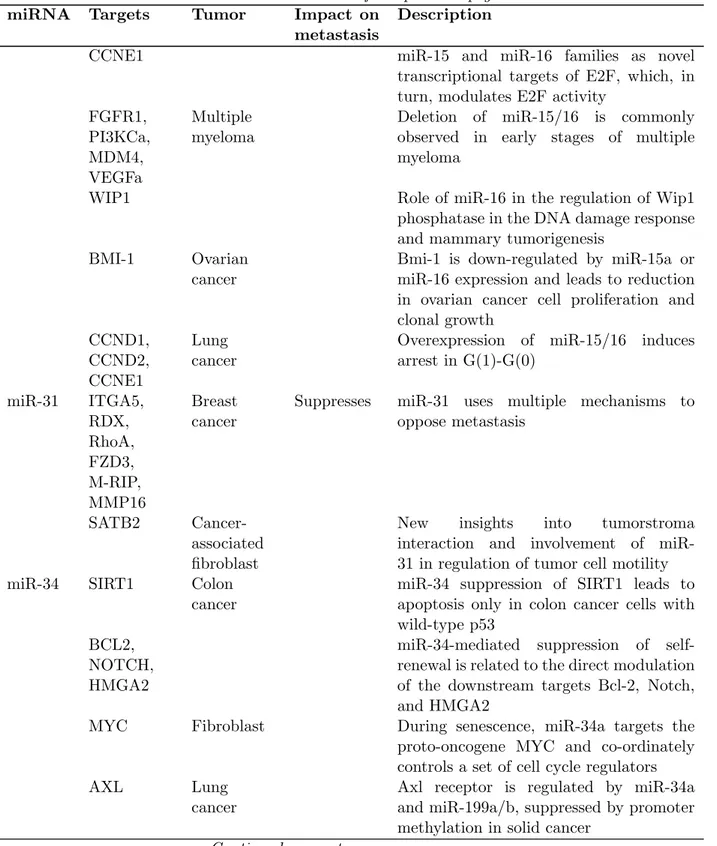
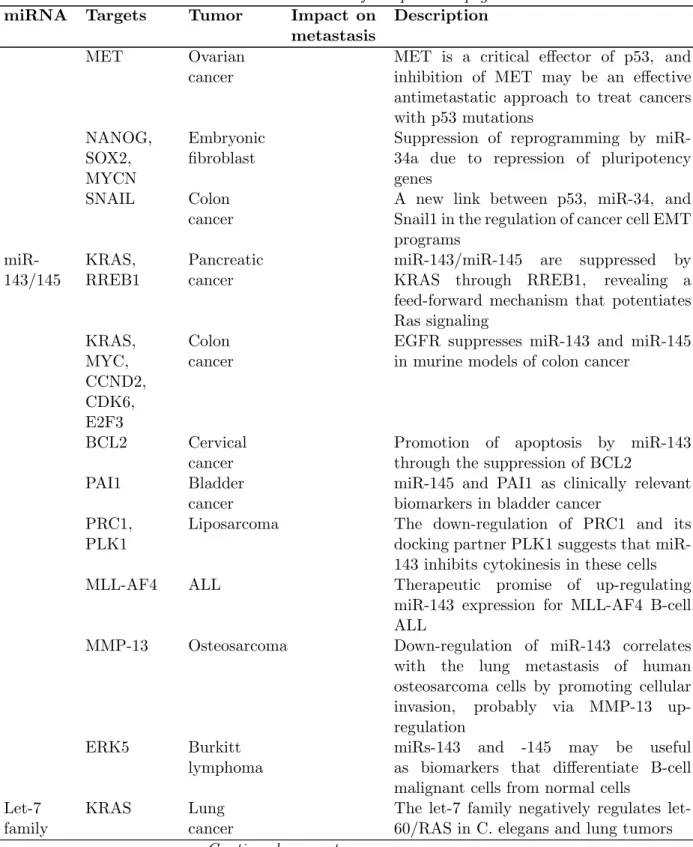
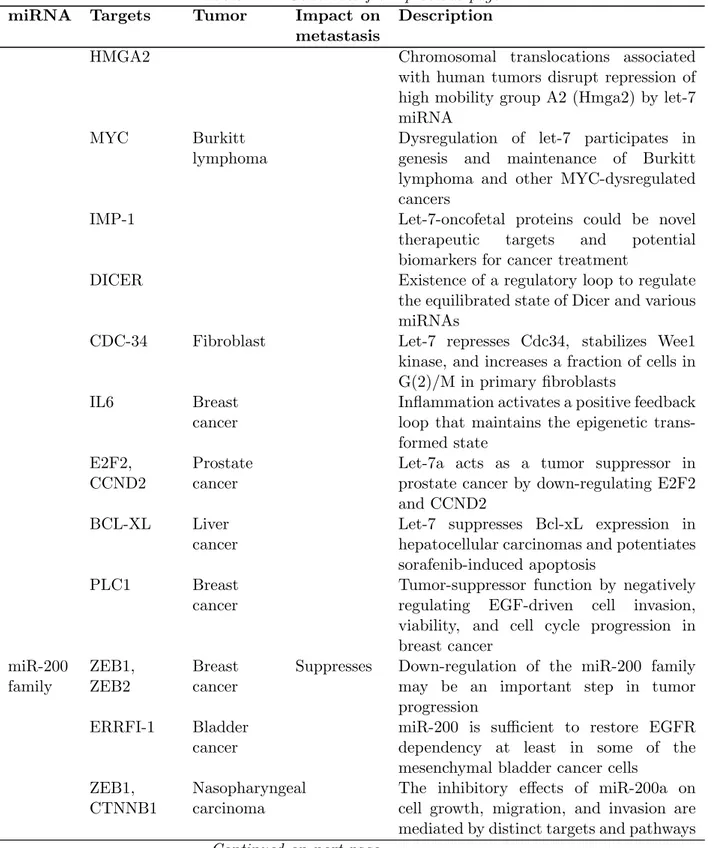
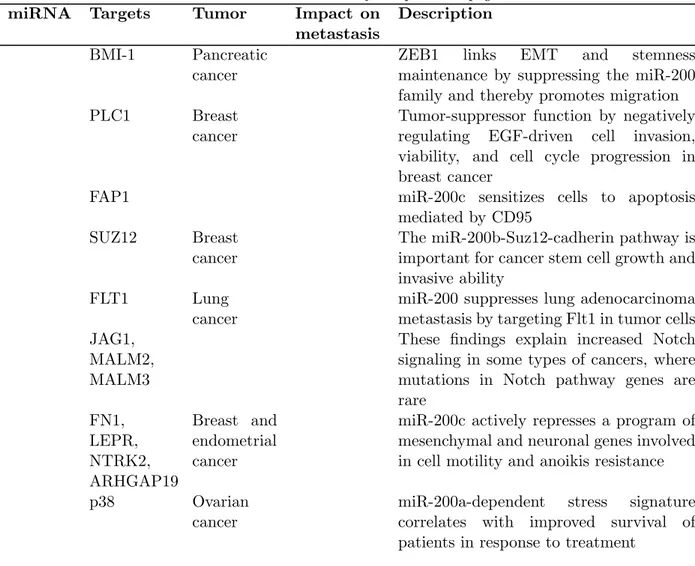
RNA (dsRNA) approximately 22 nucleotides long, including the mature miRNA guide (3p arm) and the complementary passenger strand (5p arm). Once completed the processing steps, through this mechanism that is not fully characterized yet, the mature miRNA is able to regulate gene expression at post-transcriptional level, binding through partial complementarity the 3’ untranslated region (3’ UTR) of the target mRNA, and mainly leading to either mRNA degradation or translation inhibition (5). Depending on the targeted mRNAs, the miRNA action ultimately results in reduced protein levels and profound consequences on cellular homeostasis. Recent bioinformatics and experimental reports suggest that over 30% of human genes are direct targets of miRNAs (5), indicating their key roles in almost every biological process, including: cell cycle regulation, cell growth, apoptosis, cell differentiation and stress response. Recent genome-wide analyses have identified dysregulated miRNA expression in human malignancies (5), giving them an oncogenic (Table 1.2) or tumor suppressor role (Table 1.1) (6).
Table 1.1: Representative examples of Tumor-suppressor miRNAs in the most common human cancers. From Di Leva et al. 2012 (6).
miRNA Targets Tumor Impact on metastasis
Description
miR-15/16
BCL2 CLL BCL2 repression by these microRNAs induces apoptosis in a leukemic cell line model
COX-2 Colon cancer
miR-16 as a central post-transcriptional regulator of COX-2 and shows the ability of elevated levels of HuR to antagonize miR-16 function
CHEK1 Follicular lymphoma
Distinct microRNA profiles are asso-ciated with an increased proliferative capacity and a late germinal center B-cell phenotype
CEBP, CDC25a, CCNE1
Fibroblast Upon cell cycle re-entry, the rapid decay of miR-16 alleviates repression of target genes, allowing proper resumption of the cell cycle
VEGF, VEGFR2, FGFR1
Fibroblast miR-16 plays important roles in regulating cell-intrinsic angiogenic activity of endothelial cells FGF2, FGFR1 Cancer-associated fibroblast
Down-regulation of miR-15 and miR-16 in cancer-associated fibroblasts (CAFs) promotes tumor growth and progression Continued on next page
Table 1.1 – Continued from previous page miRNA Targets Tumor Impact on
metastasis
Description
CCNE1 miR-15 and miR-16 families as novel
transcriptional targets of E2F, which, in turn, modulates E2F activity
FGFR1, PI3KCa, MDM4, VEGFa Multiple myeloma
Deletion of miR-15/16 is commonly observed in early stages of multiple myeloma
WIP1 Role of miR-16 in the regulation of Wip1 phosphatase in the DNA damage response and mammary tumorigenesis
BMI-1 Ovarian cancer
Bmi-1 is down-regulated by miR-15a or miR-16 expression and leads to reduction in ovarian cancer cell proliferation and clonal growth CCND1, CCND2, CCNE1 Lung cancer
Overexpression of miR-15/16 induces arrest in G(1)-G(0) miR-31 ITGA5, RDX, RhoA, FZD3, M-RIP, MMP16 Breast cancer
Suppresses miR-31 uses multiple mechanisms to oppose metastasis
SATB2 Cancer-associated fibroblast
New insights into tumorstroma interaction and involvement of miR-31 in regulation of tumor cell motility miR-34 SIRT1 Colon
cancer
miR-34 suppression of SIRT1 leads to apoptosis only in colon cancer cells with wild-type p53
BCL2, NOTCH, HMGA2
miR-34-mediated suppression of self-renewal is related to the direct modulation of the downstream targets Bcl-2, Notch, and HMGA2
MYC Fibroblast During senescence, miR-34a targets the proto-oncogene MYC and co-ordinately controls a set of cell cycle regulators
AXL Lung
cancer
Axl receptor is regulated by miR-34a and miR-199a/b, suppressed by promoter methylation in solid cancer
1.3 microRNA in Human Cancer
Table 1.1 – Continued from previous page miRNA Targets Tumor Impact on
metastasis
Description MET Ovarian
cancer
MET is a critical effector of p53, and inhibition of MET may be an effective antimetastatic approach to treat cancers with p53 mutations NANOG, SOX2, MYCN Embryonic fibroblast
Suppression of reprogramming by miR-34a due to repression of pluripotency genes
SNAIL Colon cancer
A new link between p53, miR-34, and Snail1 in the regulation of cancer cell EMT programs miR-143/145 KRAS, RREB1 Pancreatic cancer
miR-143/miR-145 are suppressed by KRAS through RREB1, revealing a feed-forward mechanism that potentiates Ras signaling KRAS, MYC, CCND2, CDK6, E2F3 Colon cancer
EGFR suppresses miR-143 and miR-145 in murine models of colon cancer
BCL2 Cervical cancer
Promotion of apoptosis by miR-143 through the suppression of BCL2
PAI1 Bladder cancer
miR-145 and PAI1 as clinically relevant biomarkers in bladder cancer
PRC1, PLK1
Liposarcoma The down-regulation of PRC1 and its docking partner PLK1 suggests that miR-143 inhibits cytokinesis in these cells MLL-AF4 ALL Therapeutic promise of up-regulating
miR-143 expression for MLL-AF4 B-cell ALL
MMP-13 Osteosarcoma Down-regulation of miR-143 correlates with the lung metastasis of human osteosarcoma cells by promoting cellular invasion, probably via MMP-13 up-regulation
ERK5 Burkitt lymphoma
miRs-143 and -145 may be useful as biomarkers that differentiate B-cell malignant cells from normal cells
Let-7 family
KRAS Lung
cancer
The 7 family negatively regulates let-60/RAS in C. elegans and lung tumors Continued on next page
Table 1.1 – Continued from previous page miRNA Targets Tumor Impact on
metastasis
Description
HMGA2 Chromosomal translocations associated with human tumors disrupt repression of high mobility group A2 (Hmga2) by let-7 miRNA
MYC Burkitt lymphoma
Dysregulation of let-7 participates in genesis and maintenance of Burkitt lymphoma and other MYC-dysregulated cancers
IMP-1 Let-7-oncofetal proteins could be novel therapeutic targets and potential biomarkers for cancer treatment
DICER Existence of a regulatory loop to regulate the equilibrated state of Dicer and various miRNAs
CDC-34 Fibroblast Let-7 represses Cdc34, stabilizes Wee1 kinase, and increases a fraction of cells in G(2)/M in primary fibroblasts
IL6 Breast cancer
Inflammation activates a positive feedback loop that maintains the epigenetic trans-formed state
E2F2, CCND2
Prostate cancer
Let-7a acts as a tumor suppressor in prostate cancer by down-regulating E2F2 and CCND2
BCL-XL Liver cancer
Let-7 suppresses Bcl-xL expression in hepatocellular carcinomas and potentiates sorafenib-induced apoptosis
PLC1 Breast cancer
Tumor-suppressor function by negatively regulating EGF-driven cell invasion, viability, and cell cycle progression in breast cancer miR-200 family ZEB1, ZEB2 Breast cancer
Suppresses Down-regulation of the miR-200 family may be an important step in tumor progression
ERRFI-1 Bladder cancer
miR-200 is sufficient to restore EGFR dependency at least in some of the mesenchymal bladder cancer cells
ZEB1, CTNNB1
Nasopharyngeal carcinoma
The inhibitory effects of miR-200a on cell growth, migration, and invasion are mediated by distinct targets and pathways Continued on next page
1.3 microRNA in Human Cancer
Table 1.1 – Continued from previous page miRNA Targets Tumor Impact on
metastasis
Description BMI-1 Pancreatic
cancer
ZEB1 links EMT and stemness maintenance by suppressing the miR-200 family and thereby promotes migration PLC1 Breast
cancer
Tumor-suppressor function by negatively regulating EGF-driven cell invasion, viability, and cell cycle progression in breast cancer
FAP1 miR-200c sensitizes cells to apoptosis mediated by CD95
SUZ12 Breast cancer
The miR-200b-Suz12-cadherin pathway is important for cancer stem cell growth and invasive ability
FLT1 Lung
cancer
miR-200 suppresses lung adenocarcinoma metastasis by targeting Flt1 in tumor cells JAG1,
MALM2, MALM3
These findings explain increased Notch signaling in some types of cancers, where mutations in Notch pathway genes are rare FN1, LEPR, NTRK2, ARHGAP19 Breast and endometrial cancer
miR-200c actively represses a program of mesenchymal and neuronal genes involved in cell motility and anoikis resistance p38 Ovarian
cancer
miR-200a-dependent stress signature correlates with improved survival of patients in response to treatment
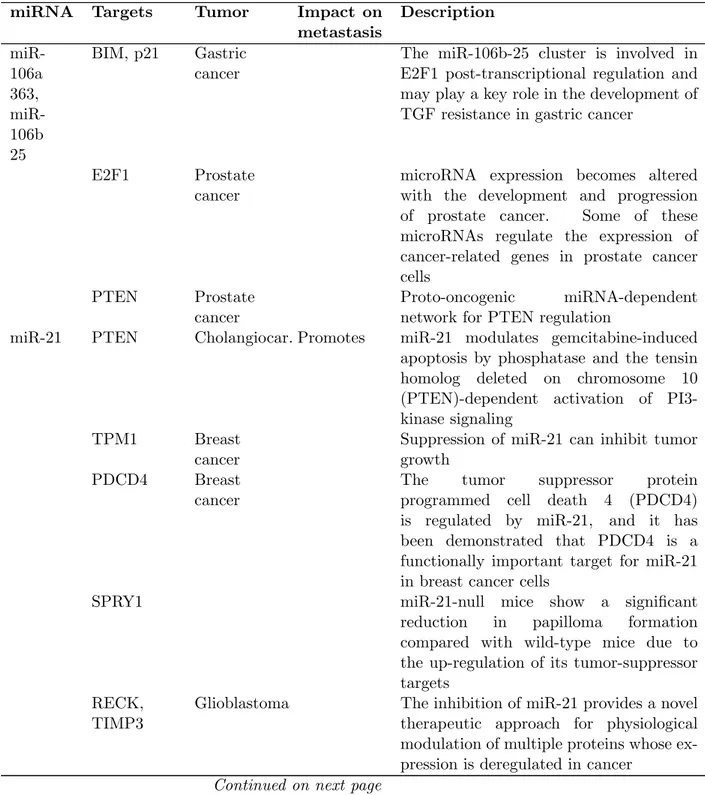
Table 1.2: Representative examples of OncomiRs in the most common human cancers. From Di Leva et al. 2012 (6).
miRNA Targets Tumor Impact on metastasis Description miR-106a 363, miR-106b 25 BIM, p21 Gastric cancer
The miR-106b-25 cluster is involved in E2F1 post-transcriptional regulation and may play a key role in the development of TGF resistance in gastric cancer
E2F1 Prostate cancer
microRNA expression becomes altered with the development and progression of prostate cancer. Some of these microRNAs regulate the expression of cancer-related genes in prostate cancer cells
PTEN Prostate cancer
Proto-oncogenic miRNA-dependent network for PTEN regulation
miR-21 PTEN Cholangiocar. Promotes miR-21 modulates gemcitabine-induced apoptosis by phosphatase and the tensin homolog deleted on chromosome 10 (PTEN)-dependent activation of PI3-kinase signaling
TPM1 Breast cancer
Suppression of miR-21 can inhibit tumor growth
PDCD4 Breast cancer
The tumor suppressor protein programmed cell death 4 (PDCD4) is regulated by miR-21, and it has been demonstrated that PDCD4 is a functionally important target for miR-21 in breast cancer cells
SPRY1 miR-21-null mice show a significant
reduction in papilloma formation compared with wild-type mice due to the up-regulation of its tumor-suppressor targets
RECK, TIMP3
Glioblastoma The inhibition of miR-21 provides a novel therapeutic approach for physiological modulation of multiple proteins whose ex-pression is deregulated in cancer
1.3 microRNA in Human Cancer
Table 1.2 – Continued from previous page miRNA Targets Tumor Impact on
metastasis Description p63, JMY, TOPORS, TP53BP2, DAXX, HNRPK, TGFRII
Glioblastoma miR-21 targets multiple important components of p53, transforming growth factor- (TGF), and mitochondrial apoptosis tumor-suppressive pathways
MARKS Prostate cancer
miR-21 could promote apoptosis resistance, motility, and invasion in prostate cancer cells
ANP32A, SACA4 Prostate cancer miR-10a/10b HOXB1, HOXB3 Pancreatic cancer
Promotes miR-10a is a key mediator of metastatic behavior in pancreatic cancer that regulates metastasis via suppression of HOXB1 and HOXB3
HOXD10 Breast cancer
TWIST transcription factor induces ex-pression of a specific microRNA that suppresses its direct target and in turn activates another pro-metastatic gene, leading to tumor cell invasion and metastasis
KLF4 Esophageal cancer
A significant correlation of miR-10b level with cell motility and invasiveness
TIAM1 Breast cancer
A mechanism for the regulation of Tiam1-mediated Rac activation in breast cancer cells
Nf1 Ewing’s sarcoma
miR-10b may play an important role in NF1 tumorigenesis through targeting neurofibromin and RAS signaling
miR-107/103
DICER Breast cancer
Promotes Dicer inhibition drifts epithelial cancer toward a less-differentiated, mesenchymal fate to foster metastasis
miR-9 PRDM1 Lymphomas Promotes miRNA-mediated down-regulation of PRDM1/Blimp-1 may contribute to the phenotype maintenance and pathogenesis of lymphoma cells by interfering with normal B-cell terminal differentiation CDH1 Breast
cancer
Table 1.2 – Continued from previous page miRNA Targets Tumor Impact on
metastasis
Description
CAMTA Glioblastoma miR-9 is highly expressed in glioblastoma cancer stem cells and reduces the levels of CAMTA tumor-suppressor
miR-1792
TSP-1, CTGF
Colon Promotes Up-regulated in colonocytes coexpressing K-Ras, c-Myc and p53 impaired activity E2F2, E2F3 Prostate/Burkitt
lymphoma/testis carcinoma/
Presence of an autoregulatory feedback loop between E2F factors and miR-17/92 BIM,
PTEN
c-Myc-induced lymphoma
Transgenic mice with higher expression of miR-17/92 in lymphocytes
HIF1 Lung
cancer
Intricate and finely tuned circuit involving c-myc, miR-17/92, and HIF1
PTPRO Cervix tumor cell line
PTPRO gene is co-regulated by both E2F1 and miR-17/92 at transcriptional and post-transcriptional level, respectively
p63 Myeloid cells
miR-92 increases cell proliferation by ne-gative regulation of an isoform of the cell cycle regulator p63 BIM, PTEN, PRKAA1, PPP2R5e T-cell acute lymphoblastic leukemia
Functional genomics approach reveals a co-ordinate clamp-down on several regulators of phosphatidylinositol-3-OH kinase-related survival signals by the leukemogenic miR-19
JAK1 Endothelial cells
The miR-17/92 family may provide an interesting therapeutic perspective specifically to enhance therapeutic angiogenesis
HBP1 Breast cancer
The miR-17/92 cluster plays an important role in breast cancer cell invasion and migration by suppressing HBP1 and subsequently activating Wnt/-catenin p21(WAF1)
Ras-induced senescent fibroblasts
Disruption of senescence by miR-17/92 or its miR-17/20a components leads to enhanced oncogenic transformation by activated Ras in primary human cells Continued on next page
1.3 microRNA in Human Cancer
Table 1.2 – Continued from previous page miRNA Targets Tumor Impact on
metastasis
Description
TGFII SA4 Glioblastoma miR-17/92 attenuates the TGF signaling pathway to shut down clusterin expres-sion, thereby stimulating angiogenesis and tumor cell growth
MnSOD, GPX2, TRXR2
Prostate miR-17/92 may suppress tumorigenicity of prostate cancer through inhibition of mitochondrial antioxidant enzymes miR-221/222 p27kip1 Glioblastoma, prostate and thyroid carcinoma
Promotes Certain cancer cell lines require high activity of miR-221/222 to maintain low p27kip1 levels and continuous proliferation
p57kip2 Normal fibroblast
Up-regulation of miR-221/222 is tightly linked to the initiation of S phase with growth factor signaling pathways that stimulate cell proliferation
PTEN, TIMP3 Non-small cell lung cancer and hepatocellular carcinoma
miR-221/222, by targeting PTEN and TIMP3 tumor suppressors, induce TRAIL resistance and enhance cellular migration. The MET oncogene is involved in miR-221/222 activation through the c-Jun transcription factor
FOXO3A Breast cancer
The miR-221/222 cluster targets FOXO3A to suppress p27kip1 also at a transcriptional level
KIT Endothelial cells
Interaction between miR-222 and c-Kit is likely to be part of a complex circuit that controls the ability of endothelial cells to form new capillaries
ESR1 Breast cancer
Modulation of ER is associated with antiestrogen therapy
PUMA Glioblastoma miR-221/222 directly regulate apoptosis by targeting PUMA in glioblastoma TRSP1 Breast
cancer
miR-221/222 promote EMT and contribute to the more aggressive clinical behavior of basal-like breast cancers PTP Glioblastoma miR-221/222 regulate glioma
tumorigenesis at least in part through the control of PTP protein expression
DICER Breast cancer
Dicer is low in ER-negative breast cancers, since such cells express high miR-221/222 Continued on next page
Table 1.2 – Continued from previous page miRNA Targets Tumor Impact on
metastasis
Description APAF1 Non-small
cell lung cancer
miR-221/222 are modulated by both epidermal growth factor (EGF) and MET receptors, and, by targeting APAF1, miR-221/222 are responsible for gefitinib resistance
miR-155 SOCS1 Breast cancer
miR-155 is an oncomiR in breast cancer, and it has been suggested that miR-155 may serve as a bridge between inflammation and cancer
CEBPB, PU.1, CUTL1, PICALM
AML miR-155 as a contributor to physiological GM expansion during inflammation and to certain pathological features associated with AML
BACH1, ZIC3
The induction of miR-155 by EBV contributes to EBV-mediated signaling in part through the modulation of transcriptional regulatory factors
ETS1, MEIS1
Human cord blood CD34+
miR-155 is required for megakaryocytic proliferation and differentiation
C-MAF Lymphocytes bic/microRNA-155 plays a key role in the homeostasis and function of the immune system
HGAL Diffuse large B-cell lymphoma
Cell dissemination and aggressiveness is a phenotype of DLBCL typically expressing high levels of miR-155 and lacking HGAL expression
JMJD1A Nasopharyngeal carcinoma
Up-regulation of miR-155 is partly driven by LMP1 and LMP2A, and results in down-regulation of JMJD1A, associated with N stage and poor prognosis
WEE1 Breast cancer
miR-155 enhances mutation rates by decreasing the efficiency of DNA safeguard mechanisms by targeting of cell cycle regulators such as WEE1 TP53INP1 Pancreatic
cancer
TP53INP1 expression is repressed by the oncogenic micro RNA miR-155, which is overexpressed in pancreatic carcinoma cells
1.3 microRNA in Human Cancer
Table 1.2 – Continued from previous page miRNA Targets Tumor Impact on
metastasis Description SMAD1, SA5, HIVEP2, CEBPB, RUNX2, MYO10
Role for miR-155 in controlling BMP-mediated cellular processes
FOXO3a Breast cancer
Molecular links between miR-155 and FOXO3a affect cell survival and response to chemotherapy in breast cancer
hMSH2, hMSH6, and hMLH1
Colon cancer
Inactivation of mismatch repair is induced by miR-155
SMAD5 Diffuse large B-cell lymphoma
Highlighted a hitherto unappreciated role of SA5 in lymphoma biology and defined a unique mechanism used by cancer cells to escape TGF’s growth-inhibitory effects
Alterations in the expression of miRNAs were initially identified in B-cell leukemia (7), now are considered a common characteristic of all human tumors. Genome-wide profiling showed that miRNA expression signatures (miRNome) allowed different types of cancer to be discriminated with high accuracy (8)(9). Iorio et al. in 2005 (10) compared normal breast tissue with breast cancer tissue using microRNA profile. The overall miRNA expression could clearly separate normal versus cancer tissues; they also could identify miRNAs whose expression was correlated with specific breast cancer bio-pathologic features, such as estrogen and progesterone receptor expression, tumor stage, vascular invasion, or proliferation index.
1.3.2 Genetic abnormalities and miRNAs
Having addressed the strong association between miRNA levels and human diseases, the precise control of miRNAs levels is essential in maintaining normal cellular homeostasis. Genomic abnormalities, such as chromosomal rearrangements, genomic amplifications, deletions or mutations, can alter miRNA genes too reflecting their affects on protein coding genes down stream. In 2004, an in silico study showed that more than half of miRNAs map to genomic regions that are frequently altered in cancer (11):
• loss of heterozygosity regions (LOH) (e.g. miR-15a/16-1) • amplified regions (e.g. miR-17-92 cluster, miR-155)
• breakpoint regions and fragile sites (FRA) (e.g. let-7 family members)
Amplification of miRNAs might also occurs in cancer, this is exemplified by the human oncogenic cluster miR-17-92, which is located at chromosome 13q31 (12). Overex-pression of miR-17-92 increases MYC-induced lymphomagenesis, and this region is preferentially amplified in cancers such as DLBCL, follicular lymphoma, mantle cell lymphoma and primary cutaneous B-cell lymphoma.
1.3.3 Epigenetics and miRNAs
It is now recognized that cancer is mainly a genetic disease, however, genetic lesions alone cannot explain the complexity of the aberrations that arise in cancer cells. Epigenetic, defined as heritable change in gene activity that is independent of DNA sequence, play a prominent role in the initiation and progression of cancer. Three main epigenetic events regulate tumor-associated genes:
• aberrant hypermethylation of tumor-suppressor genes
• global DNA hypomethylation item post-translational modifications of histones MiRNAs can be target of epigenetic events that, in some instances, can explain the perturbation of miRNA expression in cancer (13). An extensive analysis of genomic sequences of miRNA genes have shown that approximately half of them are associa-ted with CpG islands, suggesting that they could be subjecassocia-ted to this mechanism of regulation (Weber et al, 2007). The miRNAs might not only be regulated by epigentic mechanisms, but miRNAs can also regulate enzymes that are involved in the methylation of the CpG islands in tumor suppressor genes. In conclusion, epigenetic changes complemented by genetic inactivation due to mutation or deletion can shed light on the mechanisms that partially account for the miRNA dysregulation in cancer.
Chapter 2
Data analysis
2.1
High-throughput profiling in Cancers
The development of powerful and scalable methods to analyze nucleic acids has transfor-med biological inquiry and has the potential to alter the practice of transfor-medicine (14),(15). The application of such technologies, together with powerful computational methods in human disease and animal models has facilitated the study of both normal and disease-affected tissues in a manner previously not possible. The cellular and molecular heterogeneity of cancer and the large number of genes involved in controlling cell growth, death, and differentiation emphasize the importance of studying multiple genetic alterations in concert. Gene expression profiling allows the simultaneous measurement of the activity (expression) of thousands of genes in a cancer cell. Molecular profiling is an emerging concept in clinical decision making that involves classification of biological specimens such as tumors or other tissues into groups based on multiple changes at the genomic and transcriptomic levels. In the last decade, molecular profiling technologies have advanced our knowledge of cancer biology. Early cancer genome analysis has already led to the discovery of new targets for cancer therapy and new insights about specific genetic mutations and clinical response, as well as new approaches useful for diagnosis and prognosis. These initial efforts have motivated large-scale coordinated cancer genomic efforts to obtain complete catalogs of the genomic alterations in specific cancer types (The Cancer Genome Atlas [TCGA, http://cancergenome.nih.gov). Mi-croarray technology enables simultaneous measurement of thousands of messenger RNAs transcripts (mRNA). Since all proteins in the cells are produced by the translation of mRNA, the mRNA expression levels provide a good approximation of the abundance of proteins (Figure 2.1).
.
A variety of different approaches are being used to profile the mRNA/microRNA ex-pression levels. They generally involve the amplification of DNA templates by PCR and the physical binding of template DNA to a solid surface or to tiny beads called micro-beads. These techniques are often referred to as massively parallel DNA sequencing, because thousands or millions of sequencing reactions are run at once to greatly speed
Figure 2.1: The transfer of genetic information from DNA, through mRNA to proteins. - The genetic mutations are translated into dysregulation of cellular pathways, which in turn can impact transcription and/or translation. The biological processes are influenced by environmental context. From Kreeger et al. 2010 (16)
up the process. All next generation sequencing systems use clonal cluster sequencing. The process, which begins with a single target molecule, involves creation of a clonal target during an intermediate amplification step. Multiple identical copies are required to produce a high signal-to-noise-ratio. Next generation sequencing (NGS) technologies provide a digital expression profiling readout that is fundamentally different than analog measurement systems like microarrays. The NanoString company (Seattle, WA, USA) recently introduced a new concept of digital platform; it is not biased by enzymatic steps such as cDNA synthesis and amplification by PCR. The Nanostring technology can be used to detect any type of nucleic acid in solution and could be modified with appropriate recognition probes to detect other biological molecules as well. It is based on direct digital measurement of gene expression through target-specific color coded probes with high level precision and sensitivity at less than one transcript copy per cell (17). Choosing the best platform for mRNA/microRNA profile is always difficult; and it should best based on experience, experimental conditions in laboratory, and more important on goals of research.
2.2
Normalization of expression profiles
All of the most popular and widely used profiling methods face significant introduction of bias due to differences in sample RNA preparation, dye labelling, hybridization and washing efficiency, peculiarities of print tip, spatial or hybridization specific effects
2.2 Normalization of expression profiles
or pre-amplification of extracted RNA. For these reasons normalization is an essential aspect of data processing. It can minimize systematic technical or experimental variation. This variation has significant impact on the detection of differentially expressed molecu-les between two or more conditions. Inappropriate normalization of the data can lead to incorrect conclusions. Rigorous normalization of miRNA data may even be more critical than that of other RNA functional classes since relatively small changes in miRNA ex-pression may be biologically and clinically significant (18),(19). There is no consensus normalization method for the three miRNA profiling approaches cited above. Several normalization techniques are currently in use, of which some are similar to mRNA profiling normalization methods, while others are specifically modified or developed for miRNA data. The characteristic nature of miRNA molecules, their composition and the resulting data distribution of profiling experiments challenges the selection of adequate normalization techniques. Several studies pointed out that selection of the data preprocessing method can have great impact on the resulting data outcome (20)(21)(22)(23),(24). Thus, prior to normalization, data pre-processing step could be useful. It includes platform and vendor specific steps, such as e.g., baseline adjustment and threshold setting for RT-qPCR analyses, background correction for microarray technology, or filtering for small RNA-sequence data. Following these very first steps of raw data preprocessing, the researcher has to choose the optimal normalization strategy to correct for systematic and technical variation enabling a better estimation of the biological variation.
2.2.1 Normalization approaches for RT-PCR
RT-PCR is generally accepted as gold standard for microRNA measurement and nor-malized microRNA RT-PCR profiling data is used for evaluation of the goodness of miRNA microarray normalization methods (25)(21). The signal intensities may depend on reverse transcription and PCR reaction efficiencies, thus normalization of profiling data is needed for reflecting true miRNA levels. The common normalization methods for microRNA RT-PCR profiling are based on
• predefined invariant endogenous controls • reference miRNAs
• small nuclear and small nucleolar RNA .
Vandesompele et al. (26) argued that it is best to normalize molecules with reference molecules belonging to the same RNA class because the use of small non-coding RNAs other than miRNAs does not mirror the physicochemical properties of miRNA mole-cules. Using non-miRNA reference genes for qPCR normalization is not suitable when the overall abundance of miRNA varies, e.g., in experiments affecting the miRNA processing machinery or in comparisons involving multiple tissues or combinations of tissues and cell lines (27). Selection of invariant miRNAs identified by algorithms
specifically developed for reference gene evaluation and selection was superior over small non-coding RNA based normalization (28)(18). These algorithms are based on reference gene ranking and stepwise elimination of the least stable gene (26) or repeated pair wise correlation and regression analysis (29), or statistical linear mixed-effects modelling (30) of the respective experimental data. Moreover invariant microRNAs can be selected based on a distinguishable low standard deviation and high-mean population as suggested for miRNA microarray preprocessing for RT-qPCR profiling experiments as well (22). Basically, the use of more than one reference gene increases the accuracy of quantification compared to the use of a single reference gene(26)(30). A new interesting and debated method is the calculation of a plate normalizing factor for RT-qPCR based expression profiling platforms; A scaling method has been suggested by Wang in 2009, which uses the average of eight selected miRNA expression values from a descending sorted list (31). Plate-normalizing factor corresponds to an enlargement of percentile normalization and needs further validation by independent datasets prior to judge the robustness of this method. For large scale microRNA expression profiling studies the mean expression value normalization outperformed the current normalization strategy that makes use of stable small RNA controls, such as e.g., snoRNAs proposed by manufacturers, in terms of better reduction of technical variation (28). However, the selection of a limited number of miRNAs or small RNA controls that resemble the mean expression value can be successfully used for normalization in follow-up studies where only a limited number of miRNA molecules are profiled to allow a more accurate assessment of relevant biological variation from a miRNA RT-qPCR profiling experiment (28)(19).
2.2.2 Normalization methods for microarray experiments
Different normalization methods have been used on miRNA microarray expression profiling data sets, but there is currently no clear consensus about their relative per-formances [(22). Some have even chosen to omit this key step [(32),(33),(34) but comparative studies on the relative performance of different methods within a miRNA microarray platform have emphasized the need for evaluating and identifying appropriate normalization algorithms (35)(22)(21). Indeed signal intensities of miRNA microarray experiments may be biased by differences in sample RNA preparation, dye labelling, hybridization and washing efficiency, peculiarities of print tip, spatial or hybridization specific effects or pre-amplification of extracted RNA. miRNA microarrays can be single-color or dual-color systems calling for different normalization approaches. Single-color miRNA microarrays have been predominately used, while dual-colour hybridization systems are less frequently prevalent (35). Both can be observed with respect to intra-array normalization for the correction of dye effects and inter-intra-array approaches for the balance of the distribution differences among experiments (36). The first normalization methods to be used with miRNA array data employed centering to median values (37) or scaling based on total array intensities (38). Certain methodologies currently used for large-scale genome arrays have been adapted to and modified for miRNA arrays such as Quantile (39) and LOESS (Locally Weighted Regression and Smooting Scatterplots)
2.2 Normalization of expression profiles
reviewed in (40). Various assumptions are often taken by normalization methods. Scaling, LOESS and Quantile are based on two assumptions,
• only a small portion of spots is differentially expressed,
• differentially expressed spots are homogeneously distributed with respect to both, over- and under-expressed miRNAs (23).
These assumptions could fail for miRNA platforms as they are printed with a relatively small number of selected sequences (23)(21). There are relatively few known microRNAs for any species (approximately 1000 for humans), and the proportion of microRNAs expressed in a given sample tends to be much smaller than for mRNAs (reflected in the tissue-specific expression pattern of many microRNAs) (24). Because of this, the proportion of miRNAs that are differentially expressed (among those expressed at all) is much larger than that observed when profiling global mRNA expression (24). Thus, it needs to verify whether these assumptions hold true for the respective datasets and one should choose e.g., a normalization method that make only minimal assumption about the presence of a set of constant miRNAs like invariant-based normalization (22). Alternatively, a normalization method free of assumption e.g., the majority of algorithms for variance stabilization normalization (41) or even an assumption free approach (42) can be utilized.
2.2.2.1 Quantile Normalization
Quantile normalization is a transformation method originally proposed by Bolstad et al. (39) for oligonucleotide arrays. It is now widely used for one-color miRNA microarrays as well and was confirmed as one of the most robust methods (21)(22)(35),(43). It is an inter-array approach and equalizes the distributions of expression intensities across arrays. Thus, quantile normalization assumes that the overall distribution of signal intensity does not change. While this assumption likely holds true for the comparison of p53 overexpressing versus control cells (22) or even for brainheart com-parisons according to Rao et al. (35) where only 5% of miRNAs were differentially expressed, it may not hold true in case large numbers of miRNAs are differentially expressed in only one direction. Such cases may be e.g., knockouts of essential miRNA biogenesis proteins which lead to a dramatic reduction in steady state miRNA levels by blocking production of mature miRNAs (35). Rao at Al. in 2008 (35) compare the performance of several normalizations on miRNA single channel microarray profiling showing a better performance of quantile normalization.
2.2.2.2 LOESS Normalization
Between the transformation based methods, LOESS normalization and its variants (35)(21)(23) are the most used. They use local regression via locally weighted scatter plot smooth. It is advisable to introduce weights that penalize outliers because these values can strongly influence the local regression curve. Local regression via LOESS
uses a quadratic polynomial weighted regression function with Tukeys biweight function [(40) of the log ratios Cy3Cy5 on overall spot intensity Cy3 × Cy5 (the LOESS smoother for the so called MA-plots) (23). Hua et al. in 2008 (21) compared 15 normalization methods using microarray data and RT-PCR data. It was found that microRNA noramalized data by print-tip LOESS method were most consistent with the RT-PCR results. In addition, the two channel data normalization (using both Cy3 and Cy5 channels) is better than one-channel (using Cy3). Print-tip LOESS normalizes each M value by subtracting the corresponding value on the tip-group LOESS curve from the raw data (21). However, in a similar study, (24) did not find significant differences between print-tip LOESS and other normalizations. A variant of LOESS normalization called LOESSM was proposed by Risso et al. (23). This non-parametric normalization scales the expression data on the global median expression rather than on zero. This modification relaxes the assumption of symmetry among up- and down-regulated genes and it was shown that LOESSM, in case of absence of channel-effect, has better performance (23). In addition, LOESS combined with Generalized Procrustes Analysis (GPA)- an assumption free inter-array normalization (((42)) - improved its results and outperformed the other normalizations in terms of sensitivity and specificity (23). LOESS normalizations and its variants emerged as being robust in the reduction of non-biological bias.
2.2.2.3 Variance stabilization normalization
Variance stabilization normalization (VSN), an inter-array transformation method, is widely used for microRNA microarray data (24) (22). It was developed for mRNA arrays and is based on a parameterized arsinh transformation instead of a logarithmic transformation that calibrates sample-to-sample variations and renders variance ap-proximately independent of the mean intensity (41). Spike-in VSN normalization as described restricts the model fit to spike-in spots. Normalization intensities for all miRNAs are then obtained by applying the resulting transformation to all spots of interest on the array (24). One limitations of this approach is that reliable results can only be obtained for intensities within the range covered by the spike-in used and that excludes targets that are not expressed. Pradervand et al. (22) proposed a linear regression method to select a set of miRNAs with constat expression (invariants) and used these invariants to calculate VSN parameter (VSN-INV). The invariant probes are those that have mediaum-high mean intesity and low variance across samples. VSN used with default parameter settings assumes that most genes are not differentially expressed whereas the invariant-based regression only assumes that a subpopulation of expressed genes does not change. So, VSN-INV is if a significant fraction of miRNAs is expected to be differentially expressed since, (22). Based on theirs comparisons, Pradervand et al. (22), found that VSN-INV and quantile normalization were the most robust normalization methods compared to VSN with default parameter or scaling. In general, one should note that VSN strongly affects the distribution of the large fraction of miRNAs whose expression is near or at background, resulting in the large increase of variability for those microRNAs (22).
2.3 Identification of differentially expressed genes and miRNA
2.2.2.4 Scaling normalization
The first normalization methods for mRNA microarray were based on the selections of predefined and stably expressed housekeeping genes as described by Garzon et al. (44) and Perkins at al. (45). Most commercially available miRNA microarrays do not have controls for endogenous RNAs that have been shown to be robustly invariant between various different tissue samples or conditions (35). To date, there is no consensus on the existence and reliability of reference gene miRNAs. The selection of reference genes to normalize miRNA levels depends on bioinformatic analysis of the respective data (as shown for mRNA (26)(30) and is otherwise still rather empirical due to the lack of robust reference miRNAs (46), although a universal reference miRNA reagent set has been proposed (24). Bargaje et al. (43) identified constitutively expressed miRNAs across tissues. The mean of expression levels of a set of 16 microRNAs showing minimum variability was reasonably successful as a normalization factor for comparing datasets generated by the same platforms. However, normalization using constitutive microRNAs was ineffective when comparing bead-based and microarray-based datasets. In these cases quantile and Z-score normalization were both successful in transforming the data sets generating comparable means and scale (43). The scaling methods like Z-score (43), mean, median (reviewed in (21)), or 75th percentile (20) assume that different sets of intensities differ by a constant global factor and all raw intensity values are multiplied with one common (i.e., global) scaling factor. The Z-score provides a mean-centered rank for the expression level in units of standard deviation. Z-scores thus provide an index of the expression level of the miRNA with respect to the cellular pool of miRNA. Unlike other normalization methods Z-scores are not influenced by the addition of new datasets allowing flexible cross-platform validation of miRNA microar-ray profiling experiments (43). Recently, Wang et al. (47) suggested the pre-evaluation of the overall miRNA expression pattern by a panel of miRNAs using RT-qPCR assays to build a logistic regression model based on these results. The personalized logistic regression model based on 29 miRNAs efficiently calibrated the variance across arrays and improved miRNA microarray discovery accuracy compared with different scaling methods, LOESS or quantile normalization (47).
2.3
Identification of differentially expressed genes and miRNA
Several methods have been applied to the identification of differentially expressed genes and microRNA in microarray data. The simplest method is to evaluate the log ratio between two conditions (or the average of ratios when there are replicates) and consider all the genes that differ by more than an arbitrary cut-off value to be differentially expressed. This is not a statistical test, and there is no associated value that can indicate the level of confidence in the designation of genes as differentially or not differentially expressed. It is considered to be unreliable (48) because statistical variability is not taken into account and is susceptible to outliers. More sophisticated statistical methods have been proposed. The classification success is affected by the choice of the method, the number of genes in the gene list, the number of cases (samples)and the noise in the data set. Different methods produce dissimilar gene lists, which can produce dramatically different discrimination performance when trained as gene classifiers. The gene lists produced by the feature selection methods can be grouped broadly according to the manner in which they treat gene variance.
2.3.1 t-statistic
The simplest statistical method for detecting differential expression is t test. It can be used to compare two conditions when there is replication of samples. With more than two conditions, analysis of variance (ANOVA) can be used. The t-test calculates the observed t-statistic for each gene. The idea is to compare between-group difference and within-group difference and then to calculate the probability value (p-value) of t-statistic for each gene from t-distribution. The output of the analysis is a p-value for each gene. It represents the chance of getting the t-statistic as large as, or larger than the observed one, under the hypothesis of no differential expression (null hypothesis). A small p-value indicates that the hypothesis of no differential expression is not true and the gene is differentially expressed. The t-statistic methods perform relatively poorly when there are high levels of noise in microarray data together with low samples sizes. In this case, the variance estimate can be skewed by the genes which have a low variance. Due to the large numbers of genes present in microarray data sets, there will always be some genes which have a low standard deviation by chance. Thus, these genes will have a large t-statistic and will be falsely predicted to be differentially expressed.
2.3.2 SAM
Several modified t-statistics have been proposed to address this problem. SAM (49)61 is one of the most popular. It performs moderately well except when applied to data with low sample size and to the noisy data sets. SAM uses a moderated t-statistic, whereby a constant is added to the denominator of the t-statistic. The addition of this constant reduces the chance of detecting genes which have a low standard deviation by chance. The constant is estimated from the sum of the global standard error of the genes (50),(51),(52).
2.3.3 Empirical bayes method (Limma)
The empirical bayes method provides a more complex model of the gene variance. The gene standard error is estimated as a representative value of the variance of the genes at the same level of expression as the gene of interest (? ) 65. In training sets with a large number of cases, the empirical bayes method performed comparably with ANOVA. Importantly, unlike most other methods, the empirical bayes t-statistic proved equally robust with low numbers of cases. The Bayesian statistic also provides p-values and has the advantage that it can be expanded to deal with datasets that have more then two classes. Limma provides advanced statistical methods for linear modelling of microarray data and for identifying differentially expressed genes. It fits a linear
2.3 Identification of differentially expressed genes and miRNA
model to the data and uses an empirical Bayes method for assessing differential expres-sion (53). One or two experiment definition matrices need to be specified during the analysis: a design matrix defining the RNA samples and a contrast matrix (optional for simple experiments) defining the comparisons to be performed. When there are more than two conditions in an experiment, a more general concept of relative ex-pression is needed. One approach that can be applied to cDNA microarray data from any experimental design is to use an analysis of variance model (ANOVA) to obtain estimates of the relative expression (VG) for each gene in each sample (54)(55). In the ANOVA model, the expression level of a gene in a given sample is computed relative to the weighted average expression of that gene over all samples in the experiment. The microarray ANOVA model is not based on ratios but it is applied directly to intensity data; the difference between two relative expression values can be interpreted as the mean log ratio for comparing two samples (as logA − logB = log(AB)), where logA and logB are two relative expression values). Alternatively, if each sample is compared with a common reference sample, one can use normalized ratios directly. This is an intuitive but less efficient approach to obtain relative expression values than using the ANOVA estimates. Direct estimates of relative expression can also be obtained from single-color expression assays (56). The set of estimated relative expression values, one for each gene in each RNA sample, is a derived data set that can be subjected to a second level of analysis. There should be one relative expression value for each gene in each independent sample. The distinction between technical replication and biological replication should be kept in mind when interpreting results from the analysis of a derived data. If inference is being made on the basis of biological replicates and there is also technical replication in the experiment, the technical replicates should be averaged to yield a single value for each independent biological unit. The derived data can be analyzed on a gene-by-gene basis using standard ANOVA methods to test for differences among conditions.
2.3.4 ROC
Classifiers built using gene lists from the ROC method outperform all other methods when applied to large datasets. High RCI scores are observed even when only a few of the most highly ranked genes are examined. These high RCI scores are maintained when the number of genes examined is increased. It is possible to obtain p-values using this method (57). ROC, like the t-statistic methods, loses power when the number of samples is reduced. It ranks a gene based on its power to discriminate between the groups given a threshold false positive rate. This means that it ignores the level of expression of the gene in the two groups. Therefore as the training size decreases, the likelihood of a gene with low variance and no biological meaning being a good discriminator by chance increases. ROC is an unsuitable method when the sample size is below 30 (class size of 15).
2.3.5 Rank Product
The Rank Product is a non-parametric method described in (52) and It generates a list of up- or down-regulated genes based on the estimated percentage of false positive predictions (pfp), which is also known as false discovery rate (FDR). The attractiveness of this method is its ability to analyse data sets from different origins (e.g. laboratories) or variable environments. Rank product assumes constant variance across all samples. It compares the product of the ranks of genes in a class with the product of the ranks of genes in the second class. For each gene in the data-set, rank products sorts the genes according to the likelihood of observing their ranked positions on the lists of differentially expressed genes just by chance.
2.4
Clustering
Clustering algorithms are widely used in the analysis of microRNA profiling data. In clinical studies, they are not only used to cluster microRNA into groups of co-regulated miRNA, but also for clustering patients, and thereby defying novel disease entities based on miRNA expression profiles. A reliable and precise classification of tumors is essential for successful diagnosis and treatment of cancer. Current methods for classifying human malignancies rely on a variety of morphological, clinical, and molecular variables. In spite of recent progress, there are still uncertainties in diagnosis. Also, it is likely that the existing classes are heterogeneous and comprise diseases which are molecularly distinct and follow different clinical courses. microRNA microarray datasets have been used to characterize the molecular variations among tumors by monitoring microRNA expression profiles on a genomic scale. This led to more reliable classification of tumors and to the identification of marker miRNA that distinguish among these classes. Eventual clinical implications include an improved ability to understand and predict cancer survival. However, there are three main types of statistical problems associated with tumor classification:
• The identification of new tumor classes using microRNA expression profiles unsupervised learning
• The classification of malignancies into known classes supervised learning
• The identification of marker microRNA that characterize the different tumor classes feature selection
Clustering can answer these problems. It is possible to cluster rows, columns or both. Rows (miRNA) clustering can identify groups of co-regulated miRNA, spatial or temporal expression patterns, reduce redundancy (cf. feature selection) in prediction, and detect experimental artifacts. On the other hand columns clustering allows to identify new classes of biological samples, new tumor classes or new cell types. Moreover, it allows to detect experimental artifacts. In order to perform clustering, a way to measure how similar or dissimilar two objects are is needed. The feature data are
2.4 Clustering
often transformed to an n × n distance or similarity matrix, D = dij, for the n
objects to be clustered. Features correspond to expression levels of different microRNAs and possible classes include tumor types or clinical outcomes (survival, non-survival). Other information such as age and sex may also be important and can be included in the analysis. The most popular distances are Euclidean distance and Manhattan distance. Hamming distance is used for ordinal, binary or categorical data. Clustering procedures can be divided into 3 categories: Hierarchical, Partitioning (means K-medoids/partitioning around medoids) and Model based approaches. The first one is either divisive or agglomerative and provides a hierarchy of clusters, from the smallest, where all objects are in one cluster, through to the largest set, where each observation is in its own cluster. One must often also dene a distance measure between clusters or groups of miRNA and the linkage methods used are single, complete, average, distance between centroids and Ward Linkage. Hierarchical clustering methods produce a tree or dendrogram. The partitions are obtained from cutting the tree at different levels. The tree can be built in two distinct ways bottom-up (agglomerative clustering) or top-down (divisive clustering). Examples of Hierarchical clustering methods are Self-Organizing Tree Algorithm SOTA (58) and DIvisive ANAlysis DIANA (59). Partitioning methods require the specification of the number of clusters. A mechanism for apportioning objects to clusters must be determined, and then data is portioned into a prespecied number K of mutually exclusive and exhaustive groups and iteratively reallocated to clusters until some criterion is met, e.g., minimize within-cluster sums-of-squares. Examples of partitioning methods are k -means and its extension to fuzzy k -means, Partitioning Around Medoids PAM, Self-Organizing Maps SOM and model-based clustering (59). An important feature of partitioning methods consists in satisfying an optimality criterion (approximately), however they need an initial K and long computation time. Hierarchical methods are computationally fast (for agglomerative clustering) but rigid, since they cannot later correct for earlier erroneous decisions. Most methods used in practice are agglomerative hierarchical methods. In large part, this is due to the availability of efficient exact algorithms that implement them. Model based approaches assume that data are ’generated’ from a mixture of K distribution. They try to fit a model to the data and try to get the best fit. A classic example is a mixture of Gaussians (mixture of normals). They take advantage of probability theory and well-defined distributions in statistics. In microar-ray experiments is also useful to detect the presence of outliers. Outlier detection is an important step since they can greatly affect the between-cluster distances. Simple tests for outliers should be identifying observations that are responsible for a disproportionate amount of the within-cluster sum-of-squares. Most features in high dimensional data-sets will be uninformative, examples are unexpressed genes, housekeeping genes, and ’passenger alterations’. Clustering (and classification) has a much higher chance of success if uninformative features are removed. Simple approaches to feature selection are: selecting intrinsically variable genes or requiring a minimum level of expression in a proportion of samples. Clustering can be also employed for quality control purposes. The clusters that are obtain from clustering samples/microRNA should be compared
with different experimental conditions such as batch or production order of the arrays, batch of reagents, microRNA amplification procedure, technician, plate origin of clones, and so on. Any relationships observed should be considered as a potentially serious source of bias.
2.5
Integrated analysis of miRNA and gene expression
miRNAs down-regulate their mRNA targets and this effect has shown to play a key role in different biological processes. miRNA regulatory mechanisms are complex and there is still no high-throughput experimental technique for miRNA target prediction. Although, in the last years several computational methods based on sequence comple-mentarity of the miRNA and the mRNAs have been developed, their predictions are inconsistent and their expected false positive rates are large. Recently, new computa-tional methods based on the joint analysis of miRNA and mRNA expression for the filtering of sequence-based putative targets have been proposed. Nevertheless, their expected false positive rates are still large and predictions of different methods do not match at all. Some of these methods combine both expression data with sequence analysis. The integration of miRNA and mRNA expression data have shown to be a good method for filtering sequence-based putative predictions. The algorithms to develop this integration can be categorized into three groups:• dependence-based methods (Pearson and Spearman correlation and MI) • MLR and regularized least squares (MLR, Lasso, Ridge and Elastic-net)
• Bayesian inference methods (GenMiR, HCtarget and a Bayesian graphicalmethod) Although huge advances have been made in miRNA target prediction, there is still much work to do. Until high-throughput experimental techniques reach the market, computational methods will continue to be of high importance. Combination of ex-pression data with sequence based prediction have shown to be feasible. Although, the number of predicted targets is still high, these methods have marked new future working lines. In this respect, models that combine more heterogeneous experimental data (i.e. TF, protein, time-course data, miRNA transfection effects on mRNA and proteins) could be more reliable on the predicted miRNAmRNA interactions.
2.6
Survival prediction model for cancer prognosis using
gene expression
Cancer survival studies are commonly analyzed using survival-time prediction models for patients prognosis. Survival models consists of two parts: the underlying hazard function, describing how the hazard (risk) changes over time at baseline levels of covariates; and the effect parameters, describing how the hazard varies in response to explanatory covariates. The effect of covariates estimated by any proportional hazards
2.6 Survival prediction model for cancer prognosis using gene expression
model can thus be reported as hazard ratios. The Cox proportional hazards model (60) is the most common survival prediction model for cancer prognosis. Sir David Cox observed that if the proportional hazards assumption holds (or, is assumed to hold) then it is possible to estimate the effect parameter(s) without any consideration of the hazard function. This approach to survival data is called application of the Cox proportional hazards model. Often, demographic and clinical covariates are combined in a Cox model to predict a patients survival in order to improve treatment recommendations (61) (62) (63). Many studies have shown an association between patient survival and gene expression profiles 8-10, thus some recent papers have investigated the use of mi-croarray gene expression data alone or in combination with clinical covariates (64) (65) (66) as an improvement to estimate patient survival risk. Research in gene expression profiling of cancer data has focused on binary class prediction, where patients survival times have been dichotomized to form two classes (64) (67) (68). With this approach, a prediction model is built and used to distinguish between the low-risk and high-risk classes. Dimensionality reduction techniques are often performed prior to applying the Cox model to improve prediction performance. A practical approach is to select a smaller set of relevant genes from the entire gene set as initial step; a dimensionality reduction technique is then applied to the selected gene set (69). Evaluation of the ability of a survival model to predict future data is the most important consideration in the development of prediction model. The Hazard ratios between high- and low-risk groups defined by dichotomized low-risk scores are a common metric to assess the performance of survival prediction models. The KaplanMeier method (70) can be used to estimate survival curves for the two groups from the observed survival times without the assumption of an underlying probability distribution. The method is based on the basic idea that the probability of surviving k or more periods from entering the study is a product of the k observed survival rates for each period
S(k) = p1× p2× p3× . . . × pk
Here, p1 is the proportion surviving the first period, p2 is the proportion surviving
beyond the second period conditional on having survived up to the second period, and so on. The proportion surviving period i having survived up to period i is given by:
pi =
ri− di
ri
Where ri is the number alive at the beginning of the period and di the number
of deaths within the period. Comparison of two or more survival curves can be done using a statistical hypothesis test known as log rank test (71). The null hypothesis of the test is that there is no difference between the population survival curves. The test statistic for two curves is calculated as follows:
χ2= (O1− E1) 2 E1 +(O2− E2) 2 E2
respectively, and E1 and E2 the total numbers of expected events. The total expected
number of events for a group is the sum of the expected number of events at the time of each event. The expected number of events at the time of an event can be calculated as the risk for death at that time multiplied by the number alive in the group. Under the null hypothesis, the risk of death (number of deaths/number alive) can be calculated from the combined data for both groups.