Blackwell Publishing Ltd
Pleistocene evolutionary history of the Clouded Apollo
(Parnassius mnemosyne): genetic signatures of climate cycles
and a ‘time-dependent’ mitochondrial substitution rate
P. G R AT TO N ,* M . K . K O N O P I 5S K I † and V. S B O R D O N I *
*Department of Biology, University of Tor Vergata, Via Cracovia 1, 00133 Roma, Italy, †Institute of Nature Conservation PAS, al.
Mickiewicza 33, 31–120 Kraków, Poland
Abstract
Genetic data are currently providing a large amount of new information on past distribution of species and are contributing to a new vision of Pleistocene ice ages. Nonetheless, an increasing number of studies on the ‘time dependency’ of mutation rates suggest that date assessments for evolutionary events of the Pleistocene might be overestimated. We analysed mitochondrial (mt) DNA (COI) sequence variation in 225 Parnassius mnemosyne individuals
sampled across central and eastern Europe in order to assess (i) the existence of genetic signatures of Pleistocene climate shifts; and (ii) the timescale of demographic and evolutionary events. Our analyses reveal a phylogeographical pattern markedly influenced by the Pleis-tocene/Holocene climate shifts. Eastern Alpine and Balkan populations display compara-tively high mtDNA diversity, suggesting multiple glacial refugia. On the other hand, three widely distributed and spatially segregated lineages occupy most of northern and eastern Europe, indicating postglacial recolonization from different refugial areas. We show that a conventional ‘phylogenetic’ substitution rate cannot account for the present distribution of genetic variation in this species, and we combine phylogeographical pattern and palaeoeco-logical information in order to determine a suitable intraspecific rate through a Bayesian coalescent approach. We argue that our calibrated ‘time-dependent’ rate (0.096 substitutions/ million years), offers the most convincing time frame for the evolutionary events inferred from sequence data. When scaled by the new rate, estimates of divergence between Balkan and Alpine lineages point to c. 19 000 years before present (last glacial maximum), and parameters
of demographic expansion for northern lineages are consistent with postglacial warming (5–11 000 years before present).
Keywords: Bayesian coalescent analyses, Lepidoptera, mtDNA, phylogeography, Pleistocene,
substitution rates
Received 7 February 2008; accepted 29 May 2008
Introduction
According to a widely recognized paradigm, temperate-adapted species, presently distributed across most of Europe, were able to persist through cold/arid stages of the Pleis-tocene within a few sheltered refugia, where suitable habitat conditions were maintained (Hewitt 2000; Schmitt et al. 2007). The geographical distribution of genetic variation within species depends on (i) how organisms responded
to cycles of habitat expansion and contraction associated with the glacial cycles; (ii) the number, size and location of refugia; (iii) the connectedness among populations; and (iv) dispersal distance and the rate of recolonization (Hewitt 2004). Accurate understanding of the impact of glacial episodes provides insights on evolutionary processes such as speciation (Santucci et al. 1998; Hewitt 2004), and may offer essential data on the genetic and ecological framework of current threats to biodiversity (Schmitt & Hewitt 2004).
Insects, and butterflies in particular, are highly sensitive to environmental change, as a result of their specialized ecology and coarse-grained perception of habitats. Moreover, Correspondence: Paolo Gratton, Fax: +39 06 7259 5965; E-mail:
butterflies are among those groups of organisms whose distribution has been studied the most across time, so that an extensive and detailed amount of data is available (Parmesan et al. 1999; Kudrna 2002). For this reason, they are particularly suited to serve as indicators of ecosystem response to climate variation (Parmesan et al. 1999; Araujo & Luoto 2007). On one hand, knowledge about past effects of habitat change may provide information on future tendencies (DeChaine & Martin 2005). On the other hand, phylogeographical patterns and demographic trends may be associated, through the relationship existing among genetic diversity, adaptation of gene pools to local conditions and demographic stability (Schmitt & Hewitt 2004). Despite its high potential relevance, the phylogeography of European butterflies in relation to the effects of Pleistocene ice ages is still not thoroughly known. With a few very recent exceptions (Wahlberg & Saccheri 2007), most past research relied on allozyme data (Cassel & Tammaru 2003; Habel et al. 2005; Schmitt et al. 2006, 2005; Schmitt 2007), which, though they may enlighten genetic diversity and geographical structure of populations, generally lack the power to provide infor-mation on past demographic history and the timescale of evolutionary phenomena.
The analysis of DNA sequences allows one to estimate parameters of demographic and evolutionary models, including mutation rates and divergence times of genetic lineages and populations. Accurate estimation of the timing of evolutionary events can be important for understanding those factors that influenced Pleistocene population dynamics (Shapiro et al. 2004). However, translating estimates of model parameters into an absolute timescale implies that reliable substitution rates can be applied. Studies of Pleistocene-related population dynamics have often relied on sub-stitution rates obtained from comparisons between species (De Chaine & Martin 2004; Deffontaine et al. 2005; Kotlík et al. 2006; Ursenbacher et al. 2006). Yet, several findings suggest that substitution rates estimated from within-population and within-species data tend to be much higher than those meas-ured from between-species divergence (Parsons et al. 1997; Sigurðardottir et al. 2000; Troy et al. 2001; Lambert et al. 2002). Ho et al. (2005) argued that, when recent (< 1–2 Ma) events are used to calibrate the molecular clock, an inverse relation-ship can be observed between the age of calibration and the estimated substitution rate. These authors referred to this relationship as a ‘time dependency’ of mutation rates (see also Wayne et al. 1991; Garcia-Moreno 2004; Ho & Larson 2006; Pulquério & Nichols 2006). The biological causes of this effect are still partly unexplained (Ho et al. 2005, 2007b). Nonetheless, if this hypothesis holds [as recently reasserted by Ho et al. (2007a, b), though disputed by Emerson (2007) and Bandelt (2008)], the extrapolation of molecular rates across evolutionary timescales may have led to a systematic overestimation of molecular dating of Pleistocene events (Saarma et al. 2007).
A straightforward method to obtain a substitution rate from individuals within the species/population of interest is to use dated ancient sequences (Saarma et al. 2007). This is, of course, only possible when well preserved subfossils are available, which can very hardly be the case when dealing with insects. Without a reliable fossil record, genealogies can be calibrated by introducing hypotheses drawn from palaeo-ecological or historical evidence and geographical distri-bution of lineages (Waters et al. 2007).
This paper presents an analysis of sequence variation in a 931 bp segment of the mitochondrial genome of 225 individ-uals of the Papilionid butterfly Parnassius. mnemosyne (Linnaeus 1758), sampled across its central/eastern European range.
P. mnemosyne is a Centroasian-European Papilionid
but-terfly. In continental Europe, the species occurs in a varied set of ecotonal wooded habitats (meadows and forest edges). The larval food plants are different species of Corydalis (Fumariaceae), which are generally adapted to moist, fertile soils and mostly grow at forest margins or under tree canopies (Descimon & Napolitano 1993; Konvicka & Kuras 1999; Bergström 2005; Kuusemets et al. 2005).
The first aim of this study is to assess the phylogeo-graphical structure of the species and the existence of traces of past demographic events consistent with cycles of range contraction and expansion associated with Pleistocene climate shifts. Subsequent analyses are then devoted to estab-lish a coherent timescale for demographic and evolutionary events inferred from mtDNA sequence variation. Our phylo-geographical analyses are compared with geological and palaeoecological evidence in order to provide an internal calibration of the molecular clock, which is used to estimate the rate of molecular evolution of analysed sequences. Esti-mates and credibility intervals of demographic and evolu-tionary parameters are obtained within a coalescent-based Bayesian framework.
Materials and methods
Sampling and molecular techniques
The present study is part of a wider project covering the whole range of Parnassius mnemosyne and including over 400 individual samples. The central-eastern European range of the species has been extensively sampled, with 225 indi-viduals analysed from 92 locations (Fig. 1c, Appendix I). Most specimens were obtained from private or museum collec-tions, while a minor fraction of the Italian and Polish samples were collected by the authors (authorization by Italian Ministry of Environment DPN/2D/2005/21020 and Polish Ministry of Environment DOPogiz-4200/I-05/9168/05/aj, DOPog-4201-02-40.1/05/aj, DOPogiz-4200/I-01/1618/06/ aj). In order to avoid possible errors from incorrect specimen labelling, samples from overlapping geographical locations were gathered from multiple collections.
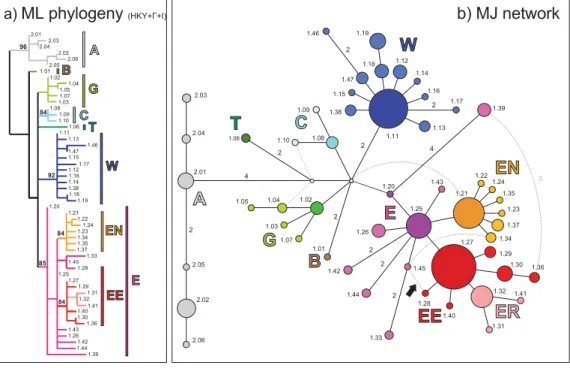
Fig. 1 Reconstructed evolutionary relationships and geographical distribution of the 53 mtDNA haplotypes sampled in central/eastern European populations of Parnassius mnemosyne. Main haplogroups and subclades are highlighted and shown in different colours. (a) Maximum likelihood (ML) phylogeny under HKY +Γ + I model of evolution; numbers above branches represent SHLR support above 80%. (b) Median-Joining Network. Ancestor-descendant relationships are evidenced by different colour tones, with inner/ancestor haplotypes shown in darker colours than outer/descendant. Circle size proportional to haplotype frequency; number of nucleotide substitutions indicated along connections, except for single substitution; dashed lines indicate alternative network connections (loops). (c) Geographical distribution. Pie charts show frequency of haplogroups/haplotypes in each geographical samples. White dots indicate sampled localities with divergent haplotypes not discussed in this paper (see text for details). Shaded area corresponds to approximate range of occurrence of P. mnemosyne (dashed areas indicate poorly known range).
Genomic DNA was extracted from a single leg of each individual, and approximately 1000 bp of the mitochon-drial cytochrome oxidase subunit I gene (COI) were ampli-fied and sequenced, under variable conditions already described by Konopi6ski (2008) and Gratton (2006). The computer program sequencher version 4.1 (Applied Bio-systems) was used to check, edit and automatically align sequences.
Phylogenetic analyses
For the purpose of phylogenetic reconstruction, sequences were collapsed into haplotypes using tcs version 1.18 (Clement et al. 2000) and analysed employing a maximum-likelihood (ML) approach. The software modeltest (Posada & Crandall 1998) was used to select the model of evolution and the ML phylogeny was determined by the search algo-rithm implemented in treefinder (Jobb et al. 2004). Statistical support for reconstructed edges was computed in treefinder by applying the Shimodaira–Hasegawa test (Shimodaira & Hasegawa 1999) to all local rearrangements of tree topology around each of the edges (LRSH). Genealogical relationships of central-eastern European COI haplotypes have also been evaluated by the Median-joining (Bandelt
et al. 1999) approach implemented in network version
4.111, with default settings.
Test of demographic equilibrium, selection, and mismatch analysis
Demographic equilibrium in different sets of sequences was tested by calculating FS (Fu 1997) and R2 (Ramos-Onsins & Rozas 2002) statistics, which have been shown to be the most powerful tests of population expansions (Ramos-Onsins & Rozas 2002). arlequin version 3.0 (Excoffier et al. 2005) and dnasp version 4.0 (Rozas et al. 2003) were employed to compute FS and R2, respectively, and test their statistical significance by generating random samples (10 000 repli-cates) under the null hypothesis of selective neutrality and constant population size using coalescent algorithms (both modified from Hudson 1990). P-values for the two statistics were obtained as the proportion of random values smaller than or equal to the observed values.
Expected mismatch distribution and parameter of sudden expansion τ = 2μt were calculated using arlequin version 3.0 by a generalized least-square approach (Schneider & Excoffier 1999), under both models of pure demographic expansion and spatial expansion (Ray et al. 2003; Excoffier 2004). The probability of the data according to the given model has been assessed by goodness-of-fit test implemented in arlequin version 3.0. Parameter confidence limits were calculated using the same software package through a par-ametric bootstrap calculating simulated parameter values for 1000 random samples.
Evidences of selection independent of demographic trends were evaluated using the McDonald–Kreitman test (McDonald & Kreitman 1991) as implemented in dnasp ver-sion 4.0 (Rozas et al. 2003). The test is based on comparison of synonymous/nonsynonymous substitutions ratio within lineages and among fixed differences between lineages. The analysis was performed on all pairs of reciprocally mono-phyletic lineages identified in our data set. In order to carry out the McDonald–Kreitman test on the whole data set, 47 sequences (16 haplotypes, GenBank Accession numbers: EU092983–EU092996, EU093015, EU093017) belonging to a highly divergent lineage of P. mnemosyne occurring in southwestern Europe (Gratton 2006) were employed as an outgroup.
Bayesian estimation of time to most recent common ancestor(s) and demographic reconstruction
We estimated divergence times among sets of sequences and their associated credibility intervals by a Bayesian coalescent approach implemented in beast version 1.4.6 (Drummond & Rambaut 2007). Markov chain Monte Carlo (MCMC) simulations were run under the HKY +Γ + I model of evolu-tion, selected by modeltest analyses. A relaxed uncorrelated lognormal molecular clock model (Drummond et al. 2006) was firstly applied, in order to appraise the clock-like beha-viour of the data. However, since sampled marginal posterior probability distribution of both standard deviation and coefficient of variation of substitution rates among tree branches abutted against 0 (not shown), a simpler strict clock model was used in subsequent analyses. All simulations were run for 20 million generations, sampling every 2000. Results of four independent runs were eventually loaded and com-bined in tracer version 1.4 (Drummond & Rambaut 2007) to check for their convergence, determine burn-in, and assess effective sample size of relevant parameters.
Since evidences of population expansions were provided by FS and R2 tests, a Bayesian Skyline Plot (BSP: Drummond
et al. 2005) model was firstly applied, in order to explore the
demographic information contained in the data. In fact, as the BSP prior allows for multiple changes in population size, it may be expected to represent the demographic history of populations exposed to dramatic environmental changes such as those occurred in Europe through Pleistocene and Holocene. Moreover, BSP coalescent analysis provides estimates of population size through time, which can in turn allow for evaluation of demographic trends. A second analysis was run under a simple constant-size coalescent model, and relative fit of different demographic models to the data was determined by calculating approximated Bayes factors via estimation of marginal likelihoods from the tree likelihood trace, using the algorithm implemented in tracer version 1.4 (Newton & Raftery 1994; Suchard et al. 2001).
Calibration of molecular clock
We chose to calibrate our temporal analysis by introducing in our beast analysis a prior hypothesis on the coalescence time of a given sequence set, based on geological and palaeo-ecological evidences, as well as on results from our phy-logenetic analyses. A calibration point was provided as a narrow uniform prior on the time to Most Recent Common Ancestor (tMRCA) of a well defined phylogeographical unit, whose monophyly was enforced in the analysis (see Results section). An uninformative uniform prior (0–100) was assigned to the substitution rate parameter.
Estimation of population split parameters
A Bayesian coalescent method was applied to estimate parameters of the isolation with migration (IM) model of population divergence (Nielsen & Wakeley 2001; Hey & Nielsen 2004). The model assumes that an ancestral population splits into two descendant populations with gene flow possibly continuing between the diverging populations. Since evidences of population expansion were provided by FS and R2 tests, a divergence model allowing for independent changes in population sizes (Hey 2005) was applied.
We used the im program (Hey & Nielsen 2004) to run MCMC simulations, assuming the HKY model of sequence evolution. The method estimates posterior probability distributions for demographic parameters including diver-gence time (t), two-directional gene flow rates and effective population sizes of current and ancestral populations. Uni-form prior distributions of parameter ranges were empiri-cally determined to ensure that the posterior distributions fell completely within the prior distributions (Won et al. 2005). The peaks of the posterior distributions were thus taken as maximum likelihood estimates of the parameters (Nielsen & Wakeley 2001; Won & Hey 2005). Marginal posterior pro-bability histograms of parameter estimates were scaled by the median evolutionary rate obtained in the previous analy-sis. Seven independent runs with the same prior distributions were carried out, each of them run for 10 000 000 generations and preceded by a burn-in period of 1 000 000 generations. Results were then combined by summing up marginal post-erior distributions of the parameters.
In order to avoid any arbitrary definition of the popula-tions whose divergence parameters were to be estimated, population boundaries were defined by the Spatial Analysis of Molecular Variance (SAMoVa) implemented in the pro-gram samova version 1.0 (Dupanloup et al. 2002). This is an approach to define groups of populations that are geograph-ically homogeneous and maximally differentiated from each other. As a by-product, it also leads to the identification of genetic barriers between these groups. The method is based on a simulated annealing procedure that aims at
maximizing the proportion of total genetic variance due to differences between groups of populations.
Results
A complete alignment of 931 bp of the COI gene was obtained for all of the 225 analysed individuals. This fragment corres-ponds to position 271–1201 of the Drosophila melanogaster COI reference sequence (GenBank Accession NC_001709). The 225 gene copies yielded 53 unique haplotypes, whose sequences have been submitted to the NCBI GenBank nucleotide database (Appendix I).
Maximum likelihood phylogeny and network analysis HKY +Γ + I (Hasegawa et al. 1985) was selected as the preferred model of evolution by both hierarchical Likelihood Ratio test and Akaike Information Criterion (Ti/Tv = 22.75, α = 1.32; proportion of invariants = 0.86). Figure 1(a) shows the maximum likelihood phylogeny of the 53 central and eastern European Parnassius mnemosyne haplotypes, rooted at midpoint. Though only a few of the nodes receive support over a 95% threshold, all clades display a well defined geo-graphical distribution (Fig. 1c), thus indirectly corroborating the phylogeographical relevance of the inferred topology. The most divergent monophyletic clade (A, shown in grey in Fig. 1) is geographically restricted to the southern slopes of Eastern Alps. Two haplotypes are not closely related to any other and were regarded as independent lineages B (brown) and T (dark green), carried by southern Austrian and southern Greek samples, respectively. Haplogroup G (light green) includes sequences from Greece and neigh-bouring Republic of Macedonia, and haplogroup C (cyan) contains three haplotypes found in a few eastern Alpine samples from Austria, Slovenia and Italy. Sequences sam-pled outside the Alpine region and the Hellenic Peninsula belong to either of two geographically widespread clusters, whose distributions barely overlap. Haplogroup W (blue) characterizes the Central European samples, being found in Germany, Austria, Slovenia, Czech Republic, western Slovakia and Hungary, northeastern Italy and the Åland Islands, in the Baltic Sea. All 25 haplotypes found across eastern Europe, from Bulgaria and Croatia up to Finland and the Ural mountains, are included in the large lineage E (purple + orange + red + pink in Fig. 1). Haplotypes sam-pled north and east of the Carpathian region form two sub-clades: EN (orange), comprising most sequences from the Baltic region, and occurring also in Hungary and northern Russia, and EE (red + pink), which is distributed through eastern Europe from Hungary to the Ural and Caucasus ranges.
The Median-Joining network (Fig. 1b) displays a phylo-genetic structure highly consistent with the ML tree. When network loops (dashed connections) are resolved in
accordance with ML topology, the resulting genealogy also fits criteria based on frequency, topology and geography suggested by Pfenninger & Posada (2002). The only remark-able exception concerns a network loop involving haplotype 1.28 (black arrow in Fig. 1b), which was sampled in a single Ukrainian individual. In this ambiguous case, we preferred the link of this rare haplotype to the most frequent haplo-type found in the same area (Pfenninger & Posada 2002), despite the topology indicated by the ML tree. Haplotype 1.28 was therefore included within haplogroup EE in all subsequent analyses. Since 1.28 occurs in a single copy, this choice is unlikely to have had a major effect on our results. Within lineage E, two haplotypes, namely 1.20 (found in a single Bosnian location) and 1.25 (widely distributed across the Balkan Peninsula and the Pannonian/western Car-pathian region), occupy a basal position and are crowned by some rare descendant haplotypes and the two star-like haplogroups EN and EE. Within group EE, a separate sub-clade (ER, pink) can be distinguished, which is exclusive to Russian samples.
Test of demographic equilibrium, selection, and mismatch analysis
The null hypothesis of constant population size is rejected for northern lineages W, EN, EE and for the eastern European lineage E as a whole, as all of them exhibit highly significant
FS values and significant (or marginally nonsignificant)
R2 values (Table 1). Signal of past demographic expansion (FS= –25.4, P < 0.001; R2= 0.045, P = 0.066) is also detected when all sequences are pooled together. Haplogroups res-tricted to the eastern Alps, A and C, do not show significant
FS and R2 values. Mismatch distribution of haplogroups showing significant FS values was examined according to both a pure demographic expansion and a spatial expansion model (Table 1), and in both cases goodness of fit tests did not show significant deviations from expected distributions. Results for the parameter τ, which is proportional to the time elapsed since sudden expansion took place, are not substan-tially different under the two models: the Northeastern haplogroups EN and EE show the lowest estimated values (from 0.71 to 0.83), while haplogroup W exhibits a slightly higher value (τ = 1.24).
No significant deviation from selective neutrality is detected by the McDonald–Kreitman test (Fisher test P-values range from 1.00 to 0.12). In fact, only nine nonsynonymous substitutions can be scored in the whole data set, and none of them is fixed between any pair of reciprocal monophyletic lineages. Therefore, our sequences probably lack adequate information to assess the effects of selective pressure. Bayesian estimation of time to most recent common ancestors and demographic history
The eastern Baltic area (northern Poland, Lithuania, Estonia, northwestern Russia and Finland) had been covered by the Scandinavian ice sheet until 14 500–12 000 years BP (Rinterknecht et al. 2006) and no significant deposit of arboreal pollen in this region is older than 12 000 years BP (Huntley & Birks 1983). Colonization by P. mnemosyne is very unlikely to have occurred before the appearance of pioneer tree genera such as Alnus, with which the species is often presently associated (Kuusemets et al. 2005). The most ancient records of Alnus pollen from the Baltic region Table 1 Results of FS and R-tests of demographic equilibrium and mismatch analysis
Haplogroup A C G W EN EE E All seqs.
Sample size 19 5 8 54 30 74 136 225 No. of haplotypes 6 3 5 12 7 8 25 53 Fu’s FS test FS –0.313 –0.829 –2.169 –6.791 –4.916 –4.913 –15.719 –25.422 P-value 0.448 0.113 0.013 0.002 0.000 0.006 0.000 0.000 R2 test R2 0.198 0.245 0.138 0.049 0.075 0.055 0.046 0.045 P-value 0.981 0.705 0.190 0.008 0.053 0.042 0.036 0.066 Mismatch analysis Pure demographic expansion Estimated τ — — 1.465 1.244 0.711 0.820 1.996 5.500 τ 5% — — 0.000 0.852 0.227 0.562 1.047 2.336 τ 95% — — 2.805 1.746 1.258 1.209 2.802 9.066 Model P-value — — 0.325 0.895 0.213 0.178 0.677 0.925 Spatial expansion Estimated τ — — 1.464 1.242 0.709 0.833 1.883 2.300 τ 5% — — 0.618 0.628 0.382 0.472 0.727 0.917 τ 95% — — 2.838 1.652 1.358 1.172 2.576 6.741 Model P-value — — 0.220 0.797 0.068 0.071 0.666 0.632
have been dated back to about 11 000 years BP (Huntley & Birks 1983). Virtually all sequences sampled in the region belong to lineage EN, which is represented elsewhere only in Central Hungary, where only the basal haplotype 1.21 occurs. This provides evidence to hypothesize that the mitochondrial diversity today encountered in the Baltic area arose in loco after postglacial colonization. This assumption was introduced in the analysis in the form of a narrow uniform prior (10–11 000 years BP) on the tMRCA of Baltic sequences belonging to lineage EN, whose monophyly was enforced. Different MCMC simulations were run both with and without the inclusion of the two Hungarian sequences belonging to lineage EN in the monophyletic clade. This procedure was adopted to reflect the two possible scenarios of secondary contact and colonization taking place from the Pannonian-Carpathian region by individuals carrying haplotypes belonging to the pre-existing lineage EN. How-ever, since the results under the two hypotheses were very similar, we chose to discuss only those obtained under the second scenario, which seems more biogeographically realistic.
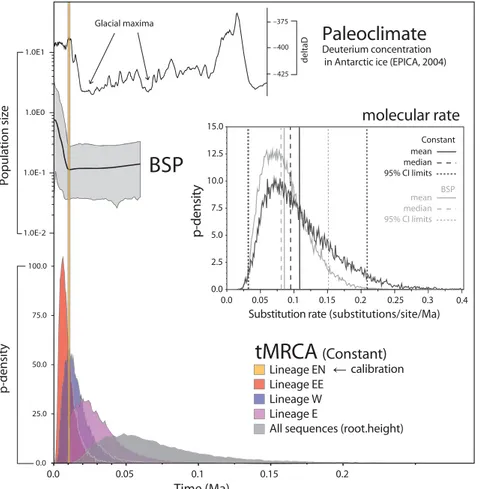
Reconstruction of the Bayesian Skyline Plot (BSP, Fig. 2) shows small and nearly stable population size in the first stages, followed by very strong demographic expansion starting c. 10 000 years BP. Nonetheless, credibility intervals
of pre-expansion and final population size are partially overlapping. Indeed, the Bayes Factors analysis significantly supports the constant-size tree prior (log10 BF = 5.468), indicating that our sequence data are better analysed under this simpler model, whose results are therefore discussed in the following sections. Estimated posterior distributions of relevant parameters, however, are very similar under both models (Fig. 2, Table 2), thus suggesting low sensitivity of our estimates to the coalescent tree prior.
Our coalescent analyses returned a bell-shaped marginal posterior probability distribution for the molecular evolu-tion rate parameter (Fig. 2), with a median value of 0.096 substitutions per site per lineage per million years (mean 0.107), and equally tailed 95% Highest Posterior Density (HPD) spanning from 0.029 to 0.210.
Estimates of the time to Most Recent Common Ancestor (tMRCA) and complete marginal posterior probability dis-tributions are presented in Table 2 and Fig. 2. The highest probability for the tMRCAs of clusters EE and W are close to the enforced interval for lineage EN, indicating close-in-time start of diversification within northern lineages. Our results also indicate that the establishment of the whole eastern lineage (E) dates back to c. 30 000 years BP and the most recent common ancestor of all analysed sequences back to about 60–70 000 years BP.
Fig. 2Bayesian reconstruction of Parnassius
mnemosyne mtDNA population history in
central and eastern Europe. Marginal post-erior probability distributions of the time to Most Recent Common Ancestor (tMRCA) of some mtDNA lineages and of substitution rate (clock.rate, under both a Constant size and Bayesian Skyline Plot (BSP) tree prior) are shown, along with reconstructed Bayesian Skyline Plot (BSP) for the whole population and palaeoclimatic data from the Antarctic Ice Core (EPICA community members 2004). The whole analysis has been calibrated on absolute timescale by assuming a tMRCA of 10–11 ka for the Baltic lineage EN.
Estimates of population split parameters
Lineages E and W display distinct geographical distributions with very narrow overlap (Fig. 1), thus suggesting a marked degree of historical isolation between Balkan/eastern European and central European populations, with limited and likely recent mitochondrial gene flow.
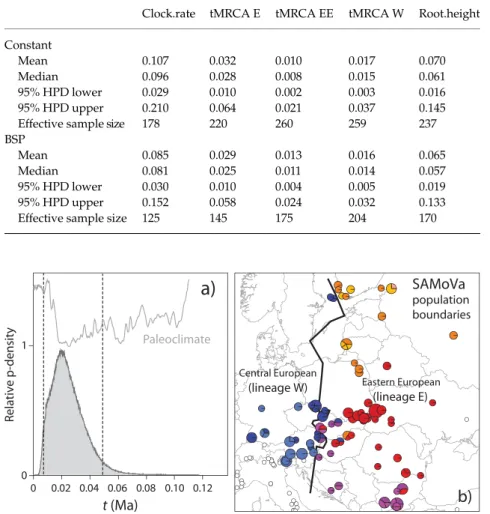
The Bayesian method implemented in the IM program was used in order to evaluate the hypothesis that the iso-lation of popuiso-lations occupying the aforementioned areas and carrying distinctive mtDNA lineages can be related to the occurrence of the arid/cold stage of the LGM (22– 14 000 years BP). SAMoVa analysis was used to identify nonsubjective boundaries of the eastern European and Central European populations (Fig. 3b). The samples thus obtained include 55 and 135 gene copies for the Central European and eastern European populations, respectively. Figure 3(a) shows the estimated marginal posterior pro-bability distribution for the divergence time of the two populations under the isolation with migration (IM) model. The divergence time is quite well resolved, with posterior distribution that has a distinct peak and bounds that fall within the prior distribution. The position of the peak
indicates a population split at 19 000 years BP, with 95% equally tailed Highest Posterior Density (HPD) spanning from 6500 to 49 500 years BP.
Discussion
Genetic signatures of climate shifts
Mitochondrial sequences analysed in this study revealed a strong phylogeographical structure (Fig. 1). Most of the present range of Parnassius mnemosyne is made up of areas characterized by a single lineage. Distinctive haplogroups characterize samples from the Hellenic Peninsula, Central Europe, the Baltic area and the regions east of the Carpathian range. Eastern Alps represent an area of high genetic diversity, where the divergent clade A and lineages B and C are exclusively found, along with widespread lineage W. A relatively small area, running from southern Greece along the Balkan ranges and extending into the Pannonian Plain up to the slopes of the Alps and the Carpathians, includes all main lineages identified in the phylogenetic analyses. Within the highly diverse eastern lineage E, MJ network highlights a similar pattern, as all eight lineages Table 2 Bayesian estimates of substitution rate (clock.rate: substitutions/lineage/Ma) and time to Most Recent Common Ancestor (tMRCA) of some mtDNA haplogroups and of the whole central/eastern European mito-chondrial sample of Parnassius mnemosyne (root.height), under the Constant size and Bayesian Skyline Plot (BSP) tree priors Clock.rate tMRCA E tMRCA EE tMRCA W Root.height
Constant
Mean 0.107 0.032 0.010 0.017 0.070
Median 0.096 0.028 0.008 0.015 0.061
95% HPD lower 0.029 0.010 0.002 0.003 0.016
95% HPD upper 0.210 0.064 0.021 0.037 0.145
Effective sample size 178 220 260 259 237
BSP
Mean 0.085 0.029 0.013 0.016 0.065
Median 0.081 0.025 0.011 0.014 0.057
95% HPD lower 0.030 0.010 0.004 0.005 0.019
95% HPD upper 0.152 0.058 0.024 0.032 0.133
Effective sample size 125 145 175 204 170
Fig. 3 Bayesian coalescent estimate of diver-gence time between central and eastern European mtDNA populations of Parnassius
mnemosyne. (a) Marginal posterior probability
density of parameter t (time from population split) under the IM model. Dashed lines indi-cate 95% equally tailed Highest Probability Density (HPD) limits. Palaeoclimatic curve is shown for comparison (see Fig. 2). (b) Boundary between Central European popu-lations characterized by mtDNA lineages W and E, according to SAMoVa results.
departing from the basal haplotypes can be found within the Balkan/Pannonian area, and only two of them (subclades EN and EE) also occur elsewhere. Balkan Peninsula and the perialpine region appear as areas of high genetic diversity and of strong differentiation among populations, contrasting with the low diversity of the northern and eastern regions, where very large areas are dominated by a few lineages. The observed distribution of mitochondrial diversity is therefore just as expected if the species survived glacial stages within refugia in the Balkan Peninsula and the perialpine region and recently expanded its range to colonize formerly inhospitable areas north and east of the Alps and Carpathians (Hewitt 2000, 2004).
Genetic signatures of recent demographic expansion are evidenced by FS and R2 tests and mismatch analysis of most haplogroups sampled outside the Alpine region. Distinct star-like patterns are also observed in the MJ network of widely distributed ‘northern’ lineages W, EN and EE, sug-gesting demographic expansion associated with spatial expansion.
Rate of molecular evolution and a time frame for demographic and evolutionary history of P. mnemosyne Application of the ‘conventional’ phylogenetic mitochondrial substitution rate of about 0.01/Ma (Brower 1994; DeChaine & Martin 2004; Quek et al. 2004; Ho et al. 2005) to the observed values of the mismatch parameter τ = 2μt would imply strong demographic expansion of northern populations (lineages W, EN and EE) 67–38 000 years BP. Even when the lower 5% credibility limits were considered, our data would place the expansion of lineages W and EE earlier than 46 and 30 000 years BP, respectively, and the expansion of lineage EN earlier than 12 000 years BP. Furthermore, the application of this rate to our reconstructed BSP would signify uninter-rupted demographic growth of the Central/eastern Euro-pean populations of Parnassius mnemosyne through the last 90 000 years, or at least 30 000 years.
Reconciling a phylogeographical and demographic pattern matching the expectations of an ‘expansion from refugia’ model with these dates is indeed very difficult: using the ‘conventional’ mitochondrial rate, we should indeed con-clude that the species was able to expand north and east of the Carpathians well before the LGM and never suffered any negative demographic effect from environmental con-ditions associated with glacial stages. Moreover, a demo-graphic expansion about 40 000 years BP (with less than 5% probability < 12 000 years BP) would be inferred for populations inhabiting the Baltic region (lineage EN), which was glaciated up to 14–12 000 years BP. Therefore, we argue that the use of the ‘conventional’ rate implies significant overestimation of the dates of demographic events, as expected under the ‘time dependency’ hypothesis of Ho et al. (2005). In fact, our Bayesian analysis performed under the
assumption of colonization of the Baltic area 10–11 000 years BP, returned a substitution rate estimate about 10-fold higher (95% CI from 3-fold to 20-fold) than the ‘conventional’ phylogenetic rate.
The only strong assumption under our molecular clock calibration is that the genetic diversity of Baltic sequences belonging to lineage EN arose in loco and does not result from immigration from other regions. Indeed, sequences from the Baltic area bear genetic traces of a founder event followed by demographic expansion, in the form of a unimodal mismatch distribution, star-like network con-figuration and significant negative value of the FS statistic (and nearly significant value of R2). Since present distri-bution of P. mnemosyne indicates that the species only occurs nearby wooded areas, our (conservative) prior of 10–11 000 years BP for the colonization of the Baltic area is based on the presence of significant deposits of arboreal pollen in the area (Huntley & Birks 1983). Nonetheless, even if the absence of an ice sheet were a sufficient condition for the butterfly to thrive, this would only date back the first possible time for colonization to 12–14 000 years BP (Rinterknecht et al. 2006). Moreover, very similar estimates of the evolutionary rate were obtained under both a constant-size model and a model which allows for demographic change (BSP). There-fore, our comparatively high rate is not imputable to the application of a constant population model to sequences sampled from an expanding population (Ho et al. 2007b). Our results place the minimum credibility limit for the COI evolutionary rate at 0.03/Ma, which is at least twice as large as the majority of arthropod phylogenetic mitochon-drial rates found in literature (Knowlton & Weigt 1998; Schubart et al. 1998; Caccone & Sbordoni 2001; Farrell et al. 2001). Therefore, setting aside an unlikely idiosyncratic anomaly of mutation rates in Parnassius, we argue that our findings bring new support to the ‘time dependency’ hypothesis.
Indeed, the mean mutation rate that we have calibrated, relying on assumptions about the colonization of the Baltic area, provides a sensible time frame for all other demographic and evolutionary events inferred from the mtDNA sequence data. When scaled by our median rate of 0.096/Ma, values of τ from mismatch analyses indicate climax of demographic expansion at 7–5000 years BP in the northernmost lineages (W, EE, EN) and 11 000 years BP for the Balkan-based lineage E. Moreover, the calibrated BSP (Fig. 2) shows a dramatic increase in population size starting about 10 000 years BP, which can be straightfor-wardly interpreted as driven by improved environmental conditions of the Holocene.
We also applied our median rate to the analysis of diver-gence between eastern and central European populations. These populations are characterized by different mito-chondrial lineages (see Figs 1 and 3) whose centres of diversity can be approximately located in the Balkan/
Carpathian (lineage E) and northern/eastern perialpine (lineage W) regions. Since palaeontological and genetic evidence demonstrated the existence of temperate LGM refugia in those regions (Kotlík et al. 2006; Stewart & Lister 2001; Willis & van Andel 2004; Sommer & Nadachowski 2006), the most straightforward explanation to the observed phylogeographical pattern is that these populations ori-ginated from separate refugial areas. In fact, our calibrated results (Fig. 3a) indicate that the divergence of the two populations occurred with preponderant probability within the last glaciation, with the maximum likelihood estimate of the split time exactly matching the LGM.
A reconstruction of Pleistocene population history of
P. mnemosyne
Previous phylogeographical analyses showed that mito-chondrial sequences sampled from eastern Alps through northern and eastern Europe belong to a monophyletic clade, and might well specify a distinct evolutionary unit (Gratton 2006).
According to the estimated tMRCA of the whole data set (Fig. 2, Table 2), the origin of all central/eastern European mtDNA lineages of P. mnemosyne may be traced to the first full-glacial stage of the Würm period (peaking c. 65 000 years BP), and almost certainly within the glacial period. The presence of distinctive lineages in the Hellenic Peninsula,
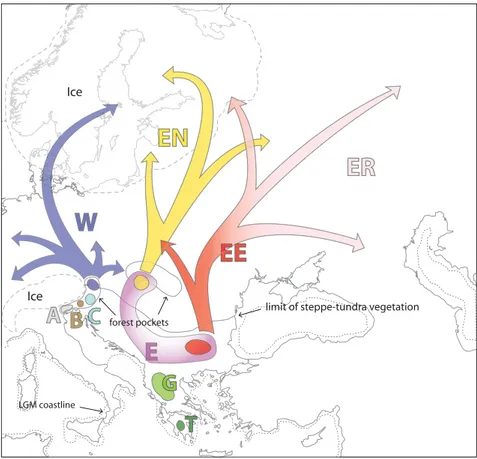
Balkans and eastern Europe, and in the perialpine region (Fig. 1) is suggestive of later fragmentation (Fig. 4). Actually, the estimate of divergence time between populations carrying mitochondrial lineages W and E (Fig. 3) supports isolation in different refugia during the LGM 22 000–14 000 years ago.
The parapatric distribution of Alpine lineages A, B, C and W might indicate multiple eastern Alpine refugia (Fig. 4). The Balkan area is likely to have harboured a quite large population even during most arid and cold stages, or to have started a northward expansion close in time with the earliest climate warming, as indicated by the compar-atively deep coalescence of sequences belonging to lineage E (Table 2, Fig. 2). No neat sorting of mitochondrial lineages is observed between northern and southern regions of the Balkan/Pannonian area (though only ancestral haplotypes are shared), and relatively high genetic diversity is found in both Bulgarian and Hungarian/Slovakian samples, thus suggesting that habitats near the Balkan and Carpathian ranges may have been connected in a sort of ‘meta-refugium’. Since our results indicate that the common ancestor of all lineages lived during earlier Würm, and genetic isolation among secondary refugial areas occurred at the onset of the LGM, then a certain degree of connectedness must have existed among suitable habitats from Greece to the Alps between the two coldest stages (60–22 000 years BP), allowing the ancestors of present lineages to spread across the area. Fig. 4 Proposed location of LGM refugia and main recolonization routes of central/ eastern European Parnassius mnemosyne mtDNA lineages. Palaeoenvironmental data from Adams & Faure (1997).
These results suggest that, through interstadial periods,
P. mnemosyne survived in widespread, though maybe
scattered habitats, which eventually lost their genetic connectivity.
All regions situated north of the Alps and the Carpathians are occupied by one of the three lineages W, EN and EE, with very poor admixing among them (Fig. 1). The occur-rence of just a single lineage in most areas where no suit-able habitat was availsuit-able during LGM (Figs 1c and 4), implies significant founder-effect during postglacial expan-sions. Haplogroups found in northern Europe are, in fact, also present in potential refugial areas in the perialpine and Pannonian/Carpathian regions, though they are missing in southern Balkan Peninsula. Our data thus suggest that postglacial colonization of formerly inhospitable areas took place from the northernmost ‘leading edge’ refugia, and was fast enough to significantly reduce mtDNA diversity of recently populated areas, according to the ‘pioneer’ model (Nichols & Hewitt 1994; Ibrahim et al. 1996).
Samples collected in the Pannonian/Carpathian region display a few basal haplotypes included in lineage E and both the ancestral haplotypes of lineages EN and EE (Fig. 1b, c). Since aforementioned literature indicates that this area was inhabited by temperate species during the LGM, our data can be taken as a clear evidence of post-glacial colonization of northeastern Europe by advanced refugia in the Pannonian/Carpathian areas. Such expan-sion possibly followed two separate routes: a western route involving lineage EN and an eastern route for lineage EE (Fig. 4).
Post-glacial expansion of lineage W probably started from nearby the Alps with expansion routes heading north, west and east (Fig. 4). The occurrence of this lineage in the Åland Islands (Finland) is likely a consequence of the colonization through northern Germany and Scandinavia (Björck 1995). Colonization of western and eastern Scandinavia would have therefore occurred from different refugia, according to a pattern already evidenced in several organisms (e.g. Taberlet et al. 1995; Ferris et al. 1998; Jaarola et al. 1999; Jaarola & Searle 2002).
Secondary contact after postglacial expansion is a straight-forward explanation for the limited admixing of lineages W and E observed across a c. 200 km-wide transect in Central Europe (Figs 1c and 3b). The estimated divergence time between the two lineages (19 000 years BP) indicate that this pattern results from recent admixture of those populations whose isolation was driven by the onset of the LGM. Hybrid or secondary contact zones are known to occur in the same area among several different species/subspe-cies or genetic lineages (reviewed in Hewitt 1999, 2004). Though glacial cycles have been regularly invoked as the historical determinants of such contact zones, inferred diver-gence times between different lineages span through the whole extent of the Pleistocene (Schmitt & Seitz 2001;
Seddon et al. 2001; Ursenbacher et al. 2006). Even when accurate molecular analyses have been performed, they reckoned upon conventional phylogenetic rates (Kotlík et al. 2006), so that the importance of the most recent stages may have been underrated. Therefore, though we acknowledge that similar geographical patterns in different species may have been shaped by repeated cycles of climate change (Hewitt 1999; Ursenbacher et al. 2006), we argue that our results highlight the need for accurate calibration of mole-cular rates in order to assess the timing and evolutionary significance of any given phylogeographical patterns. Acknowledgements
The authors are grateful to all people who contributed by providing specimens, and particularly to M. Bollino, S. Davkov, B. Seifert (Museum of Natural History, Goerlitz, Germany), M. Wanat (Wroclaw University, Poland), L. Przybylowicz (Institute of Systematics and Evolution of Animals, Klaków, Poland) and R. Godunko (Museum of Natural History, Lvov, Ukraine). D. Cesaroni, G. Allegrucci, G. Gentile, M. Mattoccia, A. Fabiani, E. Trucchi, M. Suchard, T. Schmitt and an anonymous reviewer provided insightful comments and advice during preparation and revision of the manuscript. This research has been carried out with financial contributions from Ministero dell’Istruzione, Università e Ricerca (PRIN 2005) and Università di Roma ‘Tor Vergata’ to V. Sbordoni and P. Gratton and from the Polish Ministry of Science and Education grant no. 2P04F03628 to M. Konopi6ski.
References
Adams JM, Faure H (1997) Preliminary vegetation maps of the world since the last glacial maximum: an aid to archeological understanding. Journal of Archaeological Science, 24, 623–647. Araujo MB, Luoto M (2007) The importance of biotic
inter-actions for modelling species distributions under climate change. Global Ecology and Biogeography, 16, 743–753. Bandelt HJ (2008) Clock debate: when times are a-changin′: time
dependency of molecular rate estimates: tempest in a teacup.
Heredity, 100, 1–2.
Bandelt HJ, Forster P, Rohl A (1999) Median-joining networks for inferring intraspecific phylogenies. Molecular Biology and
Evolution, 16, 37–48.
Bergström A (2005) Oviposition site preferences of the threatened butterfly Parnassius mnemosyne — implications for conservation.
Journal of Insect Conservation, 9, 21–27.
Björck S (1995) Late Weichselian/Early Preboreal development of the Öresund strait; a key area for northerly mammal immi-gration. In: The earliest settlement of Scandinavia and its relationship to the neighbouring areas (ed. Larsson L), Acta
Archaeologica Lundensia, 8, 123–134.
Brower AVZ (1994) Rapid morphological radiation and conver-gence among races of the butterfly Heliconius erato Inferred from patterns of mitochondrial DNA evolution. Proceedings of
the National Academy of Sciences of the United States of America,
91, 6491–6495.
Caccone A, Sbordoni V (2001) Molecular biogeography of cave life: a study using mitochondrial DNA from bathyscine beetles.
Cassel A, Tammaru T (2003) Allozyme variability in central, periph-eral and isolated populations of the scarce heath (Coenonympha
hero: Lepidoptera, Nymphalidae); implications for conservation. Conservation Genetics, 4, 83–93.
Clement M, Posada D, Crandall KA (2000) PROGRAM NOTE. TCS: a computer program to estimate gene genealogies. Molecular
Ecology, 9, 1657.
DeChaine EG, Martin AP (2004) Historic cycles of expansion and contraction in Parnassius smintheus (Papilionidae) inferred using mitochondrial DNA. Evolution, 58, 113–127.
DeChaine EG, Martin AP (2005) Historical biogeography of two alpine butterflies in the Rocky Mountains: broad-scale concord-ance and local-scale discordconcord-ance. Journal of Biogeography, 32, 1943–1956.
Deffontaine V, Libois R, Kotlík P et al. (2005) Beyond the Medi-terranean peninsulas: evidence of central European glacial refugia for a temperate forest mammal species, the bank vole (Clethrionomys glareolus). Molecular Ecology, 14, 1727–1739. Descimon H, Napolitano M (1993) Enzyme polymorphism, wing
pattern variability, and geographical isolation in an endan-gered butterfly species. Biological Conservation, 66, 117–123. Drummond AJ, Ho SYW, Phillips MJ, Rambaut A (2006) Relaxed
phylogenetics and dating with confidence. PLoS Biology, 4, e88. Drummond AJ, Rambaut A (2007) BEAST: Bayesian evolutionary
analysis sampling trees. BMC Evolutionary Biology, 7, 214. Drummond AJ, Rambaut A, Shapiro B, Pybus OG (2005) Bayesian
coalescent inference of past population dynamics from molecular sequences. Molecular Biology and Evolution, 22, 1185–1192. Dupanloup I, Schneider S, Excoffier L (2002) A simulated annealing
approach to define the genetic structure of populations. Molecular
Ecology, 11, 2571–2581.
Emerson BC (2007) Alarm bells for the molecular clock? No support for Ho et al.’s model of time-dependent molecular rate estimates.
Systematic Biology, 56, 337–345.
EPICA community members (2004) Eight glacial cycles from an Antarctic ice core. Nature, 429, 623–628.
Excoffier L (2004) Patterns of DNA sequence diversity and genetic structure after a range expansion: lessons from the infinite-island model. Molecular Ecology, 13, 853–864. Excoffier L, Laval G, Schneider S (2005) Arlequin (version 3.0): an
integrated software package for population genetics data analysis. Evolutionary Bioinformatics Online, 1, 47–50. Farrell BD, Sequeira AS, O’Meara BC et al. (2001) The evolution
of agriculture in beetles (Curculionidae: Scolytinae and Platy-podinae). Evolution, 55, 2011–2027.
Ferris C, King RA, Vainola R, Hewitt GM (1998) Chloroplast DNA recognizes three refugial sources of European oaks and suggests independent eastern and western immigrations to Finland.
Heredity, 80, 584–593.
Fu Y-X (1997) Statistical tests of neutrality of mutations against population growth, hitchhiking and background selection.
Genetics, 147, 915–925.
García-Moreno J (2004) Is there a universal mtDNA clock for birds? Journal of Avian Biology, 35, 465–468.
Gratton P (2006) Phylogeography and Conservation Genetics of
Parnassius mnemosyne L., 1758 (Lepidoptera, Papilionidae) Tesi
Di Dottorato. Università degli Studi di Roma ‘Tor Vergata’. Habel JC, Schmitt T, Müller P (2005) The fourth paradigm pattern
of post-glacial range expansion of european terrestrial species: the phylogeography of the Marbled White butterfly (Satyrinae, Lepidoptera). Journal of Biogeography, 32, 1489–1497.
Hasegawa M, Kishino H, Yano T (1985) Dating of the human-ape splitting by a molecular clock of mitochondrial DNA. Journal
of Molecular Evolution, 22, 160–174.
Hewitt GM (1999) Post-glacial re-colonization of European biota. Biological Journal of the Linnean Society, 68, 87–112. Hewitt GM (2000) The genetic legacy of the Quaternary ice ages.
Nature, 405, 907–913.
Hewitt GM (2004) Genetic consequences of climatic oscillations in the Quaternary. Philosophical Transactions of the Royal Society
of London. Series B: Biological Sciences, 359, 183–195.
Hey J (2005) On the number of new world founders: a population genetic portrait of the peopling of the Americas. PLoS Biology, 3, e193.
Hey J, Nielsen R (2004) Multilocus methods for estimating population sizes, migration rates and divergence time, with applications to the DIvergence of Drosophila pseudoobscura and
D. persimilis. Genetics, 167, 747–760.
Ho SYW, Kolokotronis SO, Allaby RG (2007a) Elevated substi-tution rates estimated from ancient DNA sequences. Biology
Letters, 3, 702–705.
Ho SYW, Larson G (2006) Molecular clocks: when times are a-changin′. Trends in Genetics, 22, 79–83.
Ho SYW, Phillips MJ, Cooper A, Drummond AJ (2005) Time dependency of molecular rate estimates and systematic overestimation of recent divergence times. Molecular Biology
and Evolution, 22, 1561–1568.
Ho SYW, Shapiro B, Phillips MJ, Cooper A, Drummond AJ (2007b) Evidence for time dependency of molecular rate estimates.
Systematic Biology, 56, 515–522.
Hudson RR (1990) Gene genealogies and the coalescent process. In: Oxford Surveys in Evolutionary Biology (eds Futuyma DJ, Antonovics JD), pp. 1–44. Oxford University Press, Oxford, UK. Huntley B, Birks HJB (1983) An Atlas of Past and Present Pollen
Maps for Europe: 0–13 000 Years Ago. Cambridge University
Press, Cambridge, UK.
Ibrahim KM, Nichols RA, Hewitt GM (1996) Spatial patterns of genetic variation generated by different forms of dispersal during range expansion. Heredity, 77, 282–291.
Jaarola M, Searle JB (2002) Phylogeography of field voles (Microtus
agrestis) in Eurasia inferred from mitochondrial DNA sequences. Molecular Ecology, 11, 2613–2621.
Jaarola M, Tegelström H, Fredga K (1999) Colonization history in Fennoscandian rodents. Biological Journal of the Linnean Society, 68, 113–127.
Jobb G, von Haeseler A, Strimmer K (2004) TREEFINDER: a power-ful graphical analysis environment for molecular phylogenetics.
BMC Evolutionary Biology, 4, 18.
Knowlton N, Weigt LA (1998) New dates and new rates for diver-gence across the isthmus of panama. Proceedings of the Royal
Society of London, Series B: Biological Sciences, 265, 2257–2263.
Konopi6ski MK (2008) A set of primers conserved in genus Parnas-sius (Lepidoptera, Papilionidae) for amplification and sequencing of 1016 bp fragment of cytochrome oxidase subunit I from museum specimens. Molecular Ecology Resources, 8, 675–677. Konvicka M, Kuras T (1999) Population structure, behaviour and
selection of oviposition sites of an endangered butterfly,
Parnassius mnemosyne, in Litovelské Pomoraví, Czech Republic. Journal of Insect Conservation, 3, 211–223.
Kotlík P, Deffontaine V, Mascheretti S et al. (2006) A northern glacial refugium for bank voles (Clethrionomys glareolus).
Kudrna O (2002) The distribution Atlas of European Butterflies.
Oedippus, 20, 1–342.
Kuusemets V, Meier K, Luig J, Lüvamägi A (2005) Habitat and landscape structure requirements of Clouded Apollo (Parnassius
mnemosyne). In: Studies on Ecology and Conservation of Butterflies in Europe, Vol. 1: General Concepts and Case Studies (eds Kühn E,
Feldmann R, Thomas JA, Settele J), pp. 18–21. PenSoft, Sofia. Lambert DM, Ritchie PA, Millar CD et al. (2002) Rates of evolution
in ancient DNA from Adelie Penguins. Science, 295, 2270–2273. McDonald JH, Kreitman M (1991) Adaptive protein evolution at
the Adh locus in Drosophila. Nature, 351, 652–654.
Newton MA, Raftery AE (1994) Approximate bayesian inference with the weighted likelihood bootstrap. Journal of the Royal
Statistical Society. Series B. (Methodological), 56, 3–48.
Nichols RA, Hewitt GM (1994) The genetic consequences of long distance dispersal during colonization. Heredity, 72, 312–317. Nielsen R, Wakeley J (2001) Distinguishing migration from isolation a markov chain Monte Carlo approach. Genetics, 158, 885–896. Parmesan C, Ryrholm N, Stefanescu C et al. (1999) Poleward shifts in geographical ranges of butterfly species associated with regional warming. Nature, 399, 579–583.
Parsons TJ, Muniec DS, Sullivan K et al. (1997) A high observed substitution rate in the human mitochondrial DNA control region. Nature Genetics, 15, 363–368.
Pfenninger M, Posada D (2002) Phylogeographic history of the land snail Candidula unifasciata (Helicellinae, Stylommatophora): fragmentation, corridor migration, and secondary contact.
Evolution, 56, 1776–1788.
Posada D, Crandall KA (1998) MODELTEST: testing the model of DNA substitution. Bioinformatics, 14, 817–818.
Pulquério MJF, Nichols RA (2006) Dates from the molecular clock: how wrong can we be? Trends in Ecology and Evolution, 22, 180–184.
Quek S-P, Davies SJ, Itino T, Pierce NE (2004) Codiversification in an ant-plant mutualism: stem texture and the evolution of the host use in Crematogaster (Formicidae: Myrmicinae) inhabitants of Macaranga (Euphorbiaceae). Evolution, 58, 554–570. Ramos-Onsins S, Rozas J (2002) Statistical properties of new
neutrality tests against population growth. Molecular Biology
and Evolution, 19, 2092–2100.
Ray N, Currat M, Excoffier L (2003) Intra-deme molecular diversity in spatially expanding populations. Molecular Biology and
Evolu-tion, 20, 76–86.
Rinterknecht VR, Clark PU, Raisbeck GM et al. (2006) The last deglaciation of the southeastern sector of the Scandinavian Ice Sheet. Science, 311, 1449–1452.
Rozas J, Sánchez-Del Barrio JC, Messeguer X, Rozas R (2003) DnaSP, DNA polymorphism analyses by the coalescent and other methods. Bioinformatics, 19, 2496–2497.
Saarma U, Ho SYW, Pybus OG et al. (2007) Mitogenetic structure of brown bears (Ursus arctos L.) in northeastern Europe and a new time frame for the formation of European brown bear lineages. Molecular Ecology, 16, 401–413.
Santucci F, Emerson BC, Hewitt GM (1998) Mitochondrial DNA phylogeography of European hedgehogs. Molecular Ecology, 7, 1163–1172.
Schmitt T (2007) Molecular biogeography of Europe: Pleistocene cycles and postglacial trends. Frontiers in Zoology, 4, 11. Schmitt T, Habel JC, Zimmermann M, Mueller P (2006) Genetic
differentiation of the marbled white butterfly, Melanargia
galathea, accounts for glacial distribution patterns and postglacial
range expansion in southeastern Europe. Molecular Ecology, 15, 1889–1901.
Schmitt T, Hewitt GM (2004) The genetic pattern of population threat and loss: a case study of butterflies. Molecular Ecology, 13, 21–31.
Schmitt T, Rákosy L, Abadjiev S, Müller P (2007) Multiple dif-ferentiation centres of a non-Mediterranean butterfly species in south-eastern Europe. Journal of Biogeography, 34, 939–950. Schmitt T, Röber S, Seitz A (2005) Is the last glaciation the only
relevant event for the present genetic population structure of the meadow brown butterfly Maniola jurtina (Lepidoptera: Nymphalidae)? Biological Journal of the Linnean Society, 85, 419–431.
Schmitt T, Seitz A (2001) Intraspeficic allozymatic differentiation reveals the glacial refugia and the postglacial expansions of European Erebia medusa (Lepidoptera: Nymphalidae). Biological
Journal of the Linnean Society, 74, 429–458.
Schneider S, Excoffier L (1999) Estimation of past demographic parameters from the distribution of pairwise differences when the mutation rates vary among sites application to human mitochondrial DNA. Genetics, 152, 1079–1089.
Schubart CD, Diesel R, Hedges SB (1998) Rapid evolution to terrestrial life in Jamaican crabs. Nature, 393, 363–365. Seddon JM, Santucci F, Reeve NJ, Hewitt GM (2001) DNA
foot-prints of European hedgehogs, Erinaceus europaeus and E. concolor: Pleistocene refugia, postglacial expansion and colonization routes.
Molecular Ecology, 10, 2187–2198.
Shapiro B, Drummond AJ, Rambaut A et al. (2004) Rise and Fall of the Beringian Steppe Bison. Science, 306, 1561–1565. Shimodaira H, Hasegawa M (1999) Multiple comparisons of
log-likelihoods with applications to phylogenetic inference.
Molecular Biology and Evolution, 16, 1114–1116.
Sigurðardottir S, Helgason A, Gulcher JR, Stefansson K, Donnelly P (2000) The mutation rate in the human mtDNA control region.
American Journal of Human Genetics, 66, 1599–1609.
Sommer RS, Nadachowski A (2006) Glacial refugia of mammals in Europe: evidence from fossil records. Mammal Review, 36, 251–265.
Stewart JR, Lister AM (2001) Cryptic northern refugia and the origins of the modern biota. Trends in Ecology and Evolution, 16, 608–613.
Suchard MA, Weiss RE, Sinsheimer JS (2001) Bayesian selection of continuous-time Markov chain evolutionary models.
Molecular Biology and Evolution, 18, 1001–1013.
Taberlet P, Swenson JE, Sandegren F, Bjarvall A (1995) Localization of a contact zone between two highly divergent mitochondrial DNA lineages of the brown bear ursus arctos in Scandinavia.
Conservation Biology, 9, 1255–1261.
Troy CS, MacHugh DE, Bailey JF et al. (2001) Genetic evidence for Near-Eastern origins of European cattle. Nature, 410, 1088– 1091.
Ursenbacher S, Conelli A, Golay P et al. (2006) Phylogeography of the asp viper (Vipera aspis) inferred from mitochondrial DNA sequence data: Evidence for multiple Mediterranean refugial areas. Molecular Phylogenetics and Evolution, 38, 546–552. Wahlberg N, Saccheri I (2007) The effects of Pleistocene
glaci-ations on the Phylogeography of Melitaea cinxia (Lepidoptera: Nymphalidae). European Journal of Entomology, 104, 675–684. Waters JM, Rowe DL, Apte S et al. (2007) Geological dates and
molecular rates: rapid divergence of rivers and their biotas.
Wayne RK, Van Valkenburgh B, O’Brien SJ (1991) Molecular dis-tance and divergence time in carnivores and primates. Molecular
Biology and Evolution, 8, 297–319.
Willis KJ, van Andel TH (2004) Trees or no trees? The environ-ments of central and eastern Europe during the Last Glaciation.
Quaternary Science Reviews, 23, 2369–2387.
Won Y-J, Hey J (2005) Divergence population genetics of chimpan-zees. Molecular Biology and Evolution, 22, 297–307.
Won Y-J, Sivasundar A, Wang Y, Hey J (2005) On the origin of Lake Malawi cichlid species: a population genetic analysis of divergence. Proceedings of the National Academy of Sciences, 102, 6581–6586.
This paper is based on data collected by Paolo Gratton and Maciej Konopinski during their PhD studentships in Rome (‘Tor Vergata’ University) and Krakow (Institute for Nature Conservation), respectively. Paolo Gratton is currently a postdoctoral research associate. He is interested in using molecular data to reveal the historical determinants of the distribution of genetic diversity in butterflies and other organisms. Maciej Konopinski’s research focuses on phylogeography and conservation genetics, with a special commitment in taking advantage of DNA data obtained from museum specimens. Valerio Sbordoni is Professor of Zoology at the Universtiy of Rome ‘Tor Vergata’. His scientific activities span diverse fields of evolutionary and conservation biology and include a special interest on the biogeography of butterflies.
Appendix I Frequency of mtDNA (COI, 931 bp) haplotypes in 92 central/eastern European geographical samples of P. mnemosyne. Geographical coordinates of sampling localities are given in decimal degrees.