1 2 3 4 5 6 7
Analysis of UV ink photoinitiators in packaged food by fast liquid chromatography
8
at sub-ambient temperature coupled to tandem mass spectrometry
9 10 11 12
Héctor Gallart-Ayala, Oscar Núñez, Encarnación Moyano, Maria Teresa Galceran* 13
Department of Analytical Chemistry, University of Barcelona. 14
Diagonal 647, 08028, Barcelona, Spain. 15 16 17 18 19 20 21
* Corresponding author: Maria Teresa Galceran 22
Department of Analytical Chemistry, University of Barcelona, Diagonal 647, 08028, 23 Barcelona, Spain. 24 Phone: +34-93-402-1275 25 Fax: +34-93-402-1233 26 e-mail: [email protected] 27 28 29 30 31 *Manuscript
Abstract
1 2
A fast method of liquid chromatography coupled to tandem mass spectrometry (LC-3
MS/MS) was developed for the analysis of eleven UV ink photoinitiators in packaged 4
food. Chromatographic separation was achieved in a pentafluorophenylpropyl (PFPP) 5
column at 5ºC and acetonitrile:25 mM formic acid-ammonium formate (pH 2.7) in 6
gradient elution. To reduce sample treatment, a QuEChERS (quick, easy, cheap, 7
effective, rugged and safe) method for the extraction and clean-up of UV photoinitiators 8
in packaged foods was evaluated. Triple quadrupole working in H-SRM on Q1 mode 9
was used for both quantitation and confirmation purposes and the most intense and 10
selective transitions were chosen. Quality parameters of the developed QuEChERS LC-11
MS/MS method were established and applied for the analysis of photoinitiators in food 12 packaged at ng kg-1 levels. 13 14 15 16
Keywords: Pentafluorophenyl propyl (PFPP) column, sub-ambient temperature,
17
Tandem mass spectrometry, UV ink photoinitiators, QuEChERS, packaged food. 18
Introduction
1 2
The alert for food contamination by UV ink photoinitiators arose in Europe in 3
November 2005, when the Italian Food Control Authority detected that the 4
photoinitiator 2-isopropylthioxanthone (2-ITX) migrated into baby milk at 5
concentrations ranging from 120 to 300 µg L-1, resulting in the withdrawal from the 6
market of more than 30 million liters of milk [1]. Since then, residues of other 7
photoinitiators such as 2-ethylhexyl-4-dimethylaminobenzoate (EHDAB) or 8
benzophenone (BP) have also been found in packaged food [2,3]. Photoinitiators are 9
used as starters in the polymerization process to cure the ink by UV radiation. UV inks 10
are used to print packaging materials such as multilayer laminates, rigid plastic, 11
cardboard and paper. Although intermediate aluminum layers are commonly used to 12
prevent the migration of ink components into food products, the unintentional transfer 13
of printing ink components from the outer printed surface onto the food contact surface 14
can occur when the printed material is rolled on spools or stacked during storage. 15
Nowadays, these compounds are not regulated by specific EU legislation and maximum 16
residue levels (MRL) in food are not established, but according to the European Food 17
Safety Authority (EFSA) [4] the presence of some of them could be considered 18
undesirable. Up to now, a maximum permitted amount for migration from packaging 19
materials to packaged food has only been established for BP. This Specific Migration 20
Limit (SML) was set at 600 µg L-1 for this photoinitiator [5]. 21
In addition, the EU approved a Commission Regulation 2023/2006 [6], which 22
sets out the rules for good manufacturing practice (GMP) for groups of materials and 23
articles that are intended to come into contact with food. These materials should not 24
transfer their constituents to food in quantities that might endanger human health or 25
bring about unacceptable changes in the composition of foodstuffs. Information about 1
UV ink photoinitiators is also included in this document. 2
So far, in the literature there are few methods for the simultaneous analysis of 3
UV ink photoinitiators. For analytical procedures, gas chromatography coupled to mass 4
spectrometry (GC-MS) is the technique most frequently used to analyze this family of 5
compounds. For instance, 2-ITX has been determined in milk samples [3,12,13], 6
although other UV ink photoinitiators such as EHDAB, BP, 4,4’-bis(diethylamino)-7
benzophenone (DEAB) and 1-hydroxycyclohexyl phenyl ketone (HCPK) have been 8
found in beverages [3,7,8]. Liquid chromatography (LC) with UV detection has been 9
used to study the migration of some photoinitiators from printed food-packaging 10
materials into food simulants or powdered milk [9,10]. In addition, some methods for 11
the analysis of ITX in food and food packaging materials by LC with fluorescence 12
detection have also been reported [11,12]. However, liquid chromatography-tandem 13
mass spectrometry (LC-MS/MS) [2,3,13-18] has become popular for the analysis of UV 14
ink photoinitiators, in order to confirm the identity of the analytes in food samples, 15
following directive 2002/657/EC [19]. In general, most of these LC-MS/MS methods 16
are devoted to the determination of ITX in food samples by reversed-phase liquid 17
chromatography. The chromatographic separation of the two isomers (2-ITX and 4-18
ITX) can only be achieved by more selective columns such as a zirconium column and a 19
pentafluorophenyl propyl (PFPP) column [15,17]. For the other UV ink photoinitiators, 20
a few LC-MS/MS methods have been described using C18 columns [3,18], but with 21
relatively long analysis times (above 20 min). 22
23
Due to the complexity of food matrices and the low concentration levels 24
expected for UV ink photoinitiators in these samples, efficient preconcentration and 25
clean-up procedures are usually needed. Liquid-liquid extraction (LLE) [2,3,9,12,20] 1
using acetonitrile or hexane is commonly used for the analysis of photoinitiators in 2
liquid and fatty food samples. To reduce solvent consumption and improve selectivity, 3
solid phase extraction (SPE) [14,17,18] is used as an alternative to LLE. Other 4
extraction techniques such as pressurized liquid extraction (PLE) [2,11,13] and solid 5
phase microextraction (SPME) [21] have also been used for the analysis of these 6
compounds. Nowadays, the QuEChERS method (Quick, Easy, Cheap, Effective, 7
Rugged and Safe) is a frequent and attractive alternative method for sample preparation
8
in food analysis. The QuEChERS method is particularly popular for determination of 9
polar, middle polar and non-polar pesticide residues in various food matrices [22-27], 10
because of its simplicity, low cost, suitability for high throughput and relatively high 11
efficiency with a minimal number of steps. 12
The aim of this work is to develop a fast liquid chromatography-tandem mass 13
spectrometry method using a QuEChERS extraction method for the simultaneous 14
determination of the most commonly employed UV ink photoinitiators in various 15
packaging packaged foods. 16
17
2. Experimental
18 19
2.1. Materials and chemicals
20 21
The UV ink photoinitators (Figure 1), all of them of analytical grade, ethyl 4-22
dimethylaminobenzoate (EDMAB, 99%, CAS No. 10287-53-3), benzophenone (BP, 23
99%, CAS No. 119-61-9), 4,4’-bis(diethylamino)-benzophenone (DEAB, 99%, CAS 24
No. 90-93-7), 4-benzoylbiphenyl (PBZ, 99%, CAS No. 2128-93-0), 2,4-diethyl-9H-25
thioxanthen-9-one (DETX, 98%, CAS No. 82799-44-8), 1-hydroxycyclohexyl phenyl 1
ketone (HCPK, 99%, CAS No. 947-19-3), 2-hydroxy-2-methylpropiophenone (HMPP, 2
97%, CAS No. 7473-98-5), 2,2-dimethoxy-2-phenylacetophenone (DMPA, 99%, CAS 3
No. 24650-42-8), 2-ethylhexyl 4-(dimethylamino)benzoate (EHDAB, 98%, CAS No. 4
21245-02-3), 2-isopropylthioxanthone (2-ITX, 99.7%, CAS No. 5495-81), 4-5
isopropylthioxanthone (4-ITX, 99.5%, CAS No. 83846-86-0) and 2-isopropyl-D7-6
thioxanthen-9-one (2-ITX-D7 used as internal standard (I.S.), 99.5%, CAS No. 400-880-7
8822) were purchased from Sigma-Aldrich (Steinheim, Germany). Formic acid (98-8
100%) was provided by Merck (Darmstadt, Germany). Anhydrous magnesium sulfate 9
was obtained from Sigma (Steinheim, Germany), sodium chloride from Fluka 10
(Steinheim, Sweden), and propylamino (PSA) bonded silica SPE bulk from Supelco 11
(Gland, Switzerland). OASIS HLB cartridges (60 mg) purchased from Waters 12
(Mildford, MA, US) were used for solid phase extraction. Supelco Visiprep and Supelco 13
Visidry SPE vacuum manifold (Supelco) were used for SPE and solvent evaporation. 14
LC-MS grade methanol (MeOH), acetonitrile (ACN) and water were purchased from 15
Riedel-de Haën (Seelze, Germany). 16
Stock standard solutions of UV ink photoinitiators (1,000 mg kg-1) were 17
individually prepared by weight in methanol and stored at 4ºC. Working solutions were 18
prepared weekly by appropriate dilution in acetonitrile:water (1:1) of the stock standard 19
solution. Mobile phases were filtered using 0.22 μm nylon membrane filters (Whatman, 20
Clifton, NJ, US) and sample extracts were filtered through 0.22 μm pore size Ultrafree-21
MC centrifuge filters (Millipore, Bedford, US). 22
Nitrogen (99.98% pure) supplied by Claind Nitrogen Generator N2 FLO (Lenno, 23
Italy) was used for the API source; and high-purity Argon (Ar1), purchased from Air 24
Liquide (Madrid, Spain), was used as a collision-induced gas (CID gas) in the triple 1 quadrupole instrument. 2 3 2.2. Instrumentation 4 5
A liquid chromatography system (Accela; Thermo Fisher Scientific, San José, 6
CA, US), equipped with a low-pressure quaternary pump, autosampler and column oven, 7
was used. The chromatographic separation was performed in a pentafluorophenyl 8
propyl column, Discovery HS F5 (150 mm x 2.1 mm i.d., 3 µm particle size), from 9
Supelco (Bellefonte, PA, US), using a gradient elution of acetonitrile (solvent A) and 25 10
mM formic acid-ammonium formate buffer at pH 2.7 (solvent B): 50% solvent A for 11
0.5 min followed by a linear gradient up to 80% solvent A in 2.5 min and an isocratic 12
step for 3 minutes at this latter percentage. The flow-rate was 450 µL min-1 and the 13
column temperature was held at 5oC, providing a back-pressure ≤ 350 bar. 14
The liquid chromatography system was coupled with a triple quadrupole mass 15
spectrometer TSQ Quantum Ultra AM (Thermo Fisher Scientific), equipped with 16
electrospray ionization (ESI) source and hyperbolic quadrupoles able to work in 17
enhanced mass resolution mode (mass resolution at 0.1 m/z FWHM, full - with half 18
maximum). Nitrogen (purity > 99.98%) was used as a sheath gas, ion sweep gas and 19
auxiliary gas at flow-rates of 60, 20 and 40 a.u. (arbitrary units), respectively. The ion 20
transfer tube temperature was set at 375oC and electrospray voltage at +4 kV. Selected 21
reaction monitoring (SRM) and highly-selective reaction monitoring (H-SRM) 22
acquisition modes were used. In SRM mode, a mass resolution of 0.7 m/z FWHM on 23
both Q1 and Q3 and a scan width of 0.01 m/z were used. In H-SRM mode, a mass 24
resolution of 0.1 m/z FWHM on Q1 and a scan width of 0.01 m/z were employed, while 25
the other quadrupole operated at low resolution (0.7 m/z FWHM). Argon was used as 1
collision gas at 1.5 mtorr and the optimum collision energy (CE) for each transition 2
monitored (quantifier and qualifier) is shown in Table 1. The chromatogram was 3
segmented into two windows, and two transitions for each compound with a dwell time 4
of 50 ms and 1 µscan were monitored (Table 1). The Xcalibur software version 2.0 5
(Thermo Fisher Scientific, San Jose, CA, US) was used to control the LC/MS system 6
and to process data. 7
To optimize both the ESI source and tandem mass spectrometry working 8
conditions, 1 mg L-1 stock standard methanol solution of each compound was infused at 9
a flow-rate of 3 µL min-1 using the syringe pump integrated in the TSQ instrument and 10
mixed with the mobile phase (450 µL min-1, acetonitrile:formic acid-ammonium 11
formate buffer (70:30, v/v)), by means of a Valco zero dead volume tee piece (Supelco). 12 13 2.3. Sample treatment 14 15 2.3.1. Packaged foods 16
(i) For the QuEChERS method, sub-samples of 2.5 g were weighed into a 50 mL 17
PTFE centrifuge tube (Serviquimia, Barcelona, Spain). 5 µL of 2-ITX-D7 used as a 18
surrogate (100 µg kg-1) and 12 mL of acetonitrile were added. Then the mixture was 19
shaken vigorously for 1 min using a vortex (Stuart, Stone, UK). After this step, 1.5 g of 20
NaCl and 4 g of MgSO4 were added to the extract and then shaken again for 1 min. The 21
extract was then centrifuged at 2,500 rpm for 1 min using a Selecta Centronic centrifuge 22
(Selecta, Barcelona, Spain) and 10 mL of the supernatant were transferred into a 15 mL 23
graduated centrifuge tube that contained 250 mg of PSA (propylamine bonded silica 24
SPE bulk) and 750 mg of MgSO4. The mixture was energetically shaken for 1 min in a 25
vortex and centrifuged again at 3,700 rpm for 1 min. Finally, 8 mL of the supernatant 1
were evaporated to dryness under a nitrogen stream and reconstituted in 500 µL 2
acetonitrile:water (1:1, v/v). Prior to analysis, the extract was filtered through 0.22 µm-3
pore Ultrafree-MC centrifugal filters and transferred into an amber vial to prevent 4
analyte analytes photodegradation. Finally, 10 µL of this extract were injected into the 5
LC-MS/MS system. 6
(ii) An SPE method previously described in our research group for the analysis 7
of ITX was also used [17]. Briefly, an aliquot of 2.5 g of homogenized sample was 8
weighed into a 15 mL centrifuge tube; and 5 µL 2-ITX-D7 (surrogated, 100 µg/kg) and 9
10 mL of acetonitrile were added. The resulting mixture was shaken for 30 min in a 10
rotating shaker (Breda Scientific, Breda, Netherlands) and 1 mL of Carrez reagent 1 and 11
1 mL of Carrez reagent 2 were added. Then, the mixture was centrifuged at 3,500 rpm 12
for 15 min with a Selecta Centronic centrifuge and 10 mL of the supernatant solution 13
were diluted with 25 mL of LC-MS grade water and loaded into an OASIS HLB (60 14
mg) SPE cartridge, which was previously conditioned with 6 mL of methanol and 6 mL 15
of water. The analytes were eluted with 6 mL of acetonitrile. The collected fraction was 16
evaporated to dryness under a nitrogen stream and was treated as described above for 17
the QuEChERS method. 18
A total of 14 packaged food samples, including baby food, fruit juices, water, 19
wine, two blank samples, a pineapple juice sample packaged in a plastic bottle and a 20
baby food sample in a glass bottle obtained from local supermarkets (Barcelona, Spain), 21
were analyzed. 2- and 4-ITX were quantified by isotope dilution using the deuterated 22
standard (2-ITX-D7), while the other photoinitiators were quantified by matrix matched 23
calibration. In order to control possible contaminations method blank samples were 24
analyzed. 25
1
2.3.2. Packaging materials in contact with food
2 3
Packaging materials in contact with food were processed by means of the 4
method described by Sagratini et al. [3]. Briefly, the food carton was opened and the 5
food content processed following the procedures described in Section 2.3.1., while the 6
internal side of the packaging material was washed with LC-MS grade ultrapure water 7
and then wiped. A 10 cm x 5 cm scrap of packaging polycoupled carton was cut into 1 8
cm2 pieces, and then soaked in 50 mL of dichloromethane (amber glass bottle) for 24 h. 9
After this, the organic solvent was collected and evaporated to 1 mL using nitrogen in a 10
Turbovap II Concentration Workstation (Zymark Corporation, Hopkinton, 11
Massachusetts, USA), and finally evaporated to dryness using a Visidry vacuum 12
manifold. The extract was reconstituted with 5 µL of 2-ITX-D7 solution (100 µg kg-1) 13
and 495 µL of methanol:water 1:1 (v/v), filtered through 0.22 µm-pore Ultrafree-MC 14
centrifugal filters and transferred into an amber injection vial. Finally, 10 µL of this 15
extract were injected into the LC-MS/MS system. 16
17
3. Results and Discussion
18 19
3.1. Chromatographic separation
20 21
In this study, the fluorinated (pentafluorophenylpropyl) column (Discovery HS 22
F5) proposed in a previous paper for the chromatographic separation of the two ITX 23
isomers (2-ITX and 4-ITX) [17] was used to separate eleven photoinitiators currently 24
used in food packaging [1], using gradient elution based on a mobile phase of 25
acetonitrile/formic acid-ammonium formate buffer (25 mM, pH 2.7). First, the gradient 1
elution was optimized and the best separation was obtained in 6 min using a linear 2
gradient from 50% ACN to 80% in 2.5 min. However, under these conditions several 3
co-elutions occurred: PBZ/DEAB, EDMAB/DMPA/BP and DETX/EHDAB. To 4
improve the chromatographic separation, the effect of temperature was evaluated 5
between 5ºC and 25ºC. As Figure 2 shows, chromatographic resolution improved 6
significantly when temperature decreased and the best separation, especially for 7
EDMAB/DMPA/BP, was at 5oC (Figure 2C), providing resolutions better than 1.1 for 8
these photoinitiators in less than 7 min, which led to the choice of this temperature for 9
further studies. Temperatures below 5ºC were not evaluated because of the limitation on 10
the minimum temperature allowed by the column oven controller (5ºC). To reduce the 11
analysis time, flow-rate was increased up to 450 µL min-1 (Figure 2D). Under these 12
working conditions, there was good chromatographic separation of all compounds in 13
less than 5 min analysis time, generating a low backpressure (< 350 bar). 14
15
3.2. Liquid chromatography-mass spectrometry
16 17
The liquid chromatographic system was coupled to a triple quadrupole mass 18
spectrometer using an ESI source in positive mode. For most of these compounds, the 19
ESI (positive) full scan MS spectrum showed only the isotopic cluster corresponding to 20
the protonated molecule [M+H]+. However, for some of them (HMPP, HCPK, DMPA, 21
DEAB), ions originated by in-source fragmentation were also observed (Table 1). The 22
in-source fragmentation was especially important for DMPA, whose mass spectrum 23
showed the in-source loss of a methoxy group as base peak, yielding the ion at m/z 225 24
[M-CH3O]+. The significant differences between structures of some of these 25
photoinitiators produced important differences in electrospray responses. Thioxanthone-1
based photoinitiators (2-ITX, 4-ITX and DETX) showed the highest response, followed 2
by the alkyl-amino-based compounds (DEAB, EHDAB and EDMAB) (10 to 20 times 3
lower) and the phenone-based compounds (BP, PBZ and DMPA) (20 to 200 times 4
lower). HMPP and HCPK showed the lowest ionization efficiency. 5
The fragmentation of these compounds under tandem mass spectrometry 6
conditions in the triple quadrupole was studied and the most intense and characteristic 7
transitions were selected for both quantitative and confirmation purposes. For the 8
correct product ion assignment, collision energy curves (5-80 V) were studied. The 9
assignments for both precursor and monitored product ions for each compound are 10
given in Table 1, which also gives the selected transitions and the optimal collision 11
energies. Due to the differences in chemical structure of the compounds studied, it was 12
difficult to select common transitions for the whole family. For ITX isomers (2- and 4-13
ITX) and DETX the most intense product ions corresponded to the loss of the alkyl 14
chains. For ITX the ion originated from the consecutive losses of the alkyl chain and the 15
CHO group (m/z 184) was also observed and selected as qualifier ion. The MS/MS 16
spectrum of both BP and PBZ showed as a base peak the ion at m/z 105 corresponding 17
to [C7H5O]+ due to the -cleavage of the carbonyl group. Another intense product ion 18
corresponding to [C6H5]+ was also observed and selected for confirmation. For 19
compounds such as EHDAB and EDMAB, which contain both an amino and an ester 20
group, the most intense product ions in the MS/MS spectra were generated by the 21
consecutive losses of a methyl group and the alkyl chains of the ester group (m/z 151) 22
and the methyl group together with the α-cleavage of the carbonyl group (m/z 134). The 23
other photoinitiators, HCPK, HMPP and DMPA, showed a different fragmentation 24
pattern because of the different functional groups in their structures. For HMPP, the 25
base peak in the MS/MS spectrum was the product ion at m/z 119, probably due to the 1
consecutive neutral losses of water and olefin (C2H4), and the product ion at m/z 91, 2
corresponding to the tropylium ion often found for aromatic compounds containing a 3
benzyl unit, while HCPK showed the ion at m/z 105 originated by the -cleavage of the 4
carbonyl group, as occurred for BP and PBZ, and the neutral loss of water (m/z 187). 5
Finally, for DMPA two abundant product ions were obtained from the fragmentation of 6
the in-source fragment ion, the characteristic ion at m/z 105 as at m/z 197, due to the 7
loss of a CO group. 8
To evaluate the performance of the fast LC-MS/MS method developed, 9
instrument quality parameters such as limits of quantitation (ILOQ), linearity and run-10
to-run precision at two concentration levels, a low level close to the limit of quantitation 11
(LOQ) and a medium level (HMPP: 3 mg L-1; HCPK: 300 µg L-1; other ink 12
photoinitiators: 50-100 µg L-1), were evaluated using selected reaction monitoring 13
(SRM) acquisition mode. ILOQs (Table 2), based on a signal-to-noise ratio of 10:1, 14
were calculated by the injection of 10 µL of UV ink photoinitiator standard solutions 15
prepared at low concentration levels (background noise was determined manually 16
around the compound retention time). Thioxanthone-based photoinitiators provided the 17
lowest instrument ILOQs (0.06 to 0.09 μg L-1), while compounds based on alkyl-amino 18
groups (DEAB, EHDAB and EDMAB) and PBZ provided ten-times higher values (0.9 19
to 1.5 μg L-1). Whereas phenones and HCPK showed ILOQ values between 15 and 30 20
μg L-1
, HMPP provided the highest ILOQ due to its lower ionization efficiency with 21
ESI. 22
Calibration curves based on the peak area ration (Acompound/Ainternal standard) (2-ITX-23
D7 as I.S.) showed good linearity (correlation coefficient, r2: >0.995). Moreover, 24
linearity was also evaluated using statistical ANOVA analysis. For a 95% of confidence 25
level, p-values obtained (from 0.70 to 0.79) were higher than the confidence probability 1
(0.05) so good linearity was observed in the working range. Run-to-run precision was 2
also determined at two concentration levels (n=5) by LC-MS/MS (RSD < 6.6%). 3
4
3.3. Method performance
5 6
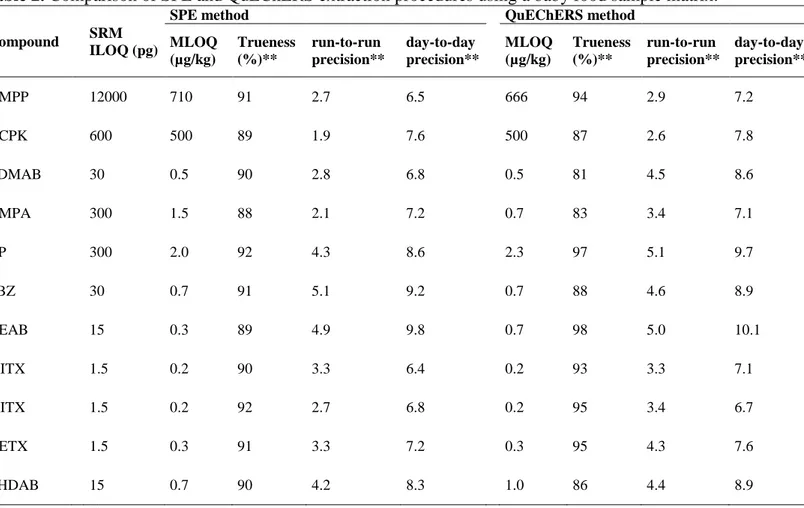
In this study we evaluated the applicability of a QuEChERS procedure for the 7
analysis of UV ink photoinitiators in packaged foods. This method was compared with a 8
SPE one previously applied for the analysis of ITX [17] in terms of sensitivity, accuracy 9
trueness and precision. For these purposes two blank samples (pineapple juice and baby 10
food) were spiked and submitted to both sample treatments. The results obtained for the 11
baby food sample are summarized in Table 2. 12
In general, similar MLQs were obtained using both sample treatments for both 13
matrices providing values down to μg kg-1 or even ng kg-1 for ITX and DETX (5 ng kg -14
1
), with the sole exception of HMPP, which showed the highest MLOQ value (666 μg 15
kg-1). To evaluate the run-to-run precision, six replicates of a blank sample spiked at the 16
concentrations from 0.14 μg L-1 to 800 μg L-1, except for HMPP (2.5 mg L-1), (Table 2) 17
were analyzed using both sample treatments. For day-to-day precision a total of 18 18
replicate determinations on 3 non-consecutive days (six replicates each day) were 19
carried out. Similar relative standard deviations (%RSD) based on concentration were 20
obtained for both SPE and QuEChERS, with values ranging from 1.9 to 5.1% (run-to-21
run) and from 6.5 to 10.1% (day-to-day). Good quantitation results, with a accuracies 22
trueness (defined as % relative error) in the 81-98% range, were achieved. In addition, a 23
statistical paired-sample comparison analysis was performed, based on the quantitation 24
results obtained in both SPE and QuEChERS procedures. For a 95% confidence level, 25
the results were not significantly different (p-value of 0.33). Thus, the QuEChERS 1
method provided similar results in terms of MLOQs, run-to-run and day-to-day 2
precisions, and quantitation to results obtained for SPE, but with the additional 3
advantage of being 12 times faster (per sample). These results mean that this method 4
can be proposed for the fast analysis of UV ink photoinitiators in packaged food. 5
In addition, to improve sensitivity by minimizing interferences and background 6
noise, enhanced mass resolution on precursor ions (H-SRM on Q1) was evaluated. For 7
this purpose two blank samples (baby food and fruit juice) were spiked at a low 8
concentration level (close to the quantitation limit) and analyzed by the QuEChERS 9
method. Table 3 summarizes the peak intensity normalized to that of SRM mode and 10
the signal-to-noise ratio obtained for each compound in pineapple and baby food, using 11
SRM and H-SRM acquisition modes. It can be observed that the intensity of the 12
compounds decreased when mass resolution increased, although a higher signal-to-13
noise ratio (S/N) was obtained due to a significant reduction in the background noise. 14
This obtained MLOQs that were 1.25 to 30 times lower. 15
16
3.4. Application of the method
17 18
To evaluate the applicability of the QuEChERS LC-MS/MS method, 14 19
packaged foods (food commodities and baby foods) from Spanish supermarkets were 20
analyzed. Their packaging materials were also analyzed in order to identify the UV ink 21
photoinitiators used in the printing process, which might then be expected to be found in 22
the packaged foods. Since BP can be used in the manufacture of plastic materials, 23
analysis of blanks is relevant in order to detect contamination during the analytical 24
procedure. In this study, no contamination was observed when analyzing method blank 25
samples. The results obtained showed that all the packaging materials contained 1
between 4 and 8 photoinitiators, among which BP was always present at high 2
concentrations (between 2 and 350 ng cm-2). DMPA and the tertiary amine EHDAB 3
were also found in many of the cartons analyzed, the first one at relatively high 4
concentrations (0.2 – 1 ng cm-2). Other photoinitiators such as EDMAB and DEAB 5
were detected in some of the packaging materials, but at lower concentrations (0.005 – 6
0.6 ng cm-2). The photoinitiator 2-ITX (0.005 – 0.1 ng cm-2) was also detected in all the 7
analyzed samples, while 4-ITX was only found in 3 of the 14 samples, but at 8
concentration levels similar to 2-ITX levels. Finally, PBZ and DETX were found in 9
only a few samples, probably due to less use, while HCPK and HMPP were not detected 10
in any of the cartons analyzed. These results corroborate those reported in the literature 11
[3,10] about the presence of these compounds in packaging materials where BP was 12
found at relatively high concentrations in almost all samples analyzed. 13
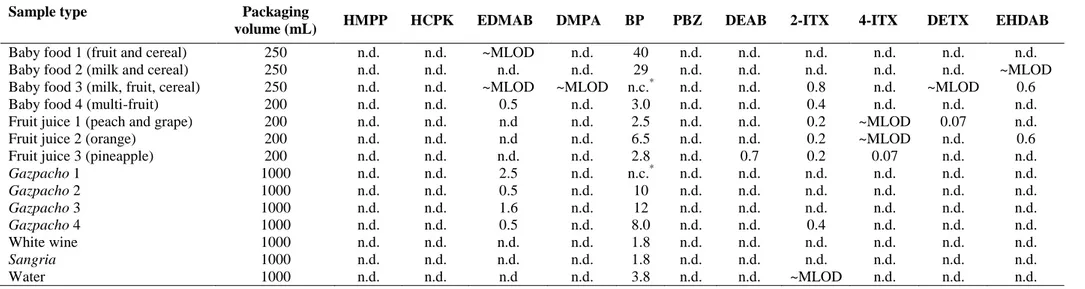
The results obtained in the analysis of the 14 packaged foods are summarized in 14
Table 4. These results showed that only 1-4 of the photoinitiators identified previously 15
in the food packaging materials were detected in the foodstuff, with BP being the most 16
abundant one, with concentrations ranging from 1.8 to 40 µg kg-1. It must be pointed out 17
that in two of the samples (baby food 3 and gazpacho 1) an important deviation (>42%) 18
in the BP ion ratio was observed, which did not allow its confirmation in the samples 19
(Directive 2002/657/EC) [19]. The presence of BP in all the samples could be due, not 20
only to its use as a UV ink photoinitiator, but to its application in the production of 21
polyethylene (PE) coating film [28], which is directly in contact with food. EDMAB 22
and 2-ITX were also found in a relatively high number of samples (10 and 7 samples, 23
respectively), but at lower concentrations (ng kg-1) than BP. HMPP and HCPK were not 24
detected in any sample, as expected from the results obtained in the analysis of the 25
carton materials, while the other photoinitiators such as DETX and EHDAB were 1
detected in just a few samples at low ng kg-1 levels. For example, Figure 3 shows the 2
LC-MS/MS chromatogram obtained for a pineapple juice sample and the corresponding 3
packaging material. Among the seven photoinitiators detected in the corresponding 4
carton material, only four of them, BP, DEAB and both ITX isomers, were detected in 5
the pineapple juice sample. 6
7
In addition, it should be pointed out that the greater sensitivity provided by the 8
H-SRM in Q1 acquisition mode detected and identified some of the analyzed 9
compounds, which could not be detected when low-resolution SRM acquisition mode 10
was used. For instance, 4-ITX in gazpacho 1, DETX in fruit juice 1 and EHDAB in 11
baby food 3 and fruit juice 2 were quantified at low concentration levels by H-SRM. 12
13
Conclusions
14 15
In this study, a fast LC-MS/MS method was developed for the analysis of UV 16
ink photoinitiators in packaged food. Good chromatographic separation, including ITX 17
isomers, was achieved by using a pentafluorophenyl propyl (PFPP) column and 18
operating at low temperature (5ºC). A flow rate of 450 µL min-1 was used to reduce the 19
analysis time below 5.5 min without compromising the chromatographic efficiency. To 20
reduce the sample treatment time, a QuEChERS method is proposed for the extraction 21
and clean-up of UV photoinitiators in packaged foods. 22
The ESI mass spectra of this family of compounds were generally dominated by 23
the [M+H]+, except for DMPA, which showed important in-source fragmentation. For 24
this compound, [M-CH3O]+ was selected as a precursor ion in MS/MS. H-SRM on Q1 25
is proposed as acquisition mode, since an up-to-30-fold improvement in MLOQs was 1
obtained. 2
Several photoinitiators, BP, PBZ, DEAB, 2-ITX, 4-ITX, DETX, EHDAB, 3
DMPA and EDMPA, were detected in the packaging materials, with benzophenone 4
always present and at the highest concentration level. This photoinitiator was also 5
detected in all packaged food samples, while the other compounds were only found in a 6
few samples at low ng kg-1 levels. These results allow us to propose the QuEChERS 7
LC-MS/MS as a simple, fast, robust and reproducible method for the analysis of 8
photoinitiators in packaged food. 9
10
Acknowledgements
11 12
The authors gratefully acknowledge the financial support received from Spain’s 13
Ministry of Science and Technology under the project CTQ2009-09253. 14 15 16 References 17 18
[1] 2005 Chronology of Withdrawal of Nestlè and Other Liquid Milks, document 19
available at www.ibfan.org/art/416-1.doc. 20
[2] A. Gil-Vergara, C. Blasco, Y. Pico, Anal. Bioanal. Chem. 389 (2007) 605. 21
[3] G. Sagratini, G. Caprioli, G. Cristalli, D. Giardina, M. Ricciutelli, R. Volpini, Y. 22
Zuo, S. Vittori, J. Chromatogr. , A 1194 (2008) 213. 23
[4] Opinion of the Scientific Panel of Food Additives, Flavourings, Processing Aids 24
and Materials in contact with Food on a request from the commission related to 25
2-isopropyl thioxanthone (ITX) and 2-ethylhexyl-4-dimethylaminobenzoate 26
(EHDAB) in food contact materials, EFSA J. 293 (2005) 1 (available at 27
http://www.efsa.europa.eu/en/scdocs/scdoc/293.htm). 28
[5] Commission Directive 2002/72/EC relating to plastics materials and articles 29
intended to come into contact with foodstuffs, Off. J. Eur. Commun. L220 30
(2002) 18. 31
[6] Commission Regulation (EC) No 2023/2006 of 22 December 2006 on good 1
manufacturing practice for materilas and articles intended to come into contact 2
with food. Off. J. Eur. Union. 2006; L384/75. 3
[7] G. Allegrone, I. Tamaro, S. Spinardi, G. Grosa, J. Chromatogr. A 1214 (2008) 4
128. 5
[8] A. Sanches-Silva, S. Pastorelli, J.M. Cruz, C. Simoneau, P. Paseiro-Losada, J. 6
Food Sci. 73 (2008) C92. 7
[9] A. Sanches-Silva, S. Pastorelli, J.M. Cruz, C. Simoneau, I. Castanheira, P. 8
Paseiro-Losada, J. Agric. Food Chem. 56 (2008) 2722. 9
[10] A. Sanches-Silva, C. Andre, I. Castanheira, J.M. Cruz, S. Pastorelli, C. 10
Simoneau, P. Paseiro-Losada, J. Agric. Food Chem. 57 (2009) 9523. 11
[11] G. Morlock, W. Schwack, Anal. Bioanal. Chem. 385 (2006) 586. 12
[12] T. Rothenbacher, M. Baumann, D. Fuegel, Food Addit. Contam. 24 (2007) 438. 13
[13] G. Sagratini, J. Manes, D. Giardina, Y. Pico, J. Agric. Food Chem. 54 (2006) 14
7947. 15
[14] C. Sun, S.H. Chan, D. Lu, H.M.W. Lee, B.C. Bloodworth, J. Chromatogr. A 16
1143 (2007) 162. 17
[15] R. Bagnati, G. Bianchi, E. Marangon, E. Zuccato, R. Fanelli, E. Davoli, Rapid 18
Commun. Mass Spectrom. 21 (2007) 1998. 19
[16] A. Sanches-Silva, S. Pastorelli, J.M. Cruz, C. Simoneau, I. Castanheira, P. 20
Paseiro-Losada, J. Dairy Sci. 91 (2008) 900. 21
[17] H. Gallart-Ayala, E. Moyano, M.T. Galceran, J. Chromatogr. A 1208 (2008) 182. 22
[18] D.x. Shen, H.z. Lian, T. Ding, J.z. Xu, C.y. Shen, Anal. Bioanal. Chem. 395 23
(2009) 2359. 24
[19] European Commission (2002) Commission Decision of 12 August 2002 25
implementing Council Directive 96/23/EC concerning the performance of 26
analytical methods and the interpretation of results. European Commission, 27
Brussels. 28
[20] R. Bagnati, G. Bianchi, E. Marangon, E. Zuccato, R. Fanelli, E. Davoli, Rapid 29
Commun. Mass Spectrom. 21 (2007) 1998. 30
[21] N. Negreira, I. Rodriguez, E. Rubi, R. Cela, Talanta 82 (2010) 296. 31
[22] K. Banerjee, D.P. Oulkar, S. Dasgupta, S.B. Patil, S.H. Patil, R. Savant, P.G. 32
Adsule, J. Chromatogr. , A 1173 (2007) 98. 33
[23] C. Lesueur, P. Knittl, M. Gartner, A. Mentler, M. Fuerhacker, Food Control 19 34
(2008) 906. 35
[24] I. Ferrer, E.M. Thurman, J. Chromatogr. A 1175 (2007) 24. 1
[25] S. Wang, Y. Xu, C. Pan, S. Jiang, F. Liu, Anal. Bioanal. Chem. 387 (2007) 673. 2
[26] P. Paya, M. Anastassiades, D. Mack, I. Sigalova, B. Tasdelen, J. Oliva, A. Barba, 3
Anal. Bioanal. Chem. 389 (2007) 1697. 4
[27] T. Cajka, J. Hajslova, O. Lacina, K. Mastovska, S.J. Lehotay, J. Chromatogr. , A 5
1186 (2008) 281. 6
[28] A. Di Gianni, R. Bongiovanni, A. Priola, S. Turri, Int. J. Adhes. 24 (2004) 513. 7
8 9 10
Figure Captions
1 2
Figure 1. Chemical structures of photoinitiators. 3
4
Figure 2. Effect of column temperature on the separation of the eleven UV Ink 5
photoinitiators. LC-MS/MS reconstructed chromatograms at (A) 25oC, (B) 15oC, (C) 6
5oC at 300 μL min-1 and (D) 5ºC at 450 μL min-1. Peak identification: 1, HMPP; 2, 7
HCPK; 3, EDMAB; 4, DMPA; 5, BP; 6, PBZ; 7, DEAB; 8, 2-ITX; 9, 4-ITX; 10, 8
EHDAB; 11, DETX. 9
10
Figure 3. Analysis of (A) a packaging material containing a pineapple juice sample and 11
(B) a pineapple juice sample. Conditions as indicated in the experimental section. 12 13 14 15 16 17
Figure 1
1-Hydroxycyclohexyl phenyl ketone (HCPK) 2,2-dimethoxy-2-phenylacetophenone (DMPA) 4,4’-Bis(diethylamino)-benzophenone (DEAB) 2-Ethylhexyl 4-(dimethylamino)benzoate (EHDAB) 2-Hydroxy-2-methylpropiophenone (HMPP) Ethyl 4-dimethylaminobenzoate (EDMAB) 4-Benzoylbiphenyl (PBZ) 2,4-Diethyl-9H-thioxanthen-9-one (DETX) 2-Isopropylthioxanthone (2-ITX) 4-Isopropylthioxanthone (4-ITX) Benzophenone (BP) Figure 1
Time (min) 1 2 3 4 6 8 10 0 1 2 3 4 5 6 7 Time (min) 100 R e lat iv e A b u n d a n c e A) 5 7 9 11 0 1 2 3 4 5 6 7 100 R e lat iv e A b u n d a n c e B) 1 2 3 4 5 6 7 8 9 10 11 1 2 3 4 6 8 10 0 1 2 3 4 5 6 7 Time (min) 100 R e la tiv e Abu n d a n c e C) 5 7 9 11 10 100 R e lat iv e A b u n d a n c e D) 1 2 3 5 4 6 7 8 9 11 Figure 2 Figure 2
0 1 2 3 4 5 6 7 Time (min) 20 40 60 80 100 20 40 60 80 100 R e lat iv e A b u n d a n c e 20 40 60 80 100 3.24 3.12 3.31 NL: 2.02E4 NL: 3.01E3 NL: 6.21E4 0 1 2 3 4 5 6 7 Time (min) 20 40 60 80 100 20 40 60 80 100 20 40 60 80 100 5.31 4.59 4.82 4.95 NL: 1.68E3 NL: 9.15E2 NL: 9.89E2 0 1 2 3 4 5 6 7 Time (min) 0 20 40 60 80 1000 20 40 60 80 100 R e lat iv e A b u n d a n c e 0 20 40 60 80 100 3.32 NL: 1.88E3 NL: 4.88E3 NL: 5.22E3 0 1 2 3 4 5 6 7 Time (min) 20 40 60 80 100 20 40 60 80 100 20 40 60 80 100 4.63 4.81 4.97 NL: 1.81E3 NL: 4.57E2 NL: 1.68E2 Figure 3 A) B) EDMAB DMPA BP DEAB 2-ITX EHDAB 4-ITX EDMAB DMPA BP DEAB 2-ITX EHDAB 4-ITX Figure 3
Table 1. SRM acquisition parameters
Segment Time (min) Analyte
Precursor ions Product ion Assigment
(Quantifier/Qualifier) Collision energy (CE, V) Ion Ratio (%RSD) 1 0-3.7 HMPP 165.1 [M+H]+ 91.1 [C7H7] + 11 1.1 (10) 119.0 [M+H-H2O-C2H4] + 23 HCPK 205.1 [M+H]+ 105.0 [C7H5O] + 13 2.6 (9) 187.1 [M+H-H2O] + 5 EDMAB 194.1 [M+H]+ 151.1 [M+H-CH3-C2H4] +• 23 1.4 (2) 134.1 [M+H-CH3-C2H5O] + 31 DMPA 225.1 [M-CH3O] + 197.1 [M-CH3O-CO] + 14 1.8 (10) 105.0 [C7H5O] + 23 BP 183.1 [M+H]+ 105.0 [C7H5O]+ 15 1.3 (8) 77.0 [C6H5] + 34 2 3.7-6.0 PBZ 259.1 [M+H]+ 105.0 [C7H5O] + 17 2.7 (2) 181.1 [M+H-C6H6] + 18 DEAB 325.2 [M+H]+ 176.1 [M+H-C10H15N]+ 28 2.6 (3) 281.2 [M+H-C2H5-CH3] + 27 2-ITX / 4-ITX 255.1 [M+H]+ 213.0 [M+H-C3H6] + 22 1.9 (4) 184.0 [M+H-C3H6-CHO]+• 40 2-ITX-D7 262.1 [M+H]+ 214.0 [M+H-C3D6] + 23 1.8 (5) 185.0 [M+H-C3D6-CHO]+• 42 DETX 269.1 [M+H]+ 241.1 [M+H-C2H4] + 23 1.1 (3) 213.0 [M+H-C2H4-C2H4] + 30 EHDAB 278.2 [M+H]+ 151.1 [M+H-CH3-C8H16] +• 23 4.4 (4) 134.0 [M+H-CH3-C8H17O] + 27 Table 1
Table 2. Comparison of SPE and QuEChERS extraction procedures using a baby food sample matrix.
Compound SRM ILOQ (pg)
SPE method QuEChERS method
MLOQ (µg/kg) Trueness (%)** run-to-run precision** day-to-day precision** MLOQ (µg/kg) Trueness (%)** run-to-run precision** day-to-day precision** HMPP 12000 710 91 2.7 6.5 666 94 2.9 7.2 HCPK 600 500 89 1.9 7.6 500 87 2.6 7.8 EDMAB 30 0.5 90 2.8 6.8 0.5 81 4.5 8.6 DMPA 300 1.5 88 2.1 7.2 0.7 83 3.4 7.1 BP 300 2.0 92 4.3 8.6 2.3 97 5.1 9.7 PBZ 30 0.7 91 5.1 9.2 0.7 88 4.6 8.9 DEAB 15 0.3 89 4.9 9.8 0.7 98 5.0 10.1 2-ITX 1.5 0.2 90 3.3 6.4 0.2 93 3.3 7.1 4-ITX 1.5 0.2 92 2.7 6.8 0.2 95 3.4 6.7 DETX 1.5 0.3 91 3.3 7.2 0.3 95 4.3 7.6 EHDAB 15 0.7 90 4.2 8.3 1.0 86 4.4 8.9 *Injection volume: 10 μL
**Spiked concentrations (μg L-1): HMPP (2530), HCBPK (800), EDMAB (0.3), DMPA (4), BP (80), PBZ (1.4), DEAB (0.3), 2-ITX (0.14), 4-2-ITX (0.14), DETX (0.14) and EHDAB (0.3)
Table 3. SRM vs H-SRM (Q1) in a pineapple juice and a baby food matrices.
Compound
Pineapple matrix Baby food matrix
SRM H-SRM (Q1) SRM H-SRM (Q1) Peak Signal (%) S/N ratio Peak Signal (%) S/N ratio Peak Signal (%) S/N ratio Peak Signal (%) S/N ratio HMPP 100 12 44 20 100 15 51 100 HCPK 100 14 63 30 100 15 62 30 EDMAB 100 40 48 50 100 20 57 25 DMPA 100 30 45 60 100 20 50 100 BP 100 70 43 500 100 60 41 450 PBZ 100 10 25 300 100 10 26 110 DEAB 100 210 25 300 100 130 26 250 2-ITX 100 250 27 750 100 200 27 500 4-ITX 100 250 30 900 100 260 29 700 DETX 100 40 30 800 100 20 30 300 EHDAB 100 150 30 250 100 60 37 200 Table 3
Table 4. Packaged food samples analyzed using QuEChERS LC-MS/MS method using H-SRM (μg kg-1).
Sample type Packaging
volume (mL) HMPP HCPK EDMAB DMPA BP PBZ DEAB 2-ITX 4-ITX DETX EHDAB
Baby food 1 (fruit and cereal) 250 n.d. n.d. ~MLOD n.d. 40 n.d. n.d. n.d. n.d. n.d. n.d.
Baby food 2 (milk and cereal) 250 n.d. n.d. n.d. n.d. 29 n.d. n.d. n.d. n.d. n.d. ~MLOD
Baby food 3 (milk, fruit, cereal) 250 n.d. n.d. ~MLOD ~MLOD n.c.* n.d. n.d. 0.8 n.d. ~MLOD 0.6
Baby food 4 (multi-fruit) 200 n.d. n.d. 0.5 n.d. 3.0 n.d. n.d. 0.4 n.d. n.d. n.d.
Fruit juice 1 (peach and grape) 200 n.d. n.d. n.d n.d. 2.5 n.d. n.d. 0.2 ~MLOD 0.07 n.d.
Fruit juice 2 (orange) 200 n.d. n.d. n.d n.d. 6.5 n.d. n.d. 0.2 ~MLOD n.d. 0.6
Fruit juice 3 (pineapple) 200 n.d. n.d. n.d. n.d. 2.8 n.d. 0.7 0.2 0.07 n.d. n.d.
Gazpacho 1 1000 n.d. n.d. 2.5 n.d. n.c.* n.d. n.d. n.d. n.d. n.d. n.d. Gazpacho 2 1000 n.d. n.d. 0.5 n.d. 10 n.d. n.d. n.d. n.d. n.d. n.d. Gazpacho 3 1000 n.d. n.d. 1.6 n.d. 12 n.d. n.d. n.d. n.d. n.d. n.d. Gazpacho 4 1000 n.d. n.d. 0.5 n.d. 8.0 n.d. n.d. 0.4 n.d. n.d. n.d. White wine 1000 n.d. n.d. n.d. n.d. 1.8 n.d. n.d. n.d. n.d. n.d. n.d. Sangria 1000 n.d. n.d. n.d. n.d. 1.8 n.d. n.d. n.d. n.d. n.d. n.d. Water 1000 n.d. n.d. n.d n.d. 3.8 n.d. n.d. ~MLOD n.d. n.d. n.d. n.d.: not detected.
*n.c.: not confirmed. Ion ratio error higher than 20%.