Università di Pisa
Scuola di Dottorato “Leonardo da Vinci”
PhD Programme in
Land Vehicles and Transport Systems
PhD Dissertation
Dynamic analysis of vehicle
systems
Development of a driving simulator
Analysis and design of an automatic
transmission for motor-scooters
Riccardo Bartolozzi
Università di Pisa
Scuola di Dottorato “Leonardo da Vinci”
PhD Programme in
Land Vehicles and Transport Systems
PhD Dissertation
Dynamic analysis of vehicle
systems
Development of a driving simulator
Analysis and design of an automatic
transmission for motor-scooters
Author:
Riccardo Bartolozzi . . . .
Tutors:
Dott. Ing. Francesco Frendo . . . .
Prof. Ing. Massimo Guiggiani . . . .
SSD ING–IND/14 2011
Abstract
In this work, two researches in the field of dynamic analysis of vehicle systems are presented.
The first part of the thesis deals with the development of a driving simulator. This activity was carried out in the framework of a research project co-funded by the Italian Ministry of Education, Universities and Research (MIUR). It aimed at developing a driving simulator for the analysis of the driving style, in order to identify potentially dangerous conditions coming from a non proper interaction between driver, vehicle and environment, especially those related to low driver’s attention. As core part of the driving simulator, a vehicle simulation model, which reproduces the behaviour of the main vehicle systems, was developed. The simulator is made of a fixed driving platform, a single channel visual system and allows to acquire all driver’s inputs and vehicle motion signals. The system was involved in experimental campaigns which allowed the development of the driving style analysis techniques and demonstrated the reliability and the capability of the system.
The second part of the thesis treats the dynamic analysis and design of a high efficiency automatic transmission for motor-scooters and was carried out in the framework of the Italian MUSS project funded by the Italian Ministry of Economic Development. Motor-scooters are currently almost always equipped with CVT transmission with rubber belt. This transmission can be very cheap to manufacture, it has good comfort performance but low mechanical efficiency. An alternative automatic transmission was analysed and different architectures were studied. The system is based on a discrete ratio gear box with mechanical control of the gear shit by means of centrifugal clutches and free wheels. A dynamic model of the transmission was developed and its behaviour was investigated by means of results of simulated manoeuvres, highlighting the positive and negative aspects of the system. Finally, a preliminary design was also carried out with reference to an application of the transmission in a hybrid powertrain.
Sommario
In questo lavoro si presentano due attività di ricerca nell’ambito della simulazione e dell’analisi dinamica di sistemi di veicolo.
Nella prima parte della tesi viene presentato lo sviluppo di un simu-latore di guida per applicazioni sulla sicurezza stradale, realizzato nel corso di un progetto co-finanziato dal Ministero dell’Istruzione, dell’U-niversità e della Ricerca (MIUR). Tale progetto ambiva allo sviluppo di un simulatore per l’analisi dello stile di guida, così da poter identifica-re condizioni potenzialmente pericolose derivanti da una non adeguata interazione guidatore–veicolo–ambiente, con particolare riferimento alle situazioni di basso livello di attenzione del conducente. Come parte principale del simulatore, è stato sviluppato un modello di simulazione di veicolo che riproduce il comportamento dei principali sistemi di un’auto. Il simulatore è a piattaforma fissa con un singolo canale di proiezione frontale e permette l’acquisizione di tutte le azioni del conducente e dei segnali di moto del veicolo. Il sistema è stato utilizzato nel corso di campagne sperimentali che hanno permesso lo sviluppo dei sistemi di analisi dello stile di guida, oltre dimostrare la robustezza e le potenzialità del simulatore stesso.
La seconda parte della tesi riguarda la modellazione e l’analisi di una trasmissione automatica ad alto rendimento per scooter ed è stata svolta nell’ambito del progetto MUSS, finanziato dal Ministero dello Sviluppo Economico. Attualmente gli scooter sono equipaggiati nella quasi totalità con CVT a cinghia di gomma. Questa trasmissione, che ha nei punti di forza l’economia realizzativa e le prestazioni di comfort, ha per contro un rendimento basso. Nel corso del lavoro è stata studiata una trasmissione automatica alternativa e le sue possibili architetture. Il sistema in oggetto si basa su un cambio a gradini con ruote dentate con controllo meccanico della cambiata grazie a frizioni centrifughe e ruote libere. E’ stato sviluppato un modello dinamico del sistema e il comportamento del powertrain è stato analizzato sulla base dei risultati di simulazioni, evidenziando gli aspetti di forza e le debolezze. Infine, è stato condotto un dimensionamento preliminare con riferimento ad un’applicazione della trasmissione ad un powertrain ibrido.
Contents
Introduction 1
I Development of a driving simulator 5
1 Background and aims of the research 7
1.1 Road safety and data about road traffic accidents . . . 7 1.2 Monitoring the driver’s attention . . . 14 1.2.1 Systems based on physiological parameters . . . . 15 1.2.2 Systems based on behaviour parameters . . . 17 1.2.3 Systems based on driver’s inputs . . . 17 1.2.4 Systems based on vehicle motion conditions . . . . 18 1.2.5 Considerations on the systems presented . . . 19 1.3 Main aim of the research: the development of a driving
simulator . . . 20 1.4 State of the art of driving simulators . . . 22
1.4.1 Employments, structure and classification of driv-ing simulators . . . 23 1.4.2 Simulators with monitors and driver’s controls . . 25 1.4.3 Simulators with wall screens and driver’s controls . 26 1.4.4 Simulators with vehicle and wall screens . . . 26 1.4.5 Simulators with capsule . . . 27 1.4.6 Simulators with stereoscopic vision . . . 28 2 The driving simulator at DIMNP: architecture and
com-ponents 29
2.1 Computers and data flow . . . 31 2.2 Driving platform . . . 37 2.2.1 Pedals . . . 39
2.2.2 Steering system . . . 41
2.3 Control desk . . . 43
2.4 Visual system . . . 45
2.5 Graphical scenario . . . 45
3 Simulation model 51 3.1 Input and output blocks . . . 52
3.2 Structure of the vehicle model . . . 55
3.3 Powertrain and braking system blocks . . . 59
3.3.1 Engine . . . 60
3.3.2 Clutch . . . 61
3.3.3 Transmission . . . 63
3.3.4 Clutch and gear control . . . 66
3.3.5 Braking system . . . 67
3.4 Vehicle dynamics . . . 68
3.5 Suspensions . . . 73
3.5.1 Suspensions kinematics . . . 73
3.5.2 Suspensions stiffness and damping . . . 80
3.6 Tire model . . . 80
3.6.1 Vertical load . . . 82
3.6.2 Rolling radius and deformed radius . . . 82
3.6.3 Tire slips . . . 82
3.6.4 Tire forces and moments . . . 85
3.6.5 Tire model corrections for simulation at very low speed . . . 88
3.7 Steering system . . . 93
3.8 Parameters and file organization . . . 95
4 Real-time driving simulation 97 4.1 Simulation model performances . . . 97
4.2 Data acquisition . . . 98
4.3 Real-time parameter changing . . . 103
4.4 Example of simulated manoeuvres . . . 104
4.4.1 Acceleration and braking manoeuvre . . . 105
4.4.2 Lane change manoeuvre . . . 105
4.4.3 Step steer manoeuvre . . . 108
4.4.4 Acceleration and braking manoeuvre with loss of grip108 4.4.5 Step steer manoeuvre with loss of grip . . . 111
Contents vii
5 Experimental tests and campaigns 113
5.1 Introduction . . . 113
5.2 Driving simulator calibration . . . 114
5.2.1 Test protocol . . . 116
5.2.2 Results and discussion . . . 116
5.3 PRIN experimental campaign . . . 119
5.3.1 Test protocol . . . 121
5.3.2 Results and discussion . . . 122
5.3.3 Reactions to sudden vehicle lateral skid . . . 124
II Analysis and design of an automatic transmission for motor-scooters 127 6 Background of the research and studied transmission 129 6.1 Energy efficiency problems of motor-scooter transmissions 129 6.2 Alternative automatic transmissions . . . 132
6.2.1 Electronic controlled continuously variable trans-mission (ECVT) . . . 134
6.2.2 Dual clutch transmission (DCT) . . . 135
6.2.3 Zeroshift . . . 136
6.2.4 Automated manual transmissions with centrifugal clutches . . . 137
6.2.5 Toroidal CVT and NuVinci transmission . . . 139
6.2.6 Hydraulic transmission: Honda HFT . . . 140
6.2.7 Considerations about the systems presented . . . . 141
6.3 Layout and characteristics of the studied system . . . 142
6.3.1 System working principle . . . 142
6.3.2 System architectures . . . 144
7 Powertrain simulation model 149 7.1 Equations of the system . . . 149
7.1.1 Drive torque . . . 153
7.1.2 Drag torque . . . 153
7.1.3 Braking torque . . . 153
7.1.4 Free wheels . . . 155
7.1.5 Centrifugal clutches . . . 155
7.2 Model implementation in Simulink . . . 157
7.2.2 Friction and control block . . . 161
8 Applications of the studied transmission 163
8.1 Multi-speed with ICE . . . 163 8.1.1 Gear ratios and centrifugal clutch parameters . . . 165 8.1.2 Simulation results . . . 169 8.2 Two-speed with electric motor in hybrid powertrain . . . . 176 8.2.1 Modifications to the powertrain model . . . 178 8.2.2 Gear ratios and centrifugal clutch parameters . . . 179 8.2.3 Simulation results . . . 180
Conclusions 187
A Tire constitutive equations of the driving simulator
vehi-cle model 191
Introduction
Modelling and computer simulation play nowadays a fundamental role in automotive engineering, as well as in all other engineering disciplines. The so called virtual prototyping techniques are widely employed in universities and industries for research purposes and for product development. Among these techniques, dynamic simulations are carried out to investigate the behaviour of complex mechanisms from the early stages of the conceptual design to the final product. These allow to predict the mechanism working conditions in terms of kinematic characteristics (position, velocity and acceleration of each part) and loads (forces and moments of applied loads and constraints). From the specification definition to the testing phase, dynamic models are used to predict the behaviour of the complete vehicle and its systems, understanding the influence of the design parameters and helping to find the optimal vehicle characteristics. Moreover, this leads to significant time reduction (time-to-market), thus saving energy and costs.
In this work, dynamic analyses of vehicle systems were carried out with reference of two research activities in the field of road safety and environment protection, which are among the main research interests in automotive engineering. Moreover, in some cases, design aspects were studied and some design activity was carried out based on dynamic analyses results. The research activities presented and discussed in the thesis are:
• the development of a driving simulator for road safety purposes; • the analysis and design of an automatic transmission for
motor-scooters.
The development of a driving simulator for safety purposes is the topic of the first part of the thesis, from Chapter 1 to Chapter 5. This activity
was carried out in the framework of a PRIN1project funded by the Italian Ministry of Education, Universities and Research (MIUR) and carried out in cooperation between the Dipartimento di Ingegneria Meccanica, Nucleare e della Produzione (DIMNP), the Dipartimento di Ingegneria dell’Informazione of the Università di Pisa and the Dipartimento di Meccanica e Tecnologie Industriali of the Università degli Studi di Firenze. In 2009 and 2010 some activities on the driving simulator were carried out also in cooperation with the Dipartimento di Ingegneria Civile (Vie e trasporti section) of the Università di Pisa.
The main objective of the activity was to develop a driving simula-tor for the analysis of the driving style in order to identify potentially dangerous conditions, especially those related to driver’s drowsiness. The background and the aims of the research are treated in Chapter 1, fo-cusing on road safety and on the state of the art of driving simulators. In Chapter 2, the developed driving simulator at DINMP is described from the hardware point of view, whereas in Chapter 3 the vehicle simu-lation model is deeply described. Real-time driving simusimu-lation is topic of Chapter 4, where typical and extreme manoeuvres, carried out with the driving simulator, are presented. Finally, in Chapter 5 the results of experimental campaigns involving the driving simulator are described.
The second part of the thesis, from Chapter 6 to Chapter 8 treats the analysis, by means of dynamic simulations, and design of a high efficiency automatic transmission for motor-scooters. The study and the development of high efficiency motorcycle transmissions are within the main objectives of the national project MUSS (Mobilità Urbana Sicura e Sostenibile, i.e. safe and sustainable urban mobility) funded by the Italian Ministry of Economic Development and carried out mainly in cooperation with the project leader Piaggio & C. S.p.A..
This activity regarded the preliminary study and development of a high efficiency low-cost transmission for motor-scooter applications. The background and the aims of this research are described in Chapter 6, where the state of the art of conventional and innovative transmission solutions is also presented. In Chapter 7 the developed powertrain simulation model is described in details and, finally, in Chapter 8 two application of the studied transmission and the simulation model are presented and discussed. Dynamic simulation results and preliminary design results are
1
from the Italian: Progetto di Rilevante Interesse Nazionale, i.e. project of national relevant interest.
Introduction 3
both presented in this chapter. The MUSS project is still ongoing at the moment of writing this thesis and further activities will follow the present work.
Acknowledgements. I would like to thank the tutors Ing. Francesco Frendo and Prof. Massimo Guiggiani for their fundamental support, their constant helpfulness and for all I have learned from them in these years. Many thanks also go to Antonio Sponziello, whose opinions and support to these researches have been very important in many situations. I thank Armando Cofrancesco and the PRIN project partners for the collaboration in the driving simulator activities. I acknowledge the support of Ing. Onorino di Tanna and Ing. Paolo Capozzella in the works carried out in cooperation with Piaggio & C..
Although the activities carried out in the Formula SAE team of the Università di Pisa have not been included in this thesis, I would like to thank all team members of the past three years, especially those I worked with.
Part I
Development of a driving
simulator
Chapter 1
Background and aims of the
research
1.1
Road safety and data about road traffic
ac-cidents
Road traffic accidents represent worldwide one of the main problems for public health. Every day, at every hour, millions of people are on world roads, moving goods or people, working or spending their free time. With different means of transport and on different kind of roads, people from high-income countries, as well as from middle and low-income countries are often exposed to the risk of traffic accidents.
According to the World Health Organization (WHO), road traffic accidents are among the top ten causes of death in the world [65]. In the Global Burden of Disease Project for 2004, the WHO has shown that road traffic accidents caused over 1.27 million deaths that year, being the 9th cause of mortality with 2.2% of all world deaths [63, 65]. This result
is similar to that of many communicable diseases (see Table 1.1) and makes road traffic accidents being the first cause of death in the category of injuries, before violence, war and any kind of unintentional injury.
People of all ages are exposed to road traffic accidents, but their impact on young people is extremely higher. Road traffic accidents are, in fact, in the top 3 causes of death for people aged between 5 and 44 years and they represent the1st cause of death for people aged between
15 and 29 years [63].
Table 1.1: Top ten causes of death in the world in 2008 (data from the World Health Organization [63, 65]).
Cause Deaths
(mil.) (%)
Coronary heart disease 7.20 12.2
Stroke and cerebrovascular diseases 5.71 9.7
Lower respiratory infections 4.18 7.1
Chronic obstructive pulmonary disease 3.02 5.1
Diarrhoeal diseases 2.16 3.7
HIV/AIDS 2.04 3.5
Tuberculosis 1.46 2.5
Trachea, bronchus, lung cancers 1.32 2.3
Road traffic accidents 1.27 2.2
Prematurity and low birth weight 1.18 2.0
problem all over the world, there are some differences among the countries depending on their average income. High-income countries (HIC) have reduced the number of deaths in the last years, increasing infrastructure and vehicle safety and improving the enforcement of road safety laws. However, the problem is still very much important because of the ex-tremely increased number of vehicles: 15.6% of the world population owns 52.1% of the world registered vehicles, with an average of one vehicle every two persons. In low-income and middle-income countries, which have 84.4% of the world population, there are just 47.9% of the vehicles, but about 90% of all deaths due to road traffic accidents occur in these countries. In these cases, this number is depending on safety lacks in roads, vehicles, laws and drivers’ behaviour.
The same considerations can be done looking at the data for single countries (Table 1.2). The world mean rate of death due to road traffic accidents is about 19 persons every100 000 , but there are huge differences among different countries, mainly, but not only, correlated to the average income. In the table, the Disability-Adjusted Life Year (DALY) is also shown. This index is expressed as the number of years lost due to ill-health, disability or early death and represents a measure of overall disease burden often used by the WHO for analysing and comparing different
1.1. Road safety and data about road traffic accidents 9
a 30-day definition, modelled data.
HIC = high-income countries; MIC = middle-income countries; LIC = low-income countries
Registered vehicles Road traffic deaths a
Population LIC 41.9% LIC 36.7% LIC 9.2% HIC 15.6% MIC 47.8% HIC 8.5% MIC 49.6% MIC 38.7% HIC 52.1%
Figure 1.1: Population, road traffic deaths and registered motorized vehicles, by income group (World Health Organization [63]).
causes of death. Once more, these numbers highlight the importance of the road traffic accidents all over the world.
In addition to fatalities, there are between 20 and 50 million injuries per year, many of them being an important cause of disability. It has been estimated that a single person has an overall probability of 1/7 of being injured in his whole life.
Road traffic accidents have also an important impact on the economy of many countries, which in general results very difficult to estimate. In the U.S.A it has been estimated an overall cost for the society of 70 billion dollars per year, considering health costs and damages to vehicles and roads [49]. For many low-income countries, these costs can be between 1 and 3% of their gross national product [63], representing a brake in their development. In proportion, the problem is similar in high-income countries: according to the White Paper of the European Community, the cost for the society of road traffic accidents is about 160 billion euros, which represents 2% of the EU gross national product [11].
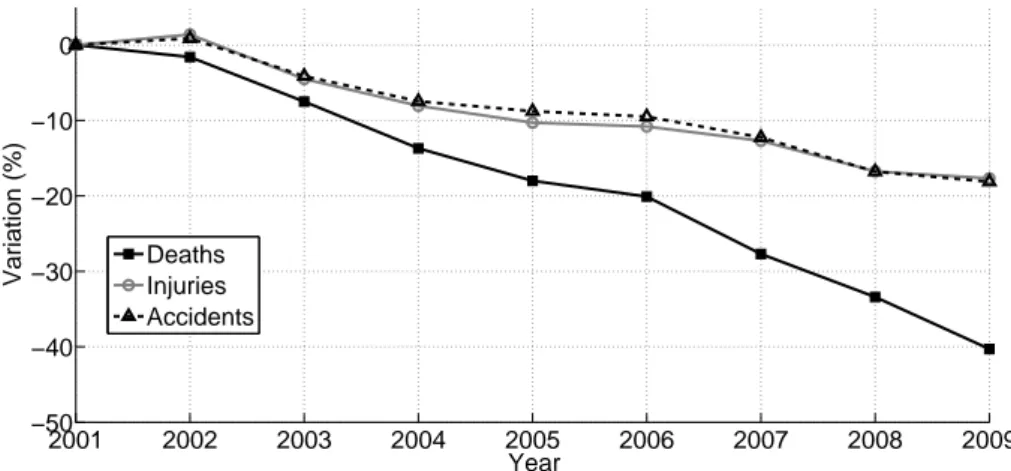
In Italy the situation is similar to that of other Mediterranean high-income countries. Detailed official reports on road traffic accidents are available every year from the national institute of statistics (ISTAT) and the national auto-mobile club (ACI). According to the last available report [31], in 2009 there were 590 accidents per day with at least one person injured, with 12 deaths and 842 injuries.
The trends of accidents, deaths and injuries from 2001 to 2009 can be observed in Table 1.3 and Figure 1.2. These show how there is a
Table 1.2: Estimated deaths and disability-adjusted life year (DALY) due to road traffic accidents in various countries in 2004 (data from the World Health Organization [64]).
Country Deaths DALY
numbera rateb numbera rateb
Italy 7.1 12.1 174 297 Germany 6.0 7.3 161 195 U.K. 3.7 6.2 108 180 U.S.A 45.6 15.4 1252 422 Japan 9.9 7.7 202 158 China 284.8 21.7 8192 624 India 202.3 18.1 6747 606 Indonesia 50.6 22.7 2364 1059 South Africa 18.6 39.1 550 1157 Brazil 40.4 21.9 1249 677
a Number of deaths and DALYs are expressed in thousands. b
Rates are expressed in deaths (or DALYs) every 100 000 people.
continuous decrease of accidents, although the registered vehicles grew of about 18% in this period (from 42 million to 49.5 million vehicles). With a similar rate, injuries also decreased. The number of deaths shows a higher decreasing rate, as it can be observed in the mortality index.
Even if there is this positive trend, road traffic accidents remain an important problem. In order to overcome it, the European Union fixed in 2001 the objective, for 2010, of a global reduction of 50% of deaths on the road. Almost all EU 27 countries obtained positive results in these years, but this goal seems difficult to reach. Up to 2009, the average EU result is 35.1%, whereas Italy reached a reduction of 40.3% (10th country
in the ranking) [31].
This reduction trend in the number of accidents depends on improving related to the three main elements which are involved in road safety:
• driver; • vehicle;
1.1. Road safety and data about road traffic accidents 11
Table 1.3: General statistics about road traffic accidents in Italy (data from ACI [31]).
Year Accidents Deaths Injuries Mortality indexa
2001 263 100 7096 373 286 2.7 2002 265 402 6980 378 492 2.6 2003 252 271 6563 356 475 2.6 2004 243 490 6122 343 179 2.5 2005 240 011 5818 334 858 2.4 2006 238 124 5669 332 955 2.4 2007 230 871 5131 325 850 2.2 2008 218 963 4725 310 745 2.2 2009 215 405 4237 307 258 2.0 a
Number of deaths relative to the number of accidents (in percentage).
• environment (road, infrastructures, etc.).
On one side, road infrastructures have increased their quality and several laws have been redefined and better enforced to improve the drivers’ behaviour in the traffic. On the other side, the automotive industry has highly improved the active and passive safety of vehicles. Well known active safety systems such as ABS (Anti locking Braking System) and ESC (Electronic Stability Control) are since some years ago in the standard equipment of almost all new cars and are demonstrated to be responsible for avoiding many accidents. Passive safety has played an important role as well, reducing the damages once accidents occur. The increased passive safety performances of modern systems (such as air-bag) can be understood looking at the decrease of the mortality index of road accidents (Table 1.3).
Further improvements in road safety, which are worldwide as demon-strated absolutely necessary, need to focus at the same time on the three elements introduced (driver, vehicle and environment). In specific, the driver seems to be the critic element, as it can be stated referring to Table 1.4. The driver is responsible for the accidents mainly (93.52%) because his incorrect behaviour (i.e. not following the traffic rules) and, in a minor proportion (3.12%), because of his abnormal psycho-physical
2001 2002 2003 2004 2005 2006 2007 2008 2009 −50 −40 −30 −20 −10 0 Year
Variation (%) DeathsInjuries
Accidents
Figure 1.2: Trend of deaths, injuries and accidents in Italy in the period 2001–2009. All values are relative to those of 2001.
conditions (e.g. drowsiness, alcohol, drugs). However, this last cause is correlated to accidents with a higher rate of deaths and injuries [30]. As it is shown in Figure 1.3, during the hours of the night, when there is a higher incidence of the factors related to abnormal psycho-physical conditions, there are less deaths (and less accidents) but the mortality index is very much higher.
Many researchers agree that accidents due to abnormal psycho-physical conditions are underestimated because of the difficulties to directly prove them. Especially the number of accidents due to
drowsi-Table 1.4: Causes of road traffic accidents (Italy 2008, data from ACI [30]).
Cause Accidents
(-) (%)
Driver incorrect behaviour 259 219 93.05
Driver abnormal psycho-physical conditions 8697 3.12
Defect or failure of the vehicle 1076 0.39
1.1. Road safety and data about road traffic accidents 13
Figure 1.3: Number of deaths in road traffic accidents (left) and mortality index at each hour of the day (right) (Italy 2009, ACI [31]).
ness (or hypovigilance conditions), which are officially just 0.25% of the total accidents in Italy in 2008 [30], appears to be extremely underes-timated if compared to the results of some specific studies. In these researches, drowsiness is considered to be within the causes of 22% of all road traffic accidents [15], and of 40% of accidents with deaths [46]. Moreover it has been observed that this kind of accidents is generally more critic, having a percentage of deaths which is triple with respect to other accidents.
For these reasons, current technology development is focused, on one side, on systems which help the driver to avoid incorrect manoeuvres and possibly correct them and, on the other side, on monitoring the driver’s attention level to detect abnormal psycho-physical conditions. Among the first category, there are active systems, such as ABS and ESP, most of which are employed in modern vehicles1. With these systems, incorrect manoeuvres due to driver’s errors are corrected modifying the driver’s inputs. This can be done at different levels, from the well established ABS which controls the brake pressure, to automated driving systems, such as the Adaptive Cruise Control or the Frontal Crash Warning [43], which have been recently developed. An other possibility to avoid incorrect
1
manoeuvres, is to inform the driver about current environment and traffic conditions. Systems which display the traffic signs on-board, or night vision systems, are among the examples of such systems which have been developed in the last years.
In the second category, there are systems which can recognize when the driver’s behaviour is not consistent with the driving conditions, monitoring his attention level in several possible ways, and consequently take a countermeasure, such as alerting the driver or limiting the engine power. In the next section, recently developed systems which detect hypovigilance conditions are presented and briefly described.
1.2
Monitoring the driver’s attention
In the previous section, it was pointed out, the importance of the influence of driver’s abnormal psycho-physical conditions and, within them, of hypovigilance conditions on road traffic accidents. For these reasons, diagnosis systems, able to monitor the driver’s attention and identify hypovigilance conditions, have been studied and developed in the last years. Some of them have also been launched in the market.
It is worth noting that the objective of such systems is very complex because of the many variables to be taken into account. A low level of driver’s attention depends on the interaction of the three main elements of road safety already introduced: driver, vehicle and environment. Ab-normal driver’s psycho-physical conditions are of course at the basis of driver’s hypovigilance, however, they are often associated with factors related to the environment and, in some cases, to the vehicle, which reveal more their effects. Monotonous driving, such as in straight high-ways, especially during the night, is often an increasing factor for driver’s hypovigilance. In these situations, the driver needs to interact rarely or repetitively with the vehicle commands and the environment changes slowly. On the contrary, driving in urban areas, requires a higher level of driver’s attention, because of the frequency of the driver’s interactions with the vehicle (i.e. steering input, changing gear, braking, etc.) and of the changes in the environment. Distractions, such as the use of mobile phone, are also causes of a low level of driver’s attention.
In order to monitor the level of driver’s attention, systems based on different information sources have been studied and developed. The systems can be classified in four groups, depending on the source of
1.2. Monitoring the driver’s attention 15
information:
• driver’s physiological parameters; • driver’s behaviour parameters; • driver’s inputs;
• vehicle motion conditions.
Of course, there are also some systems which combine more than one source of information.
The use of driver’s physiological or behaviour parameters represents a direct measure of the driver’s condition and it is therefore a reliable way to identify hypovigilance. However, these systems make often use of sensors (such as video cameras or electrodes) which can be felt as intrusive by many drivers. It is fundamental to consider this aspect if a system is developed for industrial production. On the other side, systems based on vehicle motion conditions or driver’s inputs can use signals which are nowadays often available on all vehicles, being invisible to the drivers. In this case, the measure is of course indirect and, in turns, it requires the development of complex procedures of signal analysis and driving style identification.
Although these systems are based on different concepts, they share a common architecture, which is shown in Figure 1.4. Dedicated or already on-board sensors measure the quantities on which the system is based, a control unit processes these data and detects driver’s hypovigilance conditions and, finally, an alert system alerts the driver (or other coun-termeasures are taken). Systems based on driver’s inputs generally need also to identify the driving style of each driver. The block related to this function is connected with dashed lines in the picture indicating that is not always present.
In the following, a brief description of the four categories of systems and some example are presented.
1.2.1 Systems based on physiological parameters
Among all physiological parameters, the electrical brain activity, measured by Electroencephalography (EEG) is considered the most accurate to detect driver’s hypovigilance conditions. Many studies have demonstrated the correlation of the amplitude of some parts of the EEG spectrum to
Driver identification module Sensors Data elaboration module Alert system
Figure 1.4: Block scheme of a generic system which monitors the driver’s attention.
drowsiness conditions [40, 38, 42, 41]. However, accurate measurements are possible only intrusively, using common electrodes for EEG. For this reasons, it is unlikely to foresee commercial applications of such systems in vehicles. Thanks to their high accuracy, they have anyway an important role as test systems in laboratory when developing other systems.
Other systems are based on the electrical cardiac activity, measured by Electrocardiography (ECG) [66] or on the blood pressure. The re-lationship between these parameters and the driver’s conditions varies very much among people. The system has therefore to learn the basic parameters of each driver before working properly. Also in this case, the acquisition sensors are intrusive and, therefore, these systems will be difficultly employed in applications other than test equipments in laboratory.
A less intrusive solution is represented by a sensor-equipped steer-ing wheel, which can measure the cardiac frequency [9] and, in some applications, the hand sweat and the skin temperature.
As found out in the cited studies, in order to correlate these physio-logical parameters to driver’s hypovigilance conditions, systems based on EEG, ECG or other parameters need complex data elaboration which, in turns, requires dedicated and expensive hardware.
1.2. Monitoring the driver’s attention 17
Figure 1.5: Example of eye-tracking system for detecting driver’s drowsi-ness.
1.2.2 Systems based on behaviour parameters
According to several studies, the percentage of eye closure (PERCLOS) is correlated to driver’s drowsiness [32, 52]. Systems based on this concept, need to monitor with a video camera the face of the driver and analyse the image to detect the eyes and their blinking [13, 33, 50]. This task has to carried out in real-time, processing a lot of data and, therefore, requires high performance components (camera and dedicated hardware). Moreover, because of the use of cameras, these systems are felt as intrusive by many potential costumers. Other systems based on driver’s eyes, analyse the eye look direction (Figure 1.5).
An other kind of system is based on the head position, which is strongly correlated to the driver’s drowsiness [55]. As for other systems, the normal position of the head has to be acquired by the system in a first phase.
Finally, there are systems which acquire the position of the complete body of the driver by pressure sensors on the seat and by video cameras. The analysis of the driver’s posture is very complex and, therefore, in recent year research have been focused on the analysis of the eyes and the head.
1.2.3 Systems based on driver’s inputs
The systems developed in this category focus mainly on the steering wheel, which is, within the driver’s inputs, the most representative of the driving style. While driving even on a straight road, every driver makes little corrections to maintain the vehicle direction. The amplitude and the frequency of these corrections are typical for each driver. However, it has been demonstrated how all drivers increase the amplitude and
decrease the frequency of the corrections on the steering wheel when their attention level is lower. This information could be therefore used for detecting driver’s drowsiness [8, 56, 34, 57]. The information of the steering wheel angle is often correlated to other input signals (throttle and braking pedals position) and to vehicle dynamics signals (accelerations, speed, etc.) to avoid false alarms.
This kind of system has the advantage of being completely transparent to the user. Moreover, being the signal of the steering wheel angle already measured on-board and available in the CAN of modern vehicles, as well as the other driver’s inputs, such systems result less expensive than others.
Specific algorithms (mainly based on fuzzy logics and neural networks) have to be studied and developed to correlate the driver’s inputs infor-mation to the driving style. In a first phase the system should learn how the single driver interacts with the vehicle and store this information as the normal driving style. Then, it should be able to detect dangerous conditions when the driver’s inputs are different from those of the normal driving style, especially if related to unusual vehicle motion conditions.
1.2.4 Systems based on vehicle motion conditions
The quantities describing the vehicle dynamics are of course influenced by the driving style and it is expected to find differences between normal and hypovigilance driver’s conditions. However, they are also highly dependent on the driving and traffic conditions and on the single driver’s style. For these reasons, systems based on vehicle motion conditions need, as those based on the driver’s inputs, to learn the normal driving style of each driver before working properly.
As well for the systems based on driver’s inputs, they make use of signals, most of which are already on the CAN of modern vehicles. This means they are completely transparent to the driver and need less additional equipment if compared to other systems.
The main challenge for these systems is to properly and effectively identify hypovigilance conditions from signals which are influenced by the driving and traffic conditions. In the literature, the lateral lane position has been considered as a signal highly correlated with the driver’s drowsiness, to be used in highways and extra-urban roads [54]. This system needs of course cameras to detect the lateral vehicle position in the lane.
1.2. Monitoring the driver’s attention 19
Table 1.5: Comparison of solutions for monitoring the driver’s attention.
Type Signals Effectiveness Feasibility
Physiological EEG, ECG, etc. Very good Bad
Behaviour PERCLOS, etc. Good Sufficient
Driver’s inputs Steer. wheel, etc. Good Very good Vehicle motion Lat. lane pos., etc. Sufficient Good
Other signals, such as the longitudinal velocity and the lateral accel-eration, are not enough to identify the drive’s conditions, but are often used in addition to other information (i.e. lateral lane position or driver’s inputs).
1.2.5 Considerations on the systems presented
The different solutions for monitoring the driver’s attention can be eas-ily compared in Table 1.5, where all considerations already made are summarised. As already pointed out, systems based on physiological or behaviour parameters have in general high effectiveness, measuring directly driver’s parameters. However, being these systems intrusive, their possibility of being employed in commercial vehicles is very low at the moment. On the other side, systems based on driver’s inputs or vehicle motion conditions use less direct measures, which therefore need advanced post-processing, but represent solutions completely transparent to the driver.
It is also worth noting that, in order to detect dangerous driver’s hypovigilance, systems based on driver’s inputs and vehicle motion condi-tions have to store information about the normal driving style, defining a so called user profile.
Among all available driver’s input and vehicle dynamics signals, the steering wheel seems to be the quantity which better correlate with the driving style and hence the driver’s conditions. However, because of the complexity of identifying the driving style, in general, these systems need also to combine information of different signals (both inputs and vehicle dynamics quantities) and to use environment and traffic information.
developed, such as the Attention Assist by Mercedes [45]. This system uses the steering wheel angle, the way the driver activates the indicators, the positions of the pedals (driver’s inputs), the vehicle speed and the lateral and longitudinal accelerations (vehicle motion conditions). More-over, it takes into account the lateral wind force and the quality of the road surface as environment variables.
1.3
Main aim of the research: the development
of a driving simulator
As shown in the previous section, the use of driver’s input and vehicle dynamics signals seems to be the best compromise between effectiveness and feasibility, for driver’s attention monitoring systems. In order to develop such systems, a driving simulator is needed, which allows to carry out safe and completely monitored test drives in laboratory. With a driving simulator, all driver’s input signals (steering wheel angle and pedals position) and all vehicle quantities (velocities, accelerations, engine speed, etc.) are available to be monitored and stored for further analyses. Moreover, additional medical equipments, such as those for EEG or ECG, can be used to monitor also driver’s physiological parameters.
The developing of a driver simulator has to face many interesting challenges. Firs of all, if the target of the simulated drives is the human factor, the actual driving conditions should be reproduced as close as possible. To do so, a driving simulator must reproduce faithfully the interfaces between the driver and the vehicle and also the environment. Only if the driver feels himself like in actual driving conditions, his behaviour and his reactions could be representative of what happens in real vehicles on real roads. This means that the physical interfaces of the vehicle and their behaviour must be close to the real ones: both the input commands (steering wheel, pedals) and the cockpit elements, such as the seat, should be realistic. In addition to this, it is important to closely reproduce the visual and the audio sensations which a driver feels during driving. In some cases, when test drives are performed at high accelerations, it is also required to reproduce the effects of the inertia on the driver body.
From the simulation point of view, the main aspect of a driving simu-lator is the real-time simulation. Usually, in simulations, the simulation time is different from the real time because there is no need to connect the
1.3. Main aim of the research 21
simulation environment with the real world. This means that simulation time can be slower or quicker than real time and its rate could be not constant. In driving simulator applications this is, of course, not possible. Simulation time and real time must be the same, so that the simulation environment can be connected with the driver and any real component of the simulator. This means that simulation tasks in each time step must be performed within the time step itself, limiting the complexity of the simulation models in relation with the available hardware.
Simulation models should however reproduce all vehicle subsystems with a different detail depending on the simulator target. In driving simulators, a core part of vehicle dynamics with a tire model is always present and often the elements of the complete powertrain are also modelled (engine, clutch, gearbox and differential). The complete model could be very complex depending on the application, including in some cases also vehicle auxiliary systems, such as the electrical or the cooling system.
As the simulator physical environment, the simulation model must reproduce as faithfully as possible all driving conditions. This means that the simulated vehicle should be able to reproduce unusual manoeuvres, which are rarely simulated outside the field of driving simulators and usually require specific modelling techniques. These manoeuvres include stopping and restart the vehicle, lose of grip, etc..
All these aspects will be further analysed in the following sections, describing the driving simulator at the Dipartimento di Ingegneria Mec-canica, Nucleare e della Produzione of the Università di Pisa, which is the object of this part of the present work. This driving simulator was mainly developed to study the driving style with the aim of developing a diagnosis tool, for detecting driver hypovigilance conditions, based on driver’s inputs and vehicle motion signals. This activity was carried out in the framework of a PRIN project funded by the Italian Ministry of Education, Universities and Research [5]. Thanks to the possibility of carrying out safe and completely monitored test drives, the driving simulator can be used for several purposes related to the human factor and it is, in fact, currently used also for other projects involving different university departments. Studies about the driver’s behaviour in urban environment are carried out in cooperation with transport engineers of the Dipartimento di Ingegneria Civile of the Università di Pisa, who are involved also in the development and the customization of the graphical scenario of the simulator. Other examples are: the study of alcohol effects
among people with different genotype (carried out with the biologists of the Dipartimento di Biologia of the Università di Pisa) and the study of narcolepsy effects on driving (cooperation with the Diparimento di Neuroscienze of the Università di Pisa).
The physical description of the driving simulator is the topic of Chapter 2, whereas Chapter 3 treats the simulation model. Before going into details of the developed system, in the next section the state of the art of driving simulators is presented.
1.4
State of the art of driving simulators
With the general technology development, driving simulators have reached a very high level of accuracy in reproducing the real driving conditions. Thanks to this, they are now a fundamental instrument for studying the interactions between driver, vehicle and environment, both in academic and industrial fields.
The use of driving simulators has many advantages with respect to test drives on roads. First of all, the safety in laboratory tests is very much higher than in a vehicle which is really moving on roads with traffic. Moreover, from the experimental point of view, driving simulators allow to completely control the test environment, to acquire a big amount of data regarding all vehicle model signals (needing no sensors) and driver’s inputs and to save time and money. An other important advantage, is that driving simulators can reply the same environment and traffic conditions for several drivers. On the other side, the simulation of aleatory elements, such as other vehicles motion or pedestrians behaviour, is not simple and requires specific developed software.
The first driving simulators were built in the seventies and were based on flight simulators, which were already in use. At the beginning of the eighties, thanks to the computer technology, Daimler-Benz built the first high-fidelity driving simulator in the automotive industry. With the increase of computational and graphical performances of the computers and, on the same time, with the decrease of their costs, driving simulators have been developed in many academic and industrial institutions. Some example of institutions which currently own a driving simulator are: Ferrari and Dallara in Italy, VTI in Sweden, TNO and the University of Groningen in the Netherlands, Daimler-Benz in Germany, University of Leeds in England, University of Iowa in U.S.A., Triggs in Australia, Toyota
1.4. State of the art of driving simulators 23
in Japan. A good list of current driving simulator can be found online here: http://www.inrets.fr/ur/sara/Pg_simus_e.html (in french).
1.4.1 Employments, structure and classification of
driv-ing simulators
Driving simulators are employed in several fields (for more details on these application see [43]):
• road safety and monitoring of driver; • studies of people behaviour;
• development of new vehicle subsystems; • ergonomic studies;
• education; • rehabilitation;
• training of race and other special drivers.
The structure of a driving simulator, from the hardware and software point of view, can be very different depending on the goals of the simula-tion activities and on the available budget. However, some subsystems are common to all architectures. Regarding the hardware, driving simulators have the following three main parts [43, 29].
• Driving platform or vehicle, with the driver’s input elements, such as steering wheel, pedals and gear lever. These are equipped with sensors which acquire their position. In addition, they are endowed with passive or active feedbacks to produce realistic sensations. The driving platform or vehicle could be optionally moved to reproduce inertial effects and vehicle body inclinations.
• Video system made of monitors, or projection system with flat or shaped screens. This last kind of system can project just the front view or cover a wide angle of visual field, up to360◦. A last possibility is the stereoscopic vision (see Section 1.4.6).
• Audio system with more channels to create a three-dimensional audio effect. The engine noise and the environment noise (aero-dynamic noise and other effects) are reproduced by independent systems in high level applications.
From the software point of view, driving simulators are made of the following parts:
• vehicle simulation model (which computes, from the driver’s inputs, all vehicle quantities needed by the graphical and audio software, by the feedbacks and the data acquisition);
• software dedicated to the graphical scenario; • software for the audio system;
• software for managing the simulated drives (external interventions and data acquisition).
Depending on the hardware equipment, driving simulators can be classified following these categories:
• simulators with monitors and driver’s controls; • simulators with wall screens and driver’s controls; • simulators with vehicle and wall screens;
• simulators with capsule;
• simulators with stereoscopic vision.
All these categories have also the possibility of implementing the moving driving platform. This equipment allows the driving simulator to reproduce both the pitch, roll and bump motions and the inertial effects due to linear accelerations. In order to do so, the driving platform needs to have 6 degrees of freedom fully controlled by a motion system driven by the vehicle simulation model. An example of a simulator with such an equipment has been developed at the University of Kookmin in Korea [39].
1.4. State of the art of driving simulators 25
Figure 1.6: Simulator with driver’s inputs and three monitor (left) and one monitor (right).
Figure 1.7: Simulator with driver’s inputs, one monitor and moving platform.
1.4.2 Simulators with monitors and driver’s controls
Driving simulators with monitors and driver’s controls represent the most simple configuration. They are made of a driving platform with a seat (just a chair in some basic simulators), the driver’s inputs elements (steering wheel, pedals and gear lever if present) and one or three computer
monitors (Figure 1.6).
The simulator configuration with one monitor is very close to videogames and sometimes, the differences between the two are not that defined. The three monitor configuration is widely employed for low cost applications, when a wide visual system is required, especially for urban environment simulation.
Figure 1.8: Simulator with cylindrical screen and driver’s inputs.
Figure 1.9: Simulators with vehicle and wall screens. On the right, the vehicle is on a moving platform.
Driving simulator with monitors are built, in some cases, as a single compact system (commercial solutions) and are sometimes equipped with the moving platform Figure 1.7.
1.4.3 Simulators with wall screens and driver’s controls
This driving simulator configuration is very close to the previous one. In this case, the monitors are replaced with wall screens which widen the visual field of the driver. The most employed solutions are: the single flat screen, three flat screens and a cylindrical shaped screen (Figure 1.8). The latter solution has the advantage of avoiding discontinuities in the image projected, but it is more expensive.
1.4.4 Simulators with vehicle and wall screens
In order to better reproduce the actual driving environment, some simula-tors use a real vehicle, or the front part of it, instead of specific developed
1.4. State of the art of driving simulators 27
Figure 1.10: Simulators with capsule: NASD (left) and Toyota (right).
driving platforms (Figure 1.9). This solution is quite common being at the same time very realistic and few expensive. Moreover, using a real vehicle, the graphical scenario does not need to reproduce the dashboard and the cockpit.
As in the previous category, different screens can be employed: flat single, three flat or cylindrical. In addition, a rear vision system is often present in this solution. This can be made of a monitor, a wall screen or a monitor replacing the rear-view mirror.
As shown in Figure 1.9, the vehicle can be installed on a moving platform.
1.4.5 Simulators with capsule
Among all configurations, the simulators with capsule represent the most complex and expensive solution. A big capsule (of some meters in diameter) is supported by hydraulic pistons whose motion is correlated to the simulated driving conditions as the moving platforms for the other simulator configurations. In some cases (Figure 1.10) the capsule can also be moved longitudinally and laterally on linear runners to reproduce the inertial effects without tilting it.
On the capsule inner walls, the graphical scenario is projected at360◦ by several projectors. A real vehicle (or a part of it) is usually installed inside the capsule [59], although there are also solutions with specific designed driving platforms. While the low frequency body movements are reproduced by the capsule motion, the vibrations due to road unevenness are reproduced by actuators on the vehicle wheel hubs.
Such simulators represent the highest technology level in driving simulation and, as already mentioned, require a big budget. Examples of this solution are: the Daimler simulator, the National Advanced Driving
Figure 1.11: Simulator with stereoscopic vision and glows to reproduce the driver’s hands.
Simulator (NADS) developed by the University of Iowa [48] and the Toyota simulator [60].
1.4.6 Simulators with stereoscopic vision
Driving simulators with stereoscopic vision represent a particular category. In these simulators the only hardware needed are the physical interfaces of the driver’s input controls. Everything else (vehicle, dashboard, road, etc.) is virtually reproduced using stereoscopic vision glasses. The driver needs to wear special glows with sensors to reproduce his hands, and their interaction with the input controls, in the graphical environment (Figure 1.11) [61].
Chapter 2
The driving simulator at
DIMNP: architecture and
components
In this work, a driving simulator was developed, starting from an embry-onic version available at the beginning of the activities [43, 16]. Although there are still many improving possibilities, the developed DIMNP simu-lator is now a complete system which allows to carry out experimental driving campaigns, monitoring several signals (as described in Chap-ter 5) [4, 3]. Driver’s input signals (steering wheel angle and pedals positions), together with vehicle model signals (velocities, accelerations, angles, engine speed, etc.) are acquired and stored for analyses.
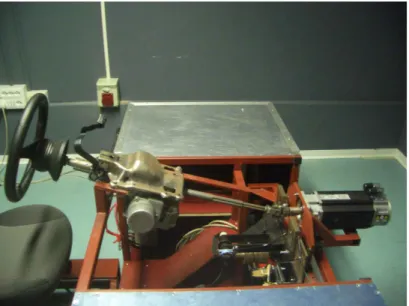
Figure 2.1: Instrumented driving platform (left) and simulator control desk (right).
The developed system is a fixed base driving simulator with a single channel front visual system, which represents the view of the driver with a three-dimensional scenario. It is worth noting that the choice of a non-moving driving platform is related to the aims the simulator, as well as to the project budget. As already pointed out, the driving simulator was developed to study driver’s hypovilance conditions. These are usually correlated to monotonous highway driving, in which longitudinal and lateral accelerations are very low and can be therefore neglected without losing much simulation realism.
The driving simulator is installed in a specific room with dark walls, which improve the quality of the visualisation of the front view images. In the same room, the are the driving platform and the control desk, where an operator can follow the simulated drive and control it (Figure 2.1).
In short, the simulator is made of: • the instrumented driver’s cabin; • the control desk;
• the visual system (single front screen and video projector); • the audio system (2+1);
• four personal computers connected by a local area network (with UDP communication protocol)
These elements are connected to each other as shown in Figure 2.2. The driver interacts with the simulator by means of the typical inputs of an automatic transmission vehicle: the steering wheel, the throttle and brake pedals. At the same time, the driver feels the vehicle motion conditions by means of the front view, the engine noise and the active feedback on the steering wheel. All input elements are installed in a driver’s cabin which reproduces the geometry layout of a real car, having a real car seat and, in the last version, also a real car bodywork with front window. The pedals and the steering wheel are endowed with sensors which acquire the driver’s inputs during the simulation. The pedals have also passive feedbacks, whereas, on the steering column, a brushless electric motor applies the actual steering torque feedback computed by the vehicle model.
In the next sections the driving simulator is presented in details, focusing on the computers and data flow (Section 2.1), on the driving
2.1. Computers and data flow 31 screen Traffic Generator Instructor Station
LAN(UDP protoc.)
Graphical scenario
Driver view frontal projection
Steering torque feedback
Instrumented pedals and steering column
Target PC Host PC
LAN(UDP protoc.)
Vehicle model
Brake, accelerator Steering angle
Figure 2.2: Block scheme of the driving simulator architecture.
platform (Section 2.2) and on the control desk (Section 2.3). Finally, the externally developed visual system is also presented: projection system is described in Section 2.4 and the graphic scenario in Section 2.5.
2.1
Computers and data flow
During the simulated drives, four computer are involved to carry out all functions of the driving simulator, such as the real-time simulation of the vehicle model, the data acquisition, the generation of the graphical scenario, etc.. The computers, which are connected through a local area network, are arranged following the simulator architecture shown in Figure 2.2 and will be further identified as:
• Target PC; • Host PC;
• Traffic Generator PC; • Instructor Station PC.
As shown in Figure 2.2, two of these computers (Target PC and Host PC) are dedicated to the vehicle simulation model and the other
two (Traffic Generator and Instructor Station) to the graphical scenario (Section 2.5). The Host PC and the Instructor Station are the computers used to monitor and control the simulated drive, respectively from the vehicle model and the graphical scenario point of view. These are installed in the control desk, as described in Section 2.3.
As already mentioned, the four computers are connected through a local area network which is based on the User Datagram Protocol (UDP) as communication protocol. Without going into details, UDP was considered as more suitable for this real-time application, rather than the usually employed TCP/IP. The main advantages of UDP are the small dimension of the data packet, the packet-oriented communication (data are ready to use when received) and the complete compatibility with Matlab/Simulink data types (double, int8, int32, uint8, etc.). It is worth noting that, in UDP communication, the sender does not need a confirmation from the receiver. This means that data packets are sent in the network even if the receiver is busy and they can get lost. This guaranties the synchronization of the simulated data communication with the real time, but particular care must be taken to set the proper communication settings between the computers.
The vehicle simulation model (Chapter 3) was built in Matlab/Simu-link environment and it is available in the Host PC for modifications of its structure or parameters. In the other computer dedicated to the model, the Target PC, the vehicle model is run during the simulated drives. In order to guarantee the real-time simulation, the model has to be run on a dedicated computer with specific features. For this application, the xPC Target toolbox of Matlab [44] was chosen [43].
Once the model and its parameters are defined, it is compiled, in the Host PC, in C code by the Realtime Workshop Matlab toolbox. To this aim, the toolbox uses an internal compiler whose options are set in the Simulation parameters of the Simulink model. In order to be run in Target PC, the model must be compiled with the option System target file set to xpctarget.tlc.
The compiled model is then sent to the Target PC using the xPC Target toolbox which has a user friendly graphical interface shown in Figure 2.3. With the commands of the xPC Target, most of them avail-able in the graphical interface, the real-time simulation of the model in the Target PC is controlled from the Host PC. It is possible to set the communication parameters between the two PCs, to check the communi-cation once the PCs are connected, to load a new model, to start and
2.1. Computers and data flow 33
Figure 2.3: xPC Target explorer interface in the Host PC.
stop the simulation, to monitor some output variables and to change model parameters.
The Target PC runs a specific xPC Target kernel which is generated from the Host PC (in the xPC Target Explorer interface) and saved in a removable drive (such as floppy disk or usb stick). It contains the Target PC software together with the information about the communication settings between the two PCs (IP addresses, port numbers, communication protocol, etc.) and must be generated once these settings are determined. This specific xPC Target kernel is then booted by the Target PC instead of any other operating system, which would not guarantee the real-time simulation.
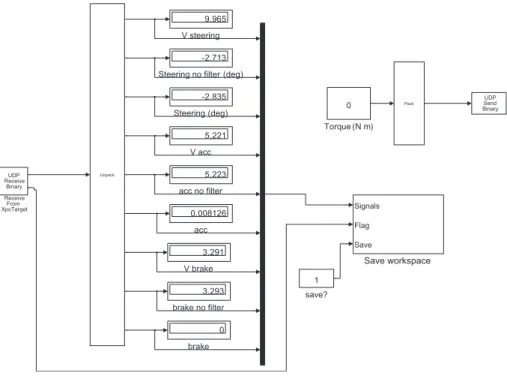
Other options include the possibily of setting Target or Host output graphs (scopes) using, in the Simulink model, the specific xPC Target block called Scope xPC. These scopes can be then managed with the xPC Target Explorer interface and allow to see some selected output signals of the model both in the Target PC and in the Host PC. By means of this feature, it was possible, in the first phases of the simulator development, to monitor in real-time the evolution of some fundamental vehicle model quantities, such as the longitudinal velocity, the lateral
Figure 2.4: Target PC screen-shot during a simulated drive.
velocity, the yaw rate and the roll angle (Figure 2.4). A so called file scope can also be added to the Simulink model, saving the signals to the hard disk of the Target PC. However, all these functions of signals plotting or data saving were replaced by a self-developed data acquisition software, specifically designed for this driving simulator application. The data acquisition software is a Simulink model running in the Host PC during the simulated drivers and it is described in Section 4.2.
A fundamental aspect in the xPC Target application, is the model equations solver. In order to guarantee the real-time simulation, the solver (to be set in the Simulink model in the Host PC) has to be a fixed time-step solver. Using a fixed time-step solver is, in fact, necessary to synchronise the input signals and the model computed outputs. In the developed vehicle model, the Runge–Kutta solver was chosen (ode4) and a fixed time-step of2.5 ms was set, i.e. the solver frequency of the model is400 Hz. As shown in Section 4.1, the value of this parameter is consistent with the present application.
In order to run a real-time simulation, the Target PC requires also a network card chosen from a specific set of supported cards by xPC Target.
2.1. Computers and data flow 35
Figure 2.5: National Instrument PCI-6052E acquisition board (left) and connector block (right).
Table 2.1: Frequencies of model solution and data flow.
Model simulation 400 Hz
Data sent to Host PC (acquisition) 100 Hz Data sent to Traffic Generator PC 100 Hz Data sent to Instructor Station PC 100 Hz
These cards have an hardware clock which guarantees that inputs and outputs are at fixed time intervals.
During the simulated drive, the vehicle model, running in the Target PC, has to be connected to physical inputs and outputs. To this aim, a National Instrument acquisition board is connected to the Target PC, which is then able to receive the signals of the driver’s inputs and send, as outputs, the signal of the steering wheel torque feedback. These analogue signals (see Section 2.2) are acquired with the PCI-6052E acquisition board, a 333 k S/s, 16 bit, 16-analogue-input multifunction DAQ from National Instrument (Figure 2.5). This board, supported by the xPC Target, has a specific Simulink block to be put in the model, in which all communication settings (channel numbers, voltage and sample time) can be set (Figure 2.6).
The Target PC communicates, of course, also with the other computers of the driving simulator, sending all model output signals to the Host PC,
Figure 2.6: Specific block in Simulink for the National Instrument PCI-6052E acquisition board.
Figure 2.7: Specific block in Simulink for sending data via UDP.
for data acquisition, and some signals to the Traffic Generator and the Instructor Station, for the graphical scenario. These communications are implemented in the Simulink model using the specific xPC Target block for UDP data send. This block, shown in Figure 2.7 allows to set the IP address of the receiving computer, the port number and the sample time. Before this block, a zero-order hold block is used to keep the signal constant when the sending frequency is different from the model solution frequency. A pack block is also used, which packs all the signals to be sent in a single channel defining the number of bytes for each signal. The working frequencies of these communications are shown in Table 2.1.
In the model, also blocks for UDP data receive are implemented, which allow to send signals from the Host PC to the Target PC during the
2.2. Driving platform 37
simulated drivers. This feature is used to modify in real time some model parameters or to force some variable, making an external intervention in the simulation (see Section 4.3).
As already written, the Traffic Generator PC and the Instructor Station PC are dedicated to the graphical scenario. The former generates the driver front view, manages the other vehicles and pedestrians in the graphical environment and reproduces the sounds (engine noise). The latter is used to control some graphical scenario parameters, such as the weather and the daylight, from the control desk. Both of them need to correctly display the vehicle in the graphical environment and thus receive from the Target PC the position and orientation of the car body with respect to a fixed reference. These signals are described in Section 2.5. Finally, the graphical software is also used to obtain the distance of the vehicle center of mass to the lane centreline; this signal is sent by the Traffic Generator to the Host PC and acquired together with all other signals.
2.2
Driving platform
The driving platform of the DIMNP driving simulator reproduces the vehicle–driver interface of a small/medium size car with automatic trans-mission; i.e. the driver physically interacts with the throttle and brake pedals and the steering wheel, whereas there is no gear lever and no clutch pedal. The driving platform, shown in Figure 2.8, is made of the driver’s seat and a tubular space frame on which all other elements are fixed. Just recently, the front part of a bodywork of a Fiat Panda, with a plastic front window and the two doors, was added to the structure. It is planned to develop the driver’s cabin including a physical dashboard (which is currently virtually reproduced in the graphical scenario) and digital rear mirrors using small flat screens. It is worth noting that the more the simulator reproduces the real driver’s cabin of actual cars, the more the driver would behave naturally feeling himself in real driving conditions.
The driving platform was designed to reproduce the geometrical layout of a real car. The dimensions of the Fiat Idea (commercial car of small/medium size) were considered as a reference. In addition to this, the SAE J1100-JUN84 (1984) norm was taken into account for ergonomic design [43].
Figure 2.8: Driving platform of the driving simulator.
A driver’s seat of Fiat Idea is employed, as well as Fiat Idea pedals and steering system. In order to allow different sized drivers to properly interact with simulator (at least from5th to 95th percentile), the setting
possibilities of the original seat and the steering wheel were kept. The seat allows the typical settings of other car seats of similar vehicles. The steering wheel position is also tunable and allows to change the inclination angle and distance from the driver’s seat.
The main structure of the driving platform is made of welded square tubes measuring30 mm, 2 mm thick. Covered wooden panels are used as floor for the driver’s feet, for comfortably supporting the driver’s left foot (which is not used, having no clutch pedal) and for protection. This structure, which was designed before this work (see [43] for details) supports the pedals sub-structure, the steering system with the electric motor for the torque feedback (and its converter), the connector block of the acquisition board, a DC power generator and the Target PC.
2.2. Driving platform 39
Figure 2.9: Driving simulator throttle and brake pedals.
In the following, the main driver’s interfaces, i.e. the pedals and the steering system, are described in more detail.
2.2.1 Pedals
The throttle and brake pedals, shown in Figure 2.9, were endowed with angular potentiometers (also visible in the picture), which measure the angle travelled by each pedal hinge. This measure is used as the reference signal for the pedals positions, which are among the inputs of the vehicle simulation model. The potentiometers are the SRS280 model from Penny and Giles, with an electrical angle of 50◦. The working range was set from0 V to 10 V using an external DC power generator (represented in Figure 2.10), which generates the reference DC signal of10 V. However, the actual angular working range of the pedals is less than the nominal potentiometers angle of50◦ and therefore just about 3 V are used.
These analogue signals of the potentiometers are acquired by the acquisition board which is connected to the Target PC, as already written in Section 2.1. Finally, inside the vehicle simulation model, the acquired signals in Volts are converted into signals in the range 0–1, as described
Figure 2.10: DC power generator. 0 100 200 300 400 500 600 700 800 900 0 10 20 30 40 50 60 70 80 Pedal travel (mm) F o rc e ( N ) real feedback simulator feedback
Figure 2.11: Passive feedback force on the brake pedal [43].
in Section 3.1.
In order to reproduce the behaviour of real pedals, both the driving simulator throttle and brake pedals have passive feedback systems. By means of them, the driver feels realistic reaction forces on the pedals during the simulated drive. The throttle pedal is endowed with its default return spring which is also on the original pedal. On the other side, for the brake pedal it has been necessary to emulate the reaction force due the pressure of the oil during braking. Starting from a real force – pedal travel curve, a cylinder with two springs has been designed to this aim [43]. The results of the simulator feedback force in comparison to the real one is represented in Figure 2.11. During the first part of the pedal
![Table 1.1: Top ten causes of death in the world in 2008 (data from the World Health Organization [63, 65]).](https://thumb-eu.123doks.com/thumbv2/123dokorg/7530387.106987/20.722.148.556.192.453/table-causes-death-world-data-world-health-organization.webp)