Universit`a Politecnica delle Marche
Corso di Dottorato di Ricerca in Ingegneria dell’Informazione Curriculum in Ingegneria Biomedica, Elettronica e delle Telecomunicazioni
Human action recognition and mobility
assessment in smart environments with
RGB-D sensors
Ph.D. Dissertation of:
Enea Cippitelli
Advisor:
Prof. Ennio Gambi
Curriculum Supervisor:
Prof. Francesco Piazza
Universit`a Politecnica delle Marche
Corso di Dottorato di Ricerca in Ingegneria dell’Informazione Facolt`a di Ingegneria
Acknowledgments
I would like to thank Prof. Ennio Gambi and Dr. Susanna Spinsante for their guidance, insights, time and understanding during the last years. You have made my PhD experience active and challenging and your support has been crucial for my personal and professional growth.
I would like to express my gratitude to Prof. Thomas Lindh and his team for the ideas and suggestions received during the visiting period at KTH.
Thanks also to Prof. Francisco Florez-Revuelta for his excellent insights and suggestions not only during the three months spent at Kingston University, but also in the following collaborations.
Thanks to Prof. Sandro Fioretti and to the research group of Biomedical Engi-neering of Polytechnic University of Marche for the support received during the tests in the Movement Analysis Laboratory.
I am grateful to all the members of “Gruppo pranzo Univpm”, in particular the actual and former members of Telecommunication Systems Team, and also to the PhD students of EMC2 society at Kingston University. I had a great time with you during breaks, lunches and trips. A special thank to Samuele Gasparrini for the technical contribution in many research activities, advices, and friendship.
Finally, I would like to thank my parents, my brothers, and Chiara. Everything would have been more difficult without your constant encouragement.
Ancona, February 2017
Abstract
Population aging is a growing phenomenon in modern society and Active and As-sisted Living tools can be investigated to have smart environments supporting elderly people to age at home. The adoption of enhanced living environments leads to a bet-ter quality of life for elderlies, because they can live in their preferred environment, and also for the society, increasing efficiency of used resources.
This work is focused on the development of algorithms and solutions for smart environments exploiting RGB and depth sensors. In particular, the addressed topics refer to mobility assessment of a subject and to human action recognition.
Regarding the first topic, the goal is to implement algorithms for the extraction of objective parameters that can support the assessment of mobility tests performed by healthcare staff. The first proposed algorithm regards the extraction of six joints on the sagittal plane using depth data provided by Kinect. This solution is validated with a marker-based stereometric system considering the accuracy in the estimation of torso and knee angles during the sit-to-stand phase. A second algorithm is pro-posed to simplify the test implementation in home environment and to allow the extraction of a greater number of parameters from the execution of the Timed Up and Go test. Such parameters are related to the time duration of the entire test ex-ecution as well as some phases (sit-to-stand, turn, sit), in addition to the extraction of indices related to the length of the steps and to the angular velocity of arm swing. Kinect sensor is combined with an accelerometer placed on the chest of the subject, which allows to accurately identify the time instants of the steps in the walking phase and the inclination angle of the torso during the sit-to-stand phase. The use of data coming from different sensors requires the development of a synchronization algorithm based on the compensation of transmission and exposure times of frames acquired by Kinect, which are estimated for both versions of the sensor and for the three available data streams: RGB, infrared, depth. The developed synchronization algorithm can be used also for other applications that benefit from the joint usage of RGB-Depth and inertial data, for example in the detection of falls. Algorithms for the identification of falls exploiting the same configuration of the Timed Up and Go test are therefore proposed.
Regarding the second topic addressed, the goal is to perform the classification of human actions that can be carried out in home environment. Two algorithms for human action recognition exploiting skeleton joints of Kinect are therefore proposed. The first one is based on Activity Feature Vectors (AFV), which contain the most important postures extracted from a sequence of frames. The second one is named Temporal Pyramid of Key Poses (TPKP), it considers the bag of key poses model and represents the structure of the action with a temporal pyramid. The algorithms have been evaluated on publicly available datasets, achieving results comparable with the state-of-the-art in the datasets CAD-60, KARD, MSR Action3D.
Sommario
L’invecchiamento della popolazione `e un fenomeno in crescita nella societ`a mod-erna e strumenti per l’Active ed Assisted Living possono essere studiati per avere am-bienti intelligenti che supportano le persone anziane nell’invecchiamento all’interno dell’ambiente domestico. L’adozione di ambienti di vita avanzati porta ad una migliore qualit`a della vita per gli anziani, in quanto possono vivere nel loro ambiente prescelto, ed anche per la societ`a, aumentando l’efficienza delle risorse utilizzate.
Questo lavoro `e focalizzato sullo sviluppo di algoritmi e soluzioni per ambienti intelligenti sfruttando sensori RGB e di profondit`a. In particolare, gli argomenti affrontati fanno riferimento alla valutazione della mobilit`a di un soggetto e al ri-conoscimento di azioni umane.
Riguardo il primo tema, l’obiettivo `e quello di implementare algoritmi per l’estra-zione di parametri oggettivi che possano supportare la valutal’estra-zione di test di mobilit`a svolta da personale sanitario. Il primo algoritmo proposto riguarda l’estrazione di sei joints sul piano sagittale utilizzando i dati di profondit`a forniti da Kinect. Questa soluzione viene validata con un sistema stereofotogrammetrico basato su marker considerando la precisione nella stima degli angoli di torso e ginocchio durante la fase di sit-to-stand. Un secondo algoritmo viene proposto per facilitare la realiz-zazione del test in ambiente domestico e per consentire l’estrazione di un maggior numero di parametri dall’esecuzione del test Timed Up and Go. Tali parametri sono relativi alla durata temporale dell’intera esecuzione del test e di alcune sue fasi (sit-to-stand, turn, sit), oltre all’estrazione di indici relativi alla lunghezza dei passi e alla velocit`a angolare delle braccia. Il sensore Kinect viene combinato con un accelerometro posto sul petto del soggetto, il quale permette di identificare con pre-cisione gli istanti temporali dei passi nella fase di cammino e l’angolo di inclinazione del busto durante la fase di sit-to-stand. L’uso di dati provenienti da sensori diversi richiede lo sviluppo di un algoritmo di sincronizzazione basato sulla compensazione dei tempi di trasmissione e tempi di esposizione dei frame acquisiti da Kinect, i quali vengono stimati per entrambe le versioni del sensore e per le tre tipologie di segnale disponibili: RGB, infrarosso, profondit`a. L’algoritmo di sincronizzazione sviluppato pu`o essere utilizzato anche per altre applicazioni che possono beneficiare dell’utilizzo
congiunto di dati RGB-Depth ed inerziali, ad esempio nella rilevazione delle cadute. Vengono quindi proposti algoritmi di identificazione della caduta che sfruttano la stessa configurazione del Timed Up and Go test.
Per quanto riguarda il secondo argomento affrontato, l’obiettivo `e quello di effet-tuare la classificazione di azioni che possono essere compiute dalla persona all’interno di un ambiente domestico. Vengono quindi proposti due algoritmi di riconoscimento attivit`a che sfruttano i joints dello scheletro di Kinect. Il primo `e basato su Activity Feature Vectors (AFV), i quali contengono le posture pi`u importanti estratte da una sequenza di frame. Il secondo `e denominato Temporal Pyramid of Key Poses (TPKP), considera il modello bag of key poses e rappresenta la struttura dell’azione con una piramide temporale. Gli algoritmi sono stati valutati su dataset pubblica-mente disponibili, raggiungendo risultati confrontabili con lo stato dell’arte rispetto ai dataset CAD-60, KARD, MSR Action3D.
Contents
1. Introduction 1
1.1. Context . . . 1
1.2. Structure of the thesis . . . 3
2. Related works 5 2.1. Mobility assessment . . . 5
2.1.1. Wearable sensing . . . 6
2.1.2. Unobtrusive sensing . . . 8
2.1.3. RGB-D Datasets for mobility assessment . . . 10
2.2. Human action recognition . . . 11
2.2.1. Wearable sensing . . . 11
2.2.2. Unobtrusive sensing . . . 12
2.2.3. RGB-D Datasets for human action recognition . . . 23
3. Depth-based algorithm for side-view mobility assessment 29 3.1. Algorithm description . . . 29
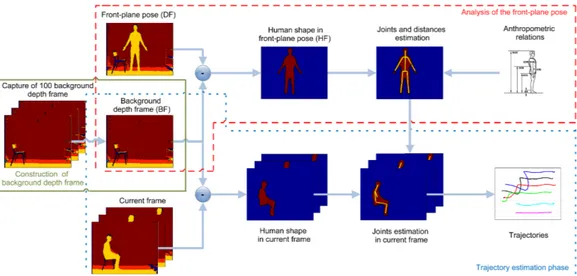
3.1.1. Construction of background depth frame . . . 30
3.1.2. Analysis of the front-plane pose . . . 31
3.1.3. Trajectory estimation phase . . . 36
3.2. Performance analysis . . . 39
3.3. Validation with stereometric system . . . 45
3.3.1. Data synchronization . . . 46
3.3.2. Results and discussion . . . 49
3.4. Conclusion . . . 54
4. Depth and IMU based algorithm for mobility assessment and fall detection 55 4.1. Synchronization algorithm . . . 57
4.1.1. IMU packets synchronization . . . 59
4.1.2. Kinect delay estimation . . . 60
Contents
4.2. Parameters estimation from TUG . . . 65
4.3. Fall detection . . . 71
4.3.1. Algorithms for fall detection . . . 71
4.3.2. Performance analysis . . . 74
4.4. Conclusion . . . 78
5. Human action recognition 79 5.1. HAR algorithm based on activity feature vectors . . . 80
5.1.1. Algorithm description . . . 80
5.1.2. Experimental results . . . 83
5.2. HAR algorithm based on temporal pyramid of key poses . . . 94
5.2.1. Algorithm description . . . 95 5.2.2. Parameter optimization . . . 99 5.2.3. Experimental results . . . 103 5.3. Conclusion . . . 111 6. Conclusion 113 6.1. Discussion . . . 113 6.2. Contributions . . . 115
6.3. Open issues and future works . . . 116
6.4. Publications . . . 118
Appendices 123 A.1. Kinect v1 capture software . . . 125
A.2. Kinect v2 capture software . . . 129
List of Figures
2.1. Setup of the 7 wearable sensors adopted for the iTUG test. . . 7 2.2. Setup of the sTUG test, with different detected events during the test
(Ms-Me), and actions evaluated during assessment (a1-a12). . . 9 2.3. Sampling of 3D points using the silhouette-based method. . . 15 2.4. Spatio-temporal cells representation of the action forward kick. . . . 16 2.5. Method for human action recognition using multiple features and
MKL technique. . . 17 2.6. Results of STIPs refinement using a bounding box extracted from
skeleton joints. . . 18 2.7. Human activity recognition algorithm constituted by three steps:
fea-tures detection, posture analysis and activity recognition. . . 20 3.1. Main steps of the proposed joints estimation algorithm working in
side view. . . 31 3.2. Depth maps and RGB images of the three main steps of the
algo-rithm. (a) construction of background depth frame; (b) analysis of the front-plane pose, for the estimation of the distances; (c) trajectory
estimation tracking (start position). . . . 32
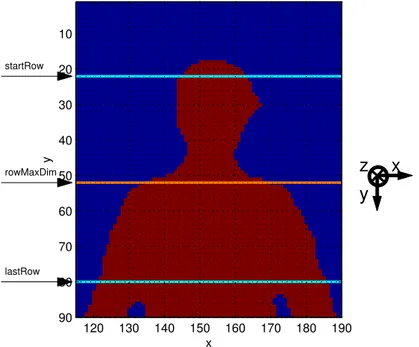
3.3. Upper body section of human shape. The algorithm identifies rowM axDim, which represents the top of the shoulders, searching within the inter-val bounded by startRow and lastRow. . . . 33 3.4. Elbow and hip identification procedure. Two rotating vectors,
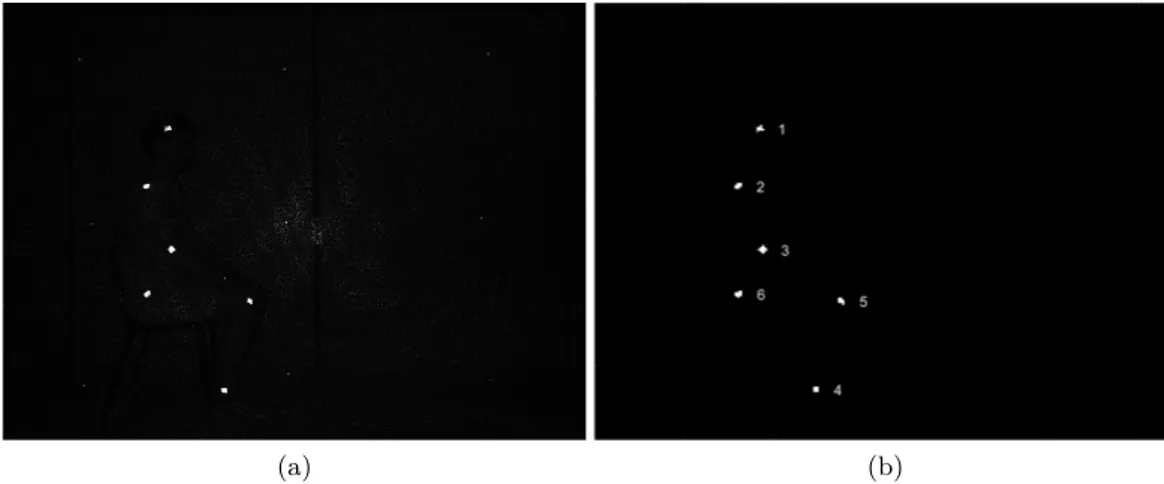
an-chored in the shoulder and knee joints, are exploited to identify elbow and hip coordinates respectively. . . 38 3.5. Depth frame in side-view where the six estimated joints are positioned. 39 3.6. (a) Infrared frame captured by the Kinect sensor showing a human
subject with IR active sticky markers identifying the joints. (b) Blobs extracted from the IR frame, associated to joints coordinates. . . 40 3.7. Sequence of frames extracted from one execution of the test. The
List of Figures
3.8. Head joint trajectories revealed by the analyzed algorithms. The tra-jectories are constituted by the (x, y) joint coordinates at each frame. 42 3.9. Magnitude values of the difference vectors Di computed for different
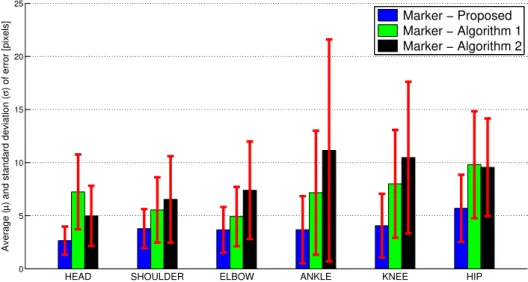
joints: (a) head, (b) shoulder, (c) elbow, (d) ankle, (e) knee and (f) hip, evaluated over a test execution. . . 43 3.10. Performance comparison of the Proposed algorithm, Algorithm 1 and
Algorithm 2 versus the marker-based system over 18 test realizations. 45 3.11. (a) Trajectory of head marker x-coordinate (Jhd,mx ). (b) Trajectory
of head joint x-coordinate extracted by Algorithm 1 (Jhd,A1x ). . . 47 3.12. Overlap of head marker/joint x-coordinate after interpolation and
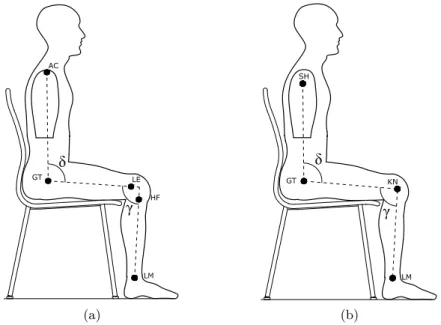
amplitude scaling. The overlap is realized before (a) and after (b) offset compensation. . . 48 3.13. Time axis in offset compensation. . . 49 3.14. (a) Anatomical landmarks used by the stereometric marker-based
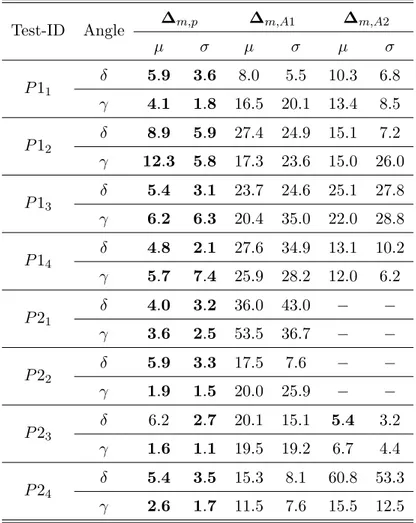
sys-tem. (b) Skeleton joints by markerless algorithms used for angles computation. . . 50 3.15. Trajectories of δ and γ angles, and absolute error in δ and γ
trajecto-ries between the Marker and the Proposed algorithms. (a,c,e) Data related to the best performance test (P 23). (b,d,f) Data related to
the worst performance test (P 12). . . 53
4.1. Setup for Timed Up and Go test. . . 56 4.2. System configuration with Kinect v2 and SHIMMER IMU connected
to the same PC through USB and Bluetooth connection. . . 57 4.3. (a) Delay times of Kinect and wearable device connected to a PC; (b)
same delay times after linear regression. . . 58 4.4. (a) Time of arrival at the PC for Kinect frames and IMU samples,
correlated to the their indices; (b) same delay times after linear re-gression performed on the timestamps of IMU samples. . . 59 4.5. Evaluation scheme of the RGB transmission time (tTX) (a) and RGB
exposure time (tEXP) (b) for Kinect v2. . . 61 4.6. SHIMMER LED pattern implemented to verify the accuracy of the
synchronization algorithm. . . 64 4.7. (a) Orientation of IMU and Kinect v2 for TUG test, (b) torso’s angle
θt computed from inertial data. . . 64 4.8. Scheme of TUG test, constituted by 5 phases. Different parameters
4.9. Point cloud and skeleton of a subject performing the TUG test. . . . 65 4.10. y-coordinate of head joint in a complete TUG test: Jhdy . . . 66 4.11. (a) Point cloud of the subject during the Walk phase of the test with
skeleton of lower body part. (b) x-axis acceleration data with skeleton steps and acceleration peaks. . . 67 4.12. (a) Positions of IMUs on the subject’s body. The orientation of x-axis
with respect to the gravity acceleration vector is given by the angle
θx. (b) Skeleton joints estimated by SDK 2.0 of Kinect v2. . . 71 4.13. Scheme of Algorithms 1 and 2 for fall detection. . . 72 4.14. Scheme of Algorithm 3 for fall detection. . . 73 4.15. Curves describing Jdif f (a) and dist0(b) during an EU pSit fall.
Per-son’s point cloud with detected floor plane (c). . . 77 4.16. (a) Acceleration and (b) orientation values computed by waist and
wrist mounted IMUs during an EU pSit fall. . . . 77
5.1. Main scheme of the HAR algorithm based on Activity Features Vector (AFV). . . 80 5.2. Subsets of 7 (a), 11 (b), 15 (c) joints, and the whole set of 20 joints (d),
considered to evaluate the algorithm. Green circles are the selected joints and red squares are the discarded ones. . . 84 5.3. Confusion matrix of the AFV algorithm obtained with
leave-one-actor-out cross-validation test on the whole KARD dataset. . . 87 5.4. Confusion matrices of the UTKinect dataset with only AAL related
activities. (a) Best results (P = 7). (b) Worst results (P = 15). . . . 92 5.5. Sequences of frames representing similar activities from Florence3D
dataset. (a) drink from a bottle, (b) answer phone and (c) read watch. 94 5.6. Confusion matrices of the Florence3D dataset with only AAL related
activities. (a) Best results (P = 11). (b) Worst results (P = 7). . . . 95 5.7. Confusion matrices obtained for AS1 (a), AS2 (b) and AS3 (c) of
MSR Action3D dataset, with P = 7 and K = 10. . . . 96 5.8. Main scheme of the HAR algorithm based on temporal pyramid of
key poses (TPKP). . . 97 5.9. Description of bag of key poses model. . . 98 5.10. Individual defined for evolutionary optimization. . . 100 5.11. Crossover operator aware of skeleton structure, applied to the features
List of Figures
5.12. The individual for coevolutionary optimization is obtained by con-sidering three sub-individuals belonging to different populations:
fea-tures, clusters and instances. . . . 102
5.13. Best subsets of joints selected with evolutionary optimization for AS1 (a), AS2 (b) and AS3 (c). Green circles represent the selected joints while red squares are used for the discarded ones. . . 105 5.14. Main scheme of the HAR algorithm based on temporal pyramid of
key poses (TPKP) modified for large-scale NTU RGB+D dataset. . 107 5.15. Original and rotated skeletons related to the action brushing teeth
captured from camera 1 (a-b) and camera 3 (c-d). . . 108 A.1. GUI of Skeletal viewer, the software developed to capture data from
Kinect v1. . . 126 A.2. GUI of Complete viewer, the software developed to capture data from
List of Tables
2.1. State-of-the-art datasets for action recognition based on depth or skeletal features, sorted from more quoted to less quoted according to
Google Scholar on January 3rd 2017. . . 22
2.2. Three subsets of actions from MSR Action3D dataset. . . 23
2.3. Three activity sets considered from KARD dataset. . . 25
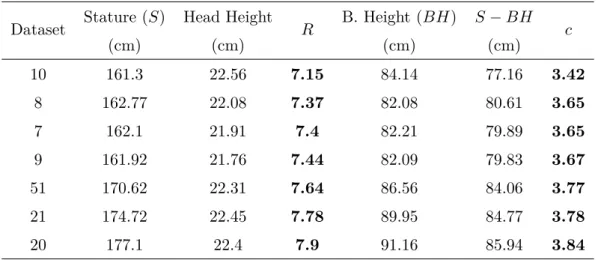
3.1. Estimation values for the c coefficient that considers anthropometric models. . . 36
3.2. Statistical parameters associated with differences Di, expressed in pixels. . . 44
3.3. Statistical indices of angle errors (in degrees). Errors greater than 100◦ are not included. . . 51
4.1. Kinect v1 and v2 exposure and transmission times. . . 63
4.2. Average values and confidence intervals for TUG indices. . . 70
4.3. Experimental protocol for fall detection algorithms. . . 75
4.4. Average results of the fall detection algorithms, in terms of Sensitivity, Specificity and Accuracy. . . 75
4.5. Accuracy of the three fall detection algorithms for each activity of the dataset. . . 76
5.1. Accuracy (%) of AFV algorithm compared to other using KARD dataset with different Activity Sets, and for Experiments A, B, C. . 85
5.2. Accuracy (%) of AFV algorithm compared to other using KARD dataset, with dataset split in Gestures and Actions, and for experi-ments A, B, C. . . 86
5.3. Precision (%) and Recall (%) of AFV algorithm compared to other, using the whole KARD dataset and leave-one-actor-out cross-validation setting. . . 86
List of Tables
5.4. Precision (%) and Recall (%) of AFV algorithm for different envi-ronments of CAD-60 and leave-one-actor-out cross-validation setting, with P = 11 and K = 25. . . . 88 5.5. Global Precision (%) and Recall (%) of AFV algorithm for CAD-60
dataset and leave-one-actor-out cross-validation setting, with different subsets of joints, compared to other works. . . 89 5.6. Global Accuracy (%) of AFV algorithm for UTKinect dataset and
LOOCV setting, with different subsets of joints, compared to other works. . . 91 5.7. Global Accuracy (%) of AFV algorithm for Florence3D dataset and
leave-one-actor-out cross-validation setting, with different subsets of joints, compared to other works. . . 93 5.8. Accuracy (%) of AFV algorithm for MSR Action3D dataset and
leave-one-actor-out setting, with different subsets of joints and activities. . 95 5.9. Average accuracy (%) of AFV algorithm for MSR Action3D dataset
and leave-one-actor-out setting, compared to other works. . . 96 5.10. Accuracy (%) and parameter values obtained considering Random
se-lection, Evolutionary and Coevolutionary optimizations by the TPKP algorithm with MSR Action3D. . . 103 5.11. Accuracy (%) obtained by the TPKP algorithm, compared with other
works evaluated on MSR Action3D with the cross-subject test. . . . 106 5.12. Accuracy (%) obtained by the proposed method on temporal pyramid
of key poses (TPKP), with different clusters (K) and different levels of the temporal pyramid (L). . . . 109 5.13. Comparison of different methods evaluated on NTU RGB+D dataset
in terms of recognition accuracy (%). Results are ordered considering the accuracy of the cross-subject test. . . 110 A.1. Performance obtained by Skeletal viewer on a laptop with 16 GB of
RAM and standard HDD considering different streams. . . 128 A.2. Performance obtained by Complete viewer on a laptop with 16 GB of
Chapter 1.
Introduction
1.1. Context
Population aging is defined as the increasing share of older people, aged 60 and over, in the population, and it is a growing phenomenon in modern society [1]. Globally, life expectancy at birth will rise from 70 years in 2010 − 2015 to 77 years in 2045 − 2050 and to 83 years in 2095 − 2100. The aging process is most advanced in high-income countries. The country where most of the aged people live is Japan, where 33% were aged 60 years or over in 2015. Italy and Germany are quite close (28%) and Finland is the third one with a percentage of 27% [2]. This demographic change has an impact also on the economic side, and to support an aging population has therefore become a priority for many governments [3].
A new paradigm in information technology is named Ambient Intelligence (AmI), and it is “aimed at empowering people’s capabilities by means of digital environments
that are sensitive, adaptive, and responsive to human needs, habits, gestures, and emotions” [4]. AmI tools can be adopted to improve quality of life in different
environments, for example sensors can acquire data in the house, maybe related to the presence of people, adapt the environment according to the user preferences and also predict their needs and behavior. In addition to home environment, AmI has many other potential applications in office, transport and industry, and can be also applied in safety systems and e-health domain [5].
The application of information technology and AmI to the aging population brings to Active and Assisted Living (AAL), also known as Ambient Assisted Living, which is aimed to develop solutions to help elderly people to age at home. The objectives of AAL have been identified as [6]:
• extending the time people can live in their preferred environment by increasing their autonomy, self-confidence and mobility;
Chapter 1. Introduction
• supporting the preservation of health and functional capabilities of the elderly, promoting also a better and healthier lifestyle for individuals at risk;
• enhancing security, preventing social isolation and supporting the preservation of the multifunctional network around the individual;
• supporting families and caregivers;
• increasing the efficiency and productivity of used resources in the ageing soci-eties.
European Union is fostering research on AAL through its main research and in-novation programme: Horizon 2020 (H2020). During the first four years of H2020, EU has invested 2e billion in the challenge “Health, Demographic Change and
Well-being”, which is part of the third pillar of Horizon 2020 named Societal Challenges.
In addition to this, EU finances also projects through the AAL Joint Programme, which is set to bring new ICT-based products, solutions and service concepts onto the market within two to three years of the end of the funding period. Some projects that received funding from this programme were able to develop products that are close to be released on the market. Mylife project [7] is addressed to elderly people with reduced cognitive function and aims to provide simple and intuitive services that are adapted to their individual needs and wishes. HELP project [8] has been funded by AAL programme to support people with Parkinson Disease. In particular, the idea is to have wearable and home devices to monitor health parameters and body activity, and to automatically release a controlled quantity of drugs. Other projects are in the field of assistive robotics, like Domeo [9], or aim to support people with mental disorders, such as Home4Dem [10].
Tools and algorithms that can be applied to AAL and smart environments are in-teresting and challenging not only from the commercial point of view, but also from the academic side. Researchers working on AAL domain are usually concentrated on algorithms or applications. Rashidi and Mihailidis [11] reviewed algorithms for Human Activity Recognition (HAR), also known as Human Action Recognition, Context Modeling, since AAL systems represent different types of context informa-tion, Anomaly Detecinforma-tion, which aims to find patterns in data that do not conform to the expected behavior, Location and Identity Identification, which allows to track and to monitor elderlies, and Planning, to schedule daily plans helping dementia patients to carry out their daily activities. On the other hand, applications may belong to different areas, such as Monitoring of health parameters or detection of
dangerous situations, Wandering Prevention, providing alarms for unexpected ac-tions or navigation assistance tools or Cognitive Orthotics tools, which can be used for example in case of medication management.
In the aforementioned scenario, the objectives of this thesis include the adoption of RGB-D (Depth) sensor, i.e. Microsoft Kinect, to address different tasks. The choice of a vision-based sensor as the main source of data is first of all motivated by the fact that, differently from wearable sensors, it is less obtrusive and does not rely on the user that needs to wear the device and to charge the battery. Comparing the Kinect device with other unobrusive sensors, such as environmental sensors, the former one allows to have more information about the context, and also to extract the human behaviour from his/her movements and not from the signal generated by the interaction with the environment.
The first objective of this thesis is to develop an application which aims to extract parameters for mobility assessment of a human subject. Kinect is adopted to extract the coordinates of skeleton joints and to calculate some useful indices from a side-view mobility test. In order to increase the reliability of the estimation, being aware of an higher obtrusiveness level of the system, an Inertial Measurement Unit (IMU) is considered jointly with the RGB-D sensor. Synchronization algorithms have been developed to correctly associate samples from different sources and mobility assess-ment and fall detection applications have been impleassess-mented. The second objective of the thesis is to propose algorithms which can be generally applied to address the HAR task. The input data are represented by skeleton coordinates captured by a RGB-D sensor, and organized in publicly available datasets.
1.2. Structure of the thesis
The thesis is organized in six chapters, which describe and detail the proposed approaches for human action recognition and mobility assessment using RGB-D sensors. The thesis has the following structure.
Chapter 2 reviews the state-of-the-art about the two main topics addressed: mo-bility assessment and human action recognition. Regarding the former one, the main tool used to evaluate the mobility, and often to infer the risk of falling, is the Timed Up and Go test. Different techniques proposed to instrument the test are presented, with a focus on video-based approaches. Regarding the second main topic, different technologies used for HAR are also reviewed, considering in more detail algorithms based on RGB-D data. The publicly available datasets that can be used to evaluate
Chapter 1. Introduction
the performance of HAR algorithms and mobility assessment systems are listed. Chapter 3 describes an algorithm to extract the coordinates of six skeleton joints from depth frames captured by Kinect during the sit-to-stand movement followed by some steps. The algorithm works in side view and the performance in the estima-tion of joint coordinates is compared with other markerless algorithms considering infrared markers as reference. A further validation process is performed for the sit-to-stand phase using a ground-truth represented by a stereometric system.
Chapter 4 details the instrumented Timed Up and Go with Kinect and a wearable IMU. The data fusion of multimodal data has allowed to extract different indices not only related to timing, but also to gait and posture. A synchronization algorithm based on the compensation of delay times affecting Kinect frames and acceleration samples has been developed to correctly associate data from different sources. The same setup can be used also for fall detection, and three different algorithms based on wearable and RGB-D data fusion are described. Simple and effective fall detection algorithms can discern among different types of falls and actions with an accuracy higher than 90% on a dataset of 264 sequences collected from 11 young subjects.
Chapter 5 presents algorithms for human action recognition based on 3D joint coordinates extracted from Kinect. Different features representation methods have been investigated, providing also experimental results on several RGB-D datasets. The first proposed algorithm is based on Activity Feature Vectors (AFV) containing the most representative postures of a sequence of frames. The second algorithm, based on Temporal Pyramid of Key Poses (TPKP), adopts a bag of key poses model and introduces a temporal pyramid to represent the structure of the action. The parameters required by the TPKP algorithm are optimized using evolutionary com-putation. The performance evaluation of AFV algorithm has been carried out on different RGB-D datasets, resulting in precision and recall higher than the state-of-the-art of about 10% on KARD dataset and comparable to it on CAD-60 dataset, where the figures are a precision of 93.9% and a recall of 93.5% considering the leave-one-actor-out cross-validation test. The TPKP algorithm has achieved results comparable to the state-of-the-art on MSR Action3D dataset, i.e. an accuracy of 95.14% on the cross-subject test.
Conclusions are drawn in Chapter 6 where, after clarifying the contribution of this work, some future research directions are identified and a list of publications is provided. Finally, Chapter A in appendix describes two software developed to collect RGB-D datasets using Kinect v1 and Kinect v2, which are now publicly available.
Chapter 2.
Related works
The aim of this chapter is to review and discuss the most relevant works in two fields that can be applied to Active and Assisted Living scenario: mobility assess-ment, especially the estimation of parameters to classify the risk of falling, and the recognition of human actions. An overview of the techniques that can be used to develop these solutions is provided, then the discussion is focused on solutions based on vision and, more in details, RGB-D sensors.
2.1. Mobility assessment
Due to the global increasing of age, the problem of falls in elderly people has to be considered in our society and many researchers started working on fall detection developing wearable or not-wearable systems [12]. A fall event, especially if experi-enced by an elderly, may lead to immediate physical injuries such as cuts, abrasions, and fractures of bones, but also to psychological consequences. People are afraid of falling again and they may reduce the level of their physical activity, leading also to functional decline and depression [13]. Due to these consequences, the necessity to estimate the mobility grade of the person, and thus the risk of falling, is as important as the detection of the fall.
Since the fall risk assessment is performed only by observations of the test by healthcare personnel, many research works in the last years have been developed to extract some important parameters from clinical test, to the aim to help clinicians in the assessment process. Tools for gait analysis may be based on wearable sensors or on not-wearable devices, which can be vision sensors (marker-based or markerless systems) or pressure sensors placed on the floor [14]. One of the most used test to evaluate the fall risk is the Get Up and Go test [15]. This test requires to the patient to stand up from a chair, walk for a short distance (about 3 meters), turn, walk back to the chair and sit down. The measure of the time required by the
Chapter 2. Related works
subject to perform the whole test, introduced in the Timed Up and Go (TUG) test [16], is already a measure of its movement ability and therefore of its risk of falling. In fact, if the subject takes more than 30 seconds to perform the test, she is classified as a subject with mobility problems. However, some parameters can be measured considering sensors monitoring the test, such as angles of different joints, step width, cadence, and many others [14]. Sprint et al. [17] reviewed the works which proposed to instrument the TUG, distinguishing among the technologies adopted by the different solutions.
2.1.1. Wearable sensing
A large number of studies proposed an instrumented version of the TUG using wear-able sensors equipped with sensing and communication and/or storage capabilities. They usually integrate an Inertial Measurement Unit (IMU) capturing acceleration samples and a communication interface to send data to a server and/or a memory card to store data. Greene et al. [18] proposed to use two IMUs attached on the an-terior of each shank of the subject. In addition to acceleration data, they evaluated also the time required to complete the test using a stopwatch. Temporal gait pa-rameters are extracted from the identification of heel-strike and toe-off events, and are considered in addition to other temporal indices (walk time, cadence, turn time, ...). Angular velocity parameters were computed during some phases of the test and help in the definition of the statistical model to extract differences between subjects who experienced a fall and those who did not. A mean test accuracy of 76.8% was achieved for retrospectively estimating falls risk in a population of 349 elderly adults. A waist-mounted accelerometer has been considered in [19]. The authors proposed a model to evaluate the fall risk using three tests to extract useful parameters: TUG, Alternate-Step Test (AST), where the subject is asked to alternatively place each foot onto and off of a platform, and the sit-to-stand with 5 repetitions, consisting in the movement of standing up and sitting down with arms folded. Regarding the TUG, they extracted timings from different phases of the test and also some fea-tures related to acceleration data calculated within specific intervals. The fall risk evaluation has been carried out considering a linear least squares model built from a selected subset of features extracted. SankarPandi et al. [20] proposed the use of a wrist-mounted accelerometer during TUG execution to classify disability levels. A number of 40 features were extracted from acceleration data and then processed using a selection algorithm. With a population of 321 elderlies, the algorithm has been able to estimate the disability level using the optimal subset of features with
Figure 2.1.: Setup of the 7 wearable sensors adopted for the iTUG test (reprinted from [21]).
an accuracy of 62.16%, outperforming the classification achievable using only the time required to complete the test, which was 39.10%. Alternatives to the standard TUG, such as iTUG [21], have been also proposed. The authors exploited seven inertial sensors attached on the forearms, shanks, thighs and sternum, as shown in Figure 2.1, for the early detection of Parkinson’s disease (PD). The walking path has been extended from 3 to 7 meters, extracting several parameters from sit-to-stand, gait, turning and turn-to-sit phases. For example, during the sit-to-stand phase, its temporal duration, the range of motion of the trunk, together with the average and peak angular velocity of trunk are considered. A 7 meters iTUG test has been considered also in [22]. A smartphone which integrates a tri-axial accelerometer has been placed on the lower back of the body and used to extract 28 parameters in the three sections of the iTUG: (sit-to-stand, gait, stand-to-sit). Dimensionality reduc-tion is implemented considering Principal Component Analysis (PCA). A number of 10 principal components, which can be used for classification, were selected consid-ering a dataset with 49 healthy adult subjects of different ages (in the range 28-87). Milosevic et al. [23] proposed a smartphone application (sTUG) for the evaluation of the iTUG. The application exploits accelerometers and gyroscope signals coming from the smartphone attached on the chest or belt. The extracted parameters are mainly related to the durations of the different phases of the test, even if angular velocities and maximum inclination of trunk angle during the sit-to-stand are also calculated. The Android application provides an immediate feedback to the user showing the calculated indices and allows to upload the results into the medical
Chapter 2. Related works
record. Silva and Sousa [24] presented a smartphone-based iTUG where the test has been segmented in three phases (stand up, walk forward and turn around) and the features extracted from each segment are statistical measures and frequency-based metrics obtained from the accelerometer magnitude signal. Considering a popula-tion of 18 older adults, the authors found that the walking and turning components were the most significant ones to differentiate between a higher risk and a lower risk person. Another wearable system, which is more flexible because it does not require a fixed test distance, has been proposed in [25]. The test can be executed from an iPhone or iPad and exploits data from 5 sensors placed on foot, shin and thigh of the patient, and equipped with triaxial accelerometer, gyroscope and magnetome-ter, and being able to provide quaternion representing orientation. The algorithms can calculate angles of knee and ankle which are validated with a marker-based VICON system. Gait parameters, such as stride length, the total distance traveled and average velocity are also extracted, together with the total time of the test.
2.1.2. Unobtrusive sensing
Researchers proposed also to instrument the TUG using unobtrusive technologies. Some research works considered the use of sensors placed on the floor monitoring the parameters related to the gait. Demura et al. [26] proposed also to place obstacles along the path and to evaluate different timing parameters in a modified TUG called TUGO (TUG test with an obstacle), such as the total time, going time or turn time, in addition to the single support time before and after the obstacle. In other cases, the floor sensor is adopted to compare the performance of other systems, such as video-based solutions. Baldewijns et al. [27] validated their method to extract gait information using Kinect depth data with GAITRite walkway. Results on 19 tests showed an average error of 2.48 cm for the step length and 0.24 seconds for the step time.
Other researchers working on video processing proposed solutions to extract ob-jective parameters from TUG. In [28], two webcams have been used to capture the side and back view of the subject performing the test. Three categories of param-eters are calculated, including: time of the walk phase, number of steps, stability into and out of the turn. The subject’s silhouette has to be extracted from the video using background subtraction techniques and filtering methods to remove some ar-tifacts. Then, most of the walking indices are estimated from the tracking of the centroid of head silhouette, while the steps are counted looking at the acceleration of the leading foot. Two calibrated cameras were also used in [29], where a 3D human
Figure 2.2.: Setup of the sTUG test, with different detected events during the test:
Ms-Me, and actions evaluated during assessment: a1-a12(reprinted from
[30]).
model is reconstructed to evaluate the 180◦ turning movement. The turning time and the number of turning steps are extracted from 7 people aged between 25 and 88. The authors found that their method is able to correctly estimate the turning time, with a good match if compared to the expert rating.
With the availability of RGB-D devices, researchers started working also with these sensors. Lohmann et al. [30] proposed an approach called Skeleton Timed Up and Go (sTUG) using 2 kinect sensors: one records the front of the action area (dashed area in Figure 2.2) and the other one records the dotted area in Figure 2.2. A number of 9 events are extracted from the trajectories of skeleton joints given by the two calibrated sensors and durations of different phases are computed. Good results have been obtained from tests with 13 people comparing the time durations with a stopwatch. Kitsunezaki et al. [31] proposed to measure the time required to perform TUG with a Kinect placed at a distance of 4 meters from the chair where the subject starts the test. Considering 6 people and 3 executions for each person they found an average difference of 0.33 seconds from the value measured by the examiner. The same authors developed also a timed 10-meter walk test with two synchronized Kinect and a software to detect timing parameters where a person crosses a line. In this test, the same number of executions gave a difference of 0.15
Chapter 2. Related works
seconds between the two sets of results (examiner and Kinect). Hassani et al. [32] proposed to extract some parameters from skeleton joint positions. In particular, the author were focused on two sub-parts of the TUG: the forward-upward (STS) and the downward-backward (BTS) displacements of the shoulder in the sagittal plane. Within these movements, they considered: movement duration, shoulder path curvature, trunk angle and ratio between vertical phase duration and horizontal phase duration. Then, the total duration of the TUG is computed as the time interval between the start of the forward phase and the end of the backward phase. Results on 10 healthy young subjects showed that, in 70% of the cases, the mean value of ratio, trunk angle and duration are within their confidence intervals, which means that the system provides reliable measurements and the variability is reduced among different subjects. The same authors improved the method by estimating sitting posture with a linear Support Vector Machine (SVM) [33]. Considering two groups of people, young and elderly, the authors noticed that the trunk angle in young group was more than twice angle in elderly group: 16.76◦ and 35.81◦ during STS movement, and this parameter can show the effect of aging. Recently, Gianaria et al. [34] used Microsoft Kinect v2 to extract some parameters form TUG test: TUG test total time, walking time (τ ), covered distance, walking speed (β), swing time, double support time, torso inclination angle. Some tests performed on 30 elderly and 6 young people provided meaningful results. For example, walking-related parameters were β = 0.75 m/s and τ = 9.31 s for seniors, β = 0.92 m/s and
τ = 7.16 s for youth.
2.1.3. RGB-D Datasets for mobility assessment
In order to foster the research in this field, Leightley et al. [35] recorded a dataset with health-related actions, called Kinect 3D Active (K3Da). The dataset includes motion collected from young and elderly people, aged between 18 and 81. With data captured from 54 people (32 men and 22 women) this is the largest RGB-D dataset containing clinically supported motion sequences, ensuring also high inter-individual variability in age and physical capabilities. The RGB-D device used is the Kinect v2, skeleton data (25 joints at 30 fps) and depth frames (512 × 424 at 30 fps) are the provided data. Timed Up and Go is included in the tests provided in the K3Da dataset, and samples are collected with the sensor fixed horizontally to a tripod at a height of 0.7 m in a controlled environment, without room furniture and standardised room lighting.
2.2. Human action recognition
Human action recognition is a research topic which has been investigated a lot in the last years. The main reason is that HAR may enable different applications, from human computer interaction to video surveillance, including also assistive applica-tions, such as the monitoring of people living alone. HAR in AAL scenario can be implemented considering different technologies, which may involve wearable inertial sensors, ambient/environmental sensors, acoustic sensors, radio-based techniques or vision-based devices.
2.2.1. Wearable sensing
Wearable sensors can be placed at different positions and the generated signals, which are related to the movements, can be used to distinguish among a set of activities. Data from wearable devices for HAR can be handled with two main approaches. Data can be captured by a smartphone, and the same device can be also exploited for classification purpose [36]. A more general architecture involves sensors integrated on small devices equipped with communication interfaces and able to send data to an integration device, represented by a smartphone or a laptop, that can store and process data or send them to a remote server [37]. Considering only inertial data, many different features have been proposed, and the inclusion of the features in the classification model has to be evaluated to reduce the complexity of the model and to increase the classification accuracy due to a better separation among the classes [38]. Wearable sensors are quite cheap and, if compared for example to cameras, they produce a lower amount of data, enabling a processing step with less computational resources. On the other hand, one of the main issues about the use of wearable sensors is their placement [39]. The sensors are usually placed on the sternum, lower back, and waist. Waist-placement is closer to the center of mass of the human body and can better represent most human motions. However, the placement should take into account also the movements involved in the set of activities that has to be recognized. In fact, if the use of a waist-placed accelerometer can efficiently classify activities and resting positions involving the whole body, such as walking, sitting, lying and also falls [40], the inclusion in the dataset of activities including upper body movements, such as brushing teeth and working at computer, requires a different placement of the sensor, for example on the wrist [41]. Finally, the classification performance of an activity recognition algorithm can be increased considering more sensors placed on the human body [42], increasing also the level
Chapter 2. Related works
of obtrusiveness.
2.2.2. Unobtrusive sensing
Unobtrusive environmental sensors may be exploited to recognize human activities. However, since these techniques are based on data acquired by sensors placed on objects, the activities are not directly related to the human movement, but they are mostly related to the interaction of the human with the object or the environment. The human behaviour can be inferred from the object interaction [43]. State-changes sensors may be installed on doors, windows, cabinets, and also on some objects such as owens, fridges or washing machines, and can therefore reveal activities such as preparing lunch, toileting or doing laundry [44]. In addition to state-changes sensors, passive infrared sensors (PIRs) can be used to detect the presence of people within an environment, and the fusion of the data can increase the level of confidence in the activity estimation process. Ord´o˜nez et al. [45] proposed different machine learning algorithms to classify datasets made of 10 activities using three categories of sensors: PIR sensors to detect people presence, state-changes sensors to detect opening and closing activities of doors and cupboards and float sensors to detect the flushing of toilet. Break-beam sensors to detect motion and chair-mounted pressure mats to detect static occupants can also be employed in home environment [46]. Despite the big advantages of being completely unobtrusive and privacy preserving, HAR systems based on environmental sensors require a not negligible time to be installed, a limited amount of information can be inferred from the sensors, and do not detect dangerous situations, such as falls.
Another unobtrusive technology adopted for human activity recognition in home environment is based on microphones to detect sounds. The idea is similar to am-bient sensors, and the events are detected considering the sound generated by the interaction between people and objects or the environment. Some activities, such as chatting or reading newspapers can be easily detected by their sounds, and different activities at a dining table can be categorized using only a microphone, recognizing also the type of food or drink [47]. Considering more microphones placed in different positions of the apartment, some activities such as vacuuming, blender mixing or events as oven alarm or door slam can be detected [48]. Multiple acoustic sensors may be set up as a Wireless Sensor Network (WSN), considering that the main chal-lenges can be the limited processing power and working memory for the end devices. However, for indoor context, feature extraction schemes with low complexity may be equally effective as the high-cost ones [49]. Clinically relevant activities may be also
detected considering an acoustic WSN to efficiently monitor elderly people. Vuegen et al. [50, 51] proposed a network of 7 nodes to be placed in 3 rooms to detect 10 different activities. Being particular ambient sensors, the use of acoustic sensors has the advantage of being privacy preserving, and, even if they may be subject to noise, they can be used to detect also falls [52]. Considering an array of microphones, it is possible to consider only sounds located below a certain height from the floor, reducing the false alarm rate and estimating also the 3D sound location [53].
An alternative activity recognition method is based on radio techniques, which take advantage of body attenuation or characteristics of channel fading to recognize human activities or gestures [54]. Even if no physical sensing module is required, the user may be asked to wear a wireless transceiver implementing ZigBee, WiFi or RFID standards. Some methods, on the other hand, can work without any device on the human body, exploiting for example the WiFi links established between smart appliances and the access point [55] or FM signal strength which is correlated with the receiver’s position [56]. Micro-Doppler radar signatures represent another solu-tion and, through the usage of commercial radar motes, a small set of activities, such as walking, running, and crawling, can be discriminated with a high classification rate [57].
Vision-based sensors have been extensively used for human activity recognition. Vision sensors can be adopted in a outdoor environment, for surveillance applica-tions, as well as in a indoor scenario, where they can provide more information about the environment with respect to other sensors. Many different reviews on vision-based HAR techniques have been published in the past, each of which proposing its own taxonomy and focusing on different aspects. At the beginning of the recog-nition of human motion, Aggarwal and Cai [58] provided a review covering three areas: motion analysis based on human body parts, tracking human motion (with-out using the body parts) from a single view or multiple perspectives, recognizing human activities from image sequences. Wang et al. [59] identified three major issues in the process of human motion analysis: human detection, mainly constituted by motion segmentation and object classification, human tracking and human behav-ior understanding. Turaga et al. [60] proposed to distinguish between actions and activities. They labelled as actions the movements characterized by simple motion patterns, usually performed by one person, such as bending, walking, swimming. Activities are more complex and involve more people who could be interacting with each other in a constrained manner, such as two persons shaking hands or a football team scoring a goal. However, different definitions of actions and activities have
Chapter 2. Related works
been proposed by others. Chaaraoui et al. [61] discern between action and activity considering the degree of semantics ad the amount of time required to perform the analysis. Considering this approach, actions are movements with a duration of sec-onds, such as sitting, standing or walking. Activities are made up a set of actions in a time frame from tens of seconds to units of minutes. Example of activities can be cooking, taking a shower or making the bed. Even if HAR in the context of AAL is often related to Human Activity Recognition, in this thesis, considering the discrimination between actions and activities proposed in [61], the work is mostly concentrated on shortest movements and with a low level of semantics, thus the acronym HAR can be expressed as Human Action Recognition.
The recent release of low cost depth sensors fostered the recognition of human motion using 3D data. Depth information helps to overcome some issues in human action recognition based on RGB images, such as the presence of shadows, light reflections, similarity of colors between foreground and background which may affect people silhouette segmentation [62]. Aggarwal and Xia [63] divided the methods to obtain 3D data into three different categories: marker-based motion capture systems, stereo images or range sensors. In addition to the technology adopted to obtain depth data, they organized the reviewed methods into five categories considering the features: features from 3D silhouettes, features from skeletal joint or body part locations, local spatio-temporal features, local occupancy patterns, and 3D scene flow features.
In this work, the review of previously published methods based on RGB-D sensors is organized considering the data exploited by the HAR algorithm. Some methods may exploit only depth or skeleton data, others can be based on the fusion of different input data, combining for example depth frames or RGB images with skeleton joints. Some methods were aimed to extract features from depth data, such as [64], where the main idea is to evaluate spatio-temporal depth subvolume descriptors. A group of hypersurface normals (polynormal), containing geometry and local motion infor-mation, is extracted from depth sequences. The polynormals are then aggregated to constitute the final representation of the depth map, called Super Normal Vector (SNV). This representation can include also skeleton joint trajectories, improving the recognition results when people move a lot in a sequence of depth frames. Depth images can be seen as sequence features modeled temporally as subspaces lying on the Grassmann manifold [65]. This representation, starting from the orientation of the normal vector at every surface point, describes the geometric appearance and the dynamic of human body without using joint position. Other works proposed holistic
Figure 2.3.: Sampling of 3D points using the silhouette-based method for HAR (reprinted from [68]).
descriptors: the HON4D descriptor [66], which is based on the orientations of normal surfaces in 4D, and Histogram of Oriented Principal Components (HOPC) descrip-tor [67], which is able to represent the geometric characteristics of a sequence of 3D points. HOPC descriptor can be also used in a local setting, where local HOPC are extracted at candidate spatio-temporal keypoints (STKP). A HOPC quality factor is defined to rank the STKPs and to discard the low quality ones. Depth data make easier the process of silhouette extraction and some algorithms for action recognition exploiting 3D silhouettes have been proposed. Li et al. [68] developed a method that represents postures considering a bag of 3D points extracted from depth data, shown in Figure 2.3. Only a small set of 3D points is considered, and a projection method has been developed to sample the representative 3D points by performing planar projections of the 3D depth map and extracting the points that are on the contours. The temporal relationship among the postures is modeled using an action graph, where each node represents a salient posture. Chaaraoui et al. [69] proposed to use the points belonging to the contour of the human silhouette, and to extract
Chapter 2. Related works
Figure 2.4.: Spatio-temporal cells representation of the action forward kick (reprinted from [71]).
features from them. The learning procedure consists in the extraction of the key
poses and the action, represented as a set of feature frames, is then constituted
by known characteristic poses. Other interesting features are represented by local Spatio Temporal Interest Points (STIPs) applied to depth data [70]. Depth-based STIPs include a noise suppression scheme which can handle some characteristics of the depth images, such as the noise in the borders of an object, where the depth values show a big difference in the transition from foreground to background, or the noise given by errors in the depth estimation algorithm, which can result in some gaps in the depth map. In [70], the use of depth STIPs is combined with a descrip-tor containing the spatio-temporally windowed pixels within a 3D cuboid centered at the interest point. A codebook is built by clustering the identified cuboids and an action can be represented as a sequence of elements from the codebook. Vieira et al. [71] proposed to divide the spatio-temporal space into multiple segments. A 4D grid is obtained, where a saturation scheme is employed to enhance the role of the cells corresponding to the moving parts of the body. Figure 2.4 shows the spatio-temporal cells for the action forward kick, which is divided in three temporal segments, and all the frames are placed together in the same space. Red points are those in the cells with more than a fixed amount of points. The occupancy patterns are then extracted and Principal Component Analysis (PCA) is used as a dimensionality reduction method.
Other works exploit both depth and skeleton data, for example the 3.5D
rep-resentation combines the skeleton joint information with features extracted from
Figure 2.5.: Method for human action recognition using multiple features and MKL technique (reprinted from [73]).
are extracted using an extended Independent Subspace Analysis (ISA) algorithm by applying it only to local region of joints instead of the entire video, thus improving the training efficiency. Depth and skeleton features can be combined at different lev-els of the activity recognition algorithm. Althloothi et al. [73] proposed a method where the data are fused at the kernel level, instead of the feature level, using the Multiple Kernel Learning (MKL) technique which combines and utilizes multiple kernels in the process of learning kernel based classifiers. As shown in Figure 2.5, the 3D silhouette structure is described using shape features, extracted from the depth map using spherical harmonics representation. The motion features are rep-resented by distal limb segments extracted from the joint positions. The initial frame is taken as a reference and each distal limb segment is described by the orientation and translation distance with respect to it. On the other hand, fusion at the feature level of spatiotemporal features from depth data and skeleton joints is performed in [74]. The spatiotemporal features represent local motions at different 3D interest points, and the skeleton joints features represent spatial locations of body parts. In such a work, several spatiotemporal interest point detectors, such as Harris 3D [75], ESURF [76], HOG3D [77] have been fused using regression forests with the
skele-Chapter 2. Related works
Figure 2.6.: Results of STIPs refinement using a bounding box extracted from skele-ton joints (reprinted from [80]).
ton joint features consisting of posture, movement and offset information. Features extracted from human silhouette can be concatenated with normalized skeleton fea-tures, to improve the recognition rate performing a feature-level fusion [78]. The simple feature concatenation as a fusion technique has been allowed by the very low-dimensional features: the resulting increased size of the final feature is not critical. The feature concatenation has been used to keep all the characteristic information provided by both feature types.
Skeleton joints extracted from depth frames can be combined also with RGB data. Luo et al. [79] proposed a human action recognition framework where the pairwise relative positions of joints and Center-Symmetric Motion Local Ternary Pattern (CS-Mltp) features from RGB are fused both at feature level and at classi-fier level. STIPs are typically used in activity recognition where data are represented by RGB frames. This approach can be also extended to depth and skeleton data, combining the features with Random Forests [80]. Different combinations of detec-tors and descripdetec-tors are considered, and the combination of depth STIP features with RGB videos or skeleton joint positions may help to have a better understand-ing of depth-based features, enhancunderstand-ing the recognition performance, as shown in
Figure 2.6. Instead of using spatio-temporal features, another approach for human activity recognition relies on graph-based methods for sequential modeling of RGB data. This concept can be extended to depth information, and an approach based on coupled Hidden Conditional Random Fields (cHCRF) model, where visual fea-ture sequences are extracted from RGB and depth data, has been proposed [81]. The main advantage of this approach is the capability to preserve the dynamics of individual sequences, even if the complementary information from RGB and depth are shared.
Other works simply rely on Kinect skeleton data because they represent a com-pact and effective description of the human body. In many cases they can achieve performance very close to the algorithms exploiting multimodal data, and some-times they also perform better than those solutions. Devanne et al. [82] proposed to represent human actions by spatio-temporal motion trajectories in a 60-dimensional space since they considered 20 joints, each of them with 3 coordinates. Then, an elastic metric, which means a metric invariant to speed and time of the action, within a Riemannian shape space, is employed to represent the distance between two curves. Finally, the action recognition problem can be seen as a classification in the Riemannian space, using a k-Nearest-Neighbor (k-NN) classifier. Other skeleton representations have been proposed. The APJ3D representation [83] is constituted starting by a subset of 15 skeleton joints, from which the relative positions and lo-cal spherilo-cal angles are computed. After a selection of key-postures using k-means clustering algorithm, the action is partitioned using a reviewed Fourier Temporal Pyramid [84] and the classification is made by Random Forests. Another joint rep-resentation is called HOJ3D [85], where the 3D space is partitioned into n bins and the joints are associated to each bin using a Gaussian weight function. Thus, a pos-ture is represented by an n-bin histogram and Linear Discriminant Analysis (LDA) is performed to extract the dominant features, having a better discrimination between different classes. Then, a discrete Hidden Markov Model (HMM) is employed to model the temporal evolution of the postures, attained using a clustering algorithm. In addition to k-means clustering, the use of sparse coding has been also proposed for the creation of the codebook. In particular, Luo et al. [86] proposed the DL-GSGC scheme, where the discriminative capacity of the dictionary is improved by adding group sparsity and geometry constraints to the sparse coding representation. A temporal pyramid is adopted to model the temporal information and a linear SVM is chosen as the classification algorithm. Wang et al. [87] firstly considered relations among body joints in the spatial domain, by grouping joints into different
Chapter 2. Related works
Figure 2.7.: Human activity recognition algorithm constituted by three steps: fea-tures detection, posture analysis and activity recognition (reprinted from [90]).
body parts. Then, the temporal relations of the body parts are obtained, and ac-tions are represented by histograms of the detected part-sets. A human action can be characterized also by a combination of static posture features, representing the actual frame, consecutive motion features, computed using the actual and the previ-ous frames, and overall dynamics features, which consider the actual and the initial frames [88]. Principal Component Analysis (PCA) is adopted to obtain EigenJoints from joint differences reducing redundancy and noise. A measurement of Accumu-lated Motion Energy (AME) has been proposed to quantize the distinctiveness of each frame and to remove the less significant frames. The Naive-Bayes-Nearest-Neighbor (NBNN) classifier can recognize different actions. Taha et al. [89] also exploit joints spherical coordinates to represent the skeleton and a framework com-posed by a multi-class SVM and a discrete HMM to recognize activities constituted by many actions. Other approaches exploit multiple machine learning algorithms to detect postures and to classify actions. Gaglio et al. [90] divided the process of ac-tion recogniac-tion in three steps, as shown in Figure 2.7. A set of features is extracted from skeleton joints, then such a set is clustered by applying the k-means algorithm in order to identify the postures involved in each activity. The validation of the pos-tures has been obtained considering a multi-class SVM and a discrete HMM models an activity as a sequence of postures. Also in [91], human actions are considered as a sequence of body poses over time, and skeletal data are processed to obtain invariant pose representations, given by 8 pairs of angles. Then, the recognition is realized us-ing the representation in the dissimilarity space, where different feature trajectories maintain discriminant information and have a fixed-length representation. Ding et
al. [92] proposed a Spatio-Temporal Feature Chain (STFC) to represent the human actions by trajectories of joint positions. Before using the STFC model, a graph, called the Actionlets Graph, is used to erase periodic sequences, making the solu-tion more robust to noise and periodic sequence misalignment. Slama et al. [93] exploited the geometric structure of the Grassmann manifold for action analysis. In fact, considering the problem as a sequence matching task, this manifold allows considering an action sequence as a point on its space, and provides tools to make statistical analysis. Considering that the relative geometry between body parts is more meaningful than their absolute locations, a skeletal representation based on 3D relative geometry has been proposed [94]. The relative geometry between two body parts can be described using the rotation and translation required to take one body part to the position and orientation of the other. These rotations and translations required to perform rigid body transformations can be represented as points in a Special Euclidean group SE(3). Each skeleton can be represented as a point in the Lie group SE(3) × SE(3) × · · · × SE(3), and a human action can be modeled as a curve in this Lie group. A nominal curve for each action category is evaluated using Dynamic Time Warping (DTW) and all the curves are warped to this nominal curve. The warped curves are represented using the Fourier Temporal Pyramid (FTP) representation and a linear SVM is the chosen classifier. The same skeleton feature is also used in [95], where Manifold Functional PCA (mfPCA) is employed to reduce feature dimensionality.
Deep Learning methods, especially Convolutional Neural Networks (ConvNets) and Long Short-Term Memory Networks (LSTMs), have been recently used in dif-ferent tasks, among wich HAR. Wang et al. [96] proposed a new architecture to use ConvNets, which can automatically learn discriminative features from data, with relatively small datasets. Weighted Hierarchical Depth Motion Maps (WHDMM) allows transforming the problem of action recognition to image classification by converting the spatiotemporal motion patterns into spatial structures. Three WHD-MMs are constructed from the projection on each cartesian plane. Three ConvNets are trained on each WHDMM and the results are fused to produce the final classifi-cation score. Shahroudy et al. [97] proposed to use the LSTM model which is aware of the body structure. The memory cells of the LSTM are split into part-based sub-cells and the long-term patterns are learned specifically for each body part. The authors proposed also a new large-scale dataset, which can be efficiently used with data-driven learning methods such as deep learning techniques.
Chapter 2. Related works
Table 2.1.: State-of-the-art datasets for action recognition based on depth or skeletal features, sorted from more quoted to less quoted according to Google Scholar on January 3rd 2017.
Name Actions Actors Times Samples Citations Year
MSR DailyActivity3D [84] 16 10 2 320 614 2012 MSR Action3D [68] 20 10 2 or 3 567 603 2010 UTKinect Action [85] 10 10 2 - 444 2012 MSR ActionPairs [66] 6 10 3 180 338 2013 CAD-60 [98] 12 2+2 - 60 281 2012 CAD-120 [99] 10 2+2 - 120 219 2013 RGBD-HuDaAct [100] 12 30 2 or 4 1189 211 2011 MSRC-12 KinectGesture [101] 12 30 - 594 197 2012 MSR Gesture3D [102] 12 10 2 or 3 336 159 2012 Berkeley MHAD [103] 11 7+5 5 ∼ 660 110 2013 G3D [104] 20 10 3 - 61 2012 Florence 3D Action [105] 9 10 2 or 3 215 54 2012 ACT4 Dataset [106] 14 24 >1 6844 53 2012
LIRIS Human Activities [107] 10 21 - - 49 2012
3D Online Action [108] 7 24 - - 41 2014 UPCV Action [91] 10 20 - - 39 2014 WorkoutSu-10 Gesture [109] 10 15 10 1500 32 2013 KARD [90] 18 10 3 540 23 2014 UTD-MHAD [110] 27 8 4 861 22 2015 IAS-Lab Action [111] 15 12 3 540 21 2013 KSCGR [112] 5 7 - - 14 2013 NTU RGB+D [97] 60 40 - 56880 14 2016
the performance of HAR algorithms. These methods may increase the recognition performance because they can select only the relevant features for an efficient dis-crimination among the activities. Wang et al. [84] proposed a data mining solution to discover discriminative actionlets, which are structures of base features built to be highly representative of one action and highly discriminative compared to other actions. Eweiwi et al. [113] proposed a HAR algorithm exploiting joints where the pose feature is a weighted sum of all joint features. The weights are estimated by
![Figure 2.3.: Sampling of 3D points using the silhouette-based method for HAR (reprinted from [68]).](https://thumb-eu.123doks.com/thumbv2/123dokorg/2972164.27401/35.892.218.684.206.608/figure-sampling-points-using-silhouette-based-method-reprinted.webp)
![Table 2.3.: Three activity sets considered from KARD dataset. Activity Set 1 Activity Set 2 Activity Set 3 [a01] Horizontal arm wave [a02] High arm wave [a07] Draw Tick [a03] Two hand wave [a10] Side Kick [a16] Drink](https://thumb-eu.123doks.com/thumbv2/123dokorg/2972164.27401/45.892.172.747.242.507/table-activity-considered-dataset-activity-activity-activity-horizontal.webp)