The definitive version is available at www.blackwell-synergy.com
(http://onlinelibrary.wiley.com/doi/10.1111/j.1475-4754.2006.00254.x/abstract)
DOI: 10.1111/j.1475-4754.2006.00254.x
(http://dx.doi.org/10.1111/j.1475-4754.2006.00254.x)
ANALCIME CRYSTALLIZATION AND COMPOSITIONAL PROFILES – COMPARING APPROACHES TO DETECT POST-DEPOSITIONAL
ALTERATIONS IN ARCHAEOLOGICAL POTTERY
A. SCHWEDT 1,2, H. MOMMSEN 1, N. ZACHARIAS 1† AND J. BUXEDA I GARRIGÓS 2
ANALCIME CRYSTALLIZATION AND COMPOSITIONAL PROFILES – COMPARING APPROACHES TO DETECT POST-DEPOSITIONAL
ALTERATIONS IN ARCHAEOLOGICAL POTTERY
A. SCHWEDT 1,2, H. MOMMSEN 1, N. ZACHARIAS 1† AND J. BUXEDA I GARRIGÓS 2
1
Helmholtz-Institut für Strahlen- und Kernphysik, Universität Bonn,
Nussallee 14-16, D-53115 Bonn, Germany 2
Equip de Recerca Arqueomètrica de la Universitat de Barcelona, Departament de Prehistòria, Història Antiga i Arqueologia,
C/ de Baldiri Reixac, s/n, 08028 Barcelona, Catalonia, Spain
The approaches of comparative studies and profile measurements, often used in order to detect post-depositional alterations of ceramics, have been applied simultaneously to two sets of Roman pottery, both including altered individuals. As analytical techniques Neutron Activation and X-Ray Diffraction have been used. Both approaches lead to substantially different results. This shows that they detect different levels of alteration and should complement each other rather than being used exclusively. For the special process of a glassy phase decomposition followed by a crystallization of the Na-zeolite analcime, the results suggest that it changes high-fired calcareous pottery fast and so fundamentally, that the results of various archaeometric techniques can be severely disturbed.
KEYWORDS: ANALCIME, CALCIUM, COMPARATIVE STUDIES,
CONCENTRATION PROFILES, GEHLENITE, POST-DEPOSITIONAL ALTERATION, POTTERY, NEUTRON ACTIVATION ANALYSIS, ALKALI METALS, X-RAY DIFFRACTION
INTRODUCTION
The problem of post-depositional alterations of archaeological ceramics has been addressed up to now – besides the experimental simulation of weathering effects under laboratory conditions – mainly by two different approaches: Profile measurements and comparative studies.
The profile approach (e.g. Dufournier, 1979, Tubb et al., 1980, Lemoine et al., 1981, Freestone et al., 1985, Thierrin-Michael, 1992, Maggetti, 2001, Schwedt et al., 2004) relies on the basic assumption that a ceramic body initially had a homogeneous composition. Consequently, compositional variations between e.g. the core of an excavated sherd and parts closer to its surface are interpreted as hints to post-depositional alterations, as it is expected that weathering affects the outer parts of a sherd in a stronger way than its interior, or, vice versa, that the original composition is better preserved in the core samples.
The approach of comparative studies (e.g. Picon, 1976 and 1991, Franklin and Hancock, 1980, Lemoine et al., 1981, Rottländer, 1989, Buxeda, 1999), on the contrary, assumes on e.g. archaeological grounds an initially homogeneous composition for a whole group of sherds
and explains observed chemical or mineralogical variations within this group of samples with possible post-depositional alteration mechanisms.
Since, obviously, both approaches generally attempt to answer the same question, it was a challenging task to test them on the same sample set and to compare the results.
For this purpose, samples have been chosen in connection to a specific weathering process, which recently has been subject of a high number of comparative studies, i.e. the alteration of the K and Na contents in pottery connected to the alteration of the glassy phase and the crystallization of the Na-zeolite analcime (Na[AlSi2O6] · 6 H2O).
In 1976, Picon examined two sherds of calcareous pottery at several spots with a varying degree of overfiring and observed a leaching of K especially at the spots which show signs of a medium overfiring. Later, Picon (1991) found an enrichment in the Na, Mg and Sr concentrations at the same spots and proposed the crystallization of zeolites as explanation for this phenomenon. In the following years, several comparative studies (e. g. Buxeda and Gurt, 1998, Buxeda, 1999, and references therein, Buxeda et al., 2001a, and Buxeda et al., 2002) detected analcime in various sample sets in connection to a leaching of K, and showed that the intensity of analcime reflexes in X-ray diffractograms increases with the equivalent firing temperatures of the analysed sherds. Because of the high content of crystal water, however, this mineral phase cannot be formed during the firing of the ceramics. By now, the probable explanation for all these observations is given in Buxeda et al. (2002): Depending on the firing temperature of the sherds a certain amount of a glassy phase is formed containing a large part of the overall K in the sherd. This phase is unstable upon certain weathering conditions, and a part of the K is leached from the sherd. From the remaining silicate material subsequently analcime crystallizes under fixation of Na from the burial environment.
Finally, TL studies based on analcime containing samples out of several different case studies have shown, that in samples affected by the analcime crystallization, the archaeological dose deposed in the sample is systematically higher than could be expected on the basis of the natural radionuclide content as it can be measured in the samples today (Zacharias et al., 2005). This reconfirmed the theory, that K is lost after a considerable burial period and not already during the firing.
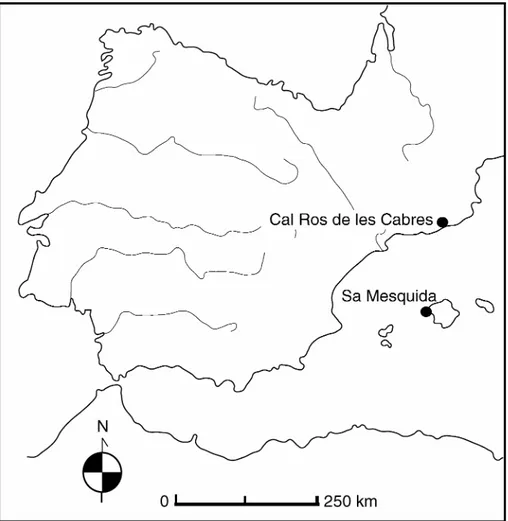
SHORT ARCHAEOLOGICAL DESCRIPTION OF THE ANALYSED SAMPLES Samples showing this behaviour (for the TL data cf. Zacharias et al., forthcoming), and used for analysis here, have been excavated at two Roman sites in Spain (Fig. 1): Cal Ros de les Cabres (close to El Masnou, about 20 km north of Barcelona at the Catalan coast of the Mediterranean) and Sa Mesquida (close to Santa Ponça, Mallorca).
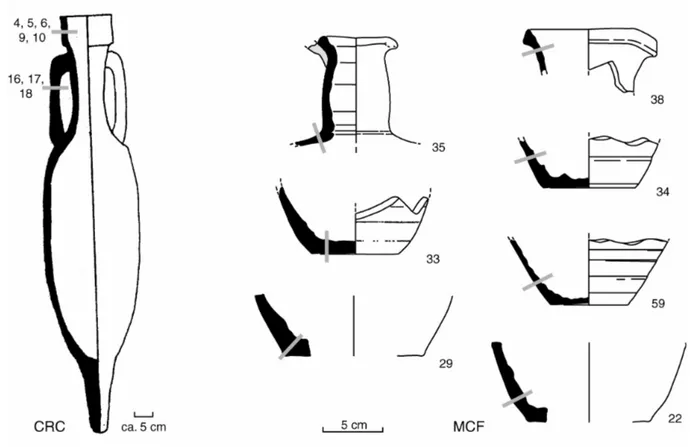
Cal Ros de les Cabres was a production centre for amphorae of the Pascual 1 type (Fig. 2, left), which were used for the transport of wine up to France, Italy or England. In 1989-90, at this site two kilns with the corresponding kiln dumps were excavated, one of which was full of amphorae fragments of the mentioned type. They could be dated to the first century AD (Burés et al., 1991). A total of 30 samples had been analysed before by Buxeda and Gurt (1998) using X-Ray Fluorescence (XRF) and X-Ray Diffractometry (XRD) in order to characterize the reference group. From those samples, eight could be analysed here, rim fragments (CRC 4, 5, 6, 9, and 10) as well as parts of the handles (CRC 16 – 18). All sherds were found in the same stratigraphical layer (UE VII-2) of the same kiln dump, so that the burial environment can be considered as identical.
At the second site, Sa Mesquida (Tsantini et al., 2004, and references therein), a courtyard has been excavated, in which around a central well several chambers of a similar size (about 2.5 x 3 m) were situated. In the southern part of this yard, evidence for a kiln for the production of tableware has been found, which also dates back to the first century AD. In the adjacent
chambers larger amounts of jar fragments have been excavated, and 60 samples have been analysed by Tsantini et al. (2004). Seven of these samples could be analysed here (MCF 22, 29, 33 – 35, 38, and 59, Fig. 2, right). Also in the case of those samples, noteworthy differences in the burial environment cannot be assumed.
For both sites, the sherds had been cleaned by the archaeologists only with water before giving them to the analysis.
SAMPLING AND ANALYTICAL TREATMENT
The actually analysed sherds have been selected according to the degree of analcime content known from the XRD bulk analyses of the previous studies. From each site, samples affected by the crystallization (CRC 4, 9, 16; MCF 22, 34, 38, 59) as well as unaffected samples (CRC 5, 6, 10, 17, 18; MCF 29, 33, 35) have been chosen. Furthermore, in Sa Mesquida, various degrees of the alteration have been covered (cf. below).
The sherds were cut with a diamond cut-off wheel along their cross sections (Fig. 2) into small slices as parallel as possible to the surfaces of the vessels. In order to find a compromise between spatial resolution and representativeness, each slice had an area of about 2 cm2 and a thickness of about 1 mm. This size of the slices yielded enough sample material (around 500 mg) for further analysis with Neutron Activation Analysis (NAA) and XRD. Regarding the representativeness of these slices, inclusions of Cal Ros de les Cabres amphorae can be considered of medium grain size, homogeneously distributed within the matrix. In grain size estimations based on the examination of polished sections no inclusions bigger than ca. 1.5 mm could be found. Only the largest of them occur with frequencies so low, that they could cause slight problems (Bromund et al., 1976). On the contrary, for the pottery from Sa Mesquida, petrographic analysis (Tsantini et al., 2004) showed that the inclusions are also well distributed with the largest having diameters of 0.2 mm. In that way no problems due to inclusions have to be expected. Moreover, for the amphorae case study, it must be noted that assuming that the largest inlcusions contain Si to a considerable amount, which cannot be measured by the NAA in Bonn, variations due to an inhomogeneity of them should be additionally cancelled by the applied way of data correction (cf. below). Therefore, the slices can be considered as representative enough for the bulk composition at that part of the sherds. Depending on the overall thickness of the sherds 3 to 7 slices could be cut per sherd. The first slice corresponds always to the outer surface, the last slice to the inner, the only exception being CRC 6 for which the numbering is reverse. For the handles the concept of inner and outer surface cannot be reasonably applied. All pieces have been found fragmented, but unfortunately, the exact positions and orientations of the sherds within the soil was not recorded during the excavation. Thus the only available information is that both surfaces were in direct contact with the soil. Each slice, after the cutting, was finally ground in an agate mortar.
The specifications of the Bonn NAA setup are described at length in Mommsen et al. (1991) and need not be repeated here. All slices of a single sherd have been analysed in the same ‘run’ in order to avoid batch differences between different irradiations. The analytical raw data of each single measured slice are not presented here because of a lack of space. They are, however, published electronically in Schwedt (2004, 119ff.), and can be downloaded from the internet.
Finally, XRD was performed only on the two surface slices and a core slice (either the central or one of the two central slices, if the total slice number is even) in order to have the supposed extreme cases of contact with the surrounding soil analysed. Measurements were taken using a Philips PW 1130 diffractometer (35 kV, 30 mA) and Cu–Kα radiation (λ=1.5418 Å, Ni filter in the incident beam) in the range of 6–50° 2θ.
DATA TREATMENT
The analysis of concentration changes requires some special attention with regard to the nature of compositional data, as every change in the amount of a specific element not only changes its own concentration, but, over the constraint that the concentrations of all components add up to 100 %, all other concentrations, too.
Example: Assume a sample of 100 g, that contains 20 g Ca and 1 mg Sc, which corresponds to concentrations of 20 wt% Ca and 10 ppm Sc. Now, let this sample take part in some reaction and half of the Ca, i.e. 10 g, be leached. Obviously, this reduces not only the mass of Ca component, but also the total sample weight to 90 g at the same time. Therefore, this change in the total mass increases the Sc concentration to 11.1 ppm, although Sc did not take part in any reaction. For Ca, the concentration after the reaction is not half of the initial concentration, but 11.1 wt% instead.
Thus, a comparison of the raw data will mislead the interpretation for all elements. However, an analysis of data corrected by a factor (total mass after the reaction) / (total mass before) = 90/100 = 1/1.11 will lead to correct conclusions: Sc is unchanged, and half of the Ca is lost. In practice however, this factor cannot be calculated directly, since the needed sample weight of an altered sample before the alteration is unknown. Therefore it can only be estimated. This is possible either by the concentration ratio of an element assumed to be unchanged (Buxeda, 1999), or by a best relative fit based on several elements. We generally used a best relative fit following Beier and Mommsen (1994) on the basis of all measured elements (Tab. 1) except for As, Ba, Ca, and the alkali elements, as it is generally done in Bonn, and for Ca and the alkali elements it is also especially reasonable in these cases (cf. below) .
THE COMPARATIVE APPROACH: CHARACTERIZATION OF THE BULK SAMPLES The concentration mean values of all slices from each site, respectively, are given in Tab. 1. As can be seen, at both sites, the used clays are highly calcareous. Under neglect of the alkali elements (cf. below) the samples show a sharply defined elemental pattern for each site. Only elements which are usually found to scatter a lot even in homogeneous pottery groups (As, Ba, Ca) or elements which can be only measured with a high analytical error in Bonn (Ni, Ti, Zn and Zr) show considerable variations. Generally, the variability among the samples of Cal Ros de les Cabres is slightly larger than among the tableware from Sa Mesquida. However, for both sites, the assumption of a production from a homogeneous clay paste each, seems to be justified.
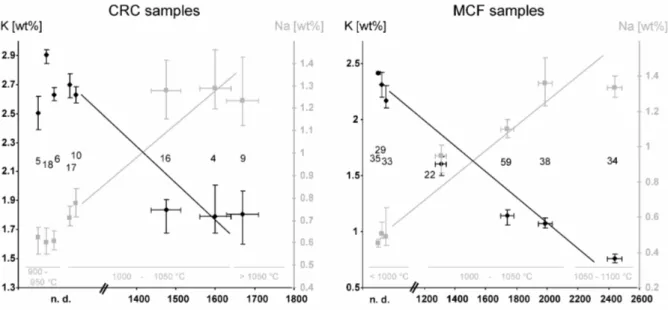
The variations of the Na and K concentrations can be clearly correlated to the existence of analcime in the samples as can be seen in Fig. 3. Among the Mallorcan samples, Rb shows the same behaviour as K, for the CRC samples, however, K and Rb seem to be widely independent.
Mineralogically, besides analcime, the major reflexes in the diffractograms are given by quartz, plagioclases, gehlenite and pyroxenes (mostly diopside), especially for Sa Mesquida also peaks of primary and secondary calcite, as can be seen by petrographic analysis (Tsantini
et al., 2004; Cau et al., 2002; Heimann and Maggetti, 1981; Maggetti, 1981).
Thermodiffractometric experiments (heating rate of 100 °C/h, maintaining the maximum temperature for 1 h) performed at the Universitat de Barcelona allowed to classify the samples according to the following equivalent firing temperature classes:
Cal Ros de les Cabres (Buxeda and Gurt, 1998):
900 – 950 °C (CRC 5, 6, 18), 1000 – 1050 °C (CRC 4, 10, 16, 17), and > 1050 °C (CRC 9)
850 – 950 °C (MCF 35), 950 – 1000 °C (MCF 29, 33), 1000 – 1050 °C (MCF 22, 59, 38), and 1050 – 1100 °C (MCF 34).
If analcime is present, it is in highly fired sherds (> 1000 °C), and the highest intensities can be found in the overfired samples (> 1050 °C, Fig. 3).
In conclusion, the comparative approach yields the typical signs of this weathering process concurring with the studies mentioned above. A variability of the alkali elements found comparing the different samples can be connected to different firing temperatures and mineralogical changes: Once an appropriate degree of glassy phase formation is reached, the degree of the alteration of Na and K (for Sa Mesquida also Rb) concentrations and of the analcime crystallization depends, to some extent, on the firing temperature and the environmental solutions.
THE PROFILE APPROACH
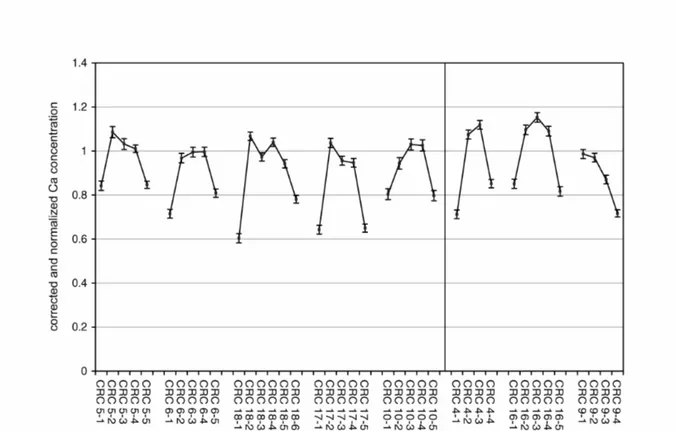
Examining the concentration profiles in each analysed sherd separately, the most pronounced profiles can be found, surprisingly, for an element, which is not connected to the analcime crystallization and does not show any peculiar behaviour in the comparison of the bulk samples, namely Ca. The measured profiles in the samples from Cal Ros de les Cabres are plotted in Fig. 4. For the sake of an easier comparability, in this and the following figures, after the best-relative-fit correction within each single sherd, the data additionally have been normalized to an average core concentration of several samples not affected by the analcime crystallization (cf. the corresponding figure captions). As can be seen, a Ca profile formation can be found in almost all samples, independent of the firing temperature and analcime crystallization. These profiles show lower Ca concentrations at the surfaces with one exception in sample CRC 9 that cannot be fully explained by now, especially because micro-environmental information and exact position and orientation within the soil are not available. These profiles cannot be the result of natural inhomogeneities in the clay paste, since the Ca content of the core samples is much more homogeneous. The samples from Sa Mesquida show similar profiles. Independent of the analcime problem, similar observations have already been made in earlier studies (Thierrin-Michael, 1992; Schwedt et al., 2004).
In the diffractograms analogies to the chemical profiles can be found. On one hand, a lowering of the calcite intensities towards the surface can be found especially for samples from Sa Mesquida (most pronounced in MCF 22, 29), concurring with earlier observations (Schwedt et al., 2004). Another analogy can be observed especially among the samples of Cal Ros de les Cabres: So show the core slices of CRC 5, 10, 16, 17 and 18 clear reflexes of gehlenite, the intensity of which strongly decreases towards the surfaces (Fig. 5). The decomposition of gehlenite has been extensively discussed by Heimann and Maggetti (1981). However, none of the decomposition products given in that paper could be found systematically increased in an analogous way in our diffractograms. Whatever the exact process is, at the end Calcium is lost in the outer surfaces.
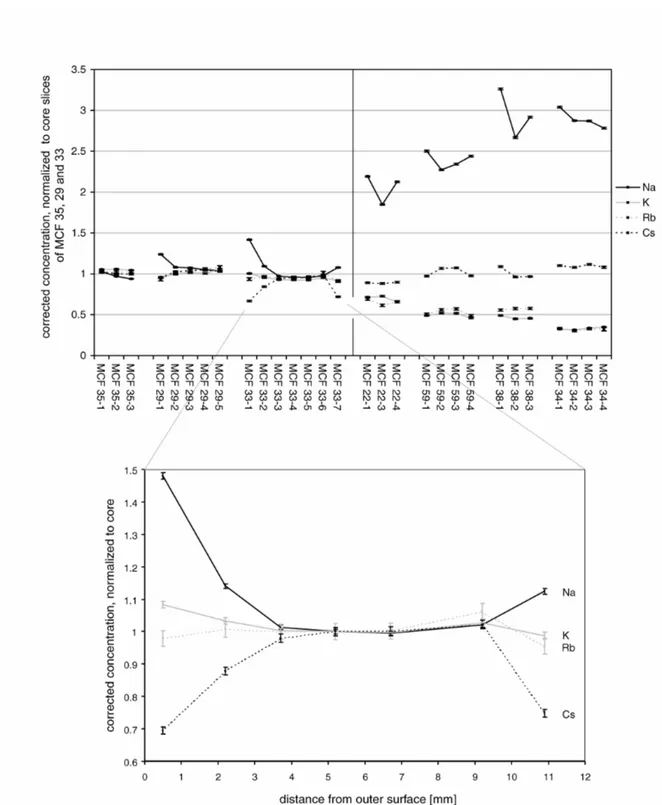
In contrast to Ca, the elements of interest in connection to the analcime crystallization show a completely different and rather puzzling behaviour with regard to profile formation (Fig. 6 and 7). For both sites, the loss of K in the samples affected by the analcime crystallization, thought to be the beginning of the alteration process (cf. above), can be found homogeneously all across even thick-walled sherds without leaving any profile. Also, the proposed Na uptake from the burial environment can be found in the whole body of the affected sherds. It seems to produce concentration profiles, in which the Na concentration towards the surfaces is slightly increased. However, this intra-sherd variation in the case of Sa Mesquida adds up to a
maximum of 20 % in contrast to a total increase of almost 200 % from the core slices of the unaffected samples to those of MCF 34. For Cal Ros de les Cabres, the situation is similar. This comparatively homogeneous alteration of the Na and K concentrations corresponds mineralogically to a homogeneous crystallization of analcime within the sherd as can be seen in Fig. 8 for MCF 34. Similar observations could be made for the other samples.
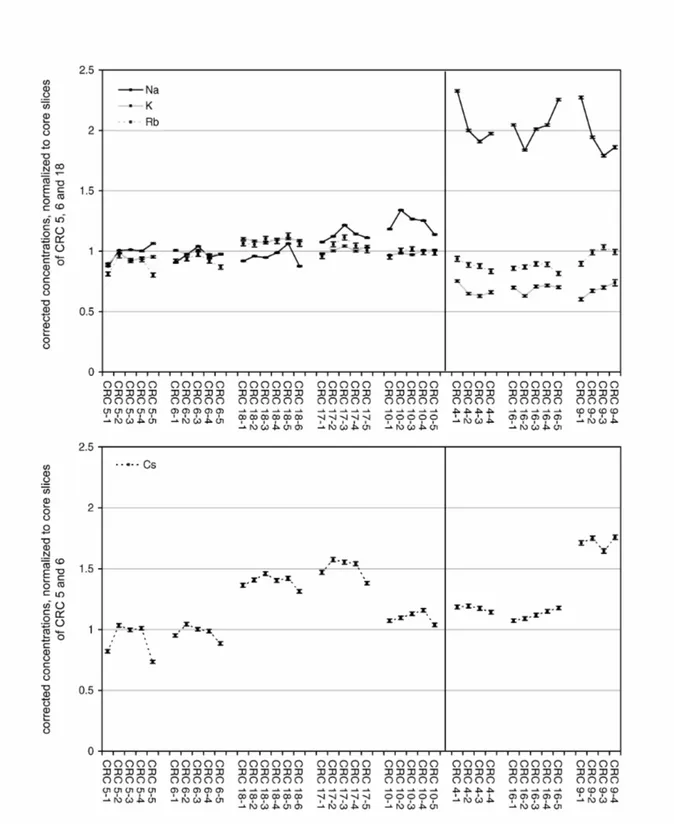
The behaviour of the two other measured alkali elements, Rb and Cs, is not necessarily connected to that of K. Among the samples from Sa Mesquida, Rb closely follows K. In Cal Ros de les Cabres, however, it stays more or less stable in the fragments affected by the analcime crystallization. Independent of an overall change of the Rb content, no significant profile formation can be found.
With regard to the formation of Cs concentration profiles, the most conspicuous profile for Sa Mesquida can be found for the medium high fired sample MCF 33, which is depicted more in detail in the lower part of Fig. 6, in dependence of the actual depths. In this case, the firing temperature was not yet high enough for the sherd to be subsequently affected by the K leaching and analcime crystallization, K and Rb are more or less constant all across the body. The Na concentration, however, is increased towards the surfaces for up to 50 %, Cs, in contrast, is lowered for up to 30 %. This concentration change reaches up to 3 mm into the sherd, and is not just a problem of the topmost surface. The constancy of the concentrations in the central slices, however, shows, that this variation cannot be explained by natural inhomogeneities. One possible explanation for such a profile in a single sample could be a coincidence of salt and calcite in the paste (Béarat et al., 1989, Schwedt and Mommsen, forthcoming). However, here the composition of the other samples make this possibility unlikely: If the salt would be naturally occurring in the paste, it should be present in all samples, and one would expect significant Na profiles also in the lowest fired samples, since Na profiles are formed during the drying of the clay. Also an increasing loss of Cs towards the higher fired samples should be expected (Schwedt and Mommsen, forthcoming). Contrary, if salt would be only present in this special sample because of a peculiar preparation by the potter, the Na concentrations generally should be significantly higher within this special sample compared to the other samples from Sa Mesquida. Therefore, it is much more probable, that the Na and Cs profiles in sample MCF 33 have developed after the firing of the vessel. Under this assumption, no clear possible explanation can be proposed to present. Among the samples from Cal Ros de les Cabres, Cs varies already between the core slices of the sherds unaffected by the analcime crystallization, which is most probably the result of an inhomogeneity of this element already in the used clay paste. Anyway, also in Cal Ros de les Cabres, the behaviour of Cs and the analcime crystallization seem to be widely independent. With regard to Cs concentration profiles, it has to be noted as a certain regularity in Cal Ros de les Cabres, that all samples unaffected by the analcime crystallization show profiles with a lowering of the Cs concentration towards the surface, most pronounced for sample CRC 5, whereas the concentration in the samples affected by the crystallization show more constant Cs profiles. Also here, an influence of salt can be excluded as in none of the five samples unaffected of the analcime crystallization systematic increases of Na towards the surface could be found.
Generally, it is noteworthy, that if Cs profiles are found, for both sites this is rather the case for medium high fired samples (between 900°C and 1050°C, cf. MCF 33, but also e.g. CRC 5, 17). Contrary, in the samples affected by the crystallization of analcime, Cs seems to be stable again, whereas K leaves the complete sherd. As K, Rb and Cs initially should be present more or less in the same mineral phases, this different behaviour should be explained by the different ionic radii. One possibility would be that the crystals of these mineral phases are built in a zonar way, with Cs being enriched in the outer layers of these minerals. For illitic clay minerals, such a zonar structure is discussed already by Gaudette et al. (1966). As long as the crystal structures are intact, the binding would be comparatively stable. In the firing
temperature range of those samples not yet affected by the analcime crystallization, the clay minerals have lost their crystal structure already, their reflexes disappeared from the diffractograms. However, in the amorphous rest the initial zonar structure could be still present. An alteration of these crystal rests would affect first of all their outer layers, and therefore the largest ions. At higher temperatures finally, the microscopic crystals would be more and more molten, the initially zonar structure would disappear. In the resulting glassy phase affected by the analcime crystallization the different alkali elements would be equally distributed, and those with the smaller radii (Na and K) would be more mobile. If finally after the analcime crystallization, the Cs happens to be incorporated in the new crystal structure, it is difficult to be solved from there – the analcime crystal acts as ‘ion sieve’. This has been also found by Fornaseri and Penta (1960) who analysed the behaviour of the minor alkali elements in various natural analcimes from Italy.
IMPLICATIONS OF THE RESULTS
The results of this project show that the two approaches applied in order to detect post-depositional alterations obviously have a differing sensitivity to different alteration processes: The processes connected to the analcime crystallization strongly alter the complete sherd – chemically as well as mineralogically – in a way that does not leave traces in form of profiles. Obviously, alterations like the K loss connected to this process can only be detected by comparative studies, or indirectly by mineralogical examination, but not with the profile approach.
On the other hand, there are processes as the Ca or Cs loss in our cases, which can be detected by their profile formation, but are rather ‘invisible’ for comparative studies.
One possible explanation for this different behaviour could be that the process of glassy phase decomposition / analcime crystallization is energetically favoured and, therefore, much faster. Support for this hypothesis is given by the fact, that Buxeda et al. (2001b) detect analcime already in samples of 17th century ceramics, whose burial time of around 300 years is comparatively small. Also experimentally, Höller (1970) reports the conversion of natural silicates into analcime in alkali-rich solutions at temperatures between 100°C and 180°C within only a few months of reaction time. If this should be the reason, the profile approach could be only applied to alteration processes which are sufficiently slow, that the surfaces are still affected in a stronger way than the core samples.
The different sensitivity might lead to the impression, that the profile approach is less useful, since it seems to detect rather faint alterations. However, this is a fallacy, as also these weathering processes might cause severe problems in the evaluation of the data, especially for analytical techniques which restrict themselves to measurements on small samples taken close to the surface of archaeological objects in order to minimize the damage caused to the artefact.
Besides this, the results of this project also enlarge our knowledge of the special alteration process of the analcime crystallization. The measured profiles show, that this type of alteration is not only a problem of the surface, but changes complete vessels even as thick as the amphorae from Cal Ros de les Cabres so fundamentally, that it will affect a large number of analytical techniques used in archaeometry: Obviously, chemically as well as mineralogically the composition is altered, which causes problems for corresponding techniques. As a consequence, also the Luminescence dating is disturbed (Hedges and McLellan, 1976, Zacharias et al., 2005), since the original K concentration needed for the estimation of the dose rate, cannot be found at any spot in the sherd. TL measurements on the samples from Sa Mesquida will be published in a separate paper (Zacharias et al.,
forthcoming). Therefore, the wide-spread use of (overfired) kiln wasters as reference material for archaeometric studies generally has to be questioned at least for calcareous pottery.
ACKNOWLEDGEMENTS
We are indebted to the staff of the research reactor FRG-1 at the GKSS Geesthacht for the competent performance of the neutron irradiations.
Jaume Buxeda i Garrigós has a research contract within the Ramón y Cajal program by the Ministerio de Ciencia y Tecnología (Spain). This paper is included in the project “Estudio arqueométrico y arqueológico de la producción y difusión de ánforas del nordeste peninsular durante los S. I aC – I dC (PRODIFAN)” (BHA2003-04589) funded by the Dirección General de Investigación del Ministerio de Ciencia y Tecnología (Spain) and the ERDF (European Union).
REFERENCES
Béarat, H., Dufournier, D., Nguyen, N., and Raveau, B., 1989, Influence de NaCl sur la couleur et la composition chimique des pâtes céramiques calcaires au cours de leurs cuisson,
Revue d' Archéométrie, 13, 43 – 53.
Beier, T., and Mommsen, H., 1994, Modified Mahalanobis filters for grouping pottery by chemical composition, Archaeometry, 36, 287 – 306.
Burés i Vilaseca, L., and Marquès i Sinca, A., 1991, La vil·la romana de Cal Ros de les Cabres (El Masnou, El Maresme). Notícia de les darreres campanyes d'excavació, Laietània, 6, 115 – 118.
Bromund, R. H., Bower, N. W. and Smith, R. H., 1976, Inclusions in ancient ceramics: An approach to the problem of sampling for chemical analysis, Archaeometry, 18, 218 – 221. Buxeda i Garrigós, J., and Gurt i Esparraguerra, J. M., 1998, La caracterització arqueomètrica de les àmfores de Can Peixau (Badalona) i la seva aportació al coneixement de la producció de Pascual 1 al territori de Baetulo, in: El vi a l'antiguitat – economia, producció i commerç al
mediterrani occidental, Museu de Badalona, Monografies Badalonines 14, Badalona, 193 –
217.
Buxeda i Garrigós, J., 1999, Alteration and contamination of archaeological ceramics: The perturbation problem, Journal of Archaeological Science, 26, 295 – 313.
Buxeda i Garrigós, J., Kilikoglou, V., and Day, P. M., 2001a, Chemical and Mineralogical alteration of ceramics from a Late Bronze Age kiln at Kommos, Crete: The effect on the formation of a reference group, Archaeometry, 43, 349 – 372.
Buxeda i Garrigós, J., Madrid Fernández, M., and Gurt i Esparraguera, J. M., 2001b, Provinença i tecnologia de les ceràmiques de „Pisa“ i d' „Obra de Manises“ del dipòsit de la Plaça Gran de Mataró, in J. A. Cerdà i Mellado (Ed.): La ceràmica Catalana del segle XVII
trobada a la Plaça Gran (Mataró), Associació Catalana de ceràmica decorada i terrissa,
Buxeda i Garrigós, J., Mommsen, H., and Tsolakidou, A., 2002, Alteration of Na-, K-, and Rb-concentrations in Mycenaean pottery and a proposed explanation using X-Ray Diffraction,
Archaeometry, 44, 187 – 198.
Cau Ontiveros, M. A., Day, P. M., and Montana, G., 2002, Secondary calcite in archaeological ceramics: Evaluation of alteration and contamination processes by thin section study, in V. Kilikoglou, Y. Maniatis, and A. Hein (Eds.), Modern trends in ancient ceramics, BAR International Series 1011, Oxford, 9 – 18.
Dufournier, D., 1979, Deux exemples de contamination des céramiques anciennes par leur milieu de conservation, Figlina, 4, 69 – 83.
Fornaseri, M., and Penta, A., 1960, Elementi alcalini minori negli analcimi e loro comportamento nel processo di analcimizzazione della leucite, Periodico di Mineralogia, 29, 85 – 102.
Franklin, U. M., and Hancock, R., 1980, The influence of post-burial conditions on trace element composition of ancient sherds, Revue d’Archéométrie, III, 111-119.
Freestone, I. C., Meeks, N. D., and Middleton, A. P., 1985, Retention of phosphate in buried ceramics: An electron microbeam approach, Archaeometry, 27, 161 – 177.
Gaudette, H. E., Grim, R. E., and Metzger, C. F., 1966, Illite: A model based on the sorption behaviour of cesium, The American Mineralogist, 51, 1649 – 1656.
Hedges, R. E. M., and McLellan, M., 1976, On the cation exchange capacity of fired clays and its effect on the chemical and radiometric analysis of pottery, Archaeometry, 18, 203 – 207.
Heimann, R. B., and Maggetti, M., 1981, Experiments on simulated burial of calcareous terra sigillata (mineralogical change). Preliminary results. In M.J. Hughes (Ed.), Scientific studies
in ancient ceramics, British Museum Occasional Paper 19, London, 163 – 177.
Höller, H., 1970, Untersuchungen über die Bildung von Analcim aus natürlichen Silikaten,
Contributions to Mineralogy and Petrology, 27, 80 – 94.
Lemoine, C., Meille, E., Poupet, P., Barrandon, J. N., and Borderie, B., 1981, Étude de quelques altérations de composition chimique de céramiques en milieu marin et terrestre,
Revue d’Archéométrie, Suppl. S, 349 – 360.
Maggetti, M., 1981, Composition of Roman pottery from Lousonna (Switzerland), in Hughes, M. J. (ed.), Scientific studies in ancient ceramics, British Museum Occasional Paper 19, London, 33 – 49.
Maggetti, M., 2001, Chemical analyses of ancient ceramics: What for?, Chimia, 55, 923 – 930.
Mommsen, H., Kreuser, A., Lewandowski, E. and Weber, J., 1991, Provenancing of pottery: A Status Report on Neutron Activation Analysis and Classification, in Hughes, M. J., Cowell, M. R., and Hook, D. R. (eds.), Neutron Activation and Plasma Emission Spectrometric
Picon, M., 1976, Remarques preliminaries sur deux types d’altération de la composition chimique des céramiques au cours du temps, Figlina, 1, 159 – 166.
Picon, M., 1991, Quelques observations complementaires sur les altérations de composition des céramiques au cours du temps: Cas de quelques alcalins et alcalino-terreux, Revue
d’Archéométrie, 15, 117 – 122.
Rottländer, R. C. A., 1989, Verwitterungserscheinungen an Keramik, Archaeologica Venatoria, Tübingen.
Schwedt, A., 2004, Untersuchung von (Spuren-)Elementkonzentrationsprofilen in
archäologischer Keramik mittels Neutronenaktivierungsanalyse, Dissertation Universität
Bonn, URL: http://hss.ulb.uni-bonn.de/diss_online/math_nat_fak/2004/schwedt_alexander, URN: urn:nbn:de:hbz:5n-03369
Schwedt, A., Mommsen, H., and Zacharias, N., 2004, Post-depositional elemental alterations in pottery: Neutron Activation Analysis of surface and core samples, Archaeometry, 46, 85 – 101.
Schwedt, A., and Mommsen, H., forthcoming, On the influence of drying and firing of clay on the formation of trace element concentration profiles within pottery.
Thierrin-Michael, G., 1992, Römische Weinamphoren – Mineralogische und chemische
Untersuchungen zur Klärung ihrer Herkunft und Herstellungsweise, Dissertation Universität
Fribourg.
Tsantini, E., Buxeda i Garrigós, J., Cau Ontiveros, M. A., and Orfilia Pons, M., 2004, Caracterización arqueométrica de la cerámica común producida en la villa romana de Sa Mesquida (Mallorca), Pyrenae, 35, 157 – 186.
Tubb, A., Parker, A. J., and Nickless, G., 1980, The Analysis of Romano-British Pottery by Atomic Absorption Spectrophotometry, Archaeometry, 22, 153 – 171.
Zacharias, N., Buxeda i Garrigós, J., Mommsen, H., Schwedt, A., and Kilikoglou, V., 2005, Implications of burial alterations on luminescence dating of archaeological ceramics, Journal
of Archaeological Science, 32, 49 – 57.
Zacharias, N., Schwedt, A., Michael, C.T., Buxeda i Garrigós, J., Mommsen, H., and Kilikoglou, V., forthcoming, Detecting a potential source of error in luminescence dating of pottery.
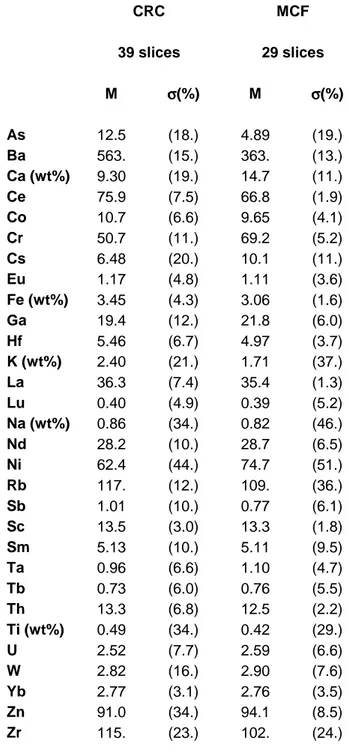
Tab. 1: Average concentration values M and spreads σ (=standard deviations) for all measured slices from Cal Ros de les Cabres (CRC, n=39) and Sa Mesquida (MCF, n=29). M in µg/g (=ppm), unless indicated otherwise, σ in % of M. Prior to the calculation of the spreads, the data of each slice has been adjusted to the groups mean values by a best-relative-fit on the basis of all elements except As, Ba, Ca, Cs, Na, K, and Rb (cf. text)
CRC MCF 39 slices 29 slices M σσσσ(%) M σσσσ(%) As 12.5 (18.) 4.89 (19.) Ba 563. (15.) 363. (13.) Ca (wt%) 9.30 (19.) 14.7 (11.) Ce 75.9 (7.5) 66.8 (1.9) Co 10.7 (6.6) 9.65 (4.1) Cr 50.7 (11.) 69.2 (5.2) Cs 6.48 (20.) 10.1 (11.) Eu 1.17 (4.8) 1.11 (3.6) Fe (wt%) 3.45 (4.3) 3.06 (1.6) Ga 19.4 (12.) 21.8 (6.0) Hf 5.46 (6.7) 4.97 (3.7) K (wt%) 2.40 (21.) 1.71 (37.) La 36.3 (7.4) 35.4 (1.3) Lu 0.40 (4.9) 0.39 (5.2) Na (wt%) 0.86 (34.) 0.82 (46.) Nd 28.2 (10.) 28.7 (6.5) Ni 62.4 (44.) 74.7 (51.) Rb 117. (12.) 109. (36.) Sb 1.01 (10.) 0.77 (6.1) Sc 13.5 (3.0) 13.3 (1.8) Sm 5.13 (10.) 5.11 (9.5) Ta 0.96 (6.6) 1.10 (4.7) Tb 0.73 (6.0) 0.76 (5.5) Th 13.3 (6.8) 12.5 (2.2) Ti (wt%) 0.49 (34.) 0.42 (29.) U 2.52 (7.7) 2.59 (6.6) W 2.82 (16.) 2.90 (7.6) Yb 2.77 (3.1) 2.76 (3.5) Zn 91.0 (34.) 94.1 (8.5) Zr 115. (23.) 102. (24.)
Fig. 2: Drawings of the analysed vessels. The position of the measured profiles is indicated by grey bars.
Fig. 3: Dependency of the Na- and K-concentrations (after correction) of the sherds from Cal Ros de les Cabres, CRC, and Sa Mesquida, MCF (average value, as well as minimum/maximum of the corresponding slices) on the analcime content, semi-quantified by the integrated intensity (background-corrected sum of counts between 15.5° and 16.5° 2θ) of the non-overlapped 5.61 Å-reflex in the diffractogram. The numbers refer to the sample labels. Additionally indicated in grey are the measured equivalent firing temperatures. The plotted lines just indicate trends, they do not correspond to any regression lines.
Fig. 4: Ca-profiles in the samples from Cal Ros de les Cabres. The data are corrected within each sherd by a best-relative fit to the sherds mean values, calculated on the basis of all elements except As, Ba, Ca, Na, K, Rb, and Cs. For the sake of an easier comparability, the data are additionally normalized to the average concentration of the core slices CRC 5-3, 6-3 and 18-3. The plotted errors correspond to the statistical error of the NAA.
Fig. 5: Background-corrected diffractograms of the slices CRC 10-3 (core, black) and CRC 10-5 (surface, grey). Q: quartz, KF: potassium feldspars, P: plagioclases, D: pyroxenes (mostly diopside), Ge: gehlenite. As can be seen, the gehlenite content decreases towards the surface. A similar behaviour can be found for samples CRC 5, 16, 17, and 18.
Fig. 6: Alkali element profiles for the sherds from Sa Mesquida. The data are corrected within each sherd by a best-relative fit to the sherds mean values, calculated on the basis of all elements except As, Ba, Ca, Na, K, Rb, and Cs. For the sake of an easier comparability, the data are additionally normalized to the average concentration of core slices MCF 29-3, 33-4, and 35-2, which are unaffected by the analcime crystallization. The samples are ordered by rising equivalent firing temperature (cf. text). The plotted errors correspond to the statistical error of the NAA.
Fig. 7: Alkali element profiles for the sherds from Cal Ros de les Cabres. The data are corrected within each sherd by a best-relative fit to the sherds mean values, calculated on the basis of all elements except As, Ba, Ca, Na, K, Rb, and Cs. For the sake of an easier comparability, the data are additionally normalized to the average concentration of core slices CRC 5-3, 6-3, and 18-3 (for Cs only 5-3 and 6-3). The plotted errors correspond to the statistical error of the NAA. Analcime only crystallized in the three samples on the right.
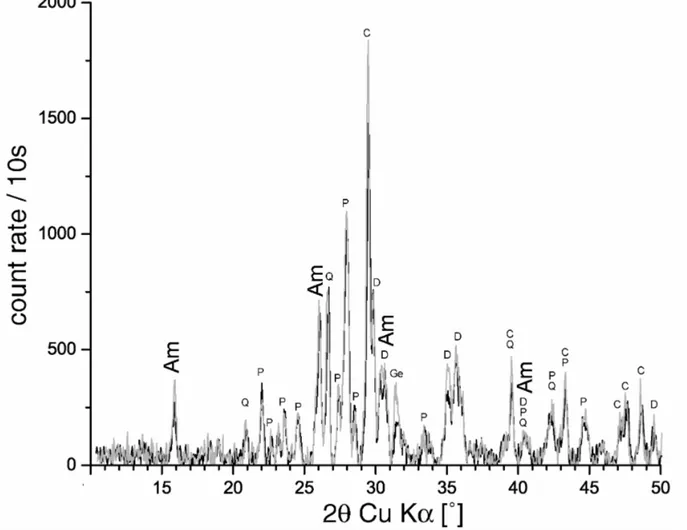
Fig. 8: Background corrected diffractograms of the slices MCF 34-3 (core, black) and MCF 34-1 (surface, grey). Q: quartz, C: calcite, P: plagioclases, D: pyroxenes (mostly diopside), Ge: gehlenite, Am: analcime. A significant variation of the analcime-reflex intensities between core and surface cannot be noted.