www.impactjournals.com/oncotarget/
Oncotarget, Vol. 7, No. 21
Metabolic pathways regulated by TAp73 in response to oxidative
stress
Massimiliano Agostini
1,2, Margherita Annicchiarico-Petruzzelli
3, Gerry Melino
1,2and Alessandro Rufini
41 Medical Research Council, Toxicology Unit, Leicester University, Leicester, UK
2 Department of Experimental Medicine and Surgery, University of Rome “Tor Vergata”, Rome, Italy
3 Biochemistry Laboratory IDI-IRCC, Department of Experimental Medicine and Surgery, University of Rome “Tor Vergata”,
Rome, Italy
4 Department of Cancer Studies, CRUK Leicester Cancer Centre, University of Leicester, Leicester, UK
Correspondence to: Alessandro Rufini, email: [email protected] Keywords: p73, p53 family, oxidative stress, metabolism, ROS
Received: February 22, 2016 Accepted: April 16, 2016 Published: April 22, 2016
AbstrAct
Reactive oxygen species are involved in both physiological and pathological processes including neurodegeneration and cancer. Therefore, cells have developed scavenging mechanisms to maintain redox homeostasis under control. Tumor suppressor genes play a critical role in the regulation of antioxidant genes. Here, we investigated whether the tumor suppressor gene TAp73 is involved in the regulation of metabolic adaptations triggered in response to oxidative stress. H2O2 treatment resulted in numerous biochemical changes in both control and TAp73 knockout (TAp73-/-) mouse embryonic fibroblasts, however the extent of these changes was more pronounced in TAp73-/- cells when compared to control cells. In particular, loss of TAp73 led to alterations in glucose, nucleotide and amino acid metabolism. In addition, H2O2 treatment resulted in increased pentose phosphate pathway (PPP) activity in null mouse embryonic fibroblasts. Overall, our results suggest that in the absence of TAp73, H2O2 treatment results in an enhanced oxidative environment, and at the same time in an increased pro-anabolic phenotype. In conclusion, the metabolic profile observed reinforces the role of TAp73 as tumor suppressor and indicates that TAp73 exerts this function, at least partially, by regulation of cellular metabolism.
IntroductIon
The maintenance of redox homeostasis is a crucial
task for the cell, as different levels of reactive oxygen
species can induce different biological responses,
often associated with pathologies such as cancer and
neurodegeneration [1-10]. High levels of ROS are
detrimental, whereas at low levels, ROS sustains
differentiation and proliferation, therefore acting as
signaling molecules [11-21]. Indeed, cells can produce
hydrogen peroxide (H
2O
2) in order to modulate biological
processes as diverse as proliferation, differentiation
and migration [22-26]. On the other hand, excessive
production of ROS leads to the deleterious oxidative
damage [27-31]. Hence, cells have developed numerous
ROS scavenging mechanisms [32-36], most notably
GSH [37, 38], catalase and superoxide dismutase and,
of note, most of them are regulated by different tumor
suppressor genes to safeguard cellular redox homeostasis
counteracting excessive ROS production [39-41]. Among
the tumor suppressor genes, the p53-family (p53, p63
and p73 proteins) [42-50] has a key role in controlling
antioxidant gene expression [51-54]. Indeed, p53 regulates
the expression of numerous antioxidant genes, including,
sestrins, TIGAR and glutaminase-2 (GLS2) [55-58], thus
contributing to ROS homeostasis.
Recent studies have also demonstrated an
essential role for p73 and p63 in regulation of oxidative
metabolism. In fact, deletion of the long TAp73 isoform
of p73 increases ROS production and oxidative stress by
affecting electron flux during mitochondrial oxidative
phosphorylation and flux through the oxidative arm of the
PPP [59-61]. Similarly, p63 contributes to the maintenance
of a balanced redox state in keratinocytes and lung
cancer cells through the regulation of GLS2, cytoglobin,
hexokinase-II and REDD1 [62-65].
The aim of this study was to identify the differences
in global biochemical responses to oxidative stress
between wild-type and TAp73 knock-out
(TAp73-/-) mouse embryonic fibroblasts (MEFs(TAp73-/-), with the held
hypothesis that TAp73 controls oxidative metabolism and
response to oxidative stress. H
2O
2treatment resulted in
numerous biochemical changes in both WT and
TAp73-/- cells, but the number and extent of these changes was
more robust in TAp73-/- cells as compared to WT control.
Overall, it appears that in the absence of TAp73, H
2O
2treatment results in an enhanced oxidative environment,
possibly promoted by an increased nucleotide catabolism,
concomitant to a decreased apoptotic biochemical profile
as compared to TAp73-proficient cells.
results
H
2o
2induced-oxidative stress and glutathione
recycling is potentially greater in tAp73-/- versus
Wt MeFs
In order to explore the metabolic role of TAp73
in oxidative stress, MEF derived from TAp73-/- and
control mice were treated with H
2O
2and then subjected
GC-MS and LC-MS-MS platforms for metabolomics
studies as previously described [66]. The total numbers of
significantly or nearly-significantly altered biochemicals
are reported in Table S1.
The tripeptide glutathione
(gamma-glutamyl-cysteinylglycine) functions as one of the major antioxidants
in cells [67]. Both reduced and oxidized glutathione
(GSH and GSSG) levels were increased following the
H
2O
2treatment time course in the WT and TAp73-/-
cells, but these increases were greater in TAp73-/- cells
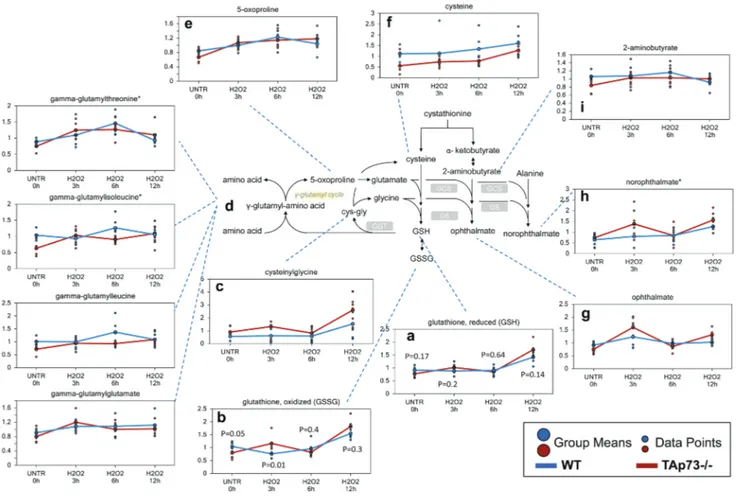
Figure 1: Glutathione recycling is potentially greater in tAp73-/- versus Wt MeF.
GSH is a key antioxidant molecule within the cell. The availability of the amino acid precursor, cysteine, and the activity of the rate-limiting enzyme, glutamate cysteine ligase, are the key factors in GSH synthesis. a.-i. Levels of the indicated metabolites were evaluated as described in material and methods. Anova contrasts t-tests were used to identify biochemicals that differed significantly between experimental groups (n = 5 for each time point). P-values for reduced and oxidized glutathione are also reported for each time point.(Figure 1a and 1b). In addition, biochemicals associated
with increased glutathione recycling (cysteinylglycine,
gamma-glutamyl-amino acids, and 5-oxoproline) were
also more elevated in the TAp73-/- cells, suggesting an
increased rate of glutathione turnover occurring in the
TAp73-/- cells over the course of H
2O
2treatments (Figure
1c-1e). Cysteine, which is the rate-limiting precursor to
glutathione [68], showed increased levels in both WT and
TAp73-/- cells during the H
2O
2treatment and this increase
was more pronounced and reached statistical significance
in TAp73-/- cells. However, the absolute levels of cysteine
remained consistently lower in the TAp73-/- cells,
suggesting reduced cysteine precursor for glutathione
biosynthesis (Figure 1f). The increased glutathione levels
in both WT and TAp73-/- MEFs during the time course
suggest that cysteine biosynthesis is enhanced by H
2O
2in
order to fuel the supply of glutathione. It should be noted
that, in untreated cells (UNTR) the levels of cysteine
were significantly lower in TAp73-/- as compared to WT,
and remained such throughout the H
2O
2time course. In
keeping with the reduced cysteine levels in TAp73-/- cells,
we identified increased levels of the tripeptides opthalmate
(gamma-glutamyl-alpha-aminobutyrylglycine) (Figure
1g) and norophthalmate (gamma-glutamyl-alanylglycine)
(Figure 1h) in knockout cells as compared to WT controls
following H
2O
2treatment. 2-aminobutyrate and alanine
replace cysteine during the synthesis of ophthalmate
and norophthalmate respectively (Figure 1i). Thus,
the increase in ophthalmate and norophthalmate could
suggest either adaptation to limiting cysteine levels or
to augmented glutathione synthetase (GCS) activity,
triggered by oxidative environment. Increased levels of
the oxidative by-product of sterols, such as oxysterols,
7-ketocholesterol and 7-beta-hydroxycholesterol further
support an increased oxidative environment in the
TAp73-/- cells as compared to WT cells (Table S1).
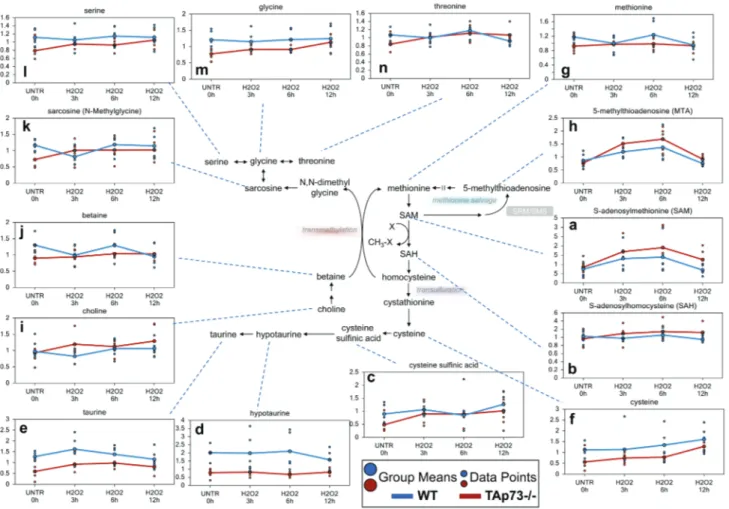
Figure 2: loss of tAp73 enhances methionine metabolism following H
2o
2treatment.
Methionine is the initiating amino acid in the synthesis of eukaryotic proteins. Methionine metabolism begins with its activation to SAM by methionine adenosyltransferase. a.-n. Levels of the indicated metabolites were evaluated as described in material and methods. Anova contrasts t-tests were used to identify biochemicals that differed significantly between experimental groups (n = 5 for each time point).Methionine metabolism is enhanced following
H
2o
2treatment predominately in tAp73-/- cells
cysteine biosynthesis
As previously stated, cysteine levels were elevated
in both WT and TAp73-/- cells over the H
2O
2treatment
time course, but these increases were more robust in
TAp73-/- cells. The major source for cysteine biosynthesis
is through methionine metabolism [69]. H
2O
2treatment
induced significant increases in the methionine metabolite,
S-adenosylmethionine (SAM), in both the WT and
TAp73-/- cells, with TAp73-TAp73-/- cells having more robust changes
(Figure 2a). In addition, S-adenosylhomosysteine (SAH),
which is formed when SAM participates in methylation
events, demonstrated a trend of increasing levels in
TAp73-/- over the H
2O
2time course, but this increase did
not reach significance, while SAH was unchanged over
time in WT (Figure 2b). One possible explanation for
why SAH showed non-significant increases in
TAp73-/- and was unchanged in WT could be due to increased
metabolism to homocysteine and subsequently to
cystathionine to fuel cysteine biosynthesis. The previously
described increase in cysteine supports this possibility.
Not only can cysteine be metabolized to glutathione, but
it can also be oxidized to cysteine sulfinic acid, which can
be further metabolized to hypotaurine and taurine. This
metabolic route further depletes the cells of cysteine for
glutathione synthesis. While cysteine sulfinic acid was
increased in WT cells depending upon the H
2O
2time point
investigated, this increase never reached significance, and
neither hypotaurine nor taurine were significantly changed
in WT (Figure 2c-2e). In contrast, cysteine sulfinic acid
was significantly elevated in the TAp73-/- cells following
H
2O
2treatment as compared to UNTR cells (Figure 2c),
and although hypotaurine was unchanged, taurine was also
significantly elevated in the TAp73-/- cells over the H
2O
2time course (Figure 2d and 2e). The lack of change in
hypotaurine in TAp73-/- cells may reasonably result from
subsequent metabolism to taurine. Thus, the already lower
pool of cysteine in TAp73-/- cells (Figure 2f) appears to
be further decreased by conversion to cysteine sulfinic
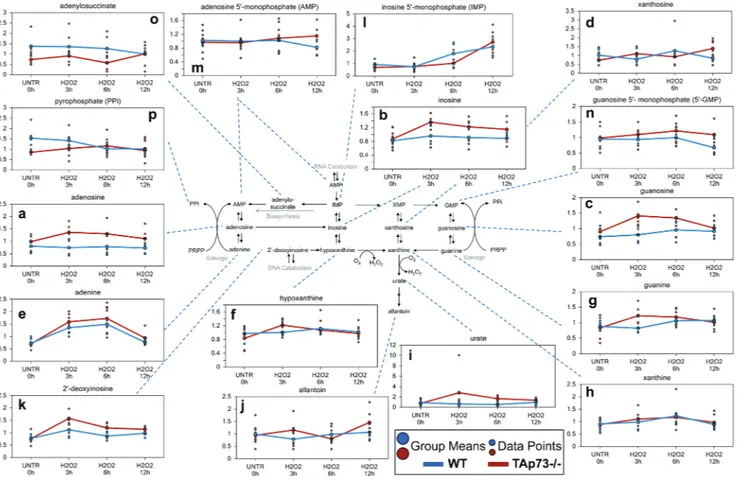
Figure 3: Purine associated metabolites.
a.-p. Levels of the indicated metabolites were evaluated as described in material and methods. Anova contrasts t-tests were used to identify biochemicals that differed significantly between experimental groups (n = 5 for each time point).acid at a higher rate than that seen in WT and may have
adverse effects on the synthesis of glutathione and thus
compromise redox homeostasis in the TAp73-/- cells.
Methionine salvage and transmethylation
Although there appeared to be an increase in
methionine metabolism in both the WT and TAp73-/-
cells, methionine levels were only significantly lower at
the 12 hour H2O2 time point in the WT cells and were
unchanged throughout the H
2O
2treatments in the TAp73-/-
cells (Figure 2g), which may suggest increased methionine
salvage at the earlier time points in WT and TAp73-/-
cells. Increased methionine salvage was supported by the
significant increase in 5-methylthioadenosine (MTA) in
both WT and TAp73-/- cells following 3 and 6 hours H
2O
2treatment, and this treatment-induced increase was greater
in the TAp73-/- cells as compared to WT cells (Figure 2h).
In addition to increased methionine salvage, it is possible
that increased transmethylation following H
2O
2treatment
also contributed to the lack of change in methionine
levels in the TAp73-/- cells. Elevated transmethylation
in H
2O
2-treated TAp73-/- cells was supported by changes
in choline, betaine, and sarcosine, glycine, serine and
threonine in the TAp73-/- cells (Figure 2i-2n). Briefly,
choline can be oxidized to betaine, and betaine can
be further metabolized to N,N-dimethylglycine by
functioning as a methyl source for the transmethylation
of homocysteine back to methionine. Although
N,N-dimethylglycine was below the level of detection in
TAp73-/- cells, its metabolite sarcosine was increased in
the TAp73-/- cells throughout the H
2O
2treatment time
course, further supporting increased transmethylation.
Sarcosine is rapidly degraded to the amino acids glycine,
and glycine can be further metabolized to either threonine
or serine. Thus, the increases observed in these amino
acids support increased transmethylation activity. It is
possible that the increase in sarcosine in the TAp73-/-
cells is a consequence of increased glycine, which can be
methylated to sarcosine, and thus would suggest increased
amino acid uptake in the TAp73-/- cells is responsible for
the increased sarcosine. Although increased amino acid
uptake is possible, due to the additional changes observed
for methionine metabolism, increased transmethylation
remains a likely explanation for the observed changes in
methionine-associated biochemicals.
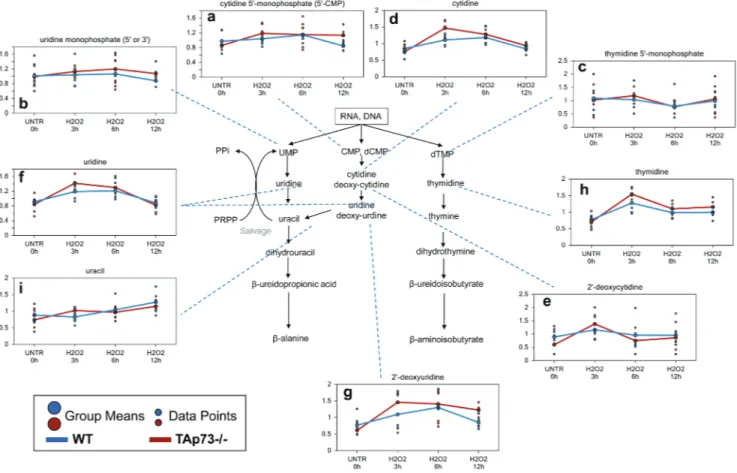
Figure 4: Pyrimidine associated metabolites.
a.-i. Levels of the indicated metabolites were evaluated as described in material and methods. Anova contrasts t-tests were used to identify biochemicals that differed significantly between experimental groups (n = 5 for each time point).Effects on nucleotide metabolism by H
2o
2treatment of tAp73-/- are more profound
compared to Wt
Purine associated metabolites
Interestingly, only the TAp73-/- cells demonstrated
significant or trending increases in the purine nucleosides
(adenosine, inosine, and guanosine, and xanthosine)
(Figure 3a-3d) and nucleobases (adenine, hypoxanthine,
and guanine) following 3 hours H
2O
2treatment (Figure
3e-3g). Both hypoxanthine and guanine can be metabolized to
xanthine (Figure 3h), which is subsequently metabolized
to urate (Figure 3i) and allantoin (Figure 3j). Xanthine
increase initiated at 3 hours of treatment and reached
significance at 6 hours in the TAp73-/- cells. We also
identified a large, but not significant, increase in urate
in TAp73-/- cells following H
2O
2treatment, and this
probably fuelled the significant increase in allantoin at the
12 hours H
2O
2treatment time point. The increases in urate
and allantoin would suggest that purine catabolism further
increased H
2O
2levels in the TAp73-/- cells potentiating
the effects of H
2O
2treatment in these cells. In contrast,
in WT cells, only xanthine showed an increase, which
only trended towards significance. Probably xanthine
increase was fuelled by direct conversion of its precursor
2’-deoxyinosine (Figure 3k), which was significantly
increased at 3 hours in both WT and TAp73-/- cells. Once
again this increase was not only larger in the TAp73-/-
cells, but 2’deoxyinosine was also significantly elevated
in TAp73-/- cells throughout the entire H
2O
2time course.
These changes suggest increased purine catabolism
following H
2O
2treatment is more severe in TAp73-/- cells.
In addition to increases in purine catabolites,
there was also an increase in the nucleotides, inosine
5’monophosphate (IMP), adenosine 5’-monophosphate,
and guanosine 5’-monophosphate (5’-GMP) in the
TAp73-/- cells (Figure 3l-3n), although only the increment in IMP
reached significance at the 12 hours H
2O
2time point. AMP
was unchanged at 3 hours, but a non-significant increase
at the 6 and 12 hours H
2O
2treatment time points was
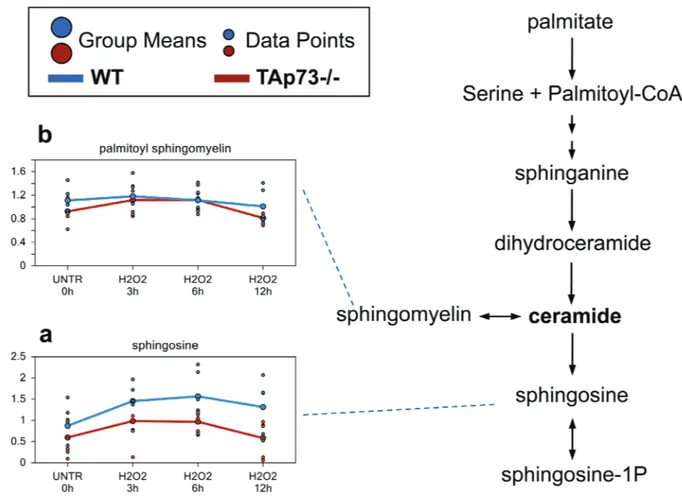
Figure 5: sphingosine and ceramide metabolism.
Ceramide is a sphingolipid which functions as bioactive signaling molecule. Ceramide plays key roles in a variety of cellular responses, including regulation of cell growth, viability, differentiation, and senescence. a.-b. Levels of the indicated metabolites were evaluated as described in material and methods. Anova contrasts t-tests were used to identify biochemicals that differed significantly between experimental groups (n = 5 for each time point).observed in TAp73-/- cells. In contrast, 5’-GMP levels
were increased throughout the H
2O
2treatments in
TAp73-/- cells, but these changes never reached significance.
The changes in IMP and AMP were greatest at 12 hours
H
2O
2, while the majority of the previously discussed
purine catabolites were increased the greatest at 3 hours.
Thus, the changes in IMP and AMP may represent either
increased purine salvage or biosynthesis to compensate
for the increased purine catabolism in the TAp73-/- cells
following H
2O
2treatment. The trending increases in
pyrophosphate (PPi) (Figure 3o), which is formed from
phosphoribosyl pyrophosphate (PRPP) during salvage
and biosynthesis, and the purine biosynthesis intermediate
adenylosuccinate potentially support a late increase in both
purine salvage and biosynthesis in TAp73-/- cells (Figure
3p). Nonetheless, we cannot formally rule out that RNA
breakdown could contribute to changes in the nucleotide
pool.
In contrast to what was observed in TAp73-/- cells,
IMP levels were significantly elevated only at the later
H
2O
2time points in WT cells, but PPi, adenylosuccinate,
and AMP levels trended downwards in the WT cells. Thus,
there does not appear to be increased purine salvage or
biosynthesis in the WT cells, and the increase in IMP may
rather represent enhanced purine catabolism at a later
H
2O
2time point in WT cells compared to TAp73-/- cells.
Pyrimidine associated metabolites
A number of pyrimidine catabolites, likely
associated with increased DNA and RNA breakdown,
were increased following H
2O
2treatment in both WT
and TAp73-/- cells and these changes were in general
greatest at the 3 hour time point and in the TAp73-/- cells.
These changes included early increases in the pyrimidine
nucleotides (cytidine 5’-monophosphate, uridine
monophosphate, and thymidine 5’monophosphate) (Figure
4a-4c), and nucleosides (cytidine, 2’-deoxycytidine,
uridine, 2’-deoxyuridine, and thymidine) and the
pyrimidine base (uracil) (Figure 4d-4i). Although PPi is
also generated by pyrimidine salvage and/or biosynthesis,
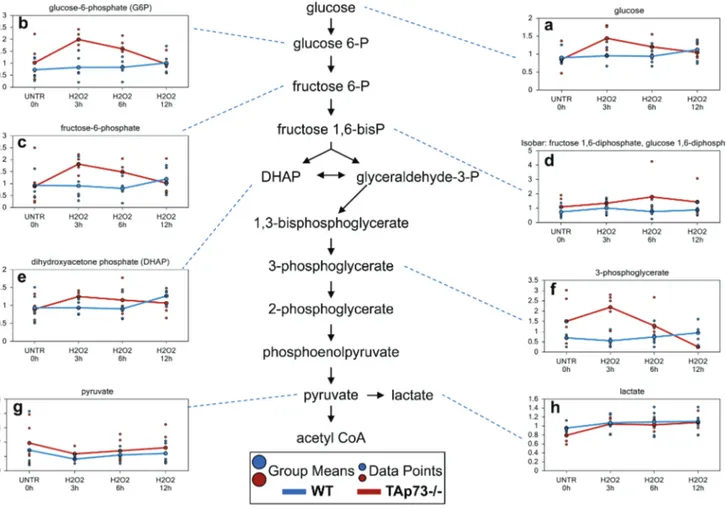
Figure 6: Glycolysis is increased early only in tAp73-/-following H
2o
2treatment.
Glycolysis is the metabolic pathway that converts glucose into pyruvate. a.-h. Levels of the indicated metabolites were evaluated as described in material and methods. Anova contrasts t-tests were used to identify biochemicals that differed significantly between experimental groups (n = 5 for each time point).the observed changes in pyrimidine-associated metabolites
do not indicate this is occurring. Rather, the observed
changes suggest increased pyrimidine catabolism
following H
2O
2treatment, and this is more severe in the
TAp73-/- cells.
Difference in sphingosine levels may reflect
decreased ceramide in tAp73-/- cells
Increases in ceramide have been associated with
growth arrest, differentiation, senescence, and H
2O
2-induced apoptosis [70-72]. Although we failed to detected
ceramide directly, its metabolite sphingosine had a
trending increase at the 3 hours H
2O
2treatment time point
and was significantly increased at 6 hours in both WT and
TAp73-/- cells (Figure 5a). At the 12 hours, the increase
in sphingosine was maintained only in the WT cells,
while the levels went back to control levels in
TAp73-/- cells. Furthermore, overall levels of sphingosine were
consistently lower in TAp73-/- cells compared to WT
cells at any time point investigated. The differences in
sphingosine levels suggest increased ceramide in WT cells
compared to TAp73-/- cells following H
2O
2treatment.
The reason for this increase in sphingosine remains
unclear. Indeed, although H
2O
2is known to increase
sphingomyelinase activity and de novo ceramide synthesis,
we did not observe changes in palmitoyl sphingomyelin,
hence excluding increased sphingomyelinase activity.
Therefore, we believe that de novo synthesis is the most
reasonable explanation for the higher sphingosine levels
(Figure 5b).
Glycolysis is increased early only in tAp73-/- cells
following H
2o
2treatment
One of the biggest differences between WT and
TAp73-/- cells following H
2O
2treatment was observed
in glucose metabolism. Upon cell entry, glucose is
immediately phosphorylated to glucose-6-phosphate
which then can either be shunted to the PPP for NADPH
production and nucleotide biosynthesis or continue
through glycolysis generating pyruvate and subsequently
acetyl-CoA to supply to the tricarboxylic acid (TCA)
cycle for oxidative energy metabolism. We identified
concerted, albeit non-significant, increases in glycolytic
intermediates glucose-6-phosphate, fructose-6-phosphate,
fructose 1,6-diphosphate (observed as an isobar with
glucose 1,6-diphosphate), dihydroxyacetone phosphate
and 3-phosphoglycerate (Figure 6a-6f) in WT H
2O
2-treated
cells compared to WT UNTR cells at the 12 hour time
point. In contrast, glucose and the glycolytic intermediates
were increased earlier in the TAp73-/- cells at 3 and 6
hours, but returned to or fell below UNTR levels at 12
hour H
2O
2treatment. Notwithstanding these changes,
pyruvate levels in both WT and TAp73-/- (Figure 6g)
cells were lower at the 3 hour treatment compared to their
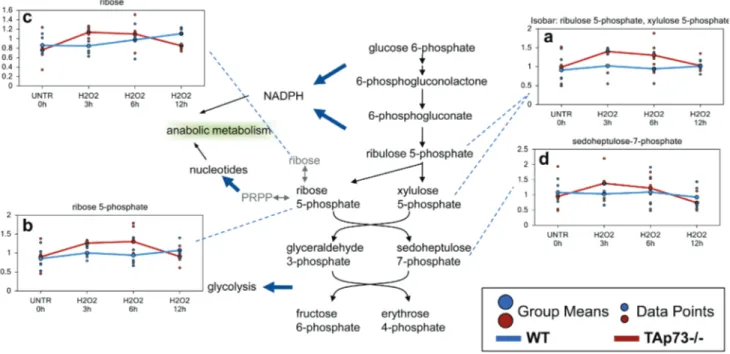
Figure 7: enhanced PPP in tAp73-/- MeF after H
2o
2treatment.
The PPP is a metabolic pathway that generates NADPH and ribose for nucleotide biosynthesis. a.-d. Levels of the indicated metabolites were evaluated as described in material and methods. Anova contrasts t-tests were used to identify biochemicals that differed significantly between experimental groups (n = 5 for each time point).respective UNTR cells and subsequently began to trend
upwards back to UNTR levels following 6 and 12 hour
H
2O
2treatments in both WT and TAp73-/-. In summary,
H
2O
2treatment results in an early response in
TAp73-/- cells with enhanced glycolysis, while this activity is
unchanged until 12 hours following H
2O
2treatment in
WT cells.
Increased glycolysis induced by H
2o
2in tAp73-/-
cells sustains enhanced PPP
As previously discussed, one potential consequence
of an early increase in glycolysis in the TAp73-/- cells
following H
2O
2treatment could be an increase in the
PPP for NADPH production and nucleotide biosynthesis.
Through sequential enzymatic steps, glucose 6-phosphate
can be metabolized to ribulose 5-phosphate (observed
as an isobar with xylulose 5-phosphate). Ribulose
5-phosphate is subsequently processed to ribose
5-phosphate, which can be metabolized to the end
product ribose or to PRPP for nucleotide synthesis. All
these metabolites were increased in TAp73-/- MEFs at
3 hour and 6 hour treatment (Figure 7a-7c). The
PPP-associated biochemical sedoheptulose 7-phosphate was
also increased in early H
2O
2-treated TAp73-/- cells,
although these changes did not reach significance (Figure
7d). The changes clearly indicate that increased glycolysis
in TAp73-/- cells following H
2O
2treatment results in
increased PPP activity that does not occur in WT cells.
urea cycle associated biochemicals are altered in
cells treated with H
2o
2We identified changes in urea cycle-associated
biochemicals compatible with anaplerotic production
of TCA cycle intermediates fumarate. The urea cycle
functions to convert toxic ammonia to urea during amino
acid catabolism [73]. The amino acid aspartate enters
the urea cycle by condensing with citrulline to produce
argininosuccinate. Argininosuccinate is then cleaved to
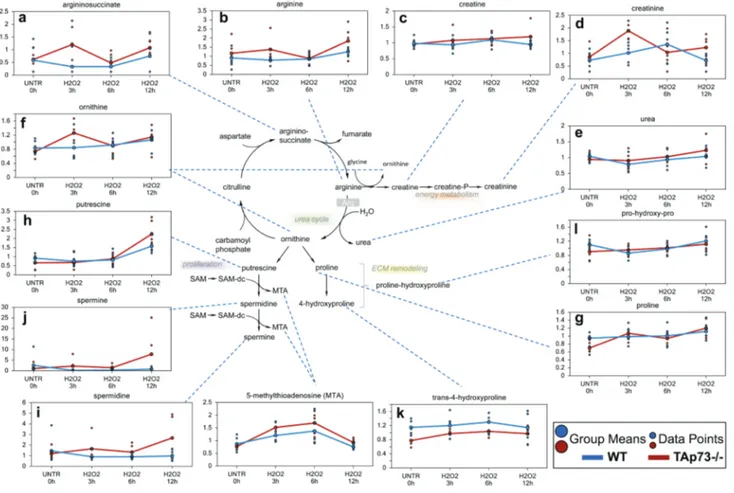
Figure 8: urea cycle.
In the urea cycle, ornithine combines with ammonia to form citrulline. Then, a second amino group is transferred to citrulline from aspartate to form arginine the immediate precursor of urea. Arginine is hydrolyzed to urea and ornithine; thus ornithine is regenerated in each turn of the cycle. a.-l. Levels of the indicated metabolites were evaluated as described in material and methods. Anova contrasts t-tests were used to identify biochemicals that differed significantly between experimental groups (n = 5 for each time point).form fumarate and arginine. In general, both significant
and trending increases in aspartate, argininosuccinate and
arginine (Figure 8a and 8b) were observed in WT and
TAp73-/- cells upon H
2O
2treatment, which correlated
with significant increased levels of fumarate and malate
(all H
2O
2treatment time points in TAp73-/- cells and
only 12 hour H
2O
2time point in WT cells). Arginine
can be further metabolized to creatine, which can be
phosphorylated to creatine-phosphate, an energy storage
compound. Interestingly, TAp73-/- cells showed trending
increase in creatine levels over the H
2O
2treatment time
points that reached significance at 12 hours, an effect not
observed in WT cells (Figure 8c). Changes in the levels of
the spontaneous creatine-phosphate breakdown product,
creatinine, also were observed during various time points
of the H
2O
2treatment time course (Figure 8d). The exact
consequence of these changes is not clear, but an intriguing
possibility is that creatine phosphate metabolism in both
WT and TAp73-/- cells following H
2O
2treatment acts as a
potential survival mechanism.
Since ornithine is also produced during the
metabolism of arginine to creatine, this may account
for the increase in ornithine at the earlier time points
in TAp73-/- cells, even though urea was unchanged.
Ornithine can be further metabolized to proline (Figure
8g), whose metabolites contribute to synthesis of
collagen or to the polyamines (putrescine, spermidine and
spermine) (Figure 8h-8j). While no changes were observed
in metabolites associated with extracellular matrix
remodeling and collagen breakdown (proline,
trans-4-hydroxyproline or pro-hydroxy-proline) in WT cells, all
three of these biochemicals were significantly increased
following H
2O
2treatment in TAp73-/- cells depending
upon the time point investigated (Figure 8k and 8l). In
addition, the proliferation-associated polyamines were
increased in the TAp73-/- cells over the H
2O
2treatment
time course and these increases reached significance at 12
hours. Overall, these changes in urea cycle metabolites in
WT and TAp73-/- cells suggest that oxidative stress caused
an early increase in biochemicals associated with the urea
cycle in TAp73-/- cells that were not observed in WT cells.
Such changes in TAp73-/- cells supports enhanced energy
metabolism and anabolic activity in these cells.
dIscussIon
p73, together with p63 and p53, belongs to the
well-established p53 gene family of transcription factors.
Of these, p53 was discovered almost 40 years ago and
still remains one of the most intensively studied tumor
suppressor genes; as a consequence it shows very diverse,
complex and articulated physiological functions, spanning
from regulation of apoptosis, autophagy, mitochondria
activity and oxygen radical homeostasis metabolism,
DNA damage and repair pathways, maintenance of stem
cell repertoire, as well as cell lineage determination
[74-93]. Despite all these years of exciting investigations,
many controversial issues remain to be fully clarified to
elucidate the physiological and pathological roles of the
p53. This wide complexity raises from different aspects
and facts, including regulation by proteasomal degradation
[54, 94-98] and micro-RNA [99-107] or the existence
of numerous splicing variants [108-116]. Accordingly,
significant efforts are under way to harness its potential
practical application for human diseases, especially with
regard to cancer [117-126]. On the other hand, p63 and
p73 were discovered only circa 15 years ago [127-130],
but already show a complexity comparable to p53, as
well as a fascinating intricate interaction with p53 itself
[49, 131-135]. Importantly, a certain degree of specificity
characterizes p63 and p73. Indeed, p63 is pivotal for
epidermal formation and homeostasis [136-144], as well
as playing a role in cancer and metastasis [133, 145-156],
and fertility [157-159], whereas p73 has peculiar roles in
neuronal development [160-164] and fertility [165-168].
Additionally, TAp73 is a known tumor suppressor gene
that regulates cell cycle progression, survival, genomic
stability, hypoxia and angiogenesis [42, 45, 166, 169-178]
Numerous accruing findings indicate that TAp73 can
also regulate cell metabolism [59, 61, 179-183]. Indeed,
we recently showed that ectopic expression of TAp73
increases rate of glycolysis, and stimulated amino acid
uptake, nucleotide biosynthesis and biosynthesis of
acetyl-CoA [182, 183]. In addition, TAp73 plays an important role
in the maintenance of redox homeostasis either by directly
regulating the expression of the mitochondrial complex IV
subunit cytochrome C oxidase subunit 4 (COX4I1) or by
enhancing the PPP flux and hence NADPH biosynthesis
[59-61]. Prompted by these findings, we sought to
broaden our investigation onto whether TAp73-mediated
regulation of metabolism contributes to the orchestration
of cellular responses to external oxidative stress. Toward
this end, we exposed TAp73 knockout and control
MEFs to H
2O
2-mediated oxidative damage and assessed
metabolic changes over a 12h time course. Overall, this
study shows that a number of biochemical pathways are
significantly altered following H
2O
2treatment. While
H
2O
2induces a plausible oxidative stress response in both
WT and TAp73-/- cells, the degree of response appears
to be greater in TAp73-/- cells, suggesting increased
susceptibility to oxidative stress in TAp73-/- cells, as
previously demonstrated [59]. Notwithstanding this
evidence, TAp73-/- cells probably decrease biochemicals
associated with apoptosis (as demonstrated by sphingosine
metabolism). Moreover, TAp73-/- cells shows changes in
glucose metabolism and amino acid metabolism at earlier
time points than WT cells, which may not only allow
the cells to handle the oxidative stress through increased
NADPH production, but may also result in pro-anabolic
activity in the TAp73-/- cells. The increase in ribulose
5-phosphate/xylulose 5-phosphate in the TAp73-/- cells
compare to WT cells, may suggest that an increased
pool of NADPH was available to reduce glutathione. In
addition, the early increases in ribose 5-phosphate and
ribose in TAp73-/- following H
2O
2treatment may indicate
both an increase in the metabolism of ribose 5-phosphate
to ribose, but also an increased capacity for nucleotide
biosynthesis. This finding deserves further investigation,
but, in any case, the observed changes clearly indicate
that increased glycolysis in TAp73-/- cells following H
2O
2treatment boosts PPP activity, an adaptation not occurring
in WT cells. Intriguingly, despite the increased PPP flux
should lead to enhanced NADPH synthesis and therefore
higher GSH levels, we failed to detect any increase in
the reduced glutathione pool in TAp73-/- MEFs. The
reason for this is unclear and an accurate measurement
of NADPH/NADP dynamics in these cells might help
explaining this apparent conundrum. Moreover, it is also
possible that the severe oxidative environment caused by
exposure to H
2O
2might have blunted any change in GSH
or that the reduced pool of cysteine in TAp73-/- cells could
have limited glutathione biosynthesis compared to their
WT counterparts. Interestingly, with regard to cysteine, we
observed a higher increment triggered by H
2O
2treatment
in TAp73-/- cells compare to WT (Figures 1 and 2). It is
tempting to argue that such increase could be fueled by
the glycolytic intermediate 3-phosphoglycerate (3-PG).
Indeed, 3-PG is used to produce serine via the reaction
catalyzed by 3-PG dehydrogenase, phosphoserine
aminotransferase and phosphoserine phosphatase. In
turn, serine can produce cysteine via homocysteine.
Homocysteine can be the precursor of cysteine in a
two-step reaction, first the condensation between homocysteine
and serine catalyzed by cystathionine-β-synthase, followed
by cystathionine γ-lyase-mediated production of cysteine,
ammonia, and α-ketobutyrate. This attempt to compensate
for the reduce cysteine levels in response to oxidative
damage might contribute to the dampened glycolytic flux
observed in TAp73-/- cells.
We also observed changes in nucleotide metabolism
compatible with increased DNA and RNA breakdown that
is potentially a consequence of oxidative damage. Once
again, this increase in nucleotide breakdown appears to be
more severe in the TAp73-/- cells.
In summary, our results suggest that metabolic
changes in TAp73-/- cells following H
2O
2treatment
may result in a pro-growth metabolic profile of cells
that have undergone severe oxidative damage, rather
than in promotion of a cell death response under these
conditions. Hence, loss of TAp73 leads, at least under
oxidative stress conditions, to a rewiring of the cellular
metabolism that partially resembles metabolic changes
observed in cancer cells [2, 184-188], such as increase of
PPP flux. The findings presented here reinforce the role
of TAp73 as tumor suppressor gene and indicate that the
regulation of cellular metabolism by TAp73 contributes
to its tumor suppressor function. It is also fascinating to
speculate that such metabolic regulations might play a role
in the p53-family regulation of stem cells, as described by
several research groups [47, 49, 141, 163, 164, 189-195].
Similarly, recent findings, linking epithelial-mesenchymal
transition to nucleotide catabolism [196], open additional
scenarios whereby regulation of nucleotide metabolism,
so prominent for p73, might regulate additional
cancer-related phenotypes. These and other hypotheses await
investigation and could be easily tested with the use of
genetically modified animals or through the flourishing
CRISPR/Cas9 technology [197-199].
MAterIAls And MetHods
Mice
Generation and genotype protocol of TAp73
knock-out mice were described elsewhere [166]. Mice
were bred and subjected to listed procedures under the
Project License released from the UK Home Office. The
experimental design met the standards required by the UK
Coordinating Committee on Cancer Research guidelines
[200].
cell culture
Mouse embryonic fibroblasts (MEFs) were prepared
as previously described [59]. Briefly MEFs were isolated
from E13.5 littermate embryos and cultured in Dulbecco’s
modified Eagle’s medium (DMEM) supplemented with
10% fetal calf serum, 2mM L-glutamine. Cells were
treated with 0.25mM H
2O
2for the indicated time.
All experiments were performed within the first
3 passages from MEFs generation to avoid ensuing
senescence in primary mouse fibroblasts.
Metabolic analysis
Sample preparation
Cells were harvested after the treatment and cell
pellet stored at -80°C. Sample preparation was conducted
using a proprietary series of organic and aqueous
extractions to remove the protein fraction while allowing
maximum recovery of small molecules. The resulting
extract was divided into two fractions; one for analysis by
LC and one for analysis by GC. The organic solvent was
removed using a TurboVap
®(Zymark). Each sample was
then frozen and dried under vacuum.
liquid chromatography/mass spectrometry (lc/
Ms)
Samples were then prepared for the appropriate
instrument, either LC/MS or GC/MS. The sample extract
was split into two aliquots, dried and then reconstituted in
acidic or basic LC-compatible solvents. One aliquot was
analyzed using acidic positive ion optimized conditions
and the other using basic negative ion optimized conditions
in two independent injections using separate dedicated
columns. Extracts reconstituted in acidic conditions were
gradient eluted using water and methanol both containing
0.1% Formic acid, while the basic extracts, which also
used water/methanol, contained 6.5mM Ammonium
Bicarbonate. The MS analysis alternated between MS
and data-dependent MS
2scans using dynamic exclusion.
The LC/MS portion of the platform was based on a
Waters ACQUITY UPLC and a Thermo-Finnigan LTQ
mass spectrometer, which consisted of an electrospray
ionization (ESI) source and linear ion-trap mass analyzer.
Gas chromatography/mass spectrometry (GC/MS)
The samples for GC/MS analysis were re-dried
under vacuum desiccation for a minimum of 24 hours
prior to being derivatized under dried nitrogen using
bistrimethyl-silyl-triflouroacetamide (BSTFA). The GC
column was 5% phenyl and the temperature ramp is
from 40° to 300° C in a 16 minute period. Samples were
analyzed on a Thermo-Finnigan Trace DSQ fast-scanning
single-quadrupole mass spectrometer using electron
impact ionization.
Compound identification
Compounds were identified by comparison to
library entries of purified standards or recurrent unknown
entities. Identification of known chemical entities was
based on comparison to metabolomic library entries of
purified standards. The combination of chromatographic
properties and mass spectra gave an indication of a match
to the specific compound or an isobaric entity.
statistical analysis
For these studies we perform various ANOVA
procedures (e.g., repeated measures ANOVA). All results
with p < 0.05 was considered significant.
Abbreviations
TAp73, Transcriptionally active p73; DMEM,
Dulbecco minimal essential medium; FBS, fetal bovine
serum; GC, Gas chromatography; MS, Mass spectrometry;
LC, Liquid chromatography
AcknoWledGMents
We thank the staff members of the animal facility
at University of Leicester. This work has been supported
by the Medical Research Council, UK. This work
was supported by AIRC IG grant (2014-IG15653),
AIRC5xmille grant (2010-MCO #9979) and Fondazione
Roma NCDs grant awarded to G. M.
conFlIcts oF Interest
The authors declare no competing financial interests.
reFerences
1. Hayashi G and Cortopassi G. Oxidative stress in inherited mitochondrial diseases. Free radical biology & medicine. 2015; 88:10-17.
2. Park MT, Kim MJ, Suh Y, Kim RK, Kim H, Lim EJ, Yoo KC, Lee GH, Kim YH, Hwang SG, Yi JM and Lee SJ. Novel signaling axis for ROS generation during K-Ras-induced cellular transformation. Cell death and differentiation. 2014; 21:1185-1197.
3. Ogrunc M, Di Micco R, Liontos M, Bombardelli L, Mione M, Fumagalli M, Gorgoulis VG and d’Adda di Fagagna F. Oncogene-induced reactive oxygen species fuel hyperproliferation and DNA damage response activation. Cell death and differentiation. 2014; 21:998-1012.
4. Gorrini C, Harris IS and Mak TW. Modulation of oxidative stress as an anticancer strategy. Nature reviews Drug discovery. 2013; 12:931-947.
5. Janssen-Heininger YM, Mossman BT, Heintz NH, Forman HJ, Kalyanaraman B, Finkel T, Stamler JS, Rhee SG and van der Vliet A. Redox-based regulation of signal transduction: principles, pitfalls, and promises. Free radical biology & medicine. 2008; 45:1-17.
6. Agostini M, Di Marco B, Nocentini G and Delfino DV. Oxidative stress and apoptosis in immune diseases. Int J Immunopathol Pharmacol. 2002; 15:157-164.
7. Yan F, Wang Y, Wu X, Peshavariya HM, Dusting GJ, Zhang M and Jiang F. Nox4 and redox signaling mediate TGF-beta-induced endothelial cell apoptosis and phenotypic switch. Cell death & disease. 2014; 5:e1010.
8. Weinberg F, Hamanaka R, Wheaton WW, Weinberg S, Joseph J, Lopez M, Kalyanaraman B, Mutlu GM, Budinger GR and Chandel NS. Mitochondrial metabolism and ROS generation are essential for Kras-mediated tumorigenicity. Proceedings of the National Academy of Sciences of the United States of America. 2010; 107:8788-8793.
9. Singer E, Judkins J, Salomonis N, Matlaf L, Soteropoulos P, McAllister S and Soroceanu L. Reactive oxygen species-mediated therapeutic response and resistance in glioblastoma. Cell death & disease. 2015; 6:e1601.
10. Harris IS, Treloar AE, Inoue S, Sasaki M, Gorrini C, Lee KC, Yung KY, Brenner D, Knobbe-Thomsen CB, Cox MA, Elia A, Berger T, Cescon DW, Adeoye A, Brustle A, Molyneux SD, et al. Glutathione and thioredoxin antioxidant pathways synergize to drive cancer initiation and progression. Cancer cell. 2015; 27:211-222.
11. Vallelian F, Deuel JW, Opitz L, Schaer CA, Puglia M, Lonn M, Engelsberger W, Schauer S, Karnaukhova E, Spahn DR, Stocker R, Buehler PW and Schaer DJ. Proteasome inhibition and oxidative reactions disrupt cellular homeostasis during heme stress. Cell death and differentiation. 2015; 22:597-611.
12. Maryanovich M and Gross A. A ROS rheostat for cell fate regulation. Trends in cell biology. 2013; 23:129-134. 13. Caputa G, Zhao S, Criado AE, Ory DS, Duncan JG and
Schaffer JE. RNASET2 is required for ROS propagation during oxidative stress-mediated cell death. Cell death and differentiation. 2015.
14. Wei W, Lu Y, Hao B, Zhang K, Wang Q, Miller AL, Zhang LR, Zhang LH and Yue J. CD38 Is Required for Neural Differentiation of Mouse Embryonic Stem Cells by Modulating Reactive Oxygen Species. Stem Cells. 2015; 33:2664-2673.
15. Hoarau E, Chandra V, Rustin P, Scharfmann R and Duvillie B. Pro-oxidant/antioxidant balance controls pancreatic beta-cell differentiation through the ERK1/2 pathway. Cell Death Dis. 2014; 5:e1487.
16. Prozorovski T, Schneider R, Berndt C, Hartung HP and Aktas O. Redox-regulated fate of neural stem progenitor cells. Biochim Biophys Acta. 2015; 1850:1543-1554. 17. Jacquemin G, Margiotta D, Kasahara A, Bassoy EY, Walch
M, Thiery J, Lieberman J and Martinvalet D. Granzyme B-induced mitochondrial ROS are required for apoptosis. Cell death and differentiation. 2015; 22:862-874.
18. Murakami S and Motohashi H. Roles of NRF2 in cell proliferation and differentiation. Free Radic Biol Med. 2015.
19. Sela M, Tirza G, Ravid O, Volovitz I, Solodeev I, Friedman O, Zipori D, Gur E, Krelin Y and Shani N. NOX1-induced accumulation of reactive oxygen species in abdominal fat-derived mesenchymal stromal cells impinges on long-term proliferation. Cell Death Dis. 2015; 6:e1728.
20. Okoh VO, Garba NA, Penney RB, Das J, Deoraj A, Singh KP, Sarkar S, Felty Q, Yoo C, Jackson RM and Roy D. Redox signalling to nuclear regulatory proteins by reactive oxygen species contributes to oestrogen-induced growth of breast cancer cells. Br J Cancer. 2015; 112:1687-1702. 21. Hsu YC, Huang TY and Chen MJ. Therapeutic ROS
targeting of GADD45gamma in the induction of G2/M arrest in primary human colorectal cancer cell lines by cucurbitacin E. Cell Death Dis. 2014; 5:e1198.
22. Rhee SG. Cell signaling. H2O2, a necessary evil for cell signaling. Science. 2006; 312:1882-1883.
23. Olsen LF, Issinger OG and Guerra B. The Yin and Yang of redox regulation. Redox Rep. 2013; 18:245-252.
24. Pani G, Galeotti T and Chiarugi P. Metastasis: cancer cell’s escape from oxidative stress. Cancer metastasis reviews. 2010; 29:351-378.
25. Tormos KV, Anso E, Hamanaka RB, Eisenbart J, Joseph J, Kalyanaraman B and Chandel NS. Mitochondrial complex III ROS regulate adipocyte differentiation. Cell metabolism. 2011; 14:537-544.
26. Owusu-Ansah E and Banerjee U. Reactive oxygen species prime Drosophila haematopoietic progenitors for differentiation. Nature. 2009; 461:537-541.
27. Mikhed Y, Gorlach A, Knaus UG and Daiber A. Redox regulation of genome stability by effects on gene expression, epigenetic pathways and DNA damage/repair. Redox biology. 2015; 5:275-289.
28. Colin DJ, Limagne E, Ragot K, Lizard G, Ghiringhelli F, Solary E, Chauffert B, Latruffe N and Delmas D. The role of reactive oxygen species and subsequent DNA-damage response in the emergence of resistance towards resveratrol in colon cancer models. Cell death & disease. 2014; 5:e1533.
29. Liu J, Cao L, Chen J, Song S, Lee IH, Quijano C, Liu H, Keyvanfar K, Chen H, Cao LY, Ahn BH, Kumar NG, Rovira, II, Xu XL, van Lohuizen M, Motoyama N, et al. Bmi1 regulates mitochondrial function and the DNA damage response pathway. Nature. 2009; 459:387-392. 30. Neumann CA, Krause DS, Carman CV, Das S, Dubey DP,
Abraham JL, Bronson RT, Fujiwara Y, Orkin SH and Van Etten RA. Essential role for the peroxiredoxin Prdx1 in erythrocyte antioxidant defence and tumour suppression. Nature. 2003; 424:561-565.
31. Sahin E, Colla S, Liesa M, Moslehi J, Muller FL, Guo M, Cooper M, Kotton D, Fabian AJ, Walkey C, Maser RS, Tonon G, Foerster F, Xiong R, Wang YA, Shukla SA, et al. Telomere dysfunction induces metabolic and mitochondrial compromise. Nature. 2011; 470:359-365.
32. Schlegel CR, Georgiou ML, Misterek MB, Stocker S, Chater ER, Munro CE, Pardo OE, Seckl MJ and Costa-Pereira AP. DAPK2 regulates oxidative stress in cancer cells by preserving mitochondrial function. Cell death & disease. 2015; 6:e1671.
33. Perales-Clemente E, Folmes CD and Terzic A. Metabolic regulation of redox status in stem cells. Antioxidants & redox signaling. 2014; 21:1648-1659.
34. Itsumi M, Inoue S, Elia AJ, Murakami K, Sasaki M, Lind EF, Brenner D, Harris IS, Chio, II, Afzal S, Cairns RA, Cescon DW, Elford AR, Ye J, Lang PA, Li WY, et al. Idh1 protects murine hepatocytes from endotoxin-induced oxidative stress by regulating the intracellular NADP(+)/ NADPH ratio. Cell death and differentiation. 2015; 22:1837-1845.
35. Ye ZW, Zhang J, Townsend DM and Tew KD. Oxidative stress, redox regulation and diseases of cellular differentiation. Biochimica et biophysica acta. 2015; 1850:1607-1621.
36. Srivastava S, Sinha D, Saha PP, Marthala H and D’Silva P. Magmas functions as a ROS regulator and provides cytoprotection against oxidative stress-mediated damages. Cell death & disease. 2014; 5:e1394.
37. Kalinina EV, Chernov NN and Novichkova MD. Role of glutathione, glutathione transferase, and glutaredoxin in regulation of redox-dependent processes. Biochemistry Biokhimiia. 2014; 79:1562-1583.
38. Rocha CR, Garcia CC, Vieira DB, Quinet A, de Andrade-Lima LC, Munford V, Belizario JE and Menck CF. Glutathione depletion sensitizes cisplatin- and temozolomide-resistant glioma cells in vitro and in vivo. Cell death & disease. 2015; 6:e1727.
39. Klotz LO, Sanchez-Ramos C, Prieto-Arroyo I, Urbanek P, Steinbrenner H and Monsalve M. Redox regulation of FoxO transcription factors. Redox biology. 2015; 6:51-72. 40. Jiang L, Hickman JH, Wang SJ and Gu W. Dynamic roles
of p53-mediated metabolic activities in ROS-induced stress responses. Cell cycle. 2015; 14:2881-2885.
41. Gorrini C, Baniasadi PS, Harris IS, Silvester J, Inoue S, Snow B, Joshi PA, Wakeham A, Molyneux SD, Martin B, Bouwman P, Cescon DW, Elia AJ, Winterton-Perks Z, Cruickshank J, Brenner D, et al. BRCA1 interacts with Nrf2 to regulate antioxidant signaling and cell survival. The Journal of experimental medicine. 2013; 210:1529-1544. 42. Candi E, Agostini M, Melino G and Bernassola F. How
the TP53 Family Proteins TP63 and TP73 Contribute to Tumorigenesis: Regulators and Effectors. Human mutation. 2014; 35:702-14.
43. Soussi T and Wiman KG. TP53: an oncogene in disguise. Cell death and differentiation. 2015; 22:1239-1249. 44. Dotsch V, Bernassola F, Coutandin D, Candi E and Melino
G. p63 and p73, the ancestors of p53. Cold Spring Harbor perspectives in biology. 2010; 2:a004887.
45. Fernandez-Alonso R, Martin-Lopez M, Gonzalez-Cano L, Garcia S, Castrillo F, Diez-Prieto I, Fernandez-Corona A, Lorenzo-Marcos ME, Li X, Claesson-Welsh L, Marques MM and Marin MC. p73 is required for endothelial cell differentiation, migration and the formation of vascular networks regulating VEGF and TGFbeta signaling. Cell Death Differ. 2015; 22:1287-1299.
46. Lee HJ, Kim JM, Kim KH, Heo JI, Kwak SJ and Han JA. Genotoxic stress/p53-induced DNAJB9 inhibits the pro-apoptotic function of p53. Cell death and differentiation. 2015; 22:86-95.
47. Memmi EM, Sanarico AG, Giacobbe A, Peschiaroli A, Frezza V, Cicalese A, Pisati F, Tosoni D, Zhou H, Tonon G, Antonov A, Melino G, Pelicci PG and Bernassola F. p63 Sustains self-renewal of mammary cancer stem cells through regulation of Sonic Hedgehog signaling.
Proceedings of the National Academy of Sciences of the United States of America. 2015; 112:3499-3504.
48. Zaccara S, Tebaldi T, Pederiva C, Ciribilli Y, Bisio A and Inga A. p53-directed translational control can shape and expand the universe of p53 target genes. Cell death and differentiation. 2014; 21:1522-1534.
49. Fatt MP, Cancino GI, Miller FD and Kaplan DR. p63 and p73 coordinate p53 function to determine the balance between survival, cell death, and senescence in adult neural precursor cells. Cell death and differentiation. 2014; 21:1546-1559.
50. Zambetti GP. Expanding the reach of the p53 tumor suppressor network. Cell death and differentiation. 2014; 21:505-506.
51. Shi Y, Nikulenkov F, Zawacka-Pankau J, Li H, Gabdoulline R, Xu J, Eriksson S, Hedstrom E, Issaeva N, Kel A, Arner ES and Selivanova G. ROS-dependent activation of JNK converts p53 into an efficient inhibitor of oncogenes leading to robust apoptosis. Cell death and differentiation. 2014; 21:612-623.
52. Fitzgerald AL, Osman AA, Xie TX, Patel A, Skinner H, Sandulache V and Myers JN. Reactive oxygen species and p21Waf1/Cip1 are both essential for p53-mediated senescence of head and neck cancer cells. Cell death & disease. 2015; 6:e1678.
53. Boudreau HE, Casterline BW, Burke DJ and Leto TL. Wild-type and mutant p53 differentially regulate NADPH oxidase 4 in TGF-beta-mediated migration of human lung and breast epithelial cells. British journal of cancer. 2014; 110:2569-2582.
54. Peuget S, Bonacci T, Soubeyran P, Iovanna J and Dusetti NJ. Oxidative stress-induced p53 activity is enhanced by a redox-sensitive TP53INP1 SUMOylation. Cell death and differentiation. 2014; 21:1107-1118.
55. Bensaad K, Tsuruta A, Selak MA, Vidal MN, Nakano K, Bartrons R, Gottlieb E and Vousden KH. TIGAR, a p53-inducible regulator of glycolysis and apoptosis. Cell. 2006; 126:107-120.
56. Lee P, Hock AK, Vousden KH and Cheung EC. p53- and p73-independent activation of TIGAR expression in vivo. Cell Death Dis. 2015; 6:e1842.
57. Sablina AA, Budanov AV, Ilyinskaya GV, Agapova LS, Kravchenko JE and Chumakov PM. The antioxidant function of the p53 tumor suppressor. Nature medicine. 2005; 11:1306-1313.
58. Suzuki S, Tanaka T, Poyurovsky MV, Nagano H, Mayama T, Ohkubo S, Lokshin M, Hosokawa H, Nakayama T, Suzuki Y, Sugano S, Sato E, Nagao T, Yokote K, Tatsuno I and Prives C. Phosphate-activated glutaminase (GLS2), a p53-inducible regulator of glutamine metabolism and reactive oxygen species. Proc Natl Acad Sci U S A. 2010; 107:7461-7466.
59. Rufini A, Niklison-Chirou MV, Inoue S, Tomasini R, Harris IS, Marino A, Federici M, Dinsdale D, Knight RA, Melino
G and Mak TW. TAp73 depletion accelerates aging through metabolic dysregulation. Genes & development. 2012; 26:2009-2014.
60. Jiang P, Du W and Yang X. A critical role of glucose-6-phosphate dehydrogenase in TAp73-mediated cell proliferation. Cell cycle. 2013; 12:3720-3726.
61. Du W, Jiang P, Mancuso A, Stonestrom A, Brewer MD, Minn AJ, Mak TW, Wu M and Yang X. TAp73 enhances the pentose phosphate pathway and supports cell proliferation. Nature cell biology. 2013; 15:991-1000. 62. Giacobbe A, Bongiorno-Borbone L, Bernassola F, Terrinoni
A, Markert EK, Levine AJ, Feng Z, Agostini M, Zolla L, Agro AF, Notterman DA, Melino G and Peschiaroli A. p63 regulates glutaminase 2 expression. Cell cycle. 2013; 12:1395-1405.
63. Latina A, Viticchie G, Lena AM, Piro MC, Annicchiarico-Petruzzelli M, Melino G and Candi E. DeltaNp63 targets cytoglobin to inhibit oxidative stress-induced apoptosis in keratinocytes and lung cancer. Oncogene. 2016; 35:1493-503.
64. Ellisen LW, Ramsayer KD, Johannessen CM, Yang A, Beppu H, Minda K, Oliner JD, McKeon F and Haber DA. REDD1, a developmentally regulated transcriptional target of p63 and p53, links p63 to regulation of reactive oxygen species. Molecular cell. 2002; 10:995-1005.
65. Viticchie G, Agostini M, Lena AM, Mancini M, Zhou H, Zolla L, Dinsdale D, Saintigny G, Melino G and Candi E. p63 supports aerobic respiration through hexokinase II. Proceedings of the National Academy of Sciences of the United States of America. 2015; 112:11577-11582. 66. He Z, Agostini M, Liu H, Melino G and Simon HU. p73
regulates basal and starvation-induced liver metabolism in vivo. Oncotarget. 2015; 6:33178-90 doi: 10.18632/ oncotarget.5090.
67. Dickinson DA and Forman HJ. Cellular glutathione and thiols metabolism. Biochemical pharmacology. 2002; 64:1019-1026.
68. Lu SC. Glutathione synthesis. Biochimica et biophysica acta. 2013; 1830:3143-3153.
69. Finkelstein JD and Martin JJ. Methionine metabolism in mammals. Distribution of homocysteine between competing pathways. The Journal of biological chemistry. 1984; 259:9508-9513.
70. Galadari S, Rahman A, Pallichankandy S and Thayyullathil F. Tumor suppressive functions of ceramide: evidence and mechanisms. Apoptosis. 2015; 20:689-711.
71. Wu Y, Wang D, Wang X, Wang Y, Ren F, Chang D, Chang Z and Jia B. Caspase 3 is activated through caspase 8 instead of caspase 9 during H2O2-induced apoptosis in HeLa cells. Cellular physiology and biochemistry. 2011; 27:539-546.
72. Yabu T, Shiba H, Shibasaki Y, Nakanishi T, Imamura S, Touhata K and Yamashita M. Stress-induced ceramide generation and apoptosis via the phosphorylation and
activation of nSMase1 by JNK signaling. Cell death and differentiation. 2015; 22:258-273.
73. Dimski DS. Ammonia metabolism and the urea cycle: function and clinical implications. Journal of veterinary internal medicine. 1994; 8:73-78.
74. Ci Y, Shi K, An J, Yang Y, Hui K, Wu P, Shi L and Xu C. ROS inhibit autophagy by downregulating ULK1 mediated by the phosphorylation of p53 in selenite-treated NB4 cells. Cell death & disease. 2014; 5:e1542.
75. Evstafieva AG, Garaeva AA, Khutornenko AA, Klepikova AV, Logacheva MD, Penin AA, Novakovsky GE, Kovaleva IE and Chumakov PM. A sustained deficiency of mitochondrial respiratory complex III induces an apoptotic cell death through the p53-mediated inhibition of pro-survival activities of the activating transcription factor 4. Cell death & disease. 2014; 5:e1511.
76. Garufi A, Pucci D, D’Orazi V, Cirone M, Bossi G, Avantaggiati ML and D’Orazi G. Degradation of mutant p53H175 protein by Zn(II) through autophagy. Cell death & disease. 2014; 5:e1271.
77. Rufini A, Tucci P, Celardo I and Melino G. Senescence and aging: the critical roles of p53. Oncogene. 2013; 32:5129-5143.
78. Simon HU, Yousefi S, Schmid I and Friis R. ATG5 can regulate p53 expression and activation. Cell Death Dis. 2014; 5:e1339.
79. Avkin S, Sevilya Z, Toube L, Geacintov N, Chaney SG, Oren M and Livneh Z. p53 and p21 regulate error-prone DNA repair to yield a lower mutation load. Molecular cell. 2006; 22:407-413.
80. Dashzeveg N, Taira N, Lu ZG, Kimura J and Yoshida K. Palmdelphin, a novel target of p53 with Ser46 phosphorylation, controls cell death in response to DNA damage. Cell death & disease. 2014; 5:e1221.
81. Gao Y, Ferguson DO, Xie W, Manis JP, Sekiguchi J, Frank KM, Chaudhuri J, Horner J, DePinho RA and Alt FW. Interplay of p53 and DNA-repair protein XRCC4 in tumorigenesis, genomic stability and development. Nature. 2000; 404:897-900.
82. Li L, Ng DS, Mah WC, Almeida FF, Rahmat SA, Rao VK, Leow SC, Laudisi F, Peh MT, Goh AM, Lim JS, Wright GD, Mortellaro A, Taneja R, Ginhoux F, Lee CG, et al. A unique role for p53 in the regulation of M2 macrophage polarization. Cell death and differentiation. 2015; 22:1081-1093.
83. Seo YR, Fishel ML, Amundson S, Kelley MR and Smith ML. Implication of p53 in base excision DNA repair: in vivo evidence. Oncogene. 2002; 21:731-737.
84. Nair BC, Krishnan SR, Sareddy GR, Mann M, Xu B, Natarajan M, Hasty P, Brann D, Tekmal RR and Vadlamudi RK. Proline, glutamic acid and leucine-rich protein-1 is essential for optimal p53-mediated DNA damage response. Cell death and differentiation. 2014; 21:1409-1418.
85. Nicolai S, Rossi A, Di Daniele N, Melino G, Annicchiarico-Petruzzelli M and Raschella G. DNA repair and aging: the impact of the p53 family. Aging (Albany NY). 2015; 7:1050-1065. doi: 10.18632/aging.100858.
86. Phesse TJ, Myant KB, Cole AM, Ridgway RA, Pearson H, Muncan V, van den Brink GR, Vousden KH, Sears R, Vassilev LT, Clarke AR and Sansom OJ. Endogenous c-Myc is essential for p53-induced apoptosis in response to DNA damage in vivo. Cell death and differentiation. 2014; 21:956-966.
87. Saifudeen Z, Dipp S and El-Dahr SS. A role for p53 in terminal epithelial cell differentiation. The Journal of clinical investigation. 2002; 109:1021-1030.
88. Serrano MA, Li Z, Dangeti M, Musich PR, Patrick S, Roginskaya M, Cartwright B and Zou Y. DNA-PK, ATM and ATR collaboratively regulate p53-RPA interaction to facilitate homologous recombination DNA repair. Oncogene. 2013; 32:2452-2462.
89. Smith ML and Seo YR. p53 regulation of DNA excision repair pathways. Mutagenesis. 2002; 17:149-156.
90. Xu J, Wang J, Hu Y, Qian J, Xu B, Chen H, Zou W and Fang JY. Unequal prognostic potentials of p53 gain-of-function mutations in human cancers associate with drug-metabolizing activity. Cell death & disease. 2014; 5:e1108. 91. Eby KG, Rosenbluth JM, Mays DJ, Marshall CB, Barton
CE, Sinha S, Johnson KN, Tang L and Pietenpol JA. ISG20L1 is a p53 family target gene that modulates genotoxic stress-induced autophagy. Molecular cancer. 2010; 9:95.
92. Tasdemir E, Maiuri MC, Galluzzi L, Vitale I, Djavaheri-Mergny M, D’Amelio M, Criollo A, Morselli E, Zhu C, Harper F, Nannmark U, Samara C, Pinton P, Vicencio JM, Carnuccio R, Moll UM, et al. Regulation of autophagy by cytoplasmic p53. Nature cell biology. 2008; 10:676-687. 93. Sui X, Jin L, Huang X, Geng S, He C and Hu X. p53
signaling and autophagy in cancer: a revolutionary strategy could be developed for cancer treatment. Autophagy. 2011; 7:565-571.
94. Liu J, Zhang C, Wang XL, Ly P, Belyi V, Xu-Monette ZY, Young KH, Hu W and Feng Z. E3 ubiquitin ligase TRIM32 negatively regulates tumor suppressor p53 to promote tumorigenesis. Cell death and differentiation. 2014; 21:1792-1804.
95. Zhang HH, Li SZ, Zhang ZY, Hu XM, Hou PN, Gao L, Du RL and Zhang XD. Nemo-like kinase is critical for p53 stabilization and function in response to DNA damage. Cell death and differentiation. 2014; 21:1656-1663.
96. Sane S, Abdullah A, Boudreau DA, Autenried RK, Gupta BK, Wang X, Wang H, Schlenker EH, Zhang D, Telleria C, Huang L, Chauhan SC and Rezvani K. Ubiquitin-like (UBX)-domain-containing protein, UBXN2A, promotes cell death by interfering with the p53-Mortalin interactions in colon cancer cells. Cell death & disease. 2014; 5:e1118.
97. Xu C, Fan CD and Wang X. Regulation of Mdm2 protein stability and the p53 response by NEDD4-1 E3 ligase. Oncogene. 2015; 34:281-289.
98. Fu X, Yucer N, Liu S, Li M, Yi P, Mu JJ, Yang T, Chu J, Jung SY, O’Malley BW, Gu W, Qin J and Wang Y. RFWD3-Mdm2 ubiquitin ligase complex positively regulates p53 stability in response to DNA damage. Proceedings of the National Academy of Sciences of the United States of America. 2010; 107:4579-4584.
99. Mu W, Hu C, Zhang H, Qu Z, Cen J, Qiu Z, Li C, Ren H, Li Y, He X, Shi X and Hui L. miR-27b synergizes with anticancer drugs via p53 activation and CYP1B1 suppression. Cell research. 2015; 25:477-495.
100. Leotta M, Biamonte L, Raimondi L, Ronchetti D, Di Martino MT, Botta C, Leone E, Pitari MR, Neri A, Giordano A, Tagliaferri P, Tassone P and Amodio N. A p53-dependent tumor suppressor network is induced by selective miR-125a-5p inhibition in multiple myeloma cells. Journal of cellular physiology. 2014; 229:2106-2116. 101. Wang F, Lv P, Liu X, Zhu M and Qiu X. microRNA-214
enhances the invasion ability of breast cancer cells by targeting p53. International journal of molecular medicine. 2015; 35:1395-1402.
102. Fortunato O, Boeri M, Moro M, Verri C, Mensah M, Conte D, Caleca L, Roz L, Pastorino U and Sozzi G. Mir-660 is downregulated in lung cancer patients and its replacement inhibits lung tumorigenesis by targeting MDM2-p53 interaction. Cell death & disease. 2014; 5:e1564.
103. Fiori ME, Barbini C, Haas TL, Marroncelli N, Patrizii M, Biffoni M and De Maria R. Antitumor effect of miR-197 targeting in p53 wild-type lung cancer. Cell death and differentiation. 2014; 21:774-782.
104. Hoffman Y, Bublik DR, Pilpel Y and Oren M. miR-661 downregulates both Mdm2 and Mdm4 to activate p53. Cell death and differentiation. 2014; 21:302-309.
105. Shin S, Lee EM, Cha HJ, Bae S, Jung JH, Lee SM, Yoon Y, Lee H, Kim S, Kim H, Lee SJ, Park IC, Jin YW and An S. MicroRNAs that respond to histone deacetylase inhibitor SAHA and p53 in HCT116 human colon carcinoma cells. International journal of oncology. 2009; 35:1343-1352. 106. Zhang C, Liu J, Wang X, Wu R, Lin M, Laddha SV, Yang
Q, Chan CS and Feng Z. MicroRNA-339-5p inhibits colorectal tumorigenesis through regulation of the MDM2/ p53 signaling. Oncotarget. 2014; 5:9106-9117. doi: 10.18632/oncotarget.2379.
107. Ren ZJ, Nong XY, Lv YR, Sun HH, An PP, Wang F, Li X, Liu M and Tang H. Mir-509-5p joins the Mdm2/p53 feedback loop and regulates cancer cell growth. Cell death & disease. 2014; 5:e1387.
108. Silden E, Hjelle SM, Wergeland L, Sulen A, Andresen V, Bourdon JC, Micklem DR, McCormack E and Gjertsen BT. Expression of TP53 isoforms p53beta or p53gamma enhances chemosensitivity in TP53(null) cell lines. PloS one. 2013; 8:e56276.