Università degli Studi di Ferrara
DOTTORATO DI RICERCA IN
Scienze della Terra
CICLO XXVII
COORDINATORE: Prof. Massimo Coltorti
Geomorphological Evolution and Vulnerability of Low-
Lying Coasts in Bangladesh:
The Case Study of Sandwip Island
Settore Scientifico Disciplinare GEO/04
Dottorando Tutore
Mohammad Muslem Uddin Prof. Ciavola Paolo, PhD
Anni 2012/2014 March‘2015
iii
DEDICATION
For my beloved Mother (Mohsena Khaatun), without whose love, blessings and care, I would not be where I am today.
For my beloved Father (Late Md Obaidul Hoque), who taught me ―always keep busy working with something, even whe there‘s nothing to do‖.
For my beloved elder Brothers (Mr Shahid Ullah & Mohammad Mowla), who have always taught me how to love and take care of youngers, without whose love and support, my education would have never been possible.
For my two most respected late Professors (Dr. Nuruddin Mahmud & Dr. Mohammad Zafar) and
ex Professor (Dr. Nani Gopal Das) of the Institute of Marine Sciences and Fisheries, University of
Chittagong, who have always taught me to never give up with my research and further education.
Finally, to my respected mentor, Professor Dr. Paolo Ciavola, without his help and continuous guidance, this would have never been possible.
iv
ORIGINALITY STATEMENT
‗I hearby declare that this submission is my own work and to the best of my knowledge, it contains no materials previously published or written by another person for the award of any other degree at UNIFE or anyother educational institute, except where due acknowledgement is made in this thesis. Any contribution made to the research by others, with whome I have worked at UNIFE or elsewhere, is explicitly acknowledged in the thesis. I also declare that the intellectual content of this work is the compilation of my own works, except to the extent that cooperate from others in the project design or in style, field works, presentation and linguistic expression is duly acknowledged.‘
v
PREFACE
Most coastal areas are highly fragile, as they are constantly subjected to high physical energy imparted by varying degrees of wave, tide and current activities. Coastal areas like those in Bangladesh have been in more concern for their alarming huge and quick geomorphodynamic changes due to some more hydrometeorological effects like floods, cyclones and erosions etc. Increasing climate change induced vulnerability like Sea Level Rise (SLR) has been making the situation worse day by day. In order to properly interpret the hazardous mechanisms to set up a time demanding management and precautionary system towards reducing the vurnability to disasters, there is a need for a thorough understanding of the geomorphological evolution, hydro-meteorological setting, socio-economical and ecological status of the target area. Community perception and indigenous coping strategies are a well accepted approach worldwide for adaptation to climate induced disasters.
This particular study involves a comprehensive approach to understanding the situations making the erosion and storm surge prone Sandwip Island one of the most risky places to live.
The first chapter introduces the work structure, study background, objectives and motivation of the work while chapter two briefs on the study area geography, geo-morphology, socio-cultural and socio-ecological characteristics. A brief historical flash back and hydrodynamics around the island form part of this chapter.The materials and methods used in the research works are briefly described in chapter three.
In the chapters four and five, the results are summarized and the outcomes are discussed which ultimately aim at the objective of the project. Chapter four is composed of the results and discussion on the geomorphological, land use pattern changes and tidal variation status while the risk assessment by public perception and the copying strategies practices in the community are enclosed in chapter five. Finally, the conclusive remarks are outlined in the sixth chapter with useful recommendations for further use of the results.
The last chapter deals with the references of the extensive literature review on the studies, reports and documents which were found to be helpful to develop the project, to enrich the understanding of the works, to verify the results, to get useful information and also to follow the methods used during the mission.
vi
In connection with the thesis, the following research papers have been published in the respective conference proceedings after presentation in international meetings:
Uddin, M.M. & Ciavola, P. 2012. Geomorphological Evaluation and Coastal Changes of
Sandwip Island, Eastern GBM Delta, Bangladesh. Conference Proceedings: ITALY-CINA: AN ANCIENT CULTURAL HERITAGE AND THE CHALLENGE FOR FUTURE DEVELOPMENT, Bologna, Italy, 22 - 23 October 2012 (ISBN 978-88-6155-515-0), p181-188.
Uddin, M.M. & Ciavola, P. 2013. Sediment characteristics and Coastline Change of a
Low-lying Island (Sandwip) in the Eastern GBM Delta, Bangladesh. Proceedings of ANDROID Residential Doctoral School Work Package III, Limassol, Cyprus, 23-24 October 2013 (ISBN 978-1-907842-52-8), p56-65.
Ciavola, P., Uddin, M.M., Duo, E., Lee, B. and Fakhruddin, S.H.M., 2015 (Accepted). Vulnerability of Bangladesh Coastline to Inundation under Cyclone Activity: Past Records and DRR Strategies at Sandwip Island. E-proceedings of the 36th IAHR World Congress, 28 June – 3 July, 2015, The Hague, the Netherlands.
vii
ABSTRACT
(ENGLISH)Bangladesh is ranked as the ―5th most at-risk country‖ in the world in terms of disasters with a world risk index of 20.22% in the World Risk Report 2012. Coast and island flooding induced by extreme storms and cyclones born in the Northern Indian Ocean passing through the funnel shaped shallow northern Bay of Bengal are the most dangerous natural hazards in the area. Additionally, remarkable geomorphological change of the lower GBM active delta and relative Sea Level Rise (SLR) have drawn special attention to the environmental scientists and respective managers for the alarming more intense and more frequent upcoming climate change vulnerabilities. The Lower Meghna River Estuary (LMRE) is an extremely dynamic estuarine system with dramatic geomorphological changes of the offshore islands. The erosion and accretion rates are remarkably high and the islands are reducing their original size. As populations flock to the coast and offshore islands at threat from erosions, storm inundation and sea level rise, intensive studies must be carried out on the vulnerability of these coastal regions.
Sandwip Island, located at the confluence of the Lower Meghna River Estuary, shaped and characterized by both tidal actions of the Bay of Bengal and river streams of the Meghna, was chosen as the only international case study site outside Europe in the framework of the Risc-KIT FP7 European project (http://www.risckit.eu/). The project aims to develop tools and methods to reduce risk and increase resilience of coastal areas. The toolkit will be implemented for each case study.
The present works aims to describe the state of the art of knowledge on the island covering geomorphology, sediment characteristics, hydrodynamics and socioeconomics. Community perceptions and indigenous coping strategies aspects of the island are included in a coastal vulnerability perspective to be useful in further research, development of effective preparedness, management and actions plan. To reach this goal, an attempt was taken to find out the answers to the following questions: 1) What is the status of geomorphological changes? 2) What are the sediment characteristics of the erosion-accretion prone shorelines? 3) What is the status of the sea level rise relative to the island 4) What is the total vulnerability/hazard ranking by local perceptions? 5) How much has the land use changed due to erosion and associated hazards ? and finally 6) What strategic changes should be taken?
The research questions were answered using topographic surveys, lab based sediment analysis, tide gauge data analysis, erosion-accretion mapping and development of high resolution DEM and TIN
viii
using Remote Sensing and GIS-based tools and techniques and questionnaire survey results interpreted with national disaster management plans.
The study found that the island is more physically prone to coastal erosion, coupling with storm surges and sea level rise making it more vulnerable in future. The erosion rate considering both shoreline and area changes is much more intense exceeding accretion in the silty clay sedimentary parts and the sea level rise trend is alarming in comparison with other nearby coastal areas in Bangladesh. Tidal data analysis for Sandwip shows semi-diurnal components higher in amplitude than Chittagong. Diurnal amplitudes are comparable and phases are generally higher for Sandwip with a 47 minute delay than Chittagong. The DEM demands more intensive bathymetric information that should be used for more accurate hydrometeorological models for the low elevated island, where as the island is almost flat with the average topography is only 5 meter above MSL and the north-western part is slightly higher than the south-western part as observed in the TIN justified by Topographic survey. The physical assets have been declining stressing on the socioeconomy of the community as found by the social survey as well as land use satellite mapping.
So, a relatively high earthen embankment encircling the island, a crossdam connecting north side of the island to mainland are immediately needed to protect the community from erosion as well as relative sea level rise and storm surge inundation hazards. A site specific hydrometeorological warning should be developed and announcement dissemination should be maintained in the local language. Development of roads and transportation system and the health training should be enhanced to make people more aware and adaptive with the associate disasters.
ix
ABSTRACT
(ITALIANO)Il Bangladesh, classificato come quinto paese a rischio di disastri naturali, presenta un indice di rischio pari a 20.22% (World Risk Report 2012). I disastri più pericolosi dell‘area risultano essere le inondazioni costiere causate da temporali e cicloni che si formano nell‘Oceano Indiano e si dirigono verso la parte nord del Golfo del Bengala caratterizzata da acque poco profonde. Inoltre, scienziati e manager ambientali si stanno concentrando sull‘area a causa dell‘incremento della vulnerabilità dovuto al cambiamento climatico ed alla morfo-dinamica del basso delta GBM. L‘estuario del basso fiume Meghna è un sistema estremamente dinamico con cambiamenti geomorfologici drammatici delle isole al largo. I tassi di erosione e deposito sono notevolmente alti e le isole si riducono in area. Poiché le popolazioni locali si riversano sulle coste e sulle isole minacciate dall‘erosione, dalle inondazioni e dall‘innalzamento del mare, sono necessari studi intensivi per la stima della vulnerabilità di queste zone.
Sandwip, isola situata alla confluenza del Meghna, modellata dall‘azione della marea del Golfo del Bengala e dalle portate del fiume, è stata scelta come unico caso studio internazionale del progetto europeo FP7 Risc-KIT. L‘ obiettivo del progetto è sviluppare ed applicare ai casi studio una serie di metodi e strumenti per ridurre il rischio ed aumentare la capacità di ripresa delle zone costiere. Questa Tesi di Dottorato ha come obiettivo di descrivere lo stato dell‘arte delle conoscenze dell‘isola in termini geomorfologici, sedimentari, idrodinamici e socio-economici. Nello studio sono incluse analisi della percezione del rischio da parte delle comunità e delle loro strategie di adattamento, in un‘ottica di analisi di vulnerabilità per sviluppi futuri di ricerca, creazione di piani di management del rischio e di azione. Per raggiungere l‘obiettivo, le domande di riferimento cui il Progetto di Dottorato ha cercato di rispondere sono: 1) qual è lo stato dei cambiamenti geomorfologici? 2) qual è lo stato sedimentologico della costa? 3) qual è lo stato dell‘innalzamento del livello del mare? 4) qual è la percezione locale della vulnerabilità e del rischio? 5) quali cambiamenti dell‘uso del suolo sono intervenuti a causa del rischio erosivo ed altri rischi associati? Ed infine, 6) quali cambiamenti strategici devono essere adottati?
Per rispondere a tali domande, sono state applicate svariate metodologie come rilievi topografici, analisi sedimentologiche di laboratorio, analisi dei dati ricavati da un mareografo, mappatura dell‘erosione e del deposito, sviluppo di un DEM ed un TIN ad alta risoluzione tramite tecniche di telerilevamento e strumenti GIS, questionari per i residenti interpretati alla luce dei piani nazionali di gestione del rischio.
x
Lo studio ha dimostrato che l‘isola è incline all‘erosione che, in aggiunta all‘innalzamento del mare dovuto ai cambiamenti climatici ed agli eventi atmosferici, aumenta notevolmente la vulnerabilità dell‘isola. Il tasso erosivo, considerando le variazioni della linea di costa e dell‘area dell‘isola, è più intenso del tasso di deposito nella aree nord-ovest ed il trend dell‘innalzamento del mare è allarmante a confronto con altre zone costiere in Bangladesh. L‘analisi della marea di Sandwip ha evidenziato componenti semidiurne dominanti più ampie rispetto a Chittagong, mentre le componenti diurne risultano comparabili. Le fasi sono generalmente più alte dando luogo ad un generale ritardo dei valori estremi di 47 minuti rispetto a Chittagong. Il DEM, che evidenzia un‘isola praticamente piatta con topografia media attorno a 5 m s.l.m., necessita di informazioni batimetriche più dettagliate per poter essere utilizzato come input di modelli idrometeorologici. Il TIN corretto con i rilievi topografici, d‘altra parte, evidenzia che la zona nord-ovest è leggermente più alta della zona sud-ovest. L‘asseto fisico dell‘isola è peggiorato incidendo sugli aspetti socio-economici delle comunità, come evidenziato dai questionari e dalle immagini satellitari.
Di conseguenza, sono necessari un argine che circondi l‘isola ed uno che connetta la parte nord dell‘isola con la terraferma, per proteggere le comunità dell‘isola dall‘erosione, dall‘innalzamento del mare e dal rischio di inondazione. Si deve sviluppare un sistema di allarme idrometeorologico locale migliorando anche i sistemi di disseminazione in lingua locale. Le infrastrutture, in particolare strade e trasporti, e la formazione sanitaria devono essere migliorate affinché la popolazione sia più consapevole e capace di adattarsi ai disastri naturali.
xi
ACKNOWLEDGMENTS
There are a number of people I must thank because without them I could never have produced this thesis. Foremost, I would like to thank our PhD coordinator Prof. Massimo Coltorti and Professor Dr. Costanza Bonadiman, for all of their comments, guidence and constructive criticism. Especially, I would like to express my deepest thanks to my supervisor, Prof. Dr. Paolo Ciavola for supporting me to enter the program. His patience, encourgement and immense knowledge were key motivations throughout my PhD. Thank you for your guidance and for pushing me to challenge myself. I am proud that you allowed me to be part of your ―Research Plan‖. I would like to thank Professor Art Trembanis of the University of Delaware, US for offering thorough and excellent feedback on an earlier version of the thesis. I am thankful to Prof. G. Cruciani, and Dr M. Verde for their kind help in mineralogical analysis and Dr. U. Tessari in grain size analysis of sediment samples.
I am really grateful to the RISCKIT (Resilience-Increasing Strategies for Coasts), EU-FP7 (GA 603458) project leaders for all of their support, more specifically for selecting Sandwip island as the only international case study site outside Europe.
I must thank the sweet lady, Shahin Sultana (My lovely life partner), hearing ―How are doing?‖ every time we talked was a great motivation. I am everlasting grateful to her for her endless tolerance in maintaining every thing of my family and kids without me along with her job. Kids (Jahin, Jarif and Jabir), my hearts, you were so sweet to listen to me, even if you did not understand what I was saying all the time and for your great scarifies of long time, I have been a away from you.
I am gratefully would like to show my honor to my beloved mother and two of my elder brothers (Mohammad Shahid Ullah and Mohammad Mowla) whose effections, loves and supports have always been with me for inspiration.
A number of colleagues and friends have provided me with much needed support and escape from stress including Dr Mohammad Shahadat Hossain, Director and Professor; Dr Hossain Zamal, Mr Sayedur Rahman Chowdhury, Dr Rashed Un Nabi, Dr Asharaful Azama Khan, Professor and Mohammad Zahedur Rahman Chowdhury, Associate Professor of the Institute of Marine Sciences and Fisheries, University of Chittagong.
xii
Thank you Mr Anowar Hossen, Mr Alauddin, Mr Shahin Parvez, Sofu Alam and Mr Mahmud you became my family member and have done a lot for me during this mission in home and abroad.
My sincere appreciations to all people out there, specially Mr Musa, Mr Babu, Mr Sumon, Mr Roton, Sohel member, Mr Ali.... in study site, Sandwip Island, Bangladesh who helped me with my field works including sampling and data collections.
Professor Abdir Rahim and Mr Jafar Iqbal, two popular teachers and social workes deserve special thanks for a great cooperation during the whole field work time.
To the other, lab mates ―Clara, Edo, Duccio and Mitch…,‖ thank you for all your help, but more importantly, for making me relaxe and have fun when I needed it and helping me in my works.
Enrico, I can never express how much your support, both in field-lab supports and personally, means to me. Finally, thank you. Thank you for standing by my side, through thick and thin.I am convinced that without you, I could never have finished.
I would like to extend my thanks and appreciation to Mr Ahmed Tahmid Dipro, a postgrade student of IMSFCU, Bnagladesh, for his genereous help to me in doing some GIS maps for this study.
At last but not the least, my sincere respect and rememberence goes to my heavenly father and two giant late professors of Institute of Marine Sciencess and Fisherties, University of Chittagong, Bangladesh: Dr Nuruddin Mahmood and Dr Mohammad Zafar who were the real inspiration for my dream to higher education.
1
TABLE OF CONTENTS
List of Figures ... 4 List of Tables ... 13 List of Anexes: ... 15 1. INTRODUCTION ... 17 1.1 Background: ... 171.2 Rationale of the Study ... 26
1.3 Objectives ... 27
2. THE STUDY AREA ... 29
2.1 The GBM Delta ... 29
2.2 The Meghna Estuarine System ... 31
2.2.1 Hydrodynamics and geomorphology ... 32
2.3 Sandwip Island ... 34
2.3.1 A brief flash back on its history ... 34
2.3.2 Geographical setting ... 38
2.3.3 Hydrodynamics and geomorphological characteristics ... 39
2.3.4 Demography, literacy and occupations ... 42
2.3.5 Land use ... 43
3. MATERIALS AND METHODS ... 47
3.1. Field Work ... 47
3.1.1 Tide gauge installation and data acquisition ... 47
3.1.2 Datum correction for the tide gauge ... 51
3.1.3 Topographic survey ... 51
3.1.4 Sediment sampling ... 54
3.1.5 Questionnaire survey on local perception of coastal hazards ... 54
2
3.2.1 Tide gauge data analysis ... 57
3.2.2 Historical tidal data analysis collected from BIWTA and CPA ... 58
3.2.3 Sediment characteristics... 60
3.2.4 Questionnaire survey data ... 64
3.3 Remote Sensing and GIS Analysis... 64
3.3.1 Shoreline change ... 64
3.3.2 Erosion-Accretion area map ... 68
3.3.3 Land use and land cover change ... 70
3.3.4 DEM (Digital Elevation Model) ... 72
3.3.5 TIN (Triangulated Irregular Network) ... 74
3.3.6: Contouring for inundation assessment... 79
4. RESULTS AND DISCUSSION: TIDAL REGIME, GEOMORPHOLOGY AND LAND COVER ... 81
4.1 Tidal Data ... 81
4.1.1 Observed tidal data and comparison with Chittagong station ... 81
4.1.2 Historical tidal data analysis ... 81
4.2 Cross Sections Profiling ... 86
4.3 Sediment Characteristics ... 89
4.4. Erosion Accretion Assessment ... 93
4.4.1. Coastlines change and change rate calculation: ... 93
4.4.1. Net area change calculation for erosion and accretion: ... 102
4.5 Land Use and Land Cover Change ... 107
4.6 DEM (Digital Elevation Model) ... 109
4.7 TIN (Triangulated Irregular Network) ... 112
4.7 Conntouring for Inundation Assessment ... 113
5. RESULTS AND DISCUSSION: COMMUNITY RISK ASSESSMENT & COPYING STRATEGIES ... 115
3
5.1: Questionnaire Survey ... 115
5.1.1 Community Socio-economical Status... 115
5.1.2 Livelihood assets assessment ... 119
5.1.3 Vulnerability profile ... 121
5.1.4 Impact of climate change vulnerability ... 126
5.1.5 Coping strategies ... 129
6. CONCLUSION AND RECOMMENDATIONS ... 139
7. REFERENCES ... 143
7.1 Literatures ... 143
7.2 Websites ... 152
5
List of Figures
Figure 1. 1: Map of Bangladesh showing tracks of cyclones occurring from 1909 to 1991(Source
Rana et al, 2011). ... 20
Figure 1. 2: Low elevation areas in coastal Bangladesh at risk of inundation fom climate change induced sea level rise ... 21
Figure 1. 3: The Hjulström curve (source: http://en.wikipedia.org/wiki/Hjulstrom) ... 22
Figure 2. 1: The Bengal Delta (Source: Barua, 1997) ... 29
Figure 2. 2: Bangladesh coastline and the active Meghna Estuarine Delta (Source: Barua, 1997) . 30 Figure 2. 3: Map of the combined drainage basins of the Ganges (orange), Brahmaputra (violet), and Meghna (green). Source: http://en.wikipedia.org/wiki/Ganges#mediaviewer/File:Ganges-Brahmaputra-Meghna_basins.jpg ... 31
Figure 2. 4: The Active Meghna Estuarine Delta System. Source: http://www.warpo.gov.bd/rep/knowledge_port/KPED/Overview.htm ... 32
Figure 2. 5: Image of the Meghna estuary with bank line changes from 1973 to 2000 (MES, 2001) ... 33
Figure 2. 6: Map of‗Sundiva‘ in Johann and Cornelius Blaeu, 1638 AD, ‗Magni Mogolis Imperium‘ (in Mukherjee, 2008) ... 37
Figure 2. 7: Map of ‗Sundiva‘ in Jacques Nicholas Bellin, 1747 AD, ‗Nouvelle Carte du Royaume de Bengale‘ (in Mukherjee, 2008.) ... 37
Figure 2. 8: Map of Surveyor J. Rennell - screenshot from the book History of Sandwip by Shri Rajmohon Chakrabarti and Shri Ongomoho Das (published 1924) ... 38
Figure 2. 9:: Study area location Map... 39
Figure 2. 10: Development of Sandwip Island in between 1913-1916 and 1988 (Barua, 1997) ... 41
6
Figure 2. 12: Main economic drivers in the Island ... 43
Figure 2. 13: Main land use and land cover picture in Sandwip Island ... 45
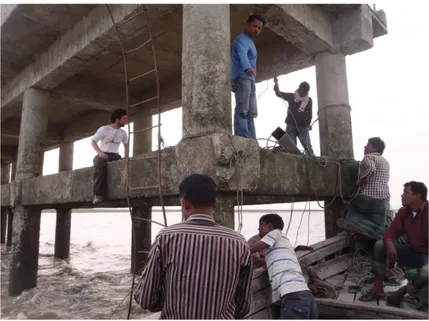
Figure 3. 1: Photo of 1st attempt to install the tide gauge on the eastern coast jetty ... 48
Figure 3. 2: Final installation point of tide gauge in western offshore of the Island ... 49
Figure 3. 3: Photo of installation of tide gauge in western offshore, 6th March 2014 ... 49
Figure 3. 4: Tidal data downloading ... 50
Figure 3. 5: Datum reference and water level measurements scheme. ... 50
Figure 3. 6: Survey works in the field ... 52
Figure 3. 7: Photo showing BM position and temporary benchmarks, Google Earth 2014 ... 53
Figure 3. 8: Photo of TBM established structure location in Sandwip by total station ... 53
Figure 3. 9: Sediment sampling scheme and picture of sampling and crosssections ... 54
Figure 3. 10: Consultation meeting and interview to the RISCKIT respondents ... 55
Figure 3. 11: Selected 3 unions (*) in the island for questionnaire survey and focus group discussion ... 56
Figure 3. 12: Questionnaire interview, participatory observation and focus group discussion ... 56
Figure 3. 13: Work plan by questionnaire survey... 57
Figure 3. 14: Position map of Chittagong Tide Gauge station to Sandwip ... 58
Figure 3. 15: Tidal stations in coastal zone of Bangladesh ( ) ... 59
Figure 3. 16: Map of Tidal Stations in Karnafully River, Chittagong ... 60
Figure 3. 17: Lab works in IMSF Lab, Chittagong University, Bangladesh ... 61
7
Figure 3. 19: Work flow for sediment grain size analysis ... 62
Figure 3. 20 :Lab works in sedimentological laboratory, University of Ferrara, Italy ... 63
Figure 3. 21: Mineral determination using XRD method in Unife Mineralogy lab, Italy ... 63
Figure 3. 22: Sustainable Livelihood Framework for vulnerability analysis ... 64
Figure 3. 23: Onscreen short Shoreline degitization using ILWIS (Academic virsion) ... 65
Figure 3. 24: Transescts (100 meter apart) generated by DSAS extensions. ... 67
Figure 3. 25: 4 sectional zones divided of the transsects ... 68
Figure 3. 26 :Work flow chart for erosion accretion mapping ... 70
Figure 3. 27: Workflow of land cover change mapping ... 71
Figure 3. 28: Topographic data view collected from Earth Explorer ... 73
Figure 3. 29: Flow chart DEM creation process ... 74
Figure 3. 30: Opening the data in arc Map ... 76
Figure 3. 31: Cutting the desired area using a shapefile ... 76
Figure 3. 32: Desired area in arcMap ... 77
Figure 3. 33: Elevation classification using symbology property ... 77
Figure 3. 34: Elevation by color scale... 78
Figure 3. 35: Use of 3D Analyst tool ... 78
Figure 3. 36: Elevation by color scale... 79
Figure 3. 37: Flow chart showing contour line and inundation polygon creating for 3 and 6 meter storm surges ... 800
8
Figure 4. 2: A plot of average yearly maximum high water level of different tidal stations in
Bangladesh Coast ... 83
Figure 4. 3:: Plot of early highest tidal water Curve in 4 different stations of Karnaphuli River .... 84
Figure 4. 4: Correlation regression of yearly highest water levels in different stations of Karnafully River ... 85
Figure 4. 5: Plot of five year running mean of highest water level in different tidal stations in Karnafully river... 85
Figure 4. 6: Comparison of elevation in 5 different profiles in March 2013 ... 86
Figure 4. 7: Shore profile variation in two different scenarios ... 87
Figure 4. 8: Comparison of elevation in 5 different profiles in March 2013 ... 88
Figure 4. 9: Cross section profiles comparison between 2013 and 2014 ... 88
Figure 4. 10: Comparison of all profiles in two consecutive years with tidal height and 1991 storm surge ... 89
Figure 4. 11: Organic matter and Moisture content in sediments of 5 Profiles... 91
Figure 4. 12: Correlation curve in between moisture content and find sediment for all sections .... 91
Figure 4. 13: Sedigraph for 3 samples in each of the cross section‘s sediments ... 92
Figure 4. 14: Mean grain size (phi) 3 points (cliff, base and water mark) for all profiles ... 92
Figure 4. 15: X-ray diffractogram of sediment samples from cross-section profiles in Sandwip ... 93
Figure 4. 16: a), Shoreline overlay of 1978 and 2001, b) Shoreline overlay of 1978 and 2006 ... 94
Figure 4. 17: Shorelines positions (1978, 1989, 2001 & 2006), Baseline, Transects and SCE for whole Islands ... 95
Figure 4. 18: Graph of a. End Point Chnage Rate (EPR) and b. Net Shoreline Movement (NSM) for all transects ... 95
9
Figure 4. 19: Shorelines positions (1978, 1989, 2001 & 2006), Baseline, Transects and SCE for
North Zone... 97
Figure 4. 20: Transect wise graph of a. End Point Chnage Rate (EPR) and b. Net Shoreline
Movement (NSM) for North Zone ... 98
Figure 4. 21: Shorelines positions (1978, 1989, 2001 & 2006), Baseline, Transects and SCE for
East Zone ... 99
Figure 4. 22: Transect wise graph of a. End Point Chnage Rate (EPR) and b. Net Shoreline
Movement (NSM) for East Zone ... 99
Figure 4. 23: Shorelines positions (1978, 1989, 2001 & 2006), Baseline, Transects and SCE for
South Zone... 100
Figure 4. 24: Transect wise graph of a. End Point Chnage Rate (EPR) and b. Net Shoreline
Movement (NSM) for South Zone ... 100
Figure 4. 25: Shorelines positions (1978, 1989, 2001 & 2006), Baseline, Transects and SCE for
West Zone ... 101
Figure 4. 26: Transect wise graph of a. End Point Chnage Rate (EPR) and b. Net Shoreline
Movement (NSM) for West Zone ... 101
Figure 4. 27: Area change curve of Sandwip Island due to erosion-accretion ... 104 Figure 4. 28: Overlapping of multiyear digitized coastline of Sandwip Island... 104 Figure 4. 29: Area of erosion and accretion in Sandwip Island in between 1978-1989 and
1989-2001 ... 105
Figure 4. 30: Area of erosion and accretion in Sandwip Island in between 2001-2006 and
2006-2014 ... 105
Figure 4. 31: Area of erosion and accretion in Sandwip Island in between 1978-2006 and 178-2014
... 106
10
Figure 4. 33: Changes of land covers in terms of area. ... 109 Figure 4. 34: Bathymetric Map of Sandwip Island using BIWTA soundings data ... 110 Figure 4. 35: Bathymetric soundings used for the DEM shows some data gap ... 111 Figure 4. 36: DEM merging Bathymetry, Topography and Shoreline ... 112 Figure 4. 37: Triangulated Irregular Network (TIN) Model of Sandwip Island ... 113 Figure 4. 38: Contour line highlitned (a) 3 meter and (b) 6 meter Topo map of the island ... 114 Figure 4. 39: Susceptible inundation for (a) 3 meter and (b) 6 meter storm surges ... 1144 Figure 5. 1: Daily in general activity of men in Sandwip Island ... 117 Figure 5. 2: Daily in general activity of women in Sandwip Island ... 117 Figure 5. 3: Capital Assets Pentagon of the Island ... 119 Figure 5. 4: Multiple capital assets (Human, financial, social, natural and physical) pentagon .... 121 Figure 5. 5: Pictures of shopping (Bazar), Household structures, and sluice gate erosions in the
Island ... 124
Figure 5. 6: Have become part of history (govt College Building, the Court building and the
cyclone shelter ... 124
Figure 5. 7: Photos of Life and properties destruction by Storm in Sandwip Island ... 126 Figure 5. 8: Photos of Water logging disrupt the communication and Salt water intrusion destroy
the crops in Sandwip Island ... 126
Figure 5. 9: Impacts of the top ranked vulnerabilities on livelihood ... 127 Figure 5. 10: Navigation and Transportation problem (No permanent jetty) ... 128 Figure 5. 11: Picture showing Bamboo revetment (left) and Heightening of dike (right) ... 130 Figure 5. 12: Picture showing Re-built house (left) and Shifting house materials (right) ... 131
11
Figure 5. 13: Picture showing Existing Trees (left) and Trees Uprooted (right)... 131 Figure 5. 14: Number of Households Applying Each Adaptation Option ... 132 Figure 5. 15: Assessing effective coping strategies ... 132 Figure 5. 16: Coping strategies of different problems of tidal inundation ... 134 Figure 5. 17: Different Coping Strategies of cyclone ... 136 Figure 5. 18: Pictures of some management action so far taken in the Island ... 138
13
List of Tables
Table 1. 1: List of major cyclones with land fall area, wind speed, surge height and associated death
casualties since 1960 (modified from Ali, 2000; IWM 2005). ... 199
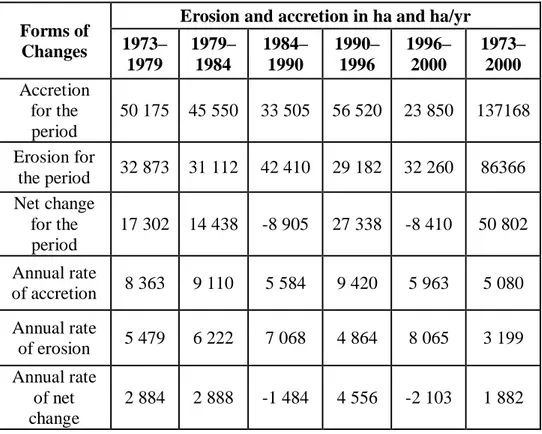
Table 2. 1: Summary of erosion and accretion scenerios in the Meghna Estuary of 1973–2000.
(Source: MES, 2001) ... 34
Table 2. 2: Land area of Hatiya and Sandwip Island measured from 1779 to 1979 (km2), (Source: Pramanik, 1983) ... 41
Table 2. 3: Agricultural land use statistics in the island (Source: Upazila Agriculture Office) ... 444 Table 3. 1: Data downloading summary. ... 51 Table 3. 2: Position, ID of the TBM and BM with description of the platform established on ... 54 Table 3. 3:. Professional and social positions of the interviewed people ... 55 Table 3. 4: Basic information of the Satellite images used for shoreline change mapping ... 65 Table 3. 5: Basic information of the Satellite images used for shoreline change mapping ... 67 Table 3. 6: Basic information of the Satellite images used for erosion accretion maping ... 69 Table 3. 7: Basic information of the Satellite images used for land cover changes maping ... 71 Table 3. 8: Specifications of Sandwip Island DEM ... 72 Table 3. 9: Specifications of Chittagong-Noakhali coast DEM ... 755 Table 4. 1: Yearly average high water spring tidesl records in the south eastern coast of Bangladesh
(Note: BIWTA Tide Table Record) ... 82
Table 4. 2:. Yearly highest water level in meter (ISLWL) Note (Note: Chittagong Port Authority
Tide Book Record) ... 83
Table 4. 3: Sediment analysis data collected from different elevation of the section profiles ... 90 Table 4. 4: Summary of DSAS statistical calculation for EPR ... 96
14
Table 4. 5: Summary of DSAS statistical calculation for SCE ... 96 Table 4. 6: Summary of DSAS statistical calculation for NSM ... 96 Table 4. 7:. Area of Island in different years between 1978 and 2014 as measured by polygons of
shorlines ... 103
Table 4. 8: Erosion and Accretion data in between 1978 to 2014 ... 1033 Table 5. 1: General information of the respondents at Sandwip Island ... 115 Table 5. 2: Professional, Educational and Economical profile of the respondents at Island ... 116 Table 5. 3: Seasonal Calendar of the respondents in the Sandwip Island ... 118 Table 5. 4: Response on coastal Vulnerability Profile by People selected by RISCKIT guidelines
... 122
Table 5. 5: Randomly selected People‘s response on coastal Vulnerability Profile of the Island.. 123 Table 5. 6: Eroded resources of an Union (Rahmatpur) in the last 20 years (union chairman office)
... 125
Table 5. 7: Last 10 years destruction of communication structure (Source: Sandwip upazila, 2010)
15
List of Annexes:
Annex1A: Cross section profiles in February 2014...155 Annex1B: Cross section profiles in March 2013...157 Annex 2: Sedigraph for sediment samples cliff top (a) and cliff base (b) of each profile...159 Annex 3: X-ray diffractogram of sediment samples for 3 profiles 2N, CDBM and 2S (1 for top, 2
for base and 3 for water mark position)...164
Annex 4a: Interviewee list and addresses for questionaire Survey...167 Annex 4b: an example of RISCKIT Questionnaire...172 Anex 5: Transect wise DSAS statistical calculation for the whole shorelines...176
17
1. INTRODUCTION
1.1 Background:
Bangladesh is geographically extended from 20° 45´N to 26° 40´N and from 88° 05´E to 92° 40´E situated in the area of the deltaic GBM (Ganges-Bhahmaputra- Meghna) system, having the Himalayas in the north and the Bay of Bengal in the south. The country is exposed to tropical cyclones originating in the northern Indian Ocean and moving along north-easterly tracks. The 710 km long coastline contains approximately 28% of the total population (15 million people). Due to its dense population, a wide and shallow continental shelf and a complex coastal configuration with a shallow bathymetry, the Bangladesh coast has suffered enormous storm-related casualties. Recorded storm surge flooding devastation due to tropical cyclones is the worst in the world. Coastal areas are struck by storm surge flooding which causes widespread damage to living communities and properties, along with pulses of coastal erosion and accretion of the mainland coasts and offshore islands. Moreover, the increasing migration trend of the population towards the coastal areas for livelihood opportunities and the increasing trends of tropical cyclones along with extreme erosion coupling with sea level rise phenomena are likely to increase vulnerability in the context of climate change.
Bangladesh is considered as one of the most vulnerable countries in the world to the impacts of climate change. The vulnerability to disasters especially for sea level rise and storm-surge inudation was revealed in several studies including Warrick and Ahmad 1996, Cruz et al. 2007, Nicholls et al. 2007, Sarwar and Khan 2007 and Karim and Mimura 2008. The Fifth Assessment Report (FAR) of IPCC (2014) indicates that the rate of sea-level rise since the mid-19th century has been larger than the mean rate during the last two millennia. It also publishes comments that there has been significant improvement in understanding and projection of sea-level change since the AR4 and the global mean sea-level rise will continue during the 21st century at a faster rate than observed from 1971 to 2010. The report considers four RCPs (Representative Concentration Pathways) scenarios for the period 2081-2100 relative to 1986-2005 that the rise will be in the ranges of 0.26 to 0.55 m for RCP 2.6, while 0.45 to 0.82 m for RCP 8.5. It also concluded that sea level will rise in more than about 95% of the ocean area by the end of the 21st century. The SAARC Meteorological Research Centre (SMRC) analysed sea level changes of 22 years historical tide data at three tide gauge locations in the coast of Bangladesh as mentioned in the paper of Mohal et al (2006) under WARPO project of IWM. The study revealed that the projected sea level rise might be 18 cm, 30 cm and 60 cm for the year 2030, 2050 and 2100 respectively which is many fold higher than the
18
mean rate of global sea level rise over 100 years. A study by Ahmed and Alam (1998) mentioned 1 meter change of sea level by the middle of 21st century considering a 90 cm rise in sea level and about 10 cm local rise due to subsidence. A pilot study by the Department of Environment (DOE, 1993) mentioned a potential future sea level rise for Bangladesh of 30-50 cm by 2050. A recent study by Pethick and Orford (2013) on sea level rise in south west coast of Bangladesh presented evidence of relative sea level rise substantially in excess of the generally accepted rates from altimetry, as well as previous tide-gauge analyses. The study found rates of increase in RMSL (Relative Mean Sea Level) ranging from 2.8 mm/yr to 8.8 mm/yr whereas high water levels have been increasing at an average rate of 15.9 mm/yr and a maximum of 17.2 mm/yr. An increasing tendency in sea level rise from west to east along the coast has also been found (Singh et al., 2000).
Bangladesh was ranked as one of the world‘s most disaster-prone countries by World Bank (2005) with 97.1 percent of its total area and 97.7 per cent of the total population at risk of multiple hazards, including cyclones. About 178 severe cyclones of more than 87 km/h wind speed reported to be formed in the Bay of Bengal, causing huge destruction of life and property in between 1891 to 1898. There was devastation by 38 severe cyclones from 1970 to 1998 as reports published by BDKN (2013). Material damage of about USD 2.4 billion and human casualties numbered around 140,000 was inflicted by the supercyclone of 1991. A similar devestations caused in 1970 had claimed some 500,000 lives and uncountable properties loss (Choudhury, 1998). Furthermore, storm surge associated with a tropical cyclone originating in the Bay of Bengal, has also caused major devastation in the coastal region of Bangladesh (Islam, 1974; Alam, 2003). Cylone Sidr, the worst of its type since 1991, struck the coastal region of Bangladesh with winds of 250 km/h (155 mph) rising a five metre of surge, killing more than 3,300 people (Reuters News Agency, 2008). Approximately one million tonnes of rice was lost, and nearly 500,000 people were found still to be living in temporary accommodation, such as in tents made of polythene by January 2008. Study by IWM (2005) and Ali (2000) showed in details of the death numbers with surge heights from 1960 (Table 1.1) where it is also revealed that all high profile devastations covered Chittagong (highlighted in the table).
Figure 1.1 shows a compilation of track maps of the previous major 20 cyclones that made landfall between 1909 and 1991 found Chittagong as the most frequently hitted area by the cyclone hence more vulnerable than other areas (Rana et al 2011).
19
Table 1. 1: List of major cyclones with land fall area, wind speed, surge height and associated death casualties since 1960 (modified from Ali, 2000; IWM 2005).
Land Fall Date Location of Land Fall Max. Wind
speed (km/h)
Max. Surge Height (m)
Death
30 Oct 1960 Chittagong-Cox‘s Bazar 208 6.1 5179
09 May 1961 Bhola, Noakhali 160 3.0 11468
28 May 1963 North of Chittagong 203 3.7 11520
11 May 1965 Barisal, Noakhali 162 4.0 19 279
15 Dec 1965 Cox‘s Bazar 210 3.7 873
23 Oct 1966 Noakhali, Chittagong 145 6.7 850
12 Nov 1970 Chittagong 222 10.6 300 000
25 May 1985 Chittagong 154 4.3 4264
29 Nov 1988 Khulna 160 4.4 1498
29 Apr 1991 Chittagong 225 6.1 138 000
02 May 1994 Cox‘s Bazar 215 3.3 188
19 May 1997 Chittagong 225 4.6 126
26 Sep 1997 Chittagong 150 3.0 155
16 May 1998 Chittagong-Cox‘s Bazar 165 2.5 12
20
Figure 1. 1: Map of Bangladesh showing tracks of cyclones occurring from 1909 to 1991(Source Rana et al, 2011). The relatively low number of deaths in the 2007 Sidr cyclone was considered the result of the cyclone early warning system, cyclone shelters and landfall location (Paul, 2009). So a more accurate and precise early warning system and high resolution risk map development should be given priority for the coastal zone of Bangladesh in order to reduce the casualties of climate vulnerability induced flooding. Good reviews of numerical storm surge modelling in the Bay of Bengal can be found in Murty et al. (1986) and Dube et al. (1997) describing the development of depth-averaged (2D) hydrodynamic models that solve the shallow-water equations. Many of these hydrodynamic models include wetting and drying, allowing a moveable coastal boundary that can represent storm surge generation and inundation simultaneously (Flather, 1994; Madsen and Jakobsen, 2004). Full shallow-water equation models may be overpredicted for many gradually varying flooding problems (Neal et al., 2012) and increasing model resolution may be a better way to improve predictive accuracy than including a more detailed physical process representation. Model resolution is particularly important for inundation modelling because channels and elevations need to be correctly resolved to allow storm tide penetration upstream and inland.
21
Inclusion of river flow also allows the simulation of backwater effects (Ali, 1995; Agnihotri et al., 2006) which can be important for an island like Sandwip located in the confluence of the Meghna River estuary. The nesting of numerical hydrodynamic models can improve in computational efficiency at resolution scales useful to flood risk managers (Madsen and Jakobsen, 2004); however, nationwide inundation models with a grid size of the order of kilometres are currently considered to be of high resolution in the region (Debsarma, 2009) but not that much effective for local forecasting. Development of the Bangladeshi Coastal Inundation Model that is built on the operational JMA-MRI storm surge forecasting model, incorporated with the components for tidal effects and waves is underway headed by WMO in the name of CIFDP-B (JCOMM, 2014).
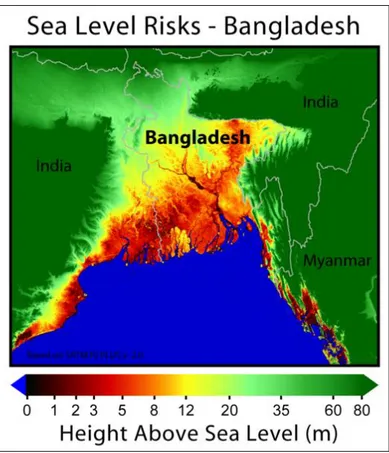
In Bangladesh 62% of the coastal land has an elevation of up to 3 m whereas 86% only reaches heights of 5 m above MSL in the GBM delta (Mohal et al., 2006; Ahmed, 2011; Talukder 2012). The active delta is characterized by low and flat deltaic islands such as Hatiya, Bhola, Sandwip, and many smaller ones. Typically the elevation of the most islands is less than 5 meter, and most commonly in between 2-3 meter (Pernetta, 1993). A map produced by global warming art shows the coastal elevation features of Bangladesh (Figure 1.2).
Figure 1. 2: Low elevation areas in coastal Bangladesh at risk of inundation fom climate change induced sea level rise (Source: www.globalwarmingart..com/wiki/File:Bangladesh_Sea_Level_Risks_png)
22
The GBM delta front is strongly dominated by tidal processes: tides are semi-diurnal with a tidal range of up to 4 m, and generate shore-normal tidal currents of up to 0.3 m/sec (Barua et al., 1994). Barua (1990) notes that during periods of low river discharge, the eastern distributary channels (Hatiya and Sandwip Channels) serve as flood channels. The delta has been growing both upward and seaward since its creation and geological evidence shows an average progradation rate of about 80-100 m /year.
Additionally, the sediments of the islands are very soft, unconsolidated silts and clays offering low resistance to the erosive forces of waves during storm events. Early works by hydrolic engineers demonestrated correlation between particle sizes and the minimum water velocities to erode and transport of the sediments (Grabowski et al., 2011) where they found that boulders need stronger flow to erode than sand where as cohesive mud needs much more stronger to erode than silts and sands. Hjulstrom diagram (Figure 1.2) has become a standard reference tool to illustrate this relationship (Dade et al., 1992). Thus, the landforms of the active delta are extremely temporal and are easily changed by the river flood flow, tidal and wave action, river discharge and attack of cyclones. Most particularly, the islands in and around the mouth of the Meghna have been easily eroded by river flow and wave action (Pernetta, 1993; Umitsu, 1997).
Figure 1. 3: The Hjulström curve (source: http://en.wikipedia.org/wiki/Hjulstrom)
There is however evidence that in the last two centuries the delta grew little towards the sea and faced severe erosion. The ―backwater effect‖ is considered by the scientific community as one of the basic reasons for coastal erosion in the area. The backwater effect is generally referred to as the retardation of a river out flow by a rise in the level of water at its mouth (Ali, 1999). Due to rises in
23
sea level, brackish water may even start flowing inland, in the reverse direction of natural flow. The backwater effect may happen for various reasons though. In the coastal region of Bangladesh the main causes can be pointed out as a strong southwest monsoon wind in the rainy season, high astronomical tides as well as high storm surges (Huq et al., 1999). Eventually these are the same reasons for coastal accretion as well. In addition, sea level rise is also considered as one of the most important factors having a long-term effect on coastal erosion in the area (Pramanik, 1983). As discussed by Pethik and Orford (2013), there is a further phenomenon causing an anomalous sea-level rise in particular the sea-level of high tides. Analyzing data from estuarine tide gauges in Sudarban, they observed an increase in sea level rise which was largely a response to anthropogenic processes, principally estuary channel constriction by embankments, resulting in amplification of the tidal range along these channels.
But, before any management approach to be taken for a dynamic coast, a comprehensive understanding of geomorphological evolution is prerequisite. Coastline movement and area changes due to erosion and deposition has been a major concern for coastal zone managemnt. The coast line chanage rates determination is not scientifically important only for study the sediment budget and role of natural processes in the shoreline alterations but also necessary to determine safe constructions, settle property ownership dispute, study the effictiveness of shoreline protection structures and to make an effective land use strategies (Camfield and Morang, 1996). Very dynamic coastline such as south eastern Bangladesh coast, pose considerable hazards to human use and development which again coupling with climate change vulnerabilities make more people and properties prone to hazards. Accurate demarcation and monitoring of shorelines over the short and longterm is necessery for understanding dynamic coastal processes (Chowdhury and Tripathi, 2013). Remote sensing technology is widely accepted by the scietific community and engineers for assessing coastal environment and monitoring changes over time and space in the coastal zone (Green et al., 2000). Geographic Information Systems (GIS) have been found as succesful tools in analysing such changes over time and space by utilizing simple to complex analysing and modeling tools and its extensions (Chowdhury and Tripathi, 2013). So, the synoptic and repetitive capabilities of Remote Sensing Systems can be utilized to provide timely required spatial data for GIS, enables determination and monitoring of extent and rate of coastal movement (White and Asmar, 1999). Satellite imigeries have been using as one of the popular RS product for extarction of shorlines and GIS to over lay multipl temporal shorelines and maps to measure and visulaize the changes over time and space extensively.
24
Land covers change analysis using satellite images have been used by risk managers, development policy makers and scientists since 70‘s. It enables monitoring the temporal changes in relation to many development concerns like natural hazards, land resource management etc. Bangladesh is a developing country and is prone to disasters of several types and frequencies . In the studies related to cyclone and storm surge, the aspect of land cover is generally ignored (Quader et al, 2014). The change of land cover is the result of the activities of the local inhabitants. Land cover change assessment may inform about natural resources and human assets exposed to the hazards over time. Some time people change the land cover to adapt to the impact of natural hazards. Settlement, forest, agricultural land and landscape of the coastal area changed over time with the regular hit of cyclones and tidal surges along the coast of Bangladesh (Quader et al, 2014). As the coasts and Islands in Bangladesh has been attacked by a lot of tropical cyclones and associated storm surges along with erosion, the evolution of the coastal land covers might be influenced by repetitive hazards along with many other factors of course.
From the brief discussion above about the effects of natural calamities in Bangladesh and dynamic geomorphological evidences, it is highly felt that we need a strategic model to predict the loss due to future natural disasters, especially for our coastal areas. We also badly needed more accuarate and precised timely cyclones and storm surges early warning systems depending on strategis geomorphic, hydrodynamic and hydrometeorological models to reduce the destructions. Strategic models can be constructed based upon a high resolution Digital Elevation Model (DEM) of Bangladesh coast. A detailed and integrated DEM can be useful not only for disaster prediction and risk assessment, but also for a wide variety of scientific, engineering and envieomental applications (FAP, 1995). For a comparison, the United States Geological Survey has conducted research and created digital elevation models of the whole coastal zone of the United States and major coastal cities. The resolution of the DEM varies from 1m to 10m (Foxgrover, et al, 2010). These sophisticated DEMs are now being used for various researches and long term planning purposes (Foxgrover, et al, 2010) as well as flood risk assessment studies. In 1993, Flood Action Plan-19 prepared several DEMs based on Bangladesh Water Development Board topographic data including DEM of North Central region, DEM of Tangail area and Bangladesh National DEM. But those DEMs include medium resolution regional DEM constructed from the original spot elevation po ints of BWDB maps and MPO‘s interpreted 1 km grid of elevation points. In October, 1994, FAP-19 produced a medium resolution or semi-detail DEM (500 m X 500 m) based on generalized BWDB spot elevation points. This generalization has been done manually by super imposing a transparent
25
500 m grid template on the source maps and recording the elevation point nearest each grid intersection. A detailed procedure is found in the FAP 19 Technical report (FAP, 1995). Finally the pixel size of the DEM was chosen as 300 m X 300 m where as the input data resolution was from the 500 m template grid.
Several studies (ISDR, 2002; World Bank, 2005; CRED, 2007) argued that the effects of natural hazards have been rising in terms of life and injuries in poorer or under developing countries including Bangladesh where institutional disaster reduction approaches should be adaptable to individual social and local livelihood experiences (ISDR, 2004; UNDP, 2004; DFID, 2005). The central consideration to the development of disaster research should have been vulnerability factors (Khan, 1974; Burton, Kates and White, 1993; Hewitt, 1997; Twigg and Bhatt, 1998; Weichselgartner, 2001, Wisner et al., 2004; IFRC, 2006) determined on spot (areas affected) of the effected locality and community. Understanding island processes, vulnerabilities and choosing proper implementing strategies for sustainable development becomes critical for island development (Teh, 2000).
Nonetheless, localized vulnerability factors in cyclone hazards arguably remain only partly considered or ignored, though a good progress made in cyclone preparedness, exemplified by the existing comprehensive disaster management policies of the Government of Bangladesh. Indigenous disaster response experiences could be more central to disaster interventions in Bangladesh. Enhanced local-level adaptation by community based copying strategy to natural hazards is crucial for resilience to any suspected increase in coastal climate hazards. This work explores the context of vulnerability profile and local coping strategies in relation to hazard response experiences in the study area. The analysis of the study is consistent with other works concerning vulnerability and disaster response in the country (Zaman, 1988; Haque and Zaman, 1994; Hutton and Haque, 2003, 2004; Edgeworth and Collins, 2006).
The current aim of the main disaster management government agency of Bangladesh, the Disaster Management Bureau of the Ministry of Food and Disaster Management (MoFDM), is to achieve a paradigm shift in disaster management: from conventional response and relief to a more comprehensive risk reduction culture. In doing so, it underscores capacity-building of affected people to create resilience to disasters (MoFDM, 2007). This reflects the adoption of the ‗Hyogo Framework for Action 2005–2015‘ in national policies, emphasizing the need to reduce vulnerability and promote resilience (UNISDR, 2005). Yet, without in-depth understanding of the
26
underlying vulnerabilities to natural hazards, the basis of local people‘s perceptions and behavior, and the goals that they set, disaster reduction strategies are considered unlikely to succeed (Khan, 1974; White, 1974; Burton et al, 1993; Blaikie et al., 1994). Any given risk or disaster event is distinguished by its geographic location and setting. These are important keys to the origins of danger, the forms of damage and whom they most affect. They are critical for the appropriateness and deployment of organized response (Hewitt, 1997).
Indeed most disaster commentators have implied, if not directly highlighted, that it is essential that planners, policymakers and development practitioners endeavour to understand local uses of the environment, local knowledge and local practices (White, 1974; Chambers, 1983; Sillitoe, 2001). Furthermore, the underlying causes of vulnerability to disasters more locally are often economic and societal, such as through landlessness, fragmentation of community cohesion, and lack of access to political representation.
Despite its renowned experience and ongoing progress for coping with disaster, Bangladesh still experiences a dearth of optimal coordination among physical, societal and technological systems in its most hazardous zones. Public adjustments occur, but less so with regard to people‘s perceptions or behaviour, these being cited as important factors responsible for the failure of past hazard mitigation strategies (Khan, 1974; Paul, 1984; Haque and Zaman, 1993; Hutton and Haque, 2004). Therefore, an analysis of the relationship between natural hazards and human behaviour in the coastal areas, using local-level and personalized accounts, appears to be an imperative for developing improved disaster reduction strategies. The rationale here is that understanding vulnerability and human responses in direct context leads to more applied application of the basic components frequently alluded to in disaster risk reduction frameworks (IFRC, 2002; ISDR, 2004; UNDP, 2004; DFID, 2005) along development of more accurate and precised warning system and risk mapping and comprehensive signal disseminations for a community.
1.2 Rationale of the Study
The island is located at a frequent passage of tropical cyclones and therefore extremely prone to storm induced floods and other associated natural hazards. Every year, people in the island face risks from cyclones and following storm surges threatening lives and households of the entire community. It is also exposed to a macro-tidal regime, with tidal variation in the range of 3 to 6m from neap to spring tides. Located in an active delta, the morphological evolution around the island is also very active due to the significant degree of hydrodynamic and sediment transport processes.
27
Coastal erosion is rapidly changing the living space for the community. The geographical position, the frequent occurrence of extreme hydro-meteorological events with the rapid changes in geomorphology and the socio-economic regime in Sandwip Island, badly needs an effective Disaster Risk Reduction (DRR) measure which is an extremely challenging task. A reliable and easy to understand early warnings and a community-based response framework can reduce significantly the loss of lives and properties. However, better understanding about the physical, hydro-meteorological, socio-economical, socio cultural and geomorphological characteristics along with community perception is prerequisite for a better management approach to be successfully implemented for the hazardous area.So, the study was attempted to review, collect, interpret and produce as much as information to characterize the erosion and storm surge prone Sandwip Island of Bangladesh
Thus, the work done during this project will provide the base and demonstrate the future directions towards those required actions.
1.3 Objectives
The most important hazards in the area as discussed earlier are caused by tropical cyclones and associated storm surges, resulting in massive flooding, that affected the entire Sandwip Island in most cases. Often these phenomena are combined with other hazards, such as strong winds and tidal inundation, resulting in intensified risk. The dense population and persistent poverty of the island resulted in recurrent casualties of immeasurable scales. In the years 1825, 1876, 1985 and 1991, Sandwip was affected by extreme meteorological events causing severe marine flooding and leading to immense destruction. During the most damaging storm that affected the island, in 1991, the estimated storm surge height was 6m and the human casualties were estimated at approximately 40,000 people, when 80% of the residential infrastructures were also destroyed. More specifically 25,000 human casualties occurred during the cyclone and 15,000 human casualties were caused bymalnutrition and diseases after the event.The rate of the erosion is very high and not compensated by deposition, despite its large rate. Several attempts as cited earlier to assess the erosion rate have been done considering the whole coast and lack of studies for the island evidencing the particular difficulties to develop scientific studies in this site.These devastating losses are becoming even more severe due to the loss of the agricultural crops and the associated scarcity of food, as well as due to the destruction of the majority of the traditional residences, roads and embankments.
28
So, the objective of this work is to improve the knowledge of the island including its coastal geomorphology, geomorphological evaluation, sediment characteristics, sea level variations and socioeconomics to community perceptions and indigenous coping strategicto disasters.The work aimed at producing a coastal vulnerability perspective to be used in further research, development of effective preparedness, management and actions plan.To reachthis goal, an attempt was taken to find out the answers to the following questions:
1) What is the status of geomorphological changes?
2) What are the sediment characteristics of the erosion-accretion prone shorelines? 3) What is the status of the sea level rise?
4) How to make a high resolution bathymetry (DEM) and topographic (TIN) map to be useful for further attempt like management or warning modeling for the island
5) What is the total vulnerability/hazard ranking by local perceptions?
6) What are the land use pattern changes due to erosion and associated hazards? 7) How do people cope with the disasters and think to be useful for further actions?
29
2. THE STUDY AREA
The study area is completely controlled and influenced by the Meghna Estuarine system where as the system itself is evaluated and influenced by the GBM delta. So, a brief description of the delta and the MES system followed by the island is given for a better understanding of the peculiar characteristics and scenarios relevant with the study area.
2.1 The GBM Delta
The Ganges and the Brahmaputra, two Himalayan mighty rivers together carry the largest sediment load of any river system via another small, non-Himalayan river, the Meghna which drains to the Bay of Bengal as a combined river system. Together these rivers have built the largest delta in the world, the GBM delta (Coleman, 1969; Milliman and Meade, 1983). The delta covers ~100,000 km2, draining land from Bangladesh, Bhutan, China, India and Nepal. It includes most of Bangladesh and part of West Bengal, India, with many of the 147 million people (in 2000) living in the delta facing multiple challenges ( http://delta.umn.edu/content/ganges-brahmaputra-meghna-gbm-delta, Figure 2.1).
Figure 2. 1: The Bengal Delta (Source: Barua, 1997)
But the relative positions of the rivers along with the depocenter of the delta building processes changed in the course of time. For example, the Ganges River built several deltas those are no longer existing during its northeastward migration and finally settled at its present position.
30
Additionally, The Brahmaputra river built the early delta near Brahmaputra Mymensingh as proclaimed by Rennel's map and finally has got settled to its present straight southward course (Mojumdar, 1941; Niyogi, 1972; Morton & Khan, 1979; Umitsu, 1993). Almost 60% of the coastline formation of Bangladesh has been controlled by the delta forming activities of these rivers.
Two basic physiographic characteristics were identified throughout this deltaic coastline hence classified into two physiographic units: the inactive or the abandoned Ganges tidal plain which is relatively old and the active Meghna deltaic plain which is geologically very young (Barua, 1991a). The Meghna deltaic plain covers the areas from the Chittagong coast in the east to Tetulia Channel (Figure 2.2) which is highly dynamic, changing its plan form continuously (Eysink, 1983).
Figure 2. 2: Bangladesh coastline and the active Meghna Estuarine Delta (Source: Barua, 1997)
The climate of the GBM delta in Bangladesh part is fully controlled by the monsoon cycle. According to Brammer (1996) in Allison (1998), the Monsoon season extends from late May to September, when 80% of the rainfall occurs with winds blowing from the Indian Ocean (e.g. southeast to southwest). Annual rainfall in the delta ranges from 125 cm in western Bangladesh to more than 300 cm in the river mouth region, and more than 500 cm in the extreme northeast
31
bordering the Himalayan plateau. Mean daily temperature ranges from about 18'C in the dry season of continental winds (December-February) to 30°C prior to the onset of monsoon in April-May. Temperature extremes of 4°C and 43°C have been recorded in the region, with a narrower range along the coast.Most of the sediment transported by the Ganges- Brahmaputra (80%) is silt and fine sand with little clay supplied by the young catchment area (Coleman, 1969). The whole catchment area and drainage basins is shown in the Figure 2.3.
Figure 2. 3: Map of the combined drainage basins of the Ganges (orange), Brahmaputra (violet), and Meghna (green). Source: http://en.wikipedia.org/wiki/Ganges#mediaviewer/File:Ganges-Brahmaputra-Meghna_basins.jpg
2.2 The Meghna Estuarine System
The Meghna Estuary (Figure 2.4) of the active GBM deltaic plan is a very dynamic estuarine and coastal system which conveys the huge combined flows from three mighty rivers, i.e. the Ganges, Brahmaputra (known as Jamuna in Bangladesh part), and Meghna making the Lower Meghna River (100-200 km upstream of the Bay of Bengal) Estuary (LMRE) as one of the largest of this kind and finds its ultimate way to the Bay of Bengal. The sediment discharge through the Lower Meghna is the highest and the water discharges the third highest (after Amazon and Congo) considering all other system of similar kind in the world. This tremendous water and sediment load discharged by upstream and the tidal influence from the Bay of Bengal has characterized the estuary is an area of very active geo and hydro morphological system Producing high erosion and accretion rates (Sokolewicz, 2008). Furthermore, the area is very much prone to extreme cyclonic storms, coupled with tidal and storm surge inundation. The estuary is notably sensitive to climate change and sea level rise due to its geographical location and geomorphological settings (DHV, 2001). The
low-32
lying land has developed within and surrounding the estuary which is home to over 4 million people. The local economy, livelihoods, and health are directly tied to the physical environment of the estuarine system (CEGIS, 2003).
Figure 2. 4: The Active Meghna Estuarine Delta System. Source: http://www.warpo.gov.bd/rep/knowledge_port/KPED/Overview.htm
2.2.1 Hydrodynamics and geomorphology
The river discharge which is a combined discharge of the aforesaid three mighty rivers is strongly characterized by seasonal changes varying from 10,000m3/s during the dry season to 1000,000 m3/s during monsoon season approximately. The lower estuarine coastal area of the Meghna is heavily controlled by tides and freshwater flow, dominated by tidal influence in the eastern part whereas fresh water flow dominates in the mid and western part. The turbidity laden fresh water is conveyed to the bay of Bengal in the south eastern part. The eastern part is controlled mainly by tidal channel with a prominent counter clockwise residual circulation with a current velocities upto 4m/s following spring tides and monsoon flooding in the upper reach of lower Meghna (DHV, 2001, Sokolewicz, 2008). The eastern lower part is macrotidal with tidal variation of 3 to 6 meter