1
"This is the pre-peer reviewed version of the following article: S. Castro-Hermosa, M. Top, J. Dagar, J. Falteich, and T. M. Brown, “Quantifying Performance of Permeation Barrier - Encapsulation Systems for Flexible and Glass-based Electronics and their Application to Perovskite Solar Cells”, Advanced Electronic Materials, vol. 5, 1800978 (2019) which has been published in final form at https://doi.org/10.1002/aelm.201800978. This article may be used for non-commercial purposes in accordance with Wiley Terms and Conditions for Use of Self-Archived Versions."
Quantifying Performance of Permeation Barrier Encapsulation
Systems for Flexible and Glass-based Electronics and their
Application to Perovskite Solar Cells
Sergio Castro-Hermosaa, Michiel Topb, Janardan Dagara, John Falteichb, Thomas M. Browna,*
aCHOSE (Centre for Hybrid and Organic Solar Energy), Department of Electronic Engineering, University of Rome Tor Vergata, Via
del Politecnico 1, 00133 Rome, Italy
bFraunhofer Institute for Organic Electronics, Electron Beam and Plasma Technology FEP, Winterbergstrasse 28, 01277 Dresden,
Germany
Abstract
Effective barrier/encapsulation systems represent key enabling technologies for large-area electronics for attaining long lifetimes. Here, we unraveled architectures, application processes and water vapor transmission rates (WVTR) of transparent flexible ultra-high permeation barrier films (UHPBF) and compared them with polyethylene-terephthalate (PET), and glass barriers via calcium tests. We quantified how strongly the performance of barrier/sealant system depends on barrier orientation, adhesion, manipulation, defects and storage. We found that introducing an additional
*Corresponding author
promoting layer on the standard UHPBF stack reduced the WVTR by a factor of 5 compared to barriers without it. Finally, barriers were used for the encapsulation of perovskite solar cells (PSCs) enabling us to extract a relationship between WVTRs of the barrier/sealant systems and degradation rates (DR) of PSCs. The PSC encapsulated with UHPBFs retained 77% of initial efficiency after 840 hours, 14% lower than PSC encapsulated with glass. The DR fell exponentially when the WVTR decreased from 101 to 10-4 g m-2 d-1. Outside that range any gains or losses are mitigated by the tailing of the sigmoid curve relating the two parameters. Our results highlight important factors which will help those developing encapsulation barrier and sealant systems strategies.
Keywords: degradation rates, encapsulation, lifetime,barrier film, stability.
1. Introduction
The industry of large area optoelectronics is progressing rapidly. From photovoltaic modules to flat panel displays, the markets for the more mature technologies, and research for the emerging technologies, are increasing year by year. Among these are organic, metal oxide, and organo-hybrid perovskite semiconductor transistor, light-emitting diodes and solar cells based systems [1–4]. Large-area optoelectronics is developed on rigid (mainly on glass) and flexible (mainly on plastic such as polyethylene terephthalate, PET) substrates[5] with other types of substrates also being investigated such as paper[6,7], flexible glass[8] or textiles[9] . Organic light-emitting diodes (OLEDs), for example, are today one of the most commercialized technologies especially in small-electronic markets (e.g. smartphone displays) where they now take a major share of the market. In research laboratories, perovskite solar cells (PSC) have seen a huge interest reaching certified record efficiencies of 23.3%
also for indoor IoT devices, sensors and small consumer electronics [12] even for flexible substrates under artificial lighting[13,14]. The success of large area electronics in general lies in the advantageous properties of the materials used and in the fabrication processes (e.g. evaporation, sputtering or solution processing via printing techniques). These are also often compatible with flexible substrates[15,16]. Nevertheless, lifetimes of many of the constituent materials suffer when coming in contact with ambient moisture and oxygen[17–19] which can induce chemical degradation to the semiconducting, transport and electrode layers[20–22].
To avoid moisture and oxygen ingress and the further degradation, the devices must be encapsulated with permeation barriers ensuring a water vapor transmission rate (WVTR) range of 10-3-10−6 g m-2 d-1 [23–28] and an oxygen transmission rate (OTR) between 10-2 and 10-5 cm3 m-2 d-1 [29–32]. Encapsulation of rigid devices is relatively straightforward, where glass or metal sheets are applied with appropriate sealants. For flexible devices, especially where transparency of the barrier is required (e.g. for displays or photovoltaic modules), the solutions are more complex since plastics are highly permeable to gasses. Currently, the encapsulation methods consisted in direct deposition of a protective thin films (i.e. Al2O3 or Parylene C[33–38]), or the application of a permeation barrier film using a sealant (e.g. epoxy, UV curable or silicon-based resins, or bifacial adhesives)[26,27] on the devices. Protective film deposition directly on the device typically, although effective[38–41], requires high cost vacuum assisted equipment/process (e.g. Atomic layer deposition - ALD) as well as detailed understanding of the interaction between the deposition process, the barrier layer material and the device structure. The application of permeation barrier after production (by a lamination step) is more straightforward and applicable to all types of devices with a wide range of sealant/barrier combinations available to the device engineer. Permeation barriers prevent the ingress of gas (i.e. water vapour or oxygen) due to inherent properties of the material or materials stacks such as hydrophobicity, low absorption or diffusion coefficient [28,42–44]. Glass has the best water/oxygen blocking properties (WVTR<1x10⁻⁶ g m-2 d-1[45]) and is a very affordable material; however, it is
mostly incompatible with flexible electronics: a market that dramatically rose in the last years[46]. As an alternative flexible ultra-thin glass was developed and used to encapsulate OLEDs, showing good permeation and flexibility properties but was susceptible to the cutting process which can lead to edge damage[47]. Flexible permeation barriers must meet the minimum WVTR and OTR requirements, and be compatible with large-area roll-to-roll fabrication processes [48]. Most plastic films, including PET, have very high water permeation rates (WVTR = 3.9-17 g m-2 d-1)[45]. It is therefore important to deposit at least one metal, metal oxide and modified polymer layer on top of the polymer film that acts as blocking or trapping layer of moisture. Different stacks of flexible barrier have been developed using Al, Al2O3, SiOx, SiN, TiO2, Zn2SnO4, or organic-inorganic hybrid polymer layers, and some remarkable WVTRs have been obtained (<1x10⁻⁵ g m-2 d-1)[49]. Although the WVTR of the multilayer barrier is measured, inter alia, by gravimetric[50], coulometric[51], electrical[52] or optical [53,54] methods, the performance of the complex barrier/sealant system can vary when applied on a device because the latter comprises more than one material layer, the sealant can affect the underlying layers differently and some moisture/oxygen can be incorporated during device preparation. Additionally, the most sensitive materials are also affected/degraded by other external agents such as light, temperature, internal chemical reactions occurring between layers, or ion migration[17,22]. Therefore, we aimed for a correlation between barrier performance and degradation of encapsulated optoelectronic devices, specifically for perovskite solar cells, which we evaluated under similar test conditions than the barriers. Currently, there are studies that correlated the barrier performance and the lifetime of organic solar cells (OSC). By studying the water diffusion through the barriers, Cros et al [55] calculated that 3.5 g/m2 are needed to degrade the PCE of a OSC by 50% when it is tested at 22ºC and 100% RH. Similarly, Hermenau et al.[56] showed that the quantity of water increase to 15.5 g/m2 when OSC are tested at 45ºC and 5.5% RH. Nevertheless, there are no reports unravelling the
Here we measured the permeation rate (WVTR) of different barriers: glass (for rigid devices), and PET film and a transparent flexible ultra-high multilayer permeation barriers (UHPBF) with different architectures and orientations for flexible devices. With calcium tests we highlighted the effect of a correct orientation, manipulation and storage of different types of barriers. Also, we encapsulated PSCs with different permeation barrier and tested degradation rates under an ISOS-D-1 shelf life test[57]. PSC degradation rates (DRs) allowed us to extract the influence of permeation barriers and their WVTR on the degradation rates/failure of solar cells, and, for the first time for PSCs, an empirical relationship between the degradation rate of the cell and the WVTR of the applied permeation barrier/sealant system.
2. Results and Discussion
Figure 1: (a) Layouts used to measure the degradation of calcium sensors (left) and perovskite solar cells (PSC, right).
Calcium test devices had an architecture Glass/ITO/Calcium/Sealant/Barrier, and PSCs had a structure of Glass/ITO/SnO2/Al2O3/CH3NH3PbI3/Spiro-OMeTAD/Au/Sealantt/Barrier. Different barriers were tested including PET, glass and ultra-high permeation barrier films (UHPBF). (b) Photograph of flexible PET, UHPBF-R and UHPBF-S
barriers, and rigid glass barrier. Scanning electron microscopy (SEM) of (c) PET/ZTO/ORMOCER/ZTO (UHPBF-R) and (d) PEN/ZTO/ORMOCER/ZTO/ORMOCER/ZTO/SiOxCyHz (UHPBF-S) barriers.
Firstly, we evaluated with both electrical (i.e. monitoring the resistance of encapsulated calcium sensors over time) and optical (i.e. monitoring the color of the calcium sensors over time) calcium tests (see Figure 1a) the performance of different barrier/sealant system. The ultra-high permeation barrier films (UHPBF – see Figure 1b-d) were compared against plane PET film- and glass- barriers. Two different architectures of UHPBF were evaluated: PET/ZTO(zinc-tin-oxide Zn2SnO4)/ORMOCER®(organic-inorganic hybrid polymer)/ZTO labeled as “UHPBF-R” (see Figure 1c), and one with an additional SiOxCyHz layer, i.e. PEN/ZTO/ORMOCER/ ZTO/ORMOCER/ZTO/SiOxCyHz labeled as “UHPBF-S” (see Figure 1d). Subsequently we applied the barrier systems to perovskite solar cells carrying out ISOS-D-1 shelf-life tests to extract a relationship between WVTR of the barriers and degradation rates of PSCs.
The UHPBFs have proven to be a suitable option for the encapsulation of optoelectronic devices because of their low WVTR values. Generally, the UHPBFs are commercialized indicating “extrinsic” WVTR which include all defects on a certain large-area (i.e. 70 cm2) as measured with the Brugger WDDG coulometric system or on small-area (i.e. 3 mm diameter) with, for example, the Ca-Test[54]. According to the international standards such as to ISO 15106-3:2003 standard[64] and BIS BS3177[59], the extrinsic WVTR is measured after the barrier fabrication at 38ºC an 90% RH. The extrinsic WVTR of any tested barriers and the respective technique used for its calculation are listed in Table 1. However, to determinate an interdependence between the encapsulation barriers and the lifetime of PSC, both barriers and solar cells must be evaluated under same test conditions. Thus, barriers were here tested at room temperature and relative humidity (T=25ºC and RH=35%)
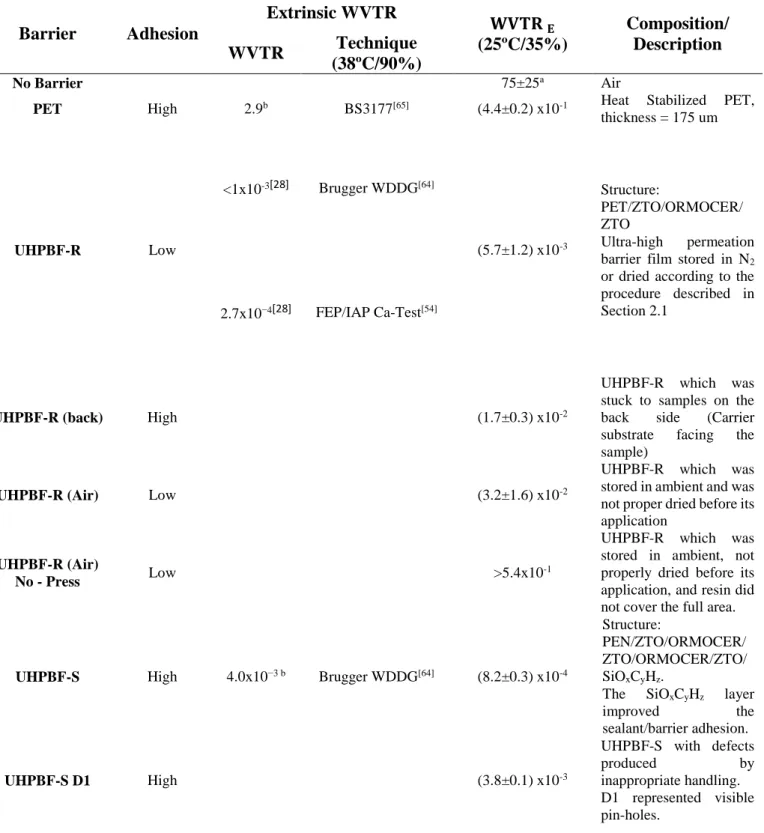
Table 1. WVTR of the different barrier/sealant systems. The extrinsic WVTR indicates the water
permeation according to the test conducted by the barrier manufacturer following international standards. The WVTRE was determined utilizing the method described in section 2.3 using the electrical Ca-test (except for samples without barrier which were tested with an optical Ca-test due to very rapid degradation of the calcium). The aging tests were carried out at room temperature and relative humidity (T=25ºC and RH=35%) for more than 1000 h.
Barrier Adhesion Extrinsic WVTR 𝐖𝐕𝐓𝐑 𝐄 (25ºC/35%) Composition/ Description WVTR Technique (38ºC/90%) No Barrier 75±25a Air
PET High 2.9b BS3177[65] (4.4±0.2) x10-1 Heat Stabilized PET,
thickness = 175 um UHPBF-R Low <1x10⁻³[28] Brugger WDDG[64] (5.7±1.2) x10-3 Structure: PET/ZTO/ORMOCER/ ZTO Ultra-high permeation barrier film stored in N2 or dried according to the procedure described in Section 2.1
2.7x10⁻⁴[28] FEP/IAP Ca-Test[54]
UHPBF-R (back) High (1.7±0.3) x10-2
UHPBF-R which was stuck to samples on the back side (Carrier substrate facing the sample)
UHPBF-R (Air) Low (3.2±1.6) x10-2
UHPBF-R which was stored in ambient and was not proper dried before its application
UHPBF-R (Air)
No - Press Low >5.4x10
-1
UHPBF-R which was stored in ambient, not properly dried before its application, and resin did not cover the full area.
UHPBF-S High 4.0x10⁻³ b Brugger WDDG[64] (8.2±0.3) x10-4
Structure:
PEN/ZTO/ORMOCER/ ZTO/ORMOCER/ZTO/ SiOxCyHz.
The SiOxCyHz layer
improved the
sealant/barrier adhesion.
UHPBF-S D1 High (3.8±0.1) x10-3
UHPBF-S with defects
produced by
inappropriate handling. D1 represented visible pin-holes.
UHPBF-S D2 High (3.9±0.2) x10-3
UHPBF-S with defects
produced by
inappropriate handling. D2 represented cracks.
Glass High 1x10⁻⁶[45] (1.9±0.5) x10-4 Thickness of 1 mm
a) WVTR was calculated using the optical calcium test. b) WVTR from material datasheet.
2.1. Ultra-high permeation barrier films, plastic films, glass barriers vs no encapsulation
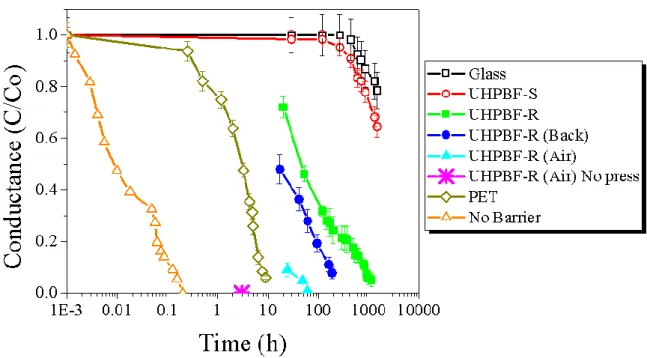
The encapsulation barriers, including PET, glass and the different UHPBFs, were tested under laboratory environmental conditions (T=25ºC and RH= 35%). The electrical calcium test allowed the calculation of WVTRE values which are present in Table 1. The WVTRE represents the rate at which water passes through the barrier (at least until the Ca-sensor fails). Here, the stability was tested for no less than 1000 hours. Data in Figure 2 represents average conductance values over 1464 h for the UHPBF-S and UHPBF-R barrier films compared to those with glass, a simple PET plastic film and no barrier applied. The UHPBF-S reduced average water vapor permeation by five and three orders of magnitude compared with samples without encapsulation or encapsulated with PET only respectively (see Table 1). Samples encapsulated with UHPBF-S retained 64% of their initial conductance which was only 17.9% lower than samples encapsulated with glass (78%) in relative terms, possessing however additional characteristics of being flexible and light-weight, and compatible with R2R lamination processes. Finally, the inset photograph in Figure 3 shows five ca-sensors encapsulated with UHPBF-S after 1434 hours showing no macroscopic signs of degradation.
Figure 2: Electrical calcium test (normalized conductance vs time) of Ca sensors encapsulated with a PET film (dark
green open diamond), glass (black open square) or a flexible ultra-barrier films stored and measured in air, comparing barrier types, orientation of barrier, and storing conditions together with an un-encapsulated sample (orange open triangle). Optimized UHPBF-S (red open circle), UHPBF-R kept inside the glovebox with the resin applied on the multiple oxide/OROMOCER stack (green square) or on the PET carrier film (UHPBF-R (Back), blue circle), and UHPBF-R stored outside the glovebox in air either pressed with (UHPBF-R (air), cyan triangle) or without (UHPBF-R (air) No press, pink star) an anti-stick PTFE rectangular slab for uniform pressure application.
When UHPBF-R was initially applied in the testing architecture of Figure 1.a, it was applied over the calcium sample by hand (UHPBF-R (Air) No press) which led to an irregular coverage of resin and/or the presence of gas bubbles trapped between the barrier and calcium sensors. Consequently, the conductance degraded rapidly, failing at the 3h mark (dark blue down triangle in Figure 2). Compared to the extrinsic WVTR=2.7x10⁻⁴ g m-2 d-1, calculated via Hergert optical calcium test which requires only perimetric application of glue and calcium sensor is deposited direct on the barrier, the fast degradation of the Ca can be attributed to two main reason: an inefficient application of sealant, and/or the storage of barrier in air. We thus improved the application of the sealant using a PTFE rectangular slab to apply pressure uniformly over the whole barrier waiting for the sealant to set. This notably improved the operation time of the barrier from 3h to 60h (UHPBF-R (Air), cyan triangle), but the
performance still was lower than expected. This was the result of storage of UHPBF-R in air where it absorbs moisture. Barriers must be kept in an inert atmosphere (i.e. N2 or Argon) and/or dried prior to their application. In fact, the barriers dried beforehand (UHPBF-R, green square), as described in Section 2.1, showed an order of magnitude better WVTR (4.5x10⁻³g m-2 d-1) than those that were not (UHPBF-R (Air)), indicating that any moisture present in the barrier can seep out into the device during time if not degassed properly. It is also important to apply the barrier in the right way: the side with oxide/ORMOCER multilayer stack must face the device. In fact, when one instead applies the PET side over the devices, the water permeation (Figure 2, blue circle) increased by an average factor of 5.8 compared to applying the glue the opposite side (Figure 2, green square). This can be attributed to the thickness and high permeation of PET (75 µm) which allowed side ingress of water through the PET and then into the devices. It must be noted that UHPBF-R presented us with some delamination and sealing issues upon application, likely indicating poor adhesion of the glue/resin with the final ZTO layer. We thus tested the UHPBF-S barrier which had an additional 50 nm layer of SiOxCyHz over the ZTO. This additional layer determined a significantly improvement in adhesion at the barrier/glue/device interface. In fact, even though the new UHPBF with SiOxCyHz (UHPBF-S) presented a similar extrinsic WVTR (4x10⁻³ g m-2 d-1) to that of prior UHPBF-R (<1x10⁻³ g m-2 d-1) using the test which requires only perimeter sealing (Coulometry test), the UHPBF-S performed considerably better (average WVTR of 8.2x10⁻⁴ g m-2 d-1) than UHPBF-R being one order of magnitude less when tested glued to the device (Figure 2., red open circle), as a result to a much improved adhesion which possibly led a reduction of the interface diffusion.
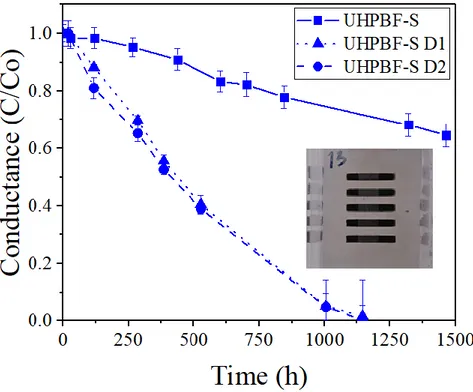
Figure 3. Normalized average conductance of calcium sensors over time encapsulated with appropriately-handled
UHPBF-S (UHPBF-S square solid line), or with the presence of two visible kind of defects: pin-holes (UHPBF-S-D1, triangle dotted line) and cracks (UHPBF-S D2, square dashed line) induced by a poor handling of UHPBF-S. Inset picture shows a sample encapsulated with UHPBF-S after 1434 hours.
In this section, we describe types of defects that can appear in barrier films that are not handled withappropriate care and their effect in UHPBFs. The defects we identified, mainly thanks to our optical calcium test, were of two main types: pinholes (defect type 1, D1) and cracks (defect type 2, D2). These were produced by an inappropriate manual handling of barriers during cutting or lamination over the devices, or manufacturing defects. The WVTR of barriers that had cracks (labelled as UHPBF-D2), from which water ingressed rapidly, was only 3.7x10⁻³ g m-2 d-1, one order of magnitude worse compared to barriers that had been handled properly and devoid of cracks (see Figure 3 and Table 1). Generation of defects of type 2 was eliminated when barrier was cut to size with a laser beam instead of a scalpel and handled with flat blunt plastic tweezers. Pinholes or D1 defects were, instead, more difficult to prevent than cracks. Pinholes are microscopic paths through which gasses permeated and the WVTR of UHPBF-S decreased. After 1000h, the pinholes area
embraced 20% of total calcium area which led to a reduction of WVTR (3.7x10⁻³ g m-2 d-1). D1 defects are related to defects in the coating as a result of particles on the substrate that were too large to be covered with the ORMOCER planarization layers, to particles generated during processing, to damage from local mechanical impact through contact of the barrier layer with rollers or the backside of the next film layer when up winded onto a roll [49]. These defects create preferred permeation pathways through the coating leading to locally faster degradation. The results in Figure 2 and Figure 3 show that the sealant and the film barriers form a coupled system which protects the calcium from degradation. Thus, the performance of the encapsulant does not only depend on the WVTR of the barrier film but also on the handling of the barrier as well as the sealing method and adhesive between barrier and glue.
2.4. Encapsulation of Perovskite Solar Cell with permeation barriers and their influence on degradation rates
The PSCs are not stable when exposed to long term enviromental factors including temperature, light, oxygen and moisture[17,66–71] Perovskite solar cells must be protected from water because it reacts with CH3NH3PbI3[72–74] hydrating it as shown in Equation (1) and (2) [73]
n[(CH3NH3+)PbI3] + H2O → [(CH3NH3+)n−1(CH3NH2)nPbI3] [H3O] (1)
[(CH3NH3+)n−1(CH3NH2)nPbI3] [H3O] → PbI2+ CH3NH2+ HI + H2O + (n − 1)[(CH3NH3+)PbI3] (2)
Frost et al [73] proposed a different degradation mechanims induced by water where one molecule it is enough to initiate the decomposition of CH3NH3PbI3. This water interaction has a direct impact in
In order to gauge the incluence of the barrier/sealant systems and their WVTR on the degradation rates of the solar cells we conducted a lifetime test in which PSCs were kept in dark at constant room temperature and humidity between measurements, also to avoid light-induced[66–69] and temperature degradation[70,71] effects (in order to have the same conditions to those of the tests we carried out on our Ca sensors). PSCs were encapsulated using the same barriers described previously, i.e. with nothing, glass, PET and UHPBF-S. Figure 4.a presents the evolution of PCE through time for encapsulated and unencapsulated PSCs. Degradation of PSCs over hundreds of hours with a PET-only barrier (high permeation), apart from a slight increase after the first 72 hours likely due to SnO2/CH3NH3PbI3 interface stabilization[75], was only marginally better than equivalent devices without encapsulation. After 840 h, the PCE had dropped to only 6% of its initial value. Instead, PSCs protected by high-performance permeation barriers, i.e. glass and UHPBF-S, retained 91% and 76.6% of their PCE for more than 840 h respectively. These barriers were thus much more successful in blocking oxygen/water migration with degradation in these encapsulated cells thus likely caused by intrinsic causes such as traps, ion migration, and/or interface instability[76–79] as well as residual moisture and/or non-complete absence of microscopic pinholes in the UHPFB. Whereas glass is still the most effective barrier for solar cells, the transparent UHPFB film enables the manufacture of solar cells on flexible substrates[80].
Figure 4. (a) Stability test for perovskite solar cells encapsulated with different permeation barriers. The PCE of solar
cells vs time without encapsulation (black down triangle) and with one of the three different barriers: Glass (red square), PET (green up triangle) or UHPBF-S (blue circle). The PCE values were normalized to their initial PCE value. The samples were kept at T=23C and RH=35% in the dark (shelf life) and measured at S.T.C. (b) Degradation rates in [%/d], where % is the relative decrease in PCE after 840h, of power conversion efficiency (PCE) for perovskite solar cells (PSC) as a function of the water transmission rate (WVTR) of the different barrier/sealant systems used to encapsulate them. The inset table shows the calculated parameters of the fitting Hill sigmoid function (red line).
Our systematic study on WVTRs of barrier/sealant systems and on degradation of perovskite solar cells over time enabled us to extract a phenomenological relation between the two rates, i.e. the influence of the performance of barriers on the lifetime of the photovoltaic cells. The degradation rates in PCE of PSC were determinate by the linear fitting of shelf-life data and they were plotted as a function of the extracted WVTRs (Table 1) of the corresponding barriers in Figure 4.b. We applied a Hill sigmoid function for fitting the curve. This is because at very low WVTRs, PCE degradation rates (0.18-0.56 %/d) depend on intrinsic effects or residual moisture from fabrication as well as side ingress[81], so these will tend to dominate over the small amount of moisture leaking in from the barriers. Instead, at the other end of the spectrum (i.e. very high WVTRs), degradation and moisture diffusion will be limited by that of occurring through the device (through the electrodes and layers) leading to saturation of the curve which we found to be roughly 3% of relative decrease in PCE a day. We applied the Hills function (Equation (3)) that relates the velocity of one phenomenon (PCE degradation) to the concentration of an external agent (in this case moisture)[82][83][84]:
DR [%/d] =
DRmax∗WVTRnWVTR50 for the WVTR value when DR is 50% of DRmax, and n is the hill coefficient which controls the sigmoidicity of curve. The constant WVTR50=2.3x10⁻² g m-2 d-1 indicates the WVTR of an encapsulation barrier needed to protect a PSC from moisture and slow down the degradation speed by at least half compare with unencapsulated PSCs. With the phenomenological relation between degradation rates of perovskite solar cells as a function of the WVTR of the barrier/sealant systems utilized for their protection we extracted from our systematic investigations, one is able to gauge the influence of the latter on the former. For example, starting from the non-encapsulated case (WVTR ~ 102 g m-2 d-1 in Table 1) an improvement by three orders of magnitude of the WVTR (eg. WVTR=0.1 g m-2 d-1 for PET barrier with an additional 15 nm of protective Al [17]) would reduce degradation rates by 39%. Instead, a barrier/sealant improvement (WVTR) from 10-1 to 10-3 g m-2 d -1 would lead to a much greater reduction of 82% in degradation rates of PCE, lowering it down to 0.54 % d-1. A factor of 100-1000 (very low WVTRs between 10-5 to 10-6 g m-2 d-1) would then pull-down solar cell degradation rates by a factor of 45 to 138 (PDR from 0.07 to 0.02 % d-1). Therefore, to reduce the DR of PSC and retain about 80% of its initial PCE per at least 3 year is recommended either a barrier/sealant system with a WVTR of or below 10-6 g m-2 d-1 or using more stable perovskite and transport layers as well as lower intrinsic moisture during fabrication. Low WTVR values (i.e <10-6) will have a low impact in DR compare with the high cost of fabrication. These trends can be useful for developers of encapsulation barriers, materials scientists and device engineers on how to direct efforts to improve intrinsic stability of PSCs together with the cost to performance ratio of barriers to find the most effective solution for encapsulation of solar cells in terms of both cost and photovoltaic performance over time. Nevertheless, it is worth to mention as well that this trend between DR and WVTR might be different when acting at other encapsulation setups (i.e. lateral sealings), PSC architecture (i.e PSC with p-i-n structure), test condition with high temperatures or even high humidities, and mainly different barrier structures. Furthermore, the future studies may be focus to test both encapsulation barriers and PSC in high stress tests including ISOS-D-3 damp heat test (T=85 ºC and RH=85%), or outdoor conditions.
3. Conclusions
We evaluated polyethylene-terephthalate (PET), flexible ultra-high permeation barrier film (UHPBF), and rigid glass as encapsulation barriers for perovskite solar cells. The performance of flexible ultra-high permeation barrier film (UHPBF) strongly depends on barrier orientation, manipulation and storage. The UHPBF must be kept in an inert atmosphere (N2 or Argon) or dried before their application because barriers absorb water and oxygen which can be released into devices when they are encapsulated and operated. Also, barriers must adhere ensuring a homogeneous coverage of resin/adhesive for example by using a non-stick film when applying pressure to do so uniformly upon lamination. By doing so, the onset of barrier defects (i.e. pinholes and cracks) can be minimized. The addition of an SiOxCyHz layer increased the adhesion UHPBF/sealant when applied on calcium test samples which reduced the interface diffusion and improved the WVTR of barrier/sealant system from 5.7 x10⁻³ to 8.2x10⁻⁴ g m-2 d-1. The encapsulated samples with the UHPBF with SiOxCyHz or UHPBF -S showed a drastically improved WVTR compared to those encapsulated with PET (i.e 4.4x10⁻¹ g m-2 d-1) and were closer to those with glass (i.e 1.9x10⁻⁴ g m-2 d-1) but being flexible, light-weight, and compatible with R2R lamination processes. Additionally, barriers were also tested in the encapsulation of perovskite solar cells (PSC). The PSC encapsulated with PET lost the 36% of initial PCE after 696h but fell drastically to 0 in the next 150h. The optimal UHPBF-S retained 77% of initial PCE after 840h. As a comparison, that encapsulated with glass retained 91% of its PCE after 840h only 14% higher than UHPBF-S. We were able to extract an empirical mathematical relationship between the permeation rate of barriers (WVTR) and the degradation rate (DR) of perovskite solar cells based on the results obtained by electrical calcium test and shelf-life test, respectively. The DR falls exponentially when the WVTR of the encapsulation barrier/sealant
for large area electronic devices and to those developing rigid and flexible solar cells as well as to the development of new encapsulation barriers and sealant systems. Nevertheless, we consider that different encapsulation setups (i.e lateral sealing), PSC architecture (i.e inverted p-i-n structure, or the use of robust materials), barrier structures (new developments), and the test condition (i.e different temperatures and humidities) may affect the relationship between DR of encapsulated PSC and WVTR of barriers. Thus, the future works will be focus on test both barriers and PSC at several critical conditions such as high temperatures and high humidities, to determinate if the DR/WVTR trend depends mainly of the external environmental terms, or if it is controlled by the internal causes such as traps, ion migration, and/or interface instability.
4. Experimental details
Calcium test samples: Figure 1.a shows the schematic design of devices implemented for both optical and electrical calcium tests (Ca-Test). The top view shows five calcium sensors (grey rectangle), each placed between two ITO electrodes (light blue rectangle), and the barrier (size and position) under test (purple dash line). The cross-section view presents the layer-by-layer design of the calcium test devices. First, the glass/ITO substrate (Kintec, 8Ω sq-1) with area 2.5x2.5 cm2 was patterned by wet etching (HBr solution at 100 ºC by 10 min) and cleaned sequentially in an ultrasonic bath with acetone, ethanol and 2-propanol, each for 10 min. Then, samples were transferred to a metal evaporator and 250 nm thick 1.0 x 0.15 cm2 stripes of calcium (Sigma Aldrich, 99.9%) were evaporated at pressures in a range from 5x10⁻⁵ to 1x10⁻⁶ mbar. The barriers were dried beforehand at 80ºC in an N2 environment (glove box) for 6 hours to remove any moisture. To ensure a minimum distance of 5 mm from Ca-sensor to barrier edge in all directions, the barriers were cut to a 2.0x2.4 cm2 size. Finally, the barrier was pressed over the sample with an anti-stick polytetrafluoroethylene (PTFE) rectangular slab which allowed to apply the barrier to the substrate via UV-VIS curable resin (Ossila E131) uniformly. Tested barriers are shown in Figure 1.b: Melinex ST506 PET film (175
µm), glass microslide (1.1 mm) and ultra-high permeation barrier system provided by the Fraunhofer Institutes FEP, ISC and IVV within the Fraunhofer POLO® alliance. The encapsulation was carried out inside the glovebox and the resin was applied on the multiple oxide/ORMOCER stack of ultra-high permeation barrier. In case of PET and glass, there was no preferential side for resin application.
Ultra-high permeation barrier films: The ultra-high permeation barrier films (UHPBF) were prepared as reported previously [28,58]. The structure of the first tested barrier [28] (labelled as UHPBF-R), was PET (Melinex 401 CW; 75 µm)/ZTO (zinc-tin-oxide Zn2SnO4, 180 nm)/ORMOCER® (organic-inorganic hybrid polymer [59], 1 µm)/ZTO(180 nm). A second barrier structure was tested (labelled as UHPBF-S). That structure was based on a DuPont OPTFINE PQA1 polyethylene naphthalate (PEN) film which has lower surface roughness and less defects compared to Melinex 401. Furthermore, the UHPBF-S stack included more than two ZTO layers (but lower layer thickness), and the addition of a silicon plasma polymer (SiOxCyHz) top layer which improved the barrier-resin adhesion: PEN(125 µm)/ZTO(50 nm)/ORMOCER(1 µm)/ZTO(50 nm)/ORMOCER(1 µm)/ZTO(50 nm)/SiOxCyHz(50 nm). The SiOxCyHz layer was deposited in a dual magnetron PECVD configuration (Ti-Targets, 2 x 900 x 120 mm) at 10 kW total plasma power in an HMDSO/Oxygen atmosphere with an HMDSO to Oxygen ratio of 1:2 leading to an amorphous polymer coating with a chemical composition similar to PDMS. More details on that process can be found in [58]. The scanning electron microscopy (SEM) of both UHPBF-R and UHPBF-R barrier are shown in Figure 1.c and Figure 1.d.
Barrier characterization: The performance of the sealant/barrier was investigated utilizing the calcium test configuration of Figure 1.a. The WVTR and OTR can be extracted from calcium tests; however, for a calcium test carried out in ambient environment, the effect of oxygen in the degradation
molecules interact with calcium atoms producing CaO and Ca(OH)2 compounds[52,60]. The WVTR was calculated utilizing both optical and electrical measurements. The electrical Ca-Test was made with a two-wire setup using an ohmmeter with an error of ±1.0% of the reading. The ohmmeter reading represented the sum of calcium sensor and ITO electrodes resistance; thus, to eliminate the contribution of the ITO and its contact resistance, the resistance values were normalized to that of the pristine calcium strip only which was calculated using the experimental value of ρ equal to 8.95x10 -8 m[28,52]. In case of optical Ca-test, the image (photographs) of the Ca sensors were captured by a 16MP CCD camera with a backside illumination CMOS sensor, focal length of 4.3 mm and focal aperture of f/1.9. The color pictures were converted to black and white and filtered with a 9-pixel window to avoid noise and shadows using the MatLab® Image Processing Toolbox. The white pixels represented the area covered with calcium and the black ones the empty space, or encapsulation defects including pinholes, cracks and trapped gas. Image processing measured the area of calcium sensor in pixels; therefore, to quantify the calcium area reduction was necessary to define a proportionality constant between pixel and mm2 which was calculated experimentally, and its value was ~8.3 x10-4 pixels per mm2. Additionally, before any measurement, a sample with chromium strip (instead of calcium) was used as reference. The optical calcium test also enables to identify and monitor degradation paths and mechanisms.
The results of optical (chance in area including deposition defects) and electrical (change in conductance) ca-test were plotted in function of time, and the resulting curves were fitted with the quick fit tool of Origin® from OriginLab Company. Fitting was performed on the linear part of the curve and the calculated slope corresponded to the terms d(A) dt⁄ or d(1/R) dt⁄ of respective Equations (4) and Equation (5) [52] respectively.
WVTR
O= −2 (
MH2O MCa)
δd Ao d(A) dt (4)WVTR
E= −2 (
MH2O MCa) δρ(l b
⁄ )
d(1 R⁄ ) dt (5)where δ, ρ, d, A0, l and b are the density, resistivity, thickness, initial area, initial length and initial width of calcium, and MH2Oand MCa are the molecular weights of water and calcium. The error of fitting permitted to stablish a range of WVTR which are showed in Table 1.
Perovskite solar cell fabrication: All solvents and reagents, if not specified, were purchased from Sigma Aldrich and used as received. The evaluated PSC had the n-i-p planar structure (Glass/ITO/SnO2/CH3NH3PbI3/Spiro-OMeTAD/Au) presented in Figure 1b. The fabrication started with the pattering of the Glass/ITO (Kintec, 8Ω sq-1) as mentioned in Section 2.1. The SnO
2 electron transport and compact blocking layer (SnCl2:2H2O 0.1M in ethanol) was deposited on glass/ITO substrate by two steps spin-coating process (1500 rpm for 30 s, and 2500 rpm for 30 s) followed by an annealing at 150ºC for 1 hour in air. Then, the perovskite (CH3NH3PbI3) solution compounded by PbI2(TCI, 99.99%):MAI with 1:1 molar ratio and dissolved in DMF:DMSO (9:1, v:v), to obtain a final concentration of 1.4 M, was spin coated on the SnO2 layer using the solvent engineering method as reported in [61]. Briefly, the CH3NH3PbI3 was deposited in a two steps spin coating deposition consisting of 1000 rpm for 10 seconds, followed by 5000 rpm for 45 seconds. Once 35 seconds of spin remained, 0.7 mL of diethyl ether solvent were dropped on the rotating substrate to obtain a transparent perovskite films that became black after annealing at 50ºC for 2 minutes and 100ºC for 10 minutes. Next, the Spiro-OMeTAD hole transport layer (Borum New Material technology Ltd, 73.5 mg/mL in chlorobenzene) doped with TBP (26.7 µL/mL), LiTFSI (16.6 µL /mL), and cobalt(III) complex (7.2 µL/mL) was spin coated on perovskite film at 2000 rpm for 20 seconds. Finally, the gold (Au) back electrode was thermally evaporated at a pressure below 10−6 mbar. In the evaporation, a shadow mask was used allowing the appropriate patterning of devices and leading the fabrication of 8 different devices per substrate each with a 0.1 cm2 area (see Figure 1.b). The PSCs were
traces in CH3NH3PbI3. Thus, the PSCs were encapsulated using an epoxy resin (Pacer Technology, SY-QS) as sealant. This sealant is a Bisphenol-A based bicomponent (AB) resin which was previously used in PSC encapsulation showing chemical stability[62].
Perovskite solar cell characterization: The photovoltaic parameters of the solar cell (Power conversion efficiency - PCE, Current density - Jsc, Open-circuit voltage Voc, and Fill Factor - FF) were measured with a Keithley 2420 source meter under standard test conditions (STC): 1 sun illumination (AM1.5G Class A ABET solar simulator (1000 W m-2) calibrated with an EKO MS-602 Pyranometer) at room temperature (25ºC). Measurement started with voltage step, scan speed and delay time of 20 mV, 1 s, and 200 ms respectively. The shelf life test was used to monitor the time evolution of photovoltaic parameter of PSC. Shelf life tests for PSC has been established by the ISOS-D-1. The PSCs must be kept in dark (no light source) at ambient temperature and relative humidity (RH)[63] between measurements. Here, the shelf life test (T=25 ºC and RH=35%) was carried out for 840h.
Acknowledgements
This project has received funding from the Departamento del Huila’s Scholarship Program No. 677 from Huila, Colombia, from the European Union’s Horizon 2020 research and innovation programme under grant agreement No 763989 APOLO, and from the Italian Space Agency (ASI) project, PEROSKY-Perovskite and other printable materials for energy application in space (no. 2018-1-R.0). Disclaimer: the article reflects the views of the authors and the funding agencies are not responsible for any use that may be made of the information that it contains. We thank the Fraunhofer Institutes FEP, ISC and IVV for providing the different ultra-high permeation barriers which were fabricated within the Fraunhofer POLO® alliance. We thank Matteo Gasbarri, Alessandro Palma, Luca La
Notte, Fabio Matteocci, Emanuele Calabro, Aldo Di Carlo, Andrea Reale and Francesca Brunetti for useful discussions.
References
[1] W. Zhang, G. E. Eperon, H. J. Snaith, Nat. Energy 2016, 1, 16048. [2] Y.-S. Tyan, J. Photonics Energy 2011, 1, 011009.
[3] C. J. Brabec, Sol. Energy Mater. Sol. Cells 2004, 83, 273. [4] K. Fukuda, T. Someya, Adv. Mater. 2017, 29.
[5] V. Zardetto, T. M. Brown, A. Reale, A. Di Carlo, J. Polym. Sci. Part B Polym. Phys. 2011, 49, 638.
[6] F. Brunetti, A. Operamolla, S. Castro-Hermosa, G. Lucarelli, V. Manca, G. Farinola, T. M. Brown, Adv. Funct. Mater. 2019.
[7] S. Castro-Hermosa, J. Dagar, A. Marsella, T. M. Brown, IEEE Electron Device Lett. 2017, 38, 1278.
[8] J. M. Burst, W. L. Rance, D. M. Meysing, C. A. Wolden, W. K. Metzger, S. M. Garner, P. Cimo, T. M. Barnes, T. A. Gessert, M. O. Reese, 2014 IEEE 40th Photovolt. Spec. Conf. PVSC 2014 2014, 1589.
[9] M. Stoppa, A. Chiolerio, Sensors 2014, 14, 11957.
[10] National Renewable Enery Laboratory, Perovskite efficiency chart. NREL 2018.
[11] J. Dagar, S. Castro-Hermosa, G. Lucarelli, F. Cacialli, T. M. Brown, Nano Energy 2018, 49, 290.
[12] F. De Rossi, T. Pontecorvo, T. M. Brown, Appl. Energy 2015, 156, 413.
[13] G. Lucarelli, F. Di Giacomo, V. Zardetto, M. Creatore, T. M. Brown, Nano Res. 2017, 10, 1.
[14] J. Dagar, S. Castro-Hermosa, M. Gasbarri, A. L. Palma, L. Cina, F. Matteocci, E. Calabrò, A. Di Carlo, T. M. Brown, Nano Res. 2018, 11, 2669.
[16] W. Wu, Nanoscale 2017, 9, 7342.
[17] S. Castro-Hermosa, S. K. Yadav, L. Vesce, A. Guidobaldi, A. Reale, A. Di Carlo, T. M. Brown, J. Phys. D. Appl. Phys. 2017, 50, 033001.
[18] D. Yu, Y. Q. Yang, Z. Chen, Y. Tao, Y. F. Liu, Opt. Commun. 2016, 362, 43.
[19] R. Grover, R. Srivastava, M. N. Kamalasanan, D. S. Mehta, RSC Adv. 2014, 4, 10808.
[20] F. Matteocci, L. Cinà, E. Lamanna, S. Cacovich, G. Divitini, P. A. Midgley, C. Ducati, A. Di Carlo, Nano Energy 2016, 30, 162.
[21] N. Aristidou, I. Sanchez-Molina, T. Chotchuangchutchaval, M. Brown, L. Martinez, T. Rath, S. A. Haque, Angew. Chemie - Int. Ed. 2015, 54, 8208.
[22] M. Jørgensen, K. Norrman, S. A. Gevorgyan, T. Tromholt, B. Andreasen, F. C. Krebs, Adv. Mater. 2012, 24, 580.
[23] S. Cros, R. de Bettignies, S. Berson, S. Bailly, P. Maisse, N. Lemaitre, S. Guillerez, Sol. Energy Mater. Sol. Cells 2011, 95, S65.
[24] H. C. Weerasinghe, Y. Dkhissi, A. D. Scully, R. A. Caruso, Y.-B. Cheng, Nano Energy 2015, 18, 118.
[25] J. A. Hauch, P. Schilinsky, S. A. Choulis, S. Rajoelson, C. J. Brabec, Appl. Phys. Lett. 2008, 93, 103306.
[26] F. De Rossi, G. Mincuzzi, F. Di Giacomo, J. Fahlteich, S. Amberg-Schwab, K. Noller, T. M. Brown, Energy Technol. 2016, 4, 1455.
[27] M. Hösel, R. R. Søndergaard, M. Jørgensen, F. C. Krebs, Adv. Eng. Mater. 2013, 15, 1068. [28] G. Nisato, H. Klumbies, J. Fahlteich, L. Müller-Meskamp, P. van de Weijer, P. Bouten, C.
Czeremuszkin, M. R. Wertheimer, Thin Solid Films 2006, 511–512, 349.
[30] A. Morlier, S. Cros, J.-P. Garandet, N. Alberola, Sol. Energy Mater. Sol. Cells 2013, 115, 93.
[31] L. La Notte, G. Polino, P. Verzola, L. Salamandra, F. Brunetti, T. M. Brown, A. Di Carlo, A. Reale, Surf. Coatings Technol. 2014, 255, 69.
[32] T. M. Brown, F. De Rossi, F. Di Giacomo, G. Mincuzzi, V. Zardetto, A. Reale, A. Di Carlo, J. Mater. Chem. A 2014, 2, 10788.
[33] J. Jean, A. Wang, V. Bulović, Org. Electron. physics, Mater. Appl. 2016, 31, 120.
[34] P. F. Carcia, R. S. McLean, M. H. Reilly, M. D. Groner, S. M. George, Appl. Phys. Lett. 2006, 89, 031915.
[35] J. A. Bertrand, S. M. George, J. Vac. Sci. Technol. A Vacuum, Surfaces, Film. 2013, 31, 01A122.
[36] Y. Il Lee, N. J. Jeon, B. J. Kim, H. Shim, T. Y. Yang, S. Il Seok, J. Seo, S. G. Im, Adv. Energy Mater. 2018, 8, 1.
[37] K. Yamashita, T. Mori, T. Mizutani, J. Phys. D. Appl. Phys. 2001, 34, 740.
[38] E. Langereis, M. Creatore, S. B. S. Heil, M. C. M. van de Sanden, W. M. M. Kessels, Appl. Phys. Lett. 2006, 89, 081915.
[39] P. A. Premkumar, S. A. Starostin, M. Creatore, H. de Vries, R. M. J. Paffen, P. M. Koenraad, M. C. M. van de Sanden, Plasma Process. Polym. 2010, 7, 635.
[40] X. Dong, X. Fang, M. Lv, B. Lin, S. Zhang, J. Ding, N. Yuan, J. Mater. Chem. A 2015, 3, 5360.
[41] E. Y. Choi, J. Kim, S. Lim, E. Han, A. W. Y. Ho-Baillie, N. Park, Sol. Energy Mater. Sol. Cells 2018, 188, 37.
[42] H. Klumbies, M. Karl, M. Hermenau, R. Rösch, M. Seeland, H. Hoppe, L. Müller-Meskamp, K. Leo, Sol. Energy Mater. Sol. Cells 2014, 120, 685.
[43] S. Schubert, H. Klumbies, L. Müller-Meskamp, K. Leo, Rev. Sci. Instrum. 2011, 82. [44] G. L. Graff, R. E. Williford, P. E. Burrows, J. Appl. Phys. 2004, 96, 1840.
[45] J. S. Lewis, M. S. Weaver, IEEE J. Sel. Top. Quantum Electron. 2004, 10, 45.
[46] G. Tong, Z. Jia, J. Chang, In 2018 IEEE International Symposium on Circuits and Systems (ISCAS); IEEE, 2018; pp. 1–5.
[47] M. D. J. Auch, O. K. Soo, G. Ewald, C. Soo-Jin, Thin Solid Films 2002, 417, 47. [48] J. Lewis, Mater. Today 2006, 9, 38.
[49] J. Fahlteich, S. Mogck, T. Wanski, N. Schiller, S. Amberg-schwab, U. Weber, O. Miesbauer, K. Noller, C. Boeffel, Soc. Vac. Coaters 57th Tech. Conf. Proc. 2014, 36.
[50] D. A. Nissen, Oxid. Met. 1977, 11, 241.
[51] B. van der Schoot, P. Bergveld, Sensors and Actuators 1988, 13, 251.
[52] R. Paetzold, A. Winnacker, D. Henseler, V. Cesari, K. Heuser, Rev. Sci. Instrum. 2003, 74, 5147.
[53] G. Nisato, P. . C. P. Bouten, P. J. Slikkerveer, W. D. Bennett, G. L. Graff, N. Rutherford, L. Wiese, In Proceedings Asia Display/IDW ’01; 2001; p. 1435.
[54] S. Hergert, M. Linkor, M. Korny, N. Fruehauf, J. Soc. Inf. Disp. 2007, 15, 421.
[55] S. Cros, S. Guillerez, R. de Bettignies, N. Lemaître, S. Bailly, P. Maisse, Reliab. Photovolt. Cells, Modul. Components, Syst. 2008, 7048, 70480U.
[56] M. Hermenau, S. Schubert, H. Klumbies, J. Fahlteich, L. Müller-Meskamp, K. Leo, M. Riede, In Solar Energy Materials and Solar Cells; 2012; Vol. 97, pp. 102–108.
532, 44.
[59] K. H. Haas, Adv. Eng. Mater. 2000, 2, 571.
[60] P. O. Nilsson, G. Forssell, Phys. Rev. B 1977, 16, 3352.
[61] N. Ahn, D.-Y. Y. Son, I.-H. H. Jang, S. M. Kang, M. Choi, N.-G. G. Park, J. Am. Chem. Soc.
2015, 137, 8696.
[62] Q. Dong, F. Liu, M. K. Wong, H. W. Tam, A. B. Djurišić, A. Ng, C. Surya, W. K. Chan, A. M. C. Ng, ChemSusChem 2016, 9, 2518.
[63] M. O. Reese, S. A. Gevorgyan, M. Jørgensen, E. Bundgaard, S. R. Kurtz, D. S. Ginley, D. C. Olson, M. T. Lloyd, P. Morvillo, E. A. Katz, A. Elschner, O. Haillant, T. R. Currier, V. Shrotriya, M. Hermenau, M. Riede, K. R. Kirov, G. Trimmel, T. Rath, O. Inganäs, F. Zhang, M. Andersson, K. Tvingstedt, M. Lira-Cantu, D. Laird, C. McGuiness, S. (Jimmy) Gowrisanker, M. Pannone, M. Xiao, J. Hauch, R. Steim, D. M. DeLongchamp, R. Rösch, H. Hoppe, N. Espinosa, A. Urbina, G. Yaman-Uzunoglu, J.-B. Bonekamp, A. J. J. M. van Breemen, C. Girotto, E. Voroshazi, F. C. Krebs, Sol. Energy Mater. Sol. Cells 2011, 95, 1253.
[64] International Organization for Standardization, ISO 15106-3: Plastics - Film and sheeting - Determination of water vapour transmission rate - Part 3: Electrolytic detection sensor method; 1st ed.; 2003.
[65] British Standards Institution, Method for Determining the Permeability to Water Vapor of Flexible Sheet Materials Used for Packaging (BSI - BS 3177 ) 1959, 22.
[66] N. Aristidou, C. Eames, M. S. Islam, S. A. Haque, J. Mater. Chem. A 2017, 5, 25469.
[67] D. Bryant, N. Aristidou, S. Pont, I. Sanchez-Molina, T. Chotchunangatchaval, S. Wheeler, J. R. Durrant, S. A. Haque, Energy Environ. Sci. 2016, 9, 1655.
[68] N. N. Shlenskaya, N. A. Belich, M. Grätzel, E. A. Goodilin, A. B. Tarasov, J. Mater. Chem. A
[69] W. Nie, J.-C. Blancon, A. J. Neukirch, K. Appavoo, H. Tsai, M. Chhowalla, M. A. Alam, M. Y. Sfeir, C. Katan, J. Even, S. Tretiak, J. J. Crochet, G. Gupta, A. D. Mohite, Nat. Commun.
2016, 7, 11574.
[70] G. Divitini, S. Cacovich, F. Matteocci, L. Cinà, A. Di Carlo, C. Ducati, Nat. Energy 2016, 1, 15012.
[71] Y. Han, S. Meyer, Y. Dkhissi, K. Weber, J. M. Pringle, U. Bach, L. Spiccia, Y.-B. Cheng, J. Mater. Chem. A 2015, 3, 8139.
[72] J. A. Christians, P. A. Miranda Herrera, P. V. Kamat, J. Am. Chem. Soc. 2015, 137, 1530. [73] J. M. Frost, K. T. Butler, F. Brivio, C. H. Hendon, M. van Schilfgaarde, A. Walsh, Nano Lett.
2014, 14, 2584.
[74] G. Niu, X. Guo, L. Wang, J. Mater. Chem. A 2015, 2, Advance.
[75] J. P. Correa Baena, L. Steier, W. Tress, M. Saliba, S. Neutzner, T. Matsui, F. Giordano, T. J. Jacobsson, A. R. Srimath Kandada, S. M. Zakeeruddin, A. Petrozza, A. Abate, M. K. Nazeeruddin, M. Grätzel, A. Hagfeldt, Energy Environ. Sci. 2015, 8, 2928.
[76] N. Ahn, K. Kwak, M. S. Jang, H. Yoon, B. Yang, J. K. Lee, P. V. Pikhitsa, J. Byun, M. Choi, B. Y. Lee, J. K. Lee, P. V. Pikhitsa, J. Byun, M. Choi, Nat. Commun. 2016, 7, 1.
[77] A. Guerrero, J. You, C. Aranda, Y. S. Kang, G. Garcia-Belmonte, H. Zhou, J. Bisquert, Y. Yang, ACS Nano 2016, 10, 218.
[78] D. B. Khadka, Y. Shirai, M. Yanagida, K. Miyano, J. Mater. Chem. C 2018, 6, 162.
[79] Z. Ahmad, M. A. Najeeb, R. A. Shakoor, A. Alashraf, S. A. Al-Muhtaseb, A. Soliman, M. K. Nazeeruddin, Sci. Rep. 2017, 7, 15406.
[82] J. N. Weiss, FASEB J. 1997, 11, 835.
[83] S. Goutelle, M. Maurin, F. Rougier, X. Barbaut, L. Bourguignon, M. Ducher, P. Maire, Fundam. Clin. Pharmacol. 2008, 22, 633.