Student: Dr.ssa Valentina LUCAROTTI
Supervisors: Prof. Marcel KUNTZ
Prof. Pierdomenico PERATA
Doctorate Course: Molecular Biotechnology
Proteomic analysis of cold stressed
Arabidopsis thaliana chloroplasts
Laboratory: Dipartimento di biologia delle piante agrarie
Tutor: Prof. Amedeo ALPI
Abstract
Low temperature is one of the major abiotic stresses limiting the productivity and the geographical distribution of many species. The effect of cold acclimatization is evident at chloroplast level because one of the main target of damages causes by low temperatures is the photosynthetic apparatus. For this reason our aim is to analyze the change in level of expression of chloroplast proteins during stress. 13-days old plants were acclimatized at 4°C for 1 week and treated at -10°C for 12 h and then recovered for 24 h. Freezing treatment produced stress phenotypes of rolling leaves, decrease in pigment content. At low temperature wild-type plants exhibited symptoms of severe oxidative stress: lipid peroxidation, chlorophyll bleaching, and photoinhibition. In acclimatated plants, which accumulate over twice as much zeaxanthin as the control, these symptoms were significantly ameliorated.
The changes of total proteins in chloroplasts were examined using two-dimensional electrophoresis. Among 200 protein spots reproducibly detected on each gel, we found up- and down-regulated spots. Mass spectrometry analysis allowed the identification of 30 differentially expressed proteins, including well know cold-responsive proteins. Several proteins showed enhanced degradation during freezing stress, especially the photosynthetic proteins such as Rubisco activase (RcbA) and Rubisco large subunit (RcbL) of which 4 fragments were detected. The identified proteins are involved in several processes: photosynthesis, RNA processing, protein translation and processing, metabolism of carbon, nitrogen end energy. These proteins might work cooperatively to reach an homeostatic equilibrium to overcome stress conditions.
INDEX
Chapter 1 Introduction Section 1- Plants and Cold stress
1.1 Plants responses at low temperatures 1
1.2 Low temperature and photosynthesis 5
1.3 Cold sensing and signalling 10
1.4 Arabidopsis thaliana and cold stress 11
Section 2- Chloroplasts 1.5 Chloroplasts 17
1.6 Chloroplasts isolation 19
• Critical parameters 22
Section 3- Arabidopsis thaliana as a model organism for plant proteome research 1.7 Proteomics 24
1.8 Proteomic strategies in the post-genomic era 25
1.9 Organelle proteomic – focus on chloroplasts 27
AIM OF RESEARCH 31
Chapter 2 Materials and Methods 2.1 Plant material and stress treatment 32
2.2 Chlorophyll fluorescence 34
2.3 Pigment analysis 34
2.4 Peroxidation level 35
2.5 Chloroplasts isolation 35
• Ferricyanide photoreduction 37
• SDS-PAGE analysis 39
2.6 Proteins extraction and quantification 39
2.7 Two-dimensional electrophoresis 39
2.8 Silver staining 40
2.9 Coomassie staining 42
2.10 Computer analysis 43
2.11 Protein identification by MALDI-TOF and nLC-ESI-MS/MS 43 2.12 GO enrichment 47
2.13 Total RNA extraction and real time PCR 48
Chapter 3- Results and Discussion 3.1 A developed method for extracting total chloroplast proteins 50
3.2 Acclimation of whole plants to low temperature: pigments and photosynthetic characteristics 52 3.3 Proteomics results: proteins differential expression 62
Chapter 4- Conclusion 4.1 How to reach a new equilibrium under cold stress? 77
4.2 Future prospective • Could adaptation to altitude affect Arabidopsis thaliana stress tolerance? 81 References 82
Chapter 1 Introduction
Section 1- Plants and Cold stress
1.1 Plants responses at low temperatures
Low temperature severely affects plant growth and development, and limits crop distribution and yield. This adverse environmental condition is particularly important in temperate regions where significant temperature changes are frequent during the transition between warm and cold seasons (1).
Species adapted to cold environments by natural selection have evolved a number of physiological and morphological means to improve survival during extended cold periods. Typically, these species – herbs, grasses and ground shrubs – are of short stature, have a low leaf surface area and a high root⁄ shoot ratio. Their growth habit takes full advantage of any heat emitted from the ground during the day and minimises night chilling, since air temperature is maintained most effectively near the soil surface.
Low temperature leads to cellular dehydration, during ice formation (2). The effect of ice inside plant cells is devastating. Freeze-tolerant plants have several strategies to reduce the probability of this occurring, even when air temperature drops below zero, including maintaining high intracellular solute concentrations and encouraging ice nucleation outside the cells (2). These plants also commonly exhibit xerophytic adaptations to survive the reduced water availability within the plant and the soil. Temperatures of −5°C can kill an unhardened winter wheat plant even though it has the genetic capacity to acclimatize, harden and acquire tolerance of freezing down to −20°C. The cold-hardening mechanisms conferring freeze tolerance have been described and include changes in lipid composition, increases in
active-oxygen-scavenging enzymes (3), anthocyanin accumulation and altered growth morphology (4).
Many crops cultivated in temperate climates (e.g. maize, tomato, cucumber and mango) come from tropical and subtropical evolutionary backgrounds. These species apparently lack the genetic information to be or become freeze or even chill tolerant. These thermophilic crops thus offer the opportunity to study the effects of chilling on photosynthesis relatively undisguised by the gamut of protective and other acclimatory responses observed in chilling tolerant species (5).
Occasional short chilling episodes within a generally clement temperature environment are typical in many temperate regions where thermophilic crops are grown (e.g. maize in the Midwest USA). This is different to the suboptimum temperatures (e.g. <18°C) that persist for much of the growing season when warm-climate crops are planted at the low-temperature margins of their geographical range (e.g. maize in northern Europe). The underlying effects of these two chilling circumstances differ substantially. There are reports that chilling can disrupt essentially all major components of photosynthesis including thylakoid electron transport, the carbon reduction cycle and control of stomatal conductance (6, 7). One of the important challenges to research in this field is identifying the primary effects within this highly interactive and regulated system that actually underlie the in vivo disorder. For example, stomatal closure following a chill could be a direct low temperature effect on guard cell function or an indirect response to a rising internal leaf CO2 concentration (ci) caused by a
chill-induced loss of Rubisco activity (8).
Studying the effects of chilling in the dark on subsequent photosynthesis is important partly because plants in natural and agricultural habitats generally experience the lowest temperatures at night. At a specific low
temperature, the effects of concurrent light are typically greater and therefore are likely to mask those induced by chilling alone. Consequently, at a particular low temperature, there are substantial differences between plants chilled in the light and in the dark in both the scale of the inhibition of photosynthesis and the primary mechanisms involved (9).
Cold-adapted plants tend to be slow growing, have the C3 mode of photosynthesis and store sugars in underground tissues. Plants well adapted to cold environments have evolved an efficient respiration system, which allows them to rapidly mobilise stored reserves during the short growing season.
The timing of developmental and physiological responses to environmental stress is under strict genetic control. In fact, the process of cold acclimation is very complex and involves extensive physiological and biochemical changes (10;11). While some of these changes are implicated in the stability of subcellular structures, essentially membranes (12) and cytoskeleton, others are directed to control the synthesis of pigments to protect from photoxidative stress (13-17), enzymes to reduce oxidative stress (18, 19), and compatible solutes to protect from osmotic changes. In addition, during cold acclimation there is an increase in the levels of cryoprotective proteins, and antifreezing proteins. Most of these alterations are regulated by low temperature through changes in gene expression. In this regard, whole transcriptome analyses in Arabidopsis have shown that around 1000 genes are regulated by low temperature (20). Many early cold-regulated genes encode transcription factors or proteins involved in transcription (21), which suggests that the process of cold acclimation is subjected to a complex transcriptional regulation and involves multiple regulatory pathways (22). Furthermore, it is worthy to mention that an important number of genes that are regulated by low temperature are also regulated by other abiotic stresses
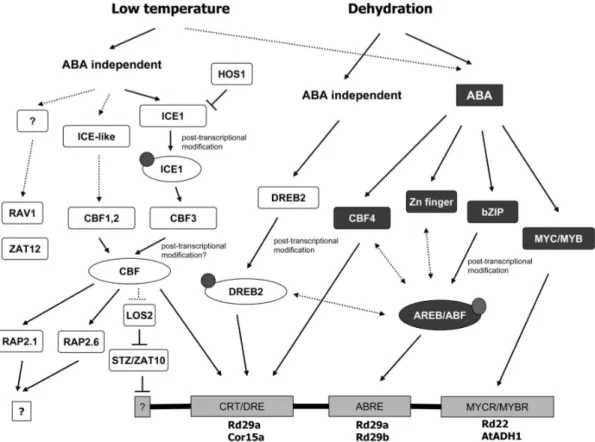
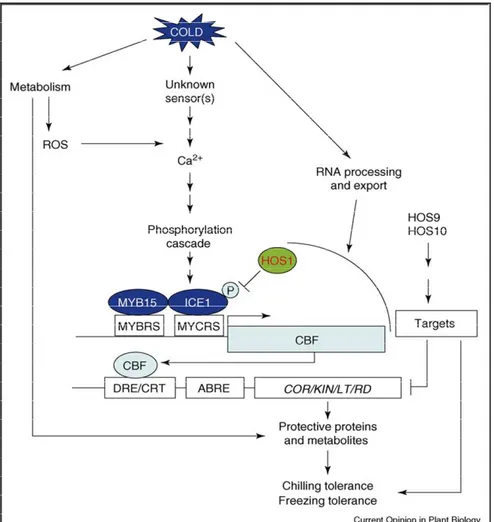
such as dehydration and high salt, indicating that plant responses to different abiotic stresses are related and share common signalling pathways (Fig.1).
Figure 1. Transcriptional cascades of low temperature and dehydration signal transduction. ABA-dependent transcriptional factors are shaded, while ABA
independent factors are not. Small circles indicate posttranscriptional modification, such as phosphorylation. Transcription factor binding sites are represented as rectangles at the bottom of the figure, with the representative promoters listed below. Dotted lines indicate possible regulation. Double arrow lines indicate possible cross talk (Zhanget al., 2004 (23)).
Understanding the molecular mechanisms controlling cold acclimation, therefore, should provide essential information on how plants co-ordinately
integrate responses to different unfavourable environmental conditions to develop and reproduce correctly, and has the biotechnological potential to generate molecular tools to improve crop tolerance to abiotic stresses.
A major step toward the understanding of how gene expression is regulated during cold acclimation was the identification in Arabidopsis of a small family of three transcriptional activators known as C-repeat-binding factors (CBFs)/dehydration-responsive element-binding factors 1 (DREB1s) (24–25). These factors bind to the low temperature responsive DNA regulatory element termed C-repeat (CRT)/dehydration response element (DRE) (26), which is present in the promoters of many cold-inducible genes (27). Constitutive over expression of any CBF gene in Arabidopsis induces the accumulation of mRNAs from genes that contain the CRT/DRE motif in their promoters, the CBF regulon, as well as an increase in freezing tolerance (28). The CBFs have been described to regulate the expression of around 12% of the Arabidopsis cold-inducible genes (27), which gives an idea about their relevance in cold acclimation.
1.2 Low temperature and photosynthesis
Photosynthesis is the principal mechanism to transform light energy into biochemical usable chemical potential energy (ATP) and redox potential energy (NADPH) by components of the chloroplast thylakoid membrane (Fig. 2). NADPH and ATP are then transferred to consumed in metabolic electron sinks. The main metabolic sink occurs via reduction of CO2 through
the Calvin cycle to form carbohydrates within the stroma of the chloroplast. The primary reactions of photosynthesis are temperature independent and catalysed by photosystem (PS) I and II to trap light energy and transform it into redox potential energy through a combination of extremely rapid (10-15
separation. In contrast, much slower (10−3 − 10°s), temperature-dependent,
biochemical reactions convert this redox potential energy to stable reducing power in the form of NADPH. Thereby a trans-thylakoid ∆pH is established by the oxygen-evolving complex and the plastoquinone (PQ) pool of the intersystem electron transport, to synthesize ATP by chemiosmosis. ATP and NADPH are then consumed in the reduction of CO2 to triose phosphate
and the continuous regeneration of ribulose-1,5-bisphosphate (RuBP) on a time scale of seconds. The energy represented by the fixed carbon is then used through maintenance respiration to maintain cellular homeostasis and growth respiration for cell division and expansion on a time scale of minutes to hours. Although C reduction is considered photosynthetic, it is also important to appreciate that N and S assimilation are also photosynthetic because of their dependence on photosynthetically generated redox and chemical potential energy (29).
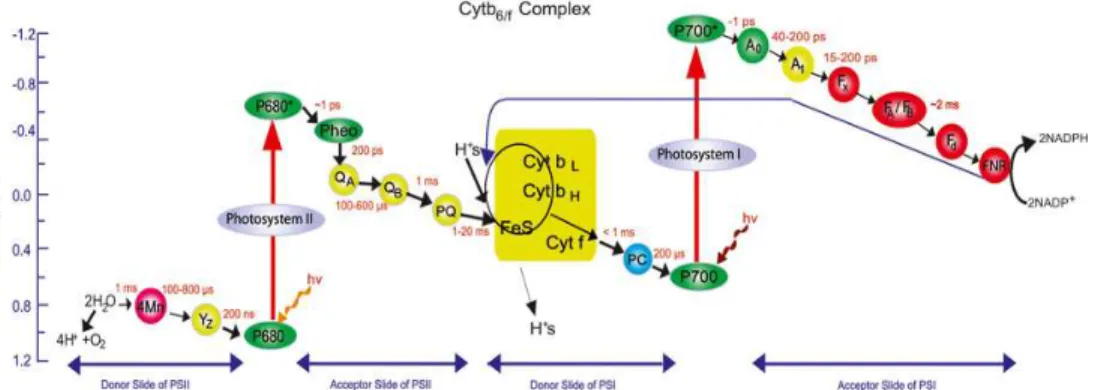
Figure 2. The Z-scheme of oxygenic photosynthesis for electron transfer from water to oxidized nicotinamide adenine dinucleotidephosphate (NADP). The
symbols are: Mn = Mn cluster; Y = Tyrosine –161 on D1 protein; P680 = a pair of Chls the reaction center (RC) Chls of PS II having one of its absorption bands at 680 nm, P680* = excited P680; Pheo = the primary electron acceptor of PS II; QA = the primary plastoquinone electron acceptor of PS II; QB = secondary plastoquinone electron acceptor of PS II; PQ = plastoquinone pool; FeS = Rieske iron sulfur protein; Cyt f = cytochrome f; CytbII = high potential cytochrome b6; PC = plastocyanin;
primary electron acceptor of PS I a Chl monomer; A1 = secondary electron acceptor of PS I vitamin K; Fx FA and FB = three different iron sulfur centers; Fd = ferredoxin; and FNR = ferredoxin NADP reductase. Approximate estimated times = various steps are also noted on the figure. A circular path in the Cyt b6f complex symbolizes the existence of a Q-cycle; and a dotted line from the electron acceptor side of PS I to the PQ/ Cyt b6f region symbolizes the existence of a cyclic flow around PS I under certain conditions. Reproduced from Govindjee (2004)(30).
Optimum plant performance requires a balance in the rates of source versus sink processes. Low temperatures, however, can inhibit electron transport by increasing membrane viscosity through alterations in the biophysical properties of thylakoid lipids and decrease the rates of the enzymatic reactions involved in C, N and S reduction more strongly than they inhibit photophysical and photochemical processes involved in light absorption, energy transfer and transformation (31). On the whole plant level, low temperatures affect the rate of growth through an inhibition of the uptake of water and nutrients. As a consequence of low temperatures, the rates of photochemical processes need to adjust to the decreased metabolic sink capacity for the consumption of photosynthates. Thus, the effects of low temperatures on photosynthesis and carbon gain eventually determine productivity, growth and distribution of plants on various spatial scales (32). Cold tolerant species are able to acclimate to low temperatures. Mechanisms to overcome the constraints of short-term and long-term exposure to low temperature include changes in energy absorption and photochemical transformation through energy partitioning and concomitant changes in chloroplastic carbon metabolism, allocation and partitioning. Thus, the mechanisms involved in photosynthetic acclimation to low temperature range from modifications within the thylakoid membrane system, affecting photosynthetic electron transport (33) to post-transcriptional activation and
increased expression of enzymes for sucrose synthesis, changed expression of Calvin cycle enzymes, changes in leaf protein content, as well as the signals that trigger these processes (34).
Photosynthesis reflects not only short-term responses of the chloroplast to the prevailing environmental conditions but also the physiological and developmental state of the whole organism. Cellular redox poise is one element in the puzzle which is linked, in the short term at least, to the accumulation of sugars at low temperatures. However, long-term acclimation of photosynthesis to low temperature in many plants also depends on development under low temperature. Plants adjust photosynthesis to low temperatures using key cellular features, source activity as reflected by the redox state of the chloroplast and sink strength as reflected in metabolic activity. In addition to the roles of source activity and sink strength in energy conversion, both also act as global sensors of environmental change and provide the signalling required to alter specific gene expression. Large-scale genetic analysis now reveals a complex, new picture of signalling pathways involved in the process of low temperature acclimation of photosynthesis and the network that actually controls photosynthesis (Fig. 3).
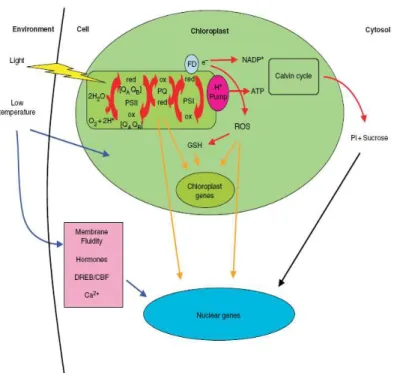
Figure 3. Integration and regulation of the photosynthetic process. The primary
light reactions occur within the thylakoid membrane system, where the water splitting complex, PSII, PSI and the electron transport chain are located. Energy trapped by PSII is used to transfer electrons derived from the water-splitting process via the electron-transport chain by the mobile electron carrier plastoquinone (PQ). After a second light reaction in PSI the electrons can be accepted by NADPH via ferredoxin (FD). Protons are pumped across the thylakoid membrane to generate ATP. The main metabolic sink for NADPH and ATP is the Calvin cycle. Its sink strength depends on the rate of export of triose-P to the cytosol and subsequent export to sink tissues. Under increased excitation pressure, e.g. because of low temperature and/or high light intensities, electrons from PSI can also be transported to oxygen, thereby generating reactive oxygen species (ROS). ROS can be detoxified via gluthathione, causing changes in the ratio of the oxidized to the reduced state of gluthathione (GSH). Red arrows indicate the flow of energy, blue arrows indicate low temperature induced signals, orange arrows indicate redox-mediated signals and black arrows indicate sugar signals. From Ensminger et al., 2006 (35).
1.3 Cold sensing and signalling
The identity of the plant sensors of low temperature remains as yet unknown (36). Multiple primary sensors may be involved, with each perceiving a specific aspect of the stress, and each involved in a distinct branch of the cold signalling pathway (37). Potential sensors include Ca2+
influx channels, two-component histidine kinase and receptors associated with G-proteins. Certain cytoskeletal components (microtubules and actin filaments) participate in cold sensing by modulating the activity of Ca2+
channels following membrane rigidification(38).Because of its basic role in separating the internal from the external environment, the plasma membrane has been considered as a site for the perception of temperature change, with its rigidification representing an early response. The phosphorylation of proteins, together with the suppression of protein phosphatase activity, may also provide a means for the plant to sense low temperatures. Thus, a variety of signalling pathways is triggered, including secondary messengers, ROS, Ca2+-dependent protein kinases (CDPKs),
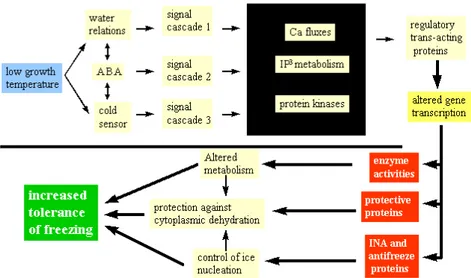
mitogen-activated protein kinase (MAPK) cascades and the activation of transcription factors (TFs), all of which promote the production of cold-responsive proteins. These productscan be divided into two distinct groups: regulatory proteinscontrolling the transduction of the cold stress signal, and proteins functionally involved in the tolerance response. Thelatter include LEA (late embryogenesis abundant) proteins, antifreeze proteins, mRNA-binding proteins, chaperones, detoxification enzymes, proteinase inhibitors, transporters, lipid-transfer proteins and enzymes required for osmoprotectant biosynthesis (39). An outline of these processes is given in Fig. 4.
Figure 4. A model of the signalling processes in plants leading to acclimation and increased freezing tolerance. (From www.cepceb.ucr.edu)
1.4 Arabidopsis thaliana and cold stress
Interest in profiling the system response to low temperature has revealed thousands of transcript (40) and hundreds of metabolite (41) changes. These profiling technologies have also been used to characterize regulatory pathways. Global transcript profiling analyses indicate that >10% of genes in the Arabidopsis genome are regulated during cold acclimation (42). Experiments with Affymetrix ATH1 arrays led to 504 genes that are defined as a cold standard set of cold responsive genes (COS), 302 of which are up regulated and 212 down regulated, based on the criterion that up- (or down) regulation occurred in cold-treated plants grown on both soil and defined agar medium. The large number of genes identified raises the question of exactly which genes are most central to increasing freezing tolerance (43). Forward and reverse genetic approaches have defined some of the key regulatory components of cold acclimation. A set of genes that encode a
acclimation (44). These COR genes have also been named low-temperature-induced (LTI), cold acclimation-specific (CAS), cold-low-temperature-induced (Kin), and responsive to drought (RD) genes. Most of cold-responsive genes are regulated through C-repeat/dehydration-responsive elements (CRT/DRE) and abscisic acid-responsive element (ABRE) by a family of Arabidopsis transcription factors known as either C-repeat-binding factors (CBF1, CBF2 and CBF3) or dehydration responsive element-binding factors and by basic leucine zippers (bZIPs) (SGBF1). The ICE1–CBF transcriptional cascade has an important role in cold acclimation in diverse plant species (Fig. 5, from Chinnusamy et al., 2007 (45)). ICE1 (inducer of CBF expression 1) encodes a MYC-like bHLH transcriptional activator that, in addition to the direct induction of CBF expression, also appears to regulate negatively MYB15, an upstream negative regulator of CBFs. ICE1 protein level and activity are regulated post-translationally by HOS1-mediated ubiquitination and proteolysis. Several CBF-independent regulons that are critical for cold acclimation have also been identified. Metabolism, and RNA processing and export, affect cold tolerance via cold signaling and/or cold-responsive gene expression (Fig. 4). The constitutive HOS9 and HOS10 regulons have a role in the negative regulation of CBF-target genes.
Figure 5. Schematic illustration of the cold response network in Arabidopsis.
Abbreviations: CBF, C-repeat binding factor (an AP2-type transcription factor); CRT, C-repeat elements; DRE, dehydration-responsive elements; HOS1, high expression of osmotically responsive genes1 (a RING finger ubiquitin E3 ligase); ICE1, inducer of CBF expression 1 (a MYC-type bHLH transcription factor); MYBRS, MYB transcription factor recognition sequence; P, phosphorylation; MYCRS, MYC recognition sequence (Chinnusamy et al., 2007).
CBFs/DREBs are themselves transiently induced by low temperature (46). Therefore, there is a transcriptional cascade that leads to the expression of the RD/COR/KIN/LTI/CAS genes under cold stress (Fig. 6, from Xin et al.,
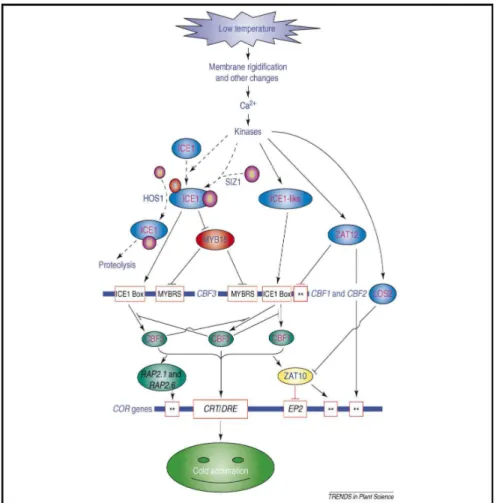
Figure 6. Diagram of cold-responsive transcriptional network in Arabidopsis.
Plants probably sense low temperatures through membrane rigidification and/or other cellular changes, which might induce a calcium signature and activate protein kinases necessary for cold acclimation. Constitutively expressed ICE1 is activated by cold stress through sumoylation and phosphorylation. Cold stress induces sumoylation of ICE1 at K393, which is critical for ICE1-activation of transcription of CBFs and repression of MYB15. CBFs regulate the expression of COR genes that confer freezing tolerance. The expression of CBFs is negatively regulated by MYB15 and ZAT12. HOS1 mediates the ubiquitination and proteosomal degradation of ICE1 and, thus, negatively regulates CBF regulons. CBFs might cross-regulate the each other’s transcription. CBFs induce the expression of ZAT10 (=STZ), which might downregulate the expression of COR genes. Cold-upregulated LOS2
represses the transcription of ZAT10. ZAT10 and ZAT12 are two C2H2 zinc finger transcription factors.
Broken arrows indicate post-translational regulation; solid arrows indicate activation, whereas lines ending with a bar show negative regulation; the two stars (**) indicate unknown cis-elements. Abbreviations: CBF, C-repeat binding factor (an AP2-type transcription factor); CRT, C-repeat elements; DRE, dehydration-responsive elements; HOS1, high expression of osmotically dehydration-responsive genes1 (a RING finger ubiquitin E3 ligase); ICE1, inducer of CBF expression 1 (a MYC-type bHLH transcription factor); LOS2, low expression of osmotically responsive genes 2 (a bifunctional enolase with transcriptional repression activity); MYB, myeloblastosis; MYBRS, MYB transcription factor recognition sequence; SIZ1, SAP and MiZ1 (a SUMO E3 ligase); P, phosphorylation; S, SUMO (small ubiquitin-related modifier); U, ubiquitin. (Xin et al., 2007)
CBF-dependent roles in freezing tolerance have also been demonstrated for LOS1, a translational elongation factor 2 gene, which is involved in protein synthesis in the cold (47), and for LOS4, a DEAD box RNA helicase that is essential for mRNA export (48). By a reverse genetic approaches was identified a gene defined by sfr2 (sensitive to freezing 2) mutation, which was reported to encode a β-glucosidase isozyme (49). The SFR2 gene is constitutively expressed in most aerial tissues and does not change in response to cold acclimation or other stress treatments. By reverse genetic approaches was also identified ESK1 (Eskimo 1), a member of a large family of plant specific genes whose function is unknown (43). ESK1 encodes a protein of 487 amino acids and predicted molecular mass of 56.7 kDa, working as negative regulator of cold acclimation. Mutations in this gene lead to freezing tolerance through mechanisms that are largely independent of those mediated by CBF2 overexpression (44) or expression of the COS gene set. Bioinformatic analysis indicates that the ESK1 protein has a
conserved domain of unknown function (DUF) 231 (Pfam PF03005) from amino acid 310 to 483, which is only found in proteins from higher plants. In addition to transcriptional regulation, gene expression is regulated post-transcriptionally at pre-mRNA processing, mRNA stability, export from nucleus and translation steps (50). Regulation of gene expression at the post-transcriptional level is mainly achieved either directly, by RNA-binding proteins (RBPs), or indirectly, whereby RBPs modulate the function of other regulatory factors (45). Several conserved RNA-binding motifs have been discovered, such as the RNA recognition motif (RRM), glycine-rich motif, arginine-rich motif, RGG box, zinc finger motif, and double-stranded RNA-binding motif (51). RRMs occupy the N-terminal half of RBPs, and are involved in the recognition and binding of target RNA molecules. The C-terminal half of RBPs contains other auxiliary domains that may be involved in interaction with other protein factors. Proteins that contain RRMs in the N-terminal half and a glycine-rich region in the C-terminal half (glycine-rich RNA binding proteins; GRPs) have been described in plants including maize, Arabidopsis thaliana, tobacco, barley, Brasicca, leafy spurge and alfalfa. The Arabidopsis genome encodes 196 RRM-containing proteins, of which 27 are classified as glycine-rich and small RRM-containing proteins (52). Recently, Kim et al. (2007) have shown that an Arabidopsis GRP, designated atRZ-1a and GRP2 (accession number At4g13850), affect seed germination and seedling growth at low temperatures, and plays a role in the enhancement of freezing tolerance of Arabidopsis plants, demonstrating a role of GRP in plant responses to environmental stress. Proteome analysis revealed that expression of several mitochondrial-encoded genes was modulated by GRP2 indicating also that GRP2 exerts its function by modulating the expression and activity of various classes of genes. GRP2 contains an N-terminal RRMs and a C-terminal glycine-rich region.
However, it has different structural features compared with GRP4 and atRZ-1a, in that GRP2 has much longer glycine-rich domain than GRP4 and does not have the CCHC-type zinc fingers found in atRZ-1a.
Section 2- Chloroplasts
1.5 Chloroplasts
Plastids are semiautonomous organelles that are ubiquitously found in plant cells. They are derived from an endosymbiotic event and are thought to have evolved from an ancient photosynthetic prokaryote related to present-day cyanobacteria. Following endosymbiosis, the plastid genome has been reduced to 100 genes, mainly coding for housekeeping functions (translation and transcription of the plastid genome) and proteins required for primary photosynthetic reactions.
The most conspicuous plastid type is the chloroplast, found in leaves and carrying out photosynthesis as its main function is also responsible for various essential functions, including lipid metabolism, starch and amino acid biosynthesis. Photosynthesis is an integrated biological process involving the coordinated functioning of chloroplast compartments: (a) the thylakoids, a highly organized internal membrane network formed of flat compressed and connected vesicles where solar energy is collected and converted into stored chemical energy (ATP and NADPH) while oxygen, a by-product of the reactions, is evolved; (b) the stroma, an amorphous background rich in soluble proteins that is the site for the reduction of carbon dioxide and its conversion into carbohydrates; and (c) the envelope, a pair of membranes surrounding the chloroplast, that tightly controls the metabolic dialogue between the organelle and the rest of the cell (Fig. 7). Among chloroplast subfractions, the envelope membranes are rather unique
as they represent a minor chloroplast component (1–2% of the chloroplast proteins) playing a key role in chloroplast metabolism and biogenesis. However, the details of chloroplast functions and the compartmentation of chloroplast proteins are not yet fully understood, and there is a major interest in analyzing them for understanding regulation of whole plant cell metabolism. Furthermore, more proteins, new pathways, and their precise localization remain to be discovered. The green colour of plants is due to the green colour of chlorophyll, all of which is localized to the thylakoid membrane. A granum is a stack of adjacent thylakoids. The stroma is the space between the inner envelope membrane and the thylakoids.
1.6 Chloroplasts isolation
Only structurally intact chloroplasts with a functional envelope exhibit metabolic activities comparable to those of the original tissue. Therefore, the most important objectives that should guide the isolation of chloroplasts from any plant species are their morphological and physiological integrity. The use of intact chloroplasts is absolutely essential for studying processes like light-driven CO2 fixation, CO2-dependent O2 evolution, in organello RNA
and protein synthesis, import of cytoplasmically made polypeptides into chloroplasts, or incorporation of labeled precursors to dissect the enzymatic machinery involved in fatty acid biosynthesis and fatty acid incorporation into chloroplast lipids.
In some plant species, like spinach or pea, highly active chloroplasts can be obtained by following several simple rules:
Use of young, fresh plant material free from starch
• Distruption of cells in a buffered medium containing sorbitol
• Rapid separation of chloroplasts from the remaining cell constituents Unfortunately, the standard protocols for chloroplast isolation typically result in poor chloroplast yields, or chloroplasts of low activity, when applied to Arabidopsis. The reason for this apparent sensitivity of Arabidopsis chloroplasts are not known. However, concerted efforts of several research groups to optimize established chloroplast isolation protocols for Arabidopsis have been done. Nowadays we have two reliable procedures: chloroplast isolation by homogenization of leaf tissue and chloroplast isolation from protoplasts.
The development of methods for the isolation of functional chloroplasts from plants tissue has been a long process, starting from the late 1930s when
Robert Hill prepared chloroplast fractions shown to evolve oxygen in presence of an artificial oxidant, but not in presence of CO2 (53, 54). For a
long time, chloroplast preparation was restricted to the isolation of green particles capable of supporting the Hill reaction. Arnon and coworkers (55) demonstrated CO2-dependent O2 evolution by chloroplast suspension, but
the rates were considerably lower than those of intact leaves. It is only from when the importance of maintaining chloroplast integrity throughout the preparation process was fully recognized that preparations showing high rates of CO2-dependent O2 evolution were obtained (56). Indeed, the use of
sugar as an osmoticum (as suggested initially by Hill) together with a very brief homogenization and rapid separation allowed the isolation of chloroplasts with an intact envelope (57). Furthermore, Jensen and Bassham (1966, (58)) significantly improved the medium, especially the buffer, used for chloroplast isolation. Thus, in the late 1960s, methods to prepare physiologically active chloroplasts by differential centrifugation were widely available. Indeed, such chloroplast preparations paved the way for an extensive characterization of metabolite transport and mechanisms across the envelope membranes, studies of protein, and lipid synthesis. For instance, Heber and Santarius (1970, (59)) demonstrated the exchange of ATP and ADP across the chloroplast envelope, whereas Heldt and Sauer (1971, (60)) identified the inner chloroplast envelope membrane as the site of specific metabolite transport. We should also mention the parallel development of non-aqueous methods to prepare chloroplast, with the aim of analyzing the intracellular distribution of water-soluble molecules between plastid and cytosol. Despite their interest, the development of such procedures remained limited.
Although physiologically and structurally intact, chloroplasts fractions prepared by differential centrifugation were actually rather crude because
they contained pieces derived from other cell compartments (e.g., nuclei and mitochondria) and even a few intact cells. The next step was therefore to remove these contaminants and prepare chloroplasts as pure as possible. Sucrose was first used for preparing gradients to separate chloroplasts, and than various media like colloidal silica-derived compounds were developed. Unfortunately, chloroplasts purified on sucrose gradients were unable to perform CO2-dependent oxygen evolution, mostly because the envelope
became leaky during the course of the centrifugation at a high sucrose concentration. Actually, the development of Percoll (61) was the major breakthrough that allowed the development of procedures to prepare intact and almost pure chloroplasts from a wide variety of tissues. Percoll-purified chloroplasts were able to achieve CO2-dependent oxygen evolution almost
identical to that of the leaves (on a chlorophyll basis). Percoll has several key characteristics for the purification of physiologically active organelles:
1. Percoll is made of silica beads of various size and is highly suitable to the
formation of density gradients that can be self generated upon high-speed centrifugation;
2. Percoll is an inert compound, its low osmolarity does not change that of
the assay medium, even at a high concentration, thus maintaining the integrity of the organelle structure during density gradient centrifugation;
3. in Percoll, silica beads are coated with polyvinylpyrrolidone, which helps
to remove harmful phenolic compounds from the medium.
In the early 1990s, a large number of publications were produced with the term “Percoll” as a key word. Screening the literature with the term “Percoll” now identifies >5000 published papers, thus demonstrating the importance of a powerful method – density gradient centrifugation – applicable to any cells or organelles in suspension for which differences in size or buoyant density exist.
Several protocols are described to perform Percoll purification of pure and intact chloroplast from spinach or pea leaves. More recently, and since the complete sequencing of the Arabidopsis genome (The AGI, 2000), Arabidopsis
thaliana has become a widely used model organism, supplanting spinach and pea as model plants. Somerville et al. (1981, (62)) had already described the isolation of photosynthetically active protoplasts and chloroplasts from
Arabidopsis thaliana. However, the method did not rely on the use of Percoll-gradients to isolate the organelles. More recently, Kunst (1998, (63)) and Ferro et al. (2003, (64)) published alternative methods for the Percoll-based purification of chloroplasts from Arabidopsis.
Critical parameters
There are several essential points to take into consideration for successful purification of chloroplasts, for instance, the leaf material, medium composition are critical steps of protocol.
The best results are obtained when starting from 3- to 4-week-old Arabidopsis rosette leaves. Leaves that are too old are enriched in phenolic compounds that are known to affect integrity of the chloroplasts. It however appears that starting from younger leaves improves yield, purity and integrity of the purified organelles.
The quantity of leaves is also critical. No intact chloroplasts can be recovered when the leaf starting material is <60 g.
The number of starch granules present in chloroplasts is a problem for the preparation of intact chloroplasts: in fact these plastids containing large starch grains will generally be broken during centrifugation. Therefore, prior to the experiment, the plants should be kept for several hours in a dark and cold room (4 °C) to reduce the amount of starch. A good way to proceed is to
place the plants under such condition the day before the extraction (usually at the beginning of the afternoon of the day before).
The tissue must remain cold throughout the protocol to help reduce endogenous protease activities.
The grinding process must be as short as possible. Longer blending improves the yield of recovered chlorophyll, but increases the proportion of broken chloroplasts. The crude chloroplast suspension obtained after homogenization of leaves that are too young, is mainly composed of broken chloroplasts. When leaf material has been homogenized, the homogenate should rapidly be filtered and centrifuged to protect chloroplasts from activities of proteases released after disruption of the cells. Addition of BSA immediately before use of the grinding medium helps to limit the activity of proteases.
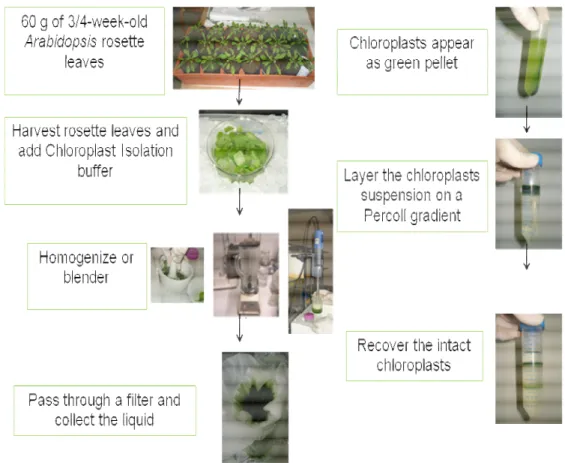
The filtration process should also be rapidly performed. After the grinding process, organelles are released in a crude extract consisting of broken cells, having released some very aggressive compounds (e.g. protease, lipase and phenolic compounds). Storing the organelles for too long in such a homogenate strongly affects their integrity and functioning. Therefore, a short delay between grinding and concentration is expected to improve yield of intact chloroplasts (Fig. 8).
Figure 8. Strategy used to purify intact chloroplasts from Arabidopsis leaves.
Section 3- Arabidopsis thaliana as a model organism for plant proteome research
1.7 Proteomics
Proteomics defines an approach for the systematic identification of all proteins expressed in a cell and is expected to accelerate discoveries in the life sciences. The progress of proteomics and proteomics-related technologies over the last decade is based on two major developments. First, the wealth of genome information paved the way for the large scale analysis of proteins for which amino acid sequences were deposited into databases (Arabidopsis Genome Initiative, 2000). Second, technological improvements
in mass spectrometry, especially the development of soft ionization techniques for peptide analysis, allowed rapid and sensitive protein identification from minute quantities of biological samples (reviewed in Aebersold and Mann, 2003 (65)). Although it is generally accepted that the proteome is dynamic and difficult to define, scientists aim at the most complete identification of the protein complement of a cell or a tissue type under certain, well-defined conditions.
Proteomics provides an excellent opportunity to study the response of plants to environmental stress and to identify stress-responsive proteins.
Proteomics, the comprehensive and quantitative analysis of proteins that are expressed in a given organ, tissue, or cell line, provides unique insights into biological systems that cannot be provided by genomic or transcriptomic approaches. The fast developments in the ‘omics’ area and the combination of different ‘omics’ tools offer great potential for post-genomics to elucidate the genotype-phenotype relationships for both fundamental and applied research. Consequently, large sets of integrative data have been acquired, providing information about proteins and metabolites involved in developmental and environmental responses.
1.8 Proteomic strategies in the post-genomic era
Arabidopsis was the first established model plant worldwide. The comprehensive resources which are available for Arabidopsis, such as the entire genome sequence, a larger collection of natural variants and an ever increasing number of molecular tools, made it the favourable model for post-genomic research. Thus, several fundamental information platforms and databases already exist such as TAIR (http://www.Arabidopsis.org/). The availability of a whole genome sequence in Arabidopsis provides unique opportunities for genome-based systems biology approaches. It enables the
use of post-genomic tools such as proteomics in its full capacity. The introduction of shotgun proteomics enables the high-throughput analysis of large sets of samples along with the identification of several hundreds of proteins within each sample. The latter approach, in conjunction with the constantly increasing availability of genomic sequences, has rapidly become a favourable tool for many researchers. An initiative to assist in the coordination of international proteomics research on Arabidopsis thaliana has been established, leading to the assembly of the largest proteomics resource for a plant model system to date (66). This major proteomics platform, provided by the Multinational Arabidopsis Steering Committee Proteomics, is available on line (MASCP; http://www.masc-proteomics.org/).
In the last few years one of the most active proteomic approaches within the
Arabidopsis research field consisted of profiling isolated cell organelles. They stand for an important organizational level of the plant cell proteome. Proteome analyses so far encompassed virtually all organelles in plant cell including peroxisomes, vacuolar membranes, the plasma membrane, the cell wall, mitochondria, nucleous and nucleolus and different plastid types. Mitochondria and chloroplasts have dominated the field of sub-cellular proteomics and are inevitably the best characterized plant cell organelles at the proteome level. Reasons for this are the numerous dedicated studies that were designed to map the complete protein complement of these two organelles, which has led to the high proteome coverage available to date. Furthermore, excellent sub-organellar compartment characterization has been achieved by proteomic characterization. And finally, several quantitative approaches were taken to analyze the dynamic adaptation of the proteome to changes in environmental conditions. Thus, for these two organelles we have a vague idea how the plant adjusts and controls the
proteome of mitochondria and chloroplast or the whole plant for a selected set of environmental conditions.
Despite the impressive progress in the field of organelles there are several open questions that remain to be addressed and we would like to highlight some of them by taking a closer look at the current status of plastid proteomics.
1.9 Organelle proteomic – focus on chloroplasts
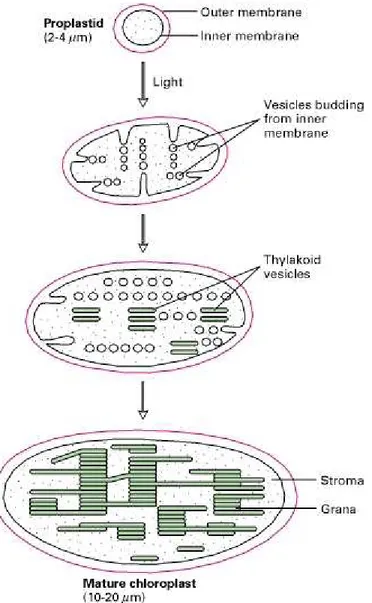
Plastids are indispensable plant cell organelles that performed many essential steps in plant cell metabolism. One of the characteristics is their ability to develop and differentiate into different plastid types, depending on their cellular and tissue environment. All different plastid types originate from undifferentiated plastid precursor organelles termed proplastids, which upon internal and external signals develop into e.g., amyloplasts in storage tissue, chloroplasts in photosynthetic leave tissue (Fig. 9) and chromoplasts in fruits and flower tissues. Less prominent plastid types encompass gerontoplasts, which are specialized aged chloroplasts that play a role in resource allocation, oleoplasts, which are oil storage plastids in e.g. olive, and etioplasts, which are the product of proplastid development in photosynthetic tissue in absence of light. The occurrence of solely undifferentiated proplastid is restricted to meristematic tissues and undifferentiated cells.
Figure 9. Formation of chloroplasts from proplastids. Light-induced budding of
the inner membrane.
Because Arabidopsis does not develop sophisticated storage organs, flowers or fruits and the meristem is restricted to a few cells in the shoot apex, most plastid types are virtually excluded from Arabidopsis proteomics research. In contrast, Arabidopsis has been the organism of choice for the analysis of chloroplasts and is currently the only plant for which a truly comprehensive
known that Arabidopsis chloroplasts are not only important centers metabolic reactions but also that they are important signalling hubs that determine the expression of numerous nuclear encoded genes in retrograde signal cascades.
The predicted size of the combined proteome of all plastid types ranges from 2,000 to 3,500 proteins in Arabidopsis thaliana, representing about 7% to 12% of all predicted protein-encoding genes. However, only about 1,200 proteins are currently recognized as being plastid localized (see the Plant Proteome Database [PPDB] at http://ppdb.tc.cornell.edu). Comparing this experimental plastid proteome data set with the predicted plastid proteome showed that, in particular, plastid proteins involved in signalling and plastid gene expression and RNA metabolism are strongly underrepresented. There are several reasons why a significant percentage of plastid proteins has not yet been recognized:
(1) low abundance in chloroplasts (i.e. their detection is obscured by highly
abundant photosynthetic proteins);
(2) specific expression in a certain plastid type other than chloroplast;
(3) only expressed under very specific conditions (developmental state,
abiotic condition, or biotic challenge); or (4) too few ionizable tryptic peptides (e.g. transmembrane proteins with very short loops and tails or very small or basic proteins).
The early chloroplast proteome analyses were mostly conducted with density gradient isolated organelles. First, suborganellar compartments were mapped e.g. the thylakoid lumen, isolated thylakoid and envelope membranes and later on the chloroplast stroma and entire chloroplasts (reviewed in 67, 68). With the accumulated information from the latter mentioned analyses we now have a large catalogue of proteins that were identified from plastid preparations. Bioinformatics analyses with targeting
prediction tools on this proteins set suggested that the large number of these proteins cannot be predicted. As a matter of fact, with an increasing number of proteins identification, i.e. with increasing sensitivity of the analyses, more and more such proteins were identified that were considered “unexpected” in plastid because of the lack of recognizable targeting information, i.e. transit peptides. For example, Kleffmann and colleagues reported TargetP prediction sensitivities, i.e. rate of correct predictions of all true plastid proteins around 70% instead of 85% as determined by TargetP benchmark (69,70). Zybailov and colleagues identified more than 1325 proteins from isolated plastid, and sorted out 409 of these as putative contaminants (71). Rolland and colleagues established 1323 proteins from highly purified organelles (72). However, some of these proteins may not actually enter the plastid, but rather associate with plastid membranes from the cytosol, such as glycolitic enzymes, and targeting prediction software will miss a certain number of true chloroplast proteins, because plastid transit peptides do not have clear features and are thus difficult to recognize.
AIM OF RESEARCH
The target of this study is to find a protocol to isolate pure and active chloroplasts from Arabidopsis thaliana in order to analyze the impact of stress condition that affected proteins (deletion or overproduction) that can be functionally linked to photosynthesis thus providing information about their role at chloroplast level. The protocol presented here is adapted from previously published protocols and improved with some tricks to optimize yield and purity.
A proteome study based on 2-D gel electrophoresis was performed in order to analyse the freezing stress response of Arabidopsis thaliana chloroplasts. Spot identification of interesting proteins was performed by nLC-ESI-MS/MS analysis. We chose Arabidopsis thaliana as model plant because of its importance for basic research in molecular biology and its capacity of cold acclimation and freezing tolerance. The study was more concerned with freezing tolerance than with cold acclimation, which is the ability to survive long- or short-term exposures at low but non freezing temperatures. Through a comparative analysis of protein patterns, we were interested in monitoring the overall changes in the protein complement after a sub-lethal exposure to -10 ºC in cold acclimated plants and in non acclimated ones. Protein patterns were monitored after re-shifting plants to control conditions for a day, because the interest was to elucidate the later adaptations on the protein level following initial signalling events.
Low temperature is one of the most important factors limiting the growth, development and distribution of plants, adversely affecting the productivity and quality of crop plants. Thus, interest in understanding the molecular basis of freezing tolerance is driven by the desire to understand the mechanisms with which plants have evolved to tolerate environmental stress.
Chapter 2 Materials and Methods
2.1 Plant material and stress treatment
Preliminary analyses were performed in order to set optimal work protocol conditions and plant parameters for following analysis.
We used Arabidopsis thaliana ecotypes Col-0. Seeds were sown in plastic pots filled with a 1:1 mixture of commercial potting mix and fritted clay. Seedlings were grown in a controlled environment chamber at 23°C with a 16/8-h photoperiod and a photosynthetic photon flux density (PPFD) of about 150 µmol photons m-2 sec-1. Plants were irrigated as necessary.
Relative humidity was around 60-70% (Fig. 10). Cross experiments were performed using those parameters:
• Plants age
• Cold acclimation treatment • Freezing temperature
• Time of exposition to each temperature
Each treatment was repeated at least three times. Untreated and stress treated plant samples were collected and used either immediately for analyses or frozen in liquid nitrogen and stored at –80 °C for further use. To evaluate freezing tolerance, plants were divided into two groups. Plants in one group were used to measure freezing tolerance without cold acclimation (NA) and were maintained at 23°C with a 16/8-h photoperiod. Plants in the other group (A) were transferred to a cold-acclimation chamber with exposure at 4°C for 7 d with a 16/8-h photoperiod. Whole plants were used to evaluate freezing tolerance and were placed in a programmable freezer. The temperature of the bath was set to 0°C and programmed to decrease to
the desired temperature with 1°C decrement in 30 min and maintained at that temperature for a determined time.
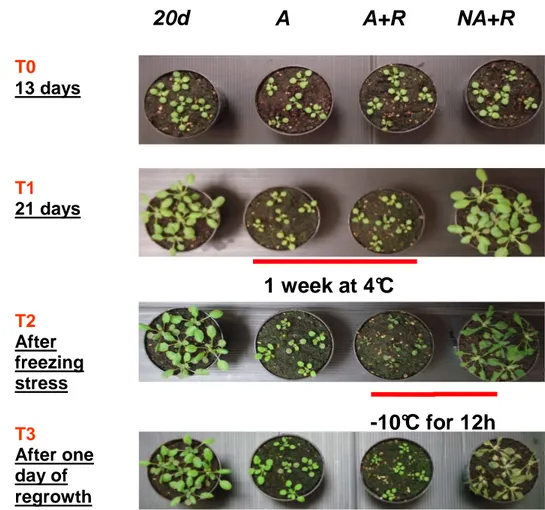
Figure 10. A. thaliana cultivated under different temperature. Plant status:
20-days-old Arabidopsis plants (20 d). Half of the plants were harvested and half were submitted to freezing treatment (-10°C for 12h, NA+R, T2) and were shifted back to control condition (T3). 13-days-old Arabidopsis plants (T0) were shifted to cold stress-conditions (A, T1). After a cultivation time of 1 week (4°C) half of the acclimated plants was harvested, and half were submitted to freezing treatment and shifted back to the control condition and then harvested (A+R).
NA+R
T3 After one day of regrowth20d
A
A+R
T0 13 days T1 21 days T2 After freezing stress1 week at 4°C
-10°C for 12h
2.2 Chlorophyll fluorescence
Maximum quantum efficiency of PSII (Fv/Fm) and quantum yield of electron transfer at PSII (ΦPSII), were measured with a PAM 101 fluorimeter
(Walz, Effeltrich, Germany). Fv/Fm, and ΦPSII were calculated in this way:
Fv/Fm = (Fm – Fo)/Fm; ΦPSII = (Fm’ – Fs)/Fm’. Fo is the initial fluorescence under
non actinic light and Fm is the maximum Chl fluorescence from
dark-adapted leaves, after a saturating pulse (in order to reoxidize the primary electron acceptor of PSII). F’m is the maximum Chl fluorescence and Fs the
stationary fluorescence during steady state illumination.
2.3 Pigment analysis
The composition of the pigments is analyzed after extraction with acetone 80% by RP-HPLC following in this case the method of Gilmore and Yamamoto (73): the sample is loaded on a reverse phase column (Spherisorb C18. 7.3 x 300mm) pre-equilibrated with buffer A. The chromatographic run is composed by 3 min flow with 90% Buffer A and 10% Buffer B, followed by a linear gradient to 100% buffer B in 9 min, followed by 3 min with 100% Buffer B and a linear gradient to 100% buffer A in 2 min followed by 4 min of 100 buffer A.
Buffer A Buffer B
• Acetonitrile 86.8% (72 parts) • Methanol 80% (4 parts)
• Methanol 9.6% (8 parts) • Hexane 20% (1 part)
2.4 Peroxidation level
Following the protocol of Vavilin et al., 1998 (74) leaf disks were frozen and reduced to powder with a pestel and the pellet was mixed with 200 µl of sol. buffer ( 175 mM NaCl, 50 mM Tris-HCl pH 8, 0.01% butylated hydrotoluene in ethanol).
Then 200 µl of a solution of 0.5% (w/v) thiobarbituric acid in 20% (w/v) trichloroacetic acid was added, followed by an incubation at 95° C for 25 min. Then, the reaction mixture was centrifuged at maximum speed for 20 min.
The MDA-(TBA) adduct was separated and quantified by HPLC. The analytical column and the HPLC apparatus were similar to those used for pigment analyses. The elution buffer was 65% 50 mM KH2PO4-KOH, pH 7,
and 35% methanol. The time of chromatography was 12 min, with a flow rate of 0.8 mL/min, injected volume of 120 mL, detection at visible light (532 nm). The average retention time of the MDA-(TBA) adduct was 8 min. The levels of MDA were calculated using tetraethoxy-propane (Sigma-Aldrich) as a standard.
2.5 Chloroplasts isolation
The chloroplasts isolation method includes mechanical cell wall and membrane breakage, removal of cell debris and unbroken leaf tissue by filtration, collection of total cell chloroplasts by centrifugation and separation of intact from broken chloroplasts using a Percoll gradient.
In order to obtain a good preparation it is necessary to keep plants in the dark for 14- 16 hours, to avoid the formation of starch in the chloroplasts. Furthermore, it is important that leaves contain as little water as possible and for this reason we should avoid to water plants two days before the preparation.
The whole preparation must be carried out by using tools, reactants and rotors which have been cooled down to 4°C or which have been placed into ice.
- Cut and homogenize leaves in the presence of Grinding Buffer (GB) 1X (about 1 litre every 50 g) with politron. It is important to homogenize briefly, in order to avoid breaking chloroplasts (2-3 times for 10 seconds).
- Seeve the homogenized material through four layers of Miracloth. - Centrifuge 6000g for 30 min,
- Discard the supernatant and gently resuspend the pellet again by using a brush and add 3-5 ml of GB 1X.
- Make a “step-gradient” with Percoll 80% and Percoll 40% into centrifuge tubes (in tubes/pipes for spin- dryer) of 50 ml.
First put the Percoll 80% solution (15 ml) on the bottom of the tube, then gently stratify 15 ml of Percoll 40% without mixing the two solutions. It is possible to put at most 4 ml chloroplasts suspension on each gradient, so two gradients are needed for a 100g sample of leaves.
- Centrifuge for 30 minutes at 3600 rpm in a swinging rotor. In this way intactchloroplasts form a band in the gradient at the interface between 80% and 40% of Percoll layers. At the end it should be possible to observe one pellet on the bottom and a green band (intact chloroplasts) between the two steps of the gradient. In the upper part of the gradient thylakoids can be recovered, but which must be further purified.
- Gently remove the Percoll 40% and suck out intact chloroplasts by using a pipette. Put the solution containing chloroplasts in a tube for SS34 and dilute with two volumes GB 1X.
- Centrifuge at 10000g for 1 minute to recover the chloroplasts which are on the bottom.
- Discard the supernatant and energically resuspend again the chloroplasts by using a pipette in 1 ml of hypotonic buffer. Transfer in eppendorf.
- Vortex and centrifuge at 13000 rpm for 15 minutes.
- At this stage the supernatant contains the proteins of stroma, while the pellet is formed by thylakoids.
- Resuspend again the pellet in 0.5 ml of hypotonic buffer and centrifuge at 13000 rpm for 15 minutes. In this way traces of stromatic proteins can be eliminated from the thylakoid fraction. These thylakoids are resuspended and kept in a buffer which contains 50% of glycerol, 10mM Hepes, 1mM EDTA.
Grinding Buffer (GB) 5X: sorbitol 1.65 M, Hepes 0.25 M, EDTA 10
mM, MgCl2 5 mM, MnCl2 5 mM, brought to pH 8.0 with KOH and
freshly prepared.
Hypotonic buffer: Hepes 10 mM, DTT 5 mM, EDTA 1 mM, brought
to pH 8.0 with KOH.
Percoll solution 100%: dissolve 3 g of PEG 6000 and 1 g of Ficoll 400
in 100 ml of PERCOLL (Sigma, cat P1644) and autoclave. When cool, add 1g of BSA.
Percoll solution 80%: 20 ml of GB 5X + 80 ml of Percoll solution
100% + 200 µl DTT 1M.
Percoll solution 40%: 20 ml of GB 5X + 40 ml of Percoll solution
100% + 40 ml of water + 200 µl DTT 1M.
2.5.1 Estimation of the percent of intact chloroplast • Ferricyanide photoreduction
The principle of the assay is based upon the inability of ferricyanide (an artificial electron acceptor) to cross the chloroplast envelope and react with
the electron transport system within the intact thylakoid membranes. Ferricyanide reduction, as indicated by the decrease in the absorbance at 410 nm, occurs only when ruptured chloroplasts are in the preparation. The percent of intact chloroplasts of the preparation is assessed by comparing the rates of ferricyanide photoreduction with and without osmotic shock of the chloroplasts.
For each of the following reactions, a volume of chloroplasts equivalent to 100 µg chlorophyll is used.
A. Without osmotic shock: mix chloroplasts with 4 ml of 1x CIB. Add 60 µl
of 100 mM ferricyanide (prepared freshly in deionized water, final concentration 1.5 mM).
B. With osmotic shock: mix chloroplasts with 2 ml of water. Incubate for at
least 15 seconds to allow for osmotic shock. Add 2 ml of 2x CIB and 60 µl of 100 mM ferricyanide.
a. Place the tubes in a glass beaker filled with ice water
b. Illuminate with a closely positioned 40 W bulb. Take a 1 ml sample before illumination, and then one every 2 minutes after illumination. Measure the absorbance at 410 nm using a spectrophotometer. Continue illumination for 6 minutes.
c. Photoreduction of ferricyanide results in a decrease of the absorbance at 410 nm. Plot the absorbance at 410 nm versus the time. The rate of decrease in absorbance of each sample is the slope (∆A410/minute) of
the graph. Calculate the slope of each reaction (A and B).
To calculate the percent of intact chloroplast, use the following formula:
• SDS-PAGE analysis
A simple way to estimate the integrity of the purified chloroplasts relies on the use of an SDS-PAGE analysis, following the abundance of the major soluble protein (RbcL or RubisCO) from the stroma and the major thylakoid membrane proteins (LHCPs or Light Harvesting Complex Proteins).
2.6 Proteins extraction and quantification
Soluble proteins were extracted from chloroplasts according to Yang et al. (2007), with some modifications. Chloroplasts were ground in liquid nitrogen and homogenized with 1 mL of extraction buffer (5M urea, 2M thiourea, 40 mM Tris-HCl, 2% CHAPS, 50 mM DTT). The homogenates were centrifuged for 15 min at 15.000 x g. Supernatants were precipitated using TCA (15% v/v) containing 0.007% β-mercaptoethanol in acetone at -20°C for 2 h and then at 4°C for a minimum of 2 h. Samples were centrifuged at 4°C for 15 min at 14.000 x g, supernatant were discarded and pellets were washed twice with ice cold acetone containing 0.007% β-mercaptoethanol. Pellets were dissolved in a rehydration buffer (5M urea, 2M thiourea, 2% CHAPS, 50 mM DTT). Protein quantification was performed using Bradford-based assay kit assay (Bio Rad Hercules, CA), using bovine serum albumin as a standard.
2.7 Two-dimensional electrophoresis
Isoelectric focusing (IEF) of total proteins was performed using 18 cm-long immobilized pH gradient (IPG) strips, pH 3-10 non linear and pH 4-7. The protein sample was mixed with a rehydration buffer, 0.5% IPG buffer (v/v) of respective pH range and 0.002% bromophenol blue to a final volume of 340 µL and loaded onto the IEF strips. Samples were loaded onto IPG strips by passive rehydration. For analytical gels, performed to obtain the
silver-stained protein maps, 100 µg of protein sample was loaded. Instead 1 mg sample was loaded for the preparative gels stained with mass spectrometry (MS) compatible Coomassie brilliant blue (CBB) staining. IEF was carried out at 200V for 3h, 1000V for 1h, 2000V for 1h, 3500V for 1h and 35kVh using Multiphor II system (Amersham Pharmacia Biotech). Before running the second dimension SDS-PAGE, IPG strips were equilibrate twice in an equilibration buffer (6M urea, 30% glycerol (v/v), 50 mM tris-HCl, 2% SDS) for 15 min. The first equilibration was done using 1.2% DTT (w/v) in an equilibration buffer, while in the second equilibration, DTT was replaced by 1.5% iodoacetamide (w/v). SDS-PAGE was performed using 12.5% polyacrylamide gels at 15 °C using a Bio Rad Protean II XI (20 cm x 20 cm) vertical gel electrophoresis chamber. After completion of electrophoresis, gels were fixed and stained. The analytical gels were stained for image analysis with silver nitrate as described by Oakley et al. (1980, (75)). For MS analysis, the preparative gels were stained with CBB according to the manufacturer’s instructions. Three independent biological replicates, each with four technical replicates were run for the analytical gels.
2.8 Silver staining
The silver stain is based on the ammoniacal silver/formaldehyde method of Oakley et al. (1980). This method involves preliminary glutaraldehyde treatment of the slab gel to fix proteins by cross linking. The pre-treatment also adds glutaraldehyde side chains to the proteins, increasing sensitivity since these groups are sites for silver deposition. The method is about 10 times more sensitive than Coomassie blue staining, depending on the protein, even though less protein is loaded. Generally, 50 ng of purified protein gives a highly visible spot. However, some proteins that are detectable with Coomassie do not stain at all with silver. Although very
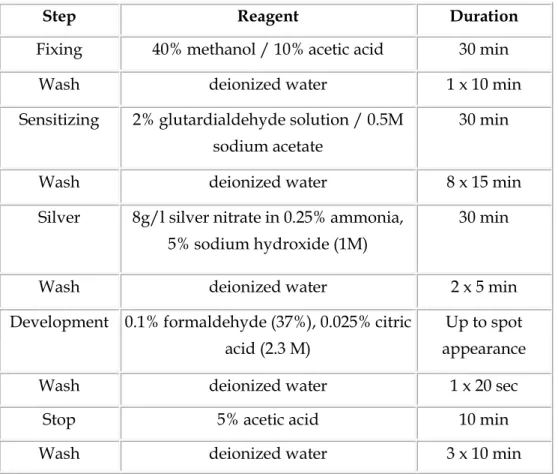
sensitive, this method gives semi-quantitative rather than quantitative results. The linear range for plots of stain density versus ng protein varies from protein to protein with different saturation levels. Even so, silver staining is useful for computerized comparisons because spot values are normalized - expressed as a percentage of all spots combined. Values from duplicate gels are always averaged. This particular method of silver staining is not compatible with mass spectrometry fingerprinting but the patterns match well to a heavily loaded, Coomassie stained duplicate gel. Any spot present on the latter, no matter how faint, is within range for mass spectrometry identification minimal requirement. For silver staining of 2D gels, each 2D gel was soaked in a fixation solution of 40% methanol and 10% acetic acid, in water for 30 min and then washed in water for 10 min, followed by its sensitization in 2 % glutardialdehyde solution for 30 min. After rinsing eight times with water for 15 min, the 2D gel was stained for 30 min in silver nitrate solution. The silver nitrate solution was discarded and then the 2D gel was washed twice with water for 4 min. The 2D gel was developed in a developer solution with intensive shaking. After the desired intensity of staining was achieved, the developer solution was discarded and the reaction stopped in a solution of 5% acetic acid for 10 min (Tab. 1). The silver stained 2D gel was stored in deionized water at 4 °C until analyzed.