Alma Mater Studiorum - Università di Bologna
SCUOLA DI SCIENZE
Dipartimento di Chimica Industriale“Toso Montanari”
Corso di Laurea Magistrale in
Chimica Industriale
Classe LM-71 - Scienze e Tecnologie della Chimica Industriale
Selective photo-oxidation of glucose
Tesi di laurea sperimentale
CANDIDATO
Carlo Recchi
RELATORE
Prof. Fabrizio Cavani
CORRELATORI
Dott. José Antonio Lopez Sanchéz
Dott. Luigi Da Vià
Dott. Thomas Davies
SessioneII
_________________________________________________________________________________________________________________
1
Keywords
Photocatalysis Selective oxidation Glucose Titania2
Acronim list
ACN Acetonitrile
CB electronic conduction band of a semiconductor DAD Diode Array Detector
ESI ElectroSpray Ionization GA Glyceraldehyde
HPLC High Pressure Liquid Chromatography NHE normal hydrogen electrode
OES Optical Emission Spectrometry P25 Titania Degussa
Q-TOF Quadrupole Time Of Flight Mass Spectrometry RID Refractive Index detector
RSD relative standard deviation SPR Surface Plasmon Resonance
TEM Transmission Electron Microscopy UV Ultra Violet wavelength (100-400nm) UV-VIS Ultra Violet-Visible spectroscopy VB electronic valence band of a semiconductor VIS Visible wavelength (400-800nm)
WI wetness impregnation method XRD X-Ray diffractometry
4
Abstract:
Biomass transformation into high-value chemicals has attracted attention according to the “green chemistry” principles. Low price and high availability make biomass one of the most interesting renewable resources as it provides the means to create sustainable alternatives to the oil-derived building blocks of the chemical industry In recent year, the need for alternative environmentally friendly routes to drive chemical reactions has in photocatalytic processes an interesting way to obtain valuable chemicals from various sources using the solar light as energy source. The purpose of this work was to use supported noble metal nanoparticles in the selective photo-oxidation of glucose through using visible light. Glucose was chosen as model molecule because it is the cheapest and the most common monosaccharide. Few studies about glucose photo oxidation have been conducted so far, and reaction mechanism is still not totally explained .
The aim of this work was to systematically analyze and assess the impact of several parameters (eg. catalyst/substrate ratio, reaction time, effect of the solvent and of the light source) on the reaction pathway and to monitor the product distribution in order to draw a general reaction scheme for the photo oxidation of glucose under visible light. This study regards, first of all, the reaction mechanism and the influence of several parameters, such as solvent, light power and composition and substrate concentration. Furthermore, the work focuses on the influence of different noble metal nanoparticles, in particular gold and silver, and on the influence of metal loading as well. The glucose oxidation was monitored through the mass balance and the products selectivity. Reactions were evaluated in terms of glucose conversion, mass balance and selectivities towards the main products, such as arabinose and gluconic acid are.
In conclusion, this study is able to demonstrate that the photo oxidation of glucose under visible light is feasible; the full identification of the main products allows, for the first time, a comprehensive reaction mechanism scheme.
6
Summary:
Keywords ... 1 Acronim list ... 2 Abstract: ... 4 Summary: ... 6 Objective: ... 9 1. Introduction: ... 12 1.1. Biomass: ... 121.1.1. Importance of biomass in industrial chemistry: ... 14
1.1.2. Biochemical and chemical oxidation of biomass: ... 14
1.2. Nanotechnologies and metal nanoparticles: ... 16
1.2.1. Metal nanoparticles: synthesis and immobilization methods ... 17
1.2.2. Wetness impregnation method: ... 17
1.3. Photochemistry and photocatalysis: ... 19
1.3.1. Semiconductors as photocatalysts: ... 19
1.3.2. Titanium (IV) dioxide: ... 21
1.3.3. Surface Plasmon Resonance band on metal nanoparticles: ... 24
1.3.3.1. Gold nanoparticles: ... 28
1.3.3.2. Silver nanoparticles: ... 28
1.4. Photocatalysis for the upgrade of bio-derived molecules:... 30
2. Chemicals and Experimental part: ... 31
2.1. Chemicals: ... 31
2.2. Experimental part: ... 32
2.2.1. Synthesis of catalysts and calcination of titania: ... 32
2.2.2. Reactivity tests: ... 32
2.2.3. HPLC and Q-TOF analyses: ... 35
7
2.3. Synthetic methods: ... 40
2.3.3. Synthesis of gold catalyst: ... 40
2.3.4. Synthesis of silver catalysts: ... 40
2.4. Kinetic tests: ... 41
2.4.3. Effect of a catalyst/substrate ratio: ... 41
2.4.4. Effect of Solvent and lamp power: ... 41
2.4.5. Adsorption of Glucose on catalyst: ... 41
2.5. Photocatalytic tests:... 43
2.5.3. Reactions under visible and UV light: ... 43
2.5.4. Long term reactions: ... 43
2.5.5. Recycling tests: ... 43
3. Results and discussion: ... 44
3.1. Optimization of reactivity tests: catalyst to substrate ratio: ... 44
3.2. Identification of the pathway and the products of reaction: ... 48
3.3. Role of titania: ... 54
3.3.1. Effect of structure: ... 54
3.3.2. Effect of calcination temperature: ... 58
3.4. Effect of the solvent and irradiation power: ... 64
3.5. Effect of metal loading: ... 69
3.6. Effect of different metal nanoparticles: ... 74
3.7. 24h reactions: ... 78 3.8. Recyclability tests: ... 80 3.9. Future Work: ... 81 4. Conclusions: ... 82 5. Appendix: ... 83 Acknowledgements: ... 85 Bibliography:... 86
8
9
Objective:
Photocatalysis is one of the recently fields investigated for the exploitation of biomass. It has attracted great interest according to “green chemistry” principles, because it combines the use of renewable raw materials as biomass and the use of solar light. This new field of catalysis has been limited so far to the studies of few model molecules, such as cellulose cellobiose and glucose, in order achieve a greater understanding on the reaction mechanism and on the role of the catalyst in such reactions.
Titania P25 is one of the most used supports for this kind of catalyst, TiO2 along with Al2O3, are the most widely used supports in photocatalytic processes due to their activity under UV irradiation, their high efficiency and non-toxicity..1,2 Moreover, to improve the catalytic performances of the aforementioned supports, their surface can be decorated with supported metal nanoparticles, and experimental evidence of the increased activity can be found in the literature for alcohols oxidation reactions3,4. This know-how was transferred to the biorefinery philosophy and for the upgrade of biomass into valuable chemicals.
In particular, the purpose of this project was to synthetize supported metal nanoparticles and use them in the selective photo-oxidation of glucose, and the main products expected from this oxidation were gluconic acid, derived from the oxidation of the aldehydic group of C1, and glucaric acid, derived from the further oxidation of the alcoholic group of C6. Arabinose was another product expected by degradation of glucose. These products were expected according to the experimental observations made by Colmenares
et al 5and Chong et al.6, These work represents the state-of-the-art of photo-oxidation of glucose, the reaction mechanism and the influence of several parameters, such as solvent, pH, atmosphere, are not totally explained.
10
c) d)
Figure 1: Structure of reactant (a) and main products expected (b, c, d).
Titania P25 was used as support for its catalytic activity under ultraviolet irradiations, but it can be doped with semiconductors to enhance its absorption under visible region of light spectrum. Doping Enhancement of photo efficiency of titania was done using noble metal nanoparticles for their capacity to act as electron acceptor through the characteristic phenomenon of Surface Plasmonic Resonance (SPR). In fact, they act as “antennas” through their SPR band,2 and then they transfer electrons to the titania thus enhancing the activity of the support. The noble metal nanoparticles present good activity in few photocatalytic reactions as well.7
12
1.
Introduction:
1.1.
Biomass:
Biomass is defined as “any material, excluding fossil fuel, which was a living organism that can be used as a fuel either directly or after a conversion process”.8 Raw plant biomass consists of lignocellulosic material that is mainly made up of three primary fractions: cellulose, hemicellulose and lignin. The main constituent of that is cellulose (C6H10O5)x, a polysaccharide made up of a linear chain D-glucose linked by β-(1,4)-glycosidic bonds to each other, as shown in Figure 2.9 The degree of crystallinity and other peculiarities are influenced by inter and intramolecular hydrogen bonds and this peculiar framework make cellulose insoluble in most organic solvents and resilient to acid and alkali solutions under mild conditions.8,10
Figure 2: Structure of cellulose.11
Hemicellulose (C5H8O4)m, reported in Figure 4, is the second most abundant polymer in biomass, and consists of heterogeneous branched biopolymers contains D-glucopyranose,
D-galactopyranose, D-mannopyranose, L-arabinofuranose and D-xylo-pyranose
monomers (Figure 3).11 this polymer is relatively easy to hydrolyze because of the amorphous, and branched structure (with short lateral chain) which lowers the impermeability to the protons and hydroxyl anions.12
13 Figure 4: Structure of hemicellulose.
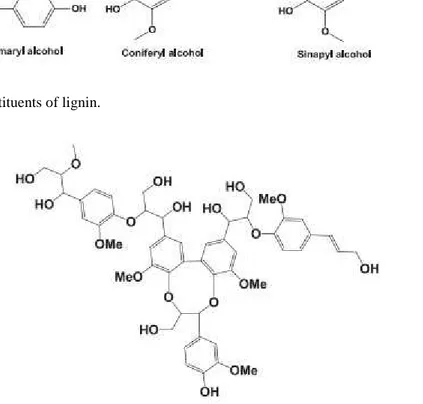
Finally, lignin (Figure 6) is an amorphous heteropolymer network built up of phenyl propane units reported in Figure 5. It is present in plant cell walls and it is responsible of some peculiar plant characteristics as rigidity, impermeability and resistance to microbial attack and oxidative stress.8
Figure 5: basic constituents of lignin.
Figure 6: Example of lignin’s structure.
The ratio between these three components varies according to the type of biomass, tissue type, growth stage and growing conditions of the plant.11
This work is focused on glucose, indicated in Figure 3 as D-Glucopyranose, because it is the most common and cheapest carbohydrate available in nature. It is the main product of the photosynthetic processes and it is one of the biomass building blocks, as reported above. It can be obtained from the hydrolysis of cellulose and hemicellulose, and then it
14
can be easily convertible in valuable chemicals through chemical and biochemical transformations.
1.1.1. Importance of biomass in industrial chemistry:
The chemical industry of the last century was focused on crude oil exploitation, available in high amount and low prices. As fossil raw materials are decreasing, researchers worldwide had to focus their attention on the necessity to switch to renewable resources as feedstock. Because of the uncertain availability of fossil resources and the increasing concerns of the public opinion for the environment, alternative solutions able to mitigate environmental concerns, and the use of bio-compatible resources in the production of
bio-fuels and specialty chemicals should be promoted.13 Different techniques have been
developed to convert biomass into bio-fuels, mainly bio-ethanol that is derived from food crops. Nevertheless, one of the main problems with biofuels is the competition between their production and food demand.14 This issue was solved using second generation feedstock for fuel production. Biomass can be used for add-value chemicals using biorefinery processes.15
The biorefining concept is a way to join the use of bio-compatible resources as raw materials with the use of low environmental impact technologies, embodying the principles of the “green chemistry” and of the “green engineering”. Biorefining has increasingly drawn much attention, due the possibilities of provide a wide range of bio-based products, such as bio-fuels, bio-chemicals and bio-materials. Therefore, green chemistry and green engineering are integrated into the biorefining concept.13
1.1.2. Biochemical and chemical oxidation of biomass:
Biochemical oxidation of biomass and glucose was used since the ancient times. Biofermentation of glucose leads to several product such as succinic acid and gluconic acid, and bioethanol is obtained from batch fermentation of sugars derived from
sugarcane and grain.8 Research on better processes was required because the
fermentative ones had poor energy balance (energy output of the biofuel/energy inputs required during production), and grain-based fuel ethanol production also created a moral dilemma over the use of agricultural crops and/or land for fuel vs. food.8 Furthermore,
15
the biochemical methods still have various disadvantages such as slow reaction rate, low space-time and difficulty in the separation of enzyme from product.16
Several chemical processes have been investigated, especially the catalytic ones run through supported nanoparticles such as palladium, platinum and gold.
Biella et al. 17 reported for the first time the oxidation of glucose on gold sols supported on carbon and found a total selectivity towards gluconic acid. Additionally, a recycling test of the gold catalyst was carried out, and after four runs a 50% decrease in activity was noted, mainly due to leaching.18 At the same time, the presence of fructose was observed during the oxidation of the glucose. The formation of fructose indicates the isomerization of glucose. It is known that by treating monosaccharides with concentrated alkaline solution, the sugars are destroyed, whereas alkaline media with lower pH induce an isomerization reaction of glucose to fructose resulting in an equilibrium mixture of the two sugars.
Temperature also influences reaction kinetic. Caramelisation is an effect observed when temperature reaches 353 K, but over 333 K a slight decrease in selectivity was observed.18
Nowadays, bio-products such as sorbitol, 5-hydroxy-methylfurfural (HMF),19 and
levulinic acid 20are produced in high yields and large scale production volumes through using supported metal nanoparticles catalysts. Nonetheless, the use of harsh reaction conditions and the high energy-demand make several processes uncompetitive, especially for new environment safeguard laws. In recent years industrial chemistry has changed its priority with the diffusion of “green chemistry” and “green technology” principles.21 These principles promote the reduction of impact of chemicals production on human health and environment performing chemical reactions under milder conditions and using greener solvents such as water.
16
1.2.
Nanotechnologies and metal nanoparticles:
From 19th century, interest in the properties of materials in nanometric scale has been increasing.. In this scale, properties of materials are different from individual atoms or bulk materials, and the study of them allowed to create a new field in chemistry.22
Those differences are mainly influenced by the shape and the surface to volume ratio of atoms, instead of the nature of material, and changes in the properties can be obtained from the same starting material.22
Metals have been deeply studied because of their distinctly different physic-chemical properties at a nanometric scale, from the most hidden tiniest to the most evident properties such as the color. For example, thermal and electrical conductivities are two features influenced by size. Bulk systems possess high thermal and electrical conductivity because electrons can be delocalized on the surface, while in metal nanoparticles electrons cannot be delocalized and they move in confined spaces allowing different properties.23
Among these features, nanoparticles typically provide highly active centers for superficial reactions but are very small and are not at a thermodynamic stable state. Structures at this size range regime are unstable due to high surface energy and the large surface. Several synthetic pathways have been developed to achieve the production of stable particles,23 but nanoparticle research is still focused on that due to the difficulty in generating the desired shape, size and monodispersity of the nanoparticles.22
Several features, such as size, shape, monodispersity, defects, plasmonic band and oxidation state of metal, can be used to classify the nanoparticles systems. Characterization of the nanoparticles systems permits the evaluation of those features, and it is done via several analytical instruments and techniques, typically X-Ray photoelectron spectroscopy (XPS), X-ray diffraction (XRD) and transmission electron microscopy (TEM).23 According to catalyst characterization, not only the nanoparticles features have to been assessed, but also the support ones. Supports are described in terms of accessibility of the catalytic sites, textural properties (pore volumes, dimension and micro- or mesopore capacity), particle size, morphology, chemical nature, surface functionality (species, loading and acidity/basicity), and surface energy characteristics (hydrophobicity/hydrophilicity).23
17
Recent studies on nanoparticles have been mainly focused on silver and gold nanoparticles due to their particular stability at a nanoscale level.24 The increase of knowledge in synthesis and the development of new applications of nanoparticles have improved their exploitation in a lot of different sciences, such as medicine (as contrast agents and magnetic resonance imaging [MRI]), chemical sensors (as electrochemical sensors and biosensors) and heterogeneous catalysis (oxidations, hydrogenations and C-C coupling reactions).23
1.2.1. Metal nanoparticles: synthesis and immobilization methods
Different methods for the synthesis of nanoparticles and their support have been developed in the last years. There are two general strategies to obtain materials on the nanoscale: top down method where material is removed from the bulk material, leaving only the desired nanostructures, or bottom up method where the atoms (produced from reduction of ions) are assembled to generate nanostructures.22 The first comprehends photo and electron beam lithography, but they require an expensive instrumentation and, for photolithography, size resolution is currently limited to 60 nm.22
Bottom up methods can be divided in four main categories: reduction of transition metal salts precursors, electrochemical synthesis, reduction of organic ligands in
organometallic precursors and metal vapor chemistry.25 These methods are the most used
but they suffer poor monodispersity because of the need to stop the growth of the nanoparticles at the same level.22 Other less common methods include thermal and photochemical decomposition of metal complex precursors, redox surface techniques and sonochemical synthesis.25
Of the synthetic methods mentioned above, wetness impregnation was the one applied in this work due to its easy application to supporting nanoparticles.
1.2.2. Wetness impregnation method:
Wetness impregnation is one of the most used method to immobilize metal nanoparticles on supports such as metal oxides ( Titanium, zinc, cerium, zirconium and aluminum oxides) and mesoporous materials.26
It is widely used because it is the simplest immobilization method, temperatures needed for the synthesis are around 353-373 K 27and nanoparticles are formed in situ.
18
Despite of the quantity of metal immobilized with this method, which is generally higher than other techniques such as deposition precipitation or CVD, the activity of the wetness impregnation catalysts sometimes is lower than other methods such as reduction deposition.28
Wetness impregnation consists of a few steps; the first of them is the addition of the metal salt solution to the support. Then, the drying step allows the immobilization of nanoparticles on the surface, and finally the metal is reduced by calcination in air or heat treated under hydrogen atmosphere, according to the type of metal used.27
Several parameters need to be monitored carefully during the nanoparticles formation, such as the control of thermal activation and reduction as they can have a huge effect on the final dispersion and on the dimension of the particles on the surface of the catalysts.29 In addition to the mediocre dispersion of the nanoparticles,28 as previously described, their size and shape are influenced by the different parts of support where they grow and the heating ramp used. The latter influences the growth and multinucleation of nanoparticles, because allows the switch among thermodynamic and kinetic controls. Growth and multinucleation, in fact, are influenced by those controls, and the heating ramp needs to be accurately programmed.
Wetness impregnation is also used with mesoporous supports due to their higher pore dimensions. Those pores are able to encapsulate big nanoparticles on themselves. Size and dispersion of nanoparticles are indeed influenced by pore dimensions.
The use of metal salt solution leads to the problem of counter ion, because it can affect and compromise the catalytic activity. Chlorine is widely used as counter ion, but it can poison the active sites and enhanced the nanoparticles sintering. Several solutions have been studied to avoid this problems, from the thorough washing of catalyst 2to the double precipitation with a base. The second one allows the deposition of gold in the hydroxide form facilitating the removal of chlorine ion.30
19
1.3.
Photochemistry and photocatalysis:
IUPAC defines photochemistry as “a branch of chemistry concerned with the chemical effects of light (far UV to IR)”. Chemical reactions caused by absorption of UV, Vis or IR radiation are called photochemical reactions, or simply photoreactions, and involve photochemical counter parts of normal chemical reactions, such as photooxidations, photodegradations, phootcicloadditions, etc. Therefore, photocatalysis can be defined as the acceleration of a photoreaction by the presence of a catalyst.31
When the light is absorbed by the catalyst, the system represents a sensitized photoreaction which may occur through energy transfer or electron transfer. The first involves the formation of activated state of the reactant of interest, which is more easily oxidized than their ground state. The latter allows catalyst to act as an electron donor or acceptor.
Until now the most analyzed applications for photocatalysis were only the destruction of pollutants in water32 and water splitting.33
1.3.1. Semiconductors as photocatalysts:
Semiconductors are materials that exploit their optical features to convert light into chemical energy, behaving as photocatalysts. Their electronic structure, made up of a filled valence band (VB) and an empty conduction band (CB), has a characteristic gap among these bands that permits the excitation of electron through a specific electromagnetical radiation wavelength.
The semiconductors band gap influences their behavior as photocatalysts, because the redox potential for the generation of reactive oxygenated compounds from water (as oxygen radicals) has to lie within their band gap.34
The activation of the semiconductor photocatalyst is achieved through the absorption of a photon of light corresponding to the bandgap energy which excite electrons from the valence band to the conduction band leaving holes in the valence band. A necessary condition for this phenomenon is that the appropriate wavelengthof the incident radiation has to be equal to the energy of band gap. The electron/hole pair is the driving force of this kind of catalyst 2, and the redox potential of the e–/h+ couple must lie within the bandgap domain of the photocatalyst.32
20
Figure 7: Photoactivation of a semiconductor and generation of electron-/hole+ pair. 35
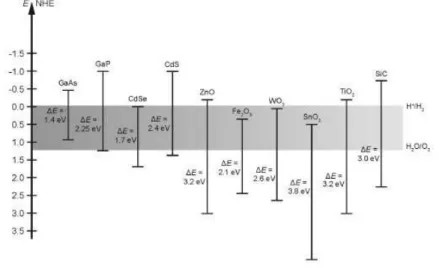
Bandgap energies can be evaluated in electron volts using the Normal Hydrogen
Electrode (NHE) as reference.32 Band gap energies of most common semiconductors are
illustrated in . Redox potentials of electron/hole pair can be influenced by the material and the pH of the environment. According to their potential vs NHE, conduction band electrons can act as reductants (+0.5 to -1.5 V) and valence band holes can act as oxidants (+1 V to +3.5 V).32
Figure 8: Bandgaps of semiconductors in aqueous electrolytic solution at pH 1.
The deactivation of photocatalysts can be due to the electron/hole pair recombination. The catalytic activity of a semiconductor that acts as photocatalyst can be evaluated through the ratio among the activation by light and the deactivation described above. The surface area is an important feature for the valuation of photocatalytic activity. A high surface area of the material involves a high density of localized states, which have energy within the conduction and the valence band.36 These localized states enhance the charge separation because they can act as trapping sites for electrons, and adsorbed
21
species density can promote the radical formation through the trapped charge carriers preventing the recombination.35
Semiconductor are evaluated according to the green chemistry principles and economical sustainability of the process. Non toxicity, simple synthetic method, low production cost, catalytic effects, solar light activation32, stability and durability under irradiation or in water and air-saturated environment34 are somecatalyst’s features appreciated. Several materials, generally metal sulfides and chalcogenides, despite of their photo activity cannot be used as photocatalysts because of their photocorrosion, especially in aqueous environments.2
1.3.2. Titanium (IV) dioxide:
The first studies about the effects of light on titanium dioxide was published on 1921 by Renz, who reported that titania was partially reduced under sunlight irradiation in presence of glycerol, turning its color from white to grey or blue.37 Applications of titania in photocatalysis started 50 years later, when in 1972 Fujishima and Honda published a paper where explained that titania could photolize water under UV light in presence of an
appropriate electrochemical system.38 Titania had started to be exploited in
photocatalysis for its peculiar features, first of all its potential bandgap, that reflected the appreciated characteristics described in the paragraph 1.3.1.34
Titania is present in nature in different allotropic structures: the most common are anatase, rutile and brookite. Rutile is the only stable structure while anatase and brookite are metastable, so they tend to transform in rutile under harsh conditions.35 Brookite is photocatalytically inactive, so it is not studied in this field, while anatase and rutile show photocatalytic activity under UV light.2,39
Anatase shows better photoactivity due to its higher density of localized states. The localized states, as previously described, act as trapping sites for electrons slowing their recombination and letting them reacting with other molecules in solution.35 Rutile presents a worse photoactivity than anatase, because of a larger grain size that not allows a good surface absorption of species along with a higher charge carriers recombination.35 Due to the phase composition, the presence of impurities, particle size, surface area and other physicochemical parameters that strongly affect charge recombination and electron/hole trapping, a large variation in the photocatalytic activity of the material
22
(constituted by 80% anatase and 20% rutile) prepared by spray pyrolysis has become a standard material because it had exhibited good photocatalytic activity and reproducibility.2 Although the use of standard material, huge number of factors present in the reaction systems or in the environment can affect the reproducibility of the results. Light intensity, spectra distribution of the emissions, geometry, impurities are common variables 40of this kind of reactions and have to be considered during the design of the system.2
The excitation of electrons of anatase and rutile requires photons whose wavelength
belongs of the UV region of spectrum due to their large band gap, which is ∼3.2eV for
anatase34 and ∼3.0eV for rutile.41
The electrons produced by UV radiation in the conduction band can present a mild reducing ability (Ered ca. -0.3V), on the other hand, holes in the valence band can act as strong oxidizers (Eox ca. +3.0V)42 towards the molecules adsorbed on the surface, as O2 or H2O. The bandgap of titania is compared with several redox couples in . The first potential allows the reduction of the electron acceptors as oxygen with the formation of superoxide (•O2-) and then hydroperoxide radicals (•OOH) whilst, the latter, permits the oxidation of water generating hydroxyl (•OH) radicals.2 These radicals can subsequently interact with target molecules as occurring during the degradation of pollutants in wasters.2,43
23
Figure 9: Titania bandgap compared to different redox couples.44
The UV region, at ground level, is the most energetic part of light which compose the solar radiation, but it is present for ca. 5% of the total emission. On the other hand, visible and infrared compose the solar light for ca. 43% and ca. 52% but they cannot be utilized in the photo activation of titania due to their low energy content. Solar light is the most attractive energy for its renewability, and research is now focused on bandgap tuning of titania that allows the exploitation of the visible region of spectrum for the excitation of the electrons. This bandgap tuning expands the possible applications of titania as a photocatalyst.34
Different techniques can be used to enhance the titania band gap that space from the coupling with other semiconductors to doping with ions and noble metal nanoparticles deposition. Noble metal nanoparticles deposition is one of the most common techniques because the metal modifies the electronic band structure leading to an opportune surface structure. This surface structure conducts to an higher quantum efficiency that is reflected, for example, in higher rates of organics degradation in water under solar irradiation.34
24
1.3.3. Surface Plasmon Resonance band on metal nanoparticles:
Noble metal nanoparticles are one of the most utilized strategies of visible-enhancement of semiconductors bandgap, because they can capture the solar radiation and transfer the incoming energy through the charge carriers to the support (generally titanium, zirconium and silicon oxide).45,46
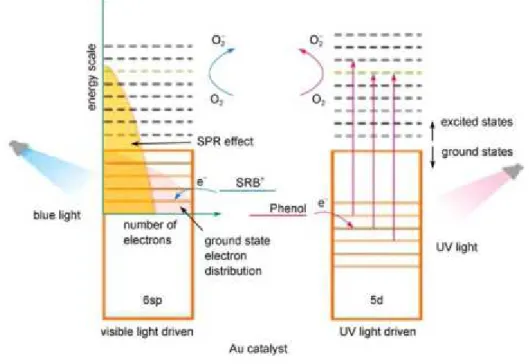
Two different absorption bands are involved in the photo-excitation of nanoparticles, and the mechanism is well explained by gold example in . The first one, called Surface Plasmon Resonance band, originates from intraband excitation of 6sp electrons through visible irradiation. The latter results of the interband transition of electrons from 5d to 6sp orbitals through UV irradiation.
The electronic transitions caused by the visible irradiation are more frequent, and the excited electrons leave reactive holes on the nanoparticles. On the other hand, holes in the 5d band, caused by UV irradiation, are more powerful oxidant than the 6sp ones. That allows the exploitation of nanoparticles as photocatalysts under irradiation of light with wavelength from UV to visible region of spectrum.45
Figure 10: proposed mechanism for photocatalysis through gold nanoparticles for the degradation of
25
Moreover, supported materials have to satisfy specific requisites to be used as catalysts, suchs as a suitable surface for thermodynamically favourable reactions and an high catalytic activity with low activation barriers for the selected reaction.33
These features, along with the specific characteristics regarding photocatalysis and supported materials, such as solar photoactivation and interaction between nanoparticles and support, make complex the development and the large-scale applications of this kind of catalysts.48
Plasmonic photocatalysis has recently come into focus as a very promising technology for high-performance. It involves dispersal of noble metal nanoparticles (Au and Ag are the most used, in the range size of nanometers) into semiconductor photocatalysts and obtains drastic enhancement of photoreactivity under the irradiation of UV and a broad range of visible light. Localized Surface Plasmon Resonance band (LSPR) and Schottky junction are the two peculiar feature of plasmonic photocatalysis, and each influences photocatalysis differently.48
Localized Surface Plasmon Resonance band is originated by the collective oscillation of the metal nanoparticle’s free electrons in phase with the varying electric field of the incident light (), and it can be tailored to fall in the visible range or the near-UV range, depending on the size, the shape and the surrounding environment.
This phenomenon is strongly dependent on the particle’s dimension, because surface plasmons decay in different ways if the particles are bigger than 50nm or smaller than 30nm. In the first case, radiative scattering of resonance photons occur from the bulk, while in smaller particles there is a formation of charge carriers that they can be transferred to the support.33 Therefore, all interactions are expected to be with the surface if particles are smaller than 30nm.22 This charge transfers create “hot spots”, high surface energy density regions around the nanoparticles.
When the wavelength of light is much larger than the nanoparticle size it can set up the resonance conditions as illustrated in . When the wave front of the light passes, the electron density in the particle is polarized to the opposite side and oscillates in resonance with the light’s frequency causing a standing oscillation.
The resonance condition is determined by absorption and scattering spectroscopy and it is influenced by several features, not only of the nanoparticles but also of the environment. Nanoparticles can be tailored in the size and the shape to have a SPR band
26
that falls in different region of the spectrum. That is possible because surface geometry is modified and it leads to a change in the surface electrical density.
Dielectric constant of the media can influence the oscillation frequency of the electrons because it modify the interactions between nanoparticle’s electrons present on the surface and other molecules present nearby. The influence of the chemical bonded molecules on the electron density of the surface induces a shift in the surface absorption maximum.22
Figure 11: Interaction among electromagnetic radiation and nanoparticle electron cloud.49
The interactions among the nanoparticle and the incident light are well described by solving the Maxwell’s equation taking into account proper boundary conditions. Mie’s theory50 described rigorously these interactions for a single spherical nanoparticle.
He used the total extinction cross section (σext), given by absorption and scattering, as the product over all electric and magnetic multipole oscillations. For particles that have size
a much smaller than the light wavelength λ (a<<λ), the quasi-static approximation 51 can be applied and the equation 1 can be used. That approximation can be applied also for gold nanoparticles with size smaller than 25nm.52 That approximation considers the dipole absorption as the only that contributes to the extinction cross section of the nanoparticle.
Equation 1: Mie’s equation with quasi-static approximation.53
Where V is the volume of the spherical particles, ω is the angular frequency of the exciting radiation, c is the speed of light, and εm is the dielectric constant of the medium (assumed as frequency independent). ε1(ω) and ε2(ω) are respectively the real and
27
imaginary part of the dielectric function of the particle material, according to [ε(ω) =
ε1(ω) + iε2(ω)].53 If ε2 is small or weakly dependent on ω, resonance occurs when ε1(ω)~
-2εm, while the width of band and the peak height are approximated by ε2(ω).52 This theory presents some problems in predicting the results for small nanoparticles, due to its approximations.53
The quasi-static approximation doesn’t comprehend the variation of the individual radius, because it limits the dependence on the size to the variation of the total volume of particles. Instead, particle size affect plasmon bandwidth and the position of the adsorption maximum can suffer blue or red-shift with decreasing the particle size.54 When nanoparticle diameter is below 20nm quadrupole and other high-order terms become significant.51 Subsequently, Mie’s theory has to assume the dielectric function of the metal nanoparticle as size dependent [ε(ω) = ε(ω,R)], and for small nanoparticles it has to considered also the size in the total extinction cross section, due to the intrinsic size effects.53
Mie’s theory has been modified by Gans. Mie-Gans model expands the validity to the particles that have different structures or shapes, because it allows the correction of the overall extinction spectra of spheroids.55 This model is corroborated by experimental UV-Vis spectra of spheroidal nanoparticles, because they present the characteristic plasmonic bands.55 However, SPR band is not a common behavior for every metal presents in nanometer size, as demonstrated by Creighton et al.51
SPR band can improve the presence of the charge carriers in the support through some different ways, and direct contact is most used of them.
Noble metal particle and semiconductor contact causes an effect called Schottky junction. That effect consists of an bulk electric field close to the surface of contact between metal and support. When the electron/hole pair is created, Schottky junction forces the electrons and holes to move in different directions, avoiding the recombination.48 Furthermore, the nanoparticles allow a fast-lane charge transfer and their surface acts as a charge-trap center to host more active sites for photoreactions. Energy position of bands is important to value, because it influences the energy of the excited electrons produced. As reported in and described in paragraph 1.3.1, conduction band is around +0.5 and -1.5 V and valence band starts from +1 V to +3.5 V,7 while Surface Plasmon Resonance band energy is comprehended among 1.0 and 4.0 V.
28
Only the excited electrons can be transferred from the metal to the semiconductor, while the positive holes remaining on the metal are often energetically insufficient to run a reaction, especially in case of particles size greater than 50nm.33
Several studies about the supported semiconductors, the plasmon photocatalysis and the possible application involved are been conducted recently.56,57
1.3.3.1. Gold nanoparticles:
The most important feature of gold is its difference from massive dimension to nanometer size. The first is considered chemically inert, and the origin of the adjective “noble” is attributed to this feature. The latter has received more attention in the last decades, especially after the work conducted by Haruta et al. They demonstrated that nanoparticles of gold could be active on the oxidation of CO at low temperatures,58 but this activity disappeared when particle size exceeded 20nm.59 After that, supported gold nanoparticles has attracted the interest in heterogeneous catalysis,60-62 above all for oxidation and hydrogenation reactions.2,17,63
Gold nanoparticles present an absorption band around 560nm that causes the red color observed in gold colloidal solutions. The mechanism of electrons excitation in metal nanoparticles is already described, and electron/hole recombination can be avoided by other molecules that can trap them.
Low gold loading and small size of nanoparticles lead to a good activitiy as a photocatalyst 2for gold supported on titania, due to the capability of producing charge separations under mild redox potentials. Titania is the most used as support for photocatalytic systems, but several metal oxides as CeO2, ZrO2, Fe2O3 are used due to their high surface area.3,4
Nowadays different reactions are performed with Au/TiO2 as catalyst, above all selective oxidations 64-66and hydrogenation 2of organic compounds.
1.3.3.2. Silver nanoparticles:
Silver nanoparticles have shown good activity as catalysts, and their peculiar optical features have led to application in Raman scattering, fluorescence and plasmon photocatalysis fields.67 Furthermore, Ag/TiO2 have found applications as bactericide due to its enhanced activity under UV light.
29
Silver nanoparticles, through their LSPR band, can expand the absorption of titania into the visible part of the light spectrum. They can also slowed the recombination of charge carriers.68 The mechanism 32is similar to the one described for gold and follows the general rules explained in paragraph 1.3.3. The metal nanoparticle’s free electrons are excited by Plasmon Resonance effect under visible light, generating electron/hole pairs. Excited electrons are then transferred to the semiconductor where they finally act superficial reactions with the adsorbed molecules.
Photochemical activity of silver nanoparticles can be modified by changing size, shape and geometry. These features can be tailored to obtain optimal performance for a particular photoreaction as described by Christopher et al.69
Particularly interesting for the purposes of this work is the study conducted on silver nanoparticles supported on titania Degussa P25 by Grabowksa et al.67 They have demonstrated that metal loading and catalytic activity under visible light are not linearly correlated, mainly due to the increase of particle size and support coverage caused by the increasing of metal loaded. In fact, under visible light, the catalyst with low content of silver (1% w/w) reached the best performances, while under UV light the best results are obtained by higher percentage of silver loaded ( 2% w/w).
The optical characteristics of silver nanoparticles, in addition to the low cost of the raw material have improved the interests for potential applications in photocatalysis.
30
1.4.
Photocatalysis for the upgrade of bio-derived molecules:
The “green chemistry” principles have encouraged the study of different ways to run chemical reactions by using bio-derived molecules and greener solvents under milder conditions. Photocatalysis is one of the most interesting routes for the upgrade of bio-molecules, as sugars, into add-value chemicals. Until now, photocatalysis is mainly used for the degradation of pollutant 32or organic compounds, but the aim is the production of “green” fuels and chemicals through using solar energy and renewable raw materials such as biomass.
Colmenares et al.5 have demonstrated that the selective oxidation of glucose occurs on titania-based photocatalysts, and some add-value chemicals, such as gluconic acid and glucaric acid, can be obtained. The oxidation reactions are not the only studied, but also hydrogen production 70has attracted much attention.
Nowadays, water splitting is used to obtain H2,33 but yields remains quite low. Recent studies have obtained hydrogen from biomass, such as glucose, sucrose, and starch.70,71 Titania and metal nanoparticles are the most studied in the field photocatalysis, but the studies can be expanded to Al2O3, ZrO2 and every material that shows photochemical activity. In a study of Pei et al., a degradation of an organic carboxylic acid (2,4-Dichlorophenoxyacetic acid) has been performed with bismuth tungstate (Bi2WO6) and
31
2.
Chemicals and Experimental part:
2.1.
Chemicals:
All chemicals were used as purchased without further purification.
• Metal salts: Gold (III) chloride trihydrate 99.9% (Sigma-Aldrich), Silver nitrate
>99.0% (Sigma-Aldrich).
• Supports: Titanium (IV) Oxide Aeroxide P25 (Acros Organics), Titanium (IV)
oxide anatase Aldrich), Titanium (IV) oxide rutile 99.99% (Sigma-Aldrich).
• HPLC calibration standards: D-(-)-Arabinose ≥98% (Sigma-Aldrich),
D-(+)-Glyceraldehyde ≥98% (Sigma-Aldrich), D-(-)-Erythrose ≥75% (Sigma-Aldrich), Formic acid ≥95% (Sigma-Aldrich), (+)-Glucose ≥99.5% (Sigma-Aldrich) , D-Glucaric acid potassium salt ≥98% (Sigma-Aldrich) , D-Gluconic acid sodium salt ≥99% (Sigma-Aldrich).
• Other chemicals: NaOH.
• Solvents: Ultrapure water (purification system Millipore MILLI-DI resistivity
32
2.2.
Experimental part:
2.2.1. Synthesis of catalysts and calcination of titania:
Catalysts synthesis were carried following the method used by Sugano et al.27 The method is quite different from the common WI method, because hydrogen flow is used during the calcination to avoid the oxidation of the metal. The catalysts were filtrated in one all-glass filter holder (Millipore, UK) with 0.2µm nylon filters (Whatman). Subsequently, the catalysts were dried in a Vacuum oven (Mod. OV-11, Fischer Scientific, UK). Finally, calcination of catalysts were done in a 1100°C ashing furnace (Mod. AAF-1100, Carbolite, UK) equipped with a temperature control (Mod. 2416 Carbolite, UK) under hydrogen flow or static air. This furnace was also applied to calcine Degussa TiO2 P25 powders used to study the effect of calcination temperature.
2.2.2. Reactivity tests:
Tests were carried out in 16 mL glass vials, at 303 K and under magnetic stirring. Glucose solutions were prepared solubilising the substrate in pure water or in a 50/50 v/v ACN/H2O solution.5 Subsequently, 14 mg of catalyst were added to the solution. The reactions were performed for 2 or 4 hours and samples were taken every 30 minutes for the first 2 hours and then every hour until the end of the reaction. Long run tests were carried for 24 hours and samples were taken every 2 hours for the first 6 hours and then at 22 and 24 hours. The TiO2 (Degussa, P25) was used without any further purification and it was used as blank.
Reactions were run in two different photoreactor systems, one for the UV tests and the other for the visible light tests. These two different systems are needed in order to evaluate correctly the impact of the visible and UV region of the spectrum in the reaction.
For UV tests, a Luzchem photoreactor was used(Mod. LZC-4, Luzchem Research Inc. ON, CAN) equipped with 14 UVA lamps (Mod. Hitachi FL8BL-B) arranged 6 at the top and 4 on each side. The temperature controller was set at 303 K for the whole reaction and the temperature was kept constant with a computer controlled fan. The emission spectra of the UV set of lamps is reported in Figure 12 for UVA lamps.
33
Figure 12: Emission spectrum of the UVA Luzchem lamps measured in the range 235-850nm. Data from
www.luzchem.com.
Table 1: Energy distribution at the target expressed as a percentage of the total energy in the monitored
range. Data from www.luzchem.com.
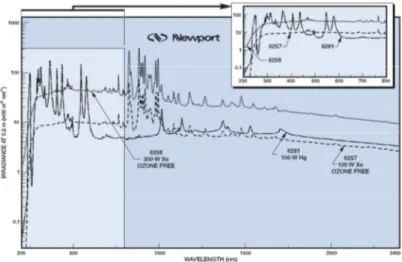
For Visible tests, a Universal Arc Lamp Housing Family (Mod. 66902, Newport, UK) equipped with a Xenon lamp with nominal power 300W was used. Figure 13 is taken from the manual and reports the irradiance spectrum of the lamp. Several filters were used to select only the visible region of the spectrum. In order to remove the IR radiation, the lamp was provided with a distilled water liquid filter (Newport, UK) with circulating water moved by a peristaltic pump (speed 60rpm, Mod. 505S, Watson-Marlow, USA). The transmittance spectrum of the liquid filter is in Figure 14. Furthermore, a colored glass filter (Mod. FSQ-GG420, Newport, UK) with a cut-off value of 420nm was put to maintain only the visible part of the emission spectrum, and its transmittance is reported in Figure 15. The filters were positioned in the order in which they are reported here, in the direction of the beam.
The reaction vial was positioned at a distance of ca. 14cm from the filters on a stirring plate. The shade of the fumed cupboard was covered with tinfoil and kept closed during reaction, in order to avoid the influence from external light sources.
34
Figure 13: Irradiance spectrum of 300W Xe lamp (dotted line). Vertical axis is in logarithmic scale. Data
from www.newport.com.
Figure 14: Transmittance spectrum of the distilled water liquid filter. Data from www.newport.com.
35
2.2.3. HPLC and Q-TOF analyses:
Reaction solutions consist of a mixture of glucose and several products that need to be identified and quantified. HPLC samples were made taking 0.5 mL of solution and centrifuging them for 60 seconds at 13400 rpm to remove any suspended catalyst particles from solution. Centrifuging time was increase to 3 minutes in case of pure water solvent due to the greater difficult to separate the powders from the solution. Samples were filtered with HPLC filters if the catalyst powders still suspended.
The utilized HPLC (Mod. 1200 Santa Clara, Agilent, USA) was equipped with an inline degasser, a quaternary pump, an autosampler and a column switch. The selected detectors were: Diode Array Detector (DAD) and a refractive index one (RID); the analytical column was an Aminex HPX-87H 300mm×7.8mm, 9 µm particle size (Bio-Rad CA, USA). The system was controlled by the Agilent Chemstation software running on a desktop computer. Sugar standard method was used for the analysis. It consist of 0.65mL/min flux of 25mM sulfuric acid in ultrapure water throughout Aminex HPX-87H column. Injection volume was 10µL, Column Temperature was 65°C and RID Temperature was 50°C.
RI detector was used to measure glucose and arabinose amount while Diode-Array (DA) detector was used to measure gluconic acid and glucaric acid amounts. In fact, RI is a system based on different refractive index between the mobile phase and the analyte, and it is characterized by high sensitivity. DA system adds a new dimension of analytical capability to liquid chromatography because it permits qualitative information to be obtained beyond simple identification by retention time. The major advantage is related to the problem of peak purity. Often, the peak shape in itself does not reveal that it actually corresponds to two (or even more) components. In this case, absorbance rationing at several wavelengths is particularly helpful in deciding whether the peak represents a single compound or is, in fact, a composite peak.73
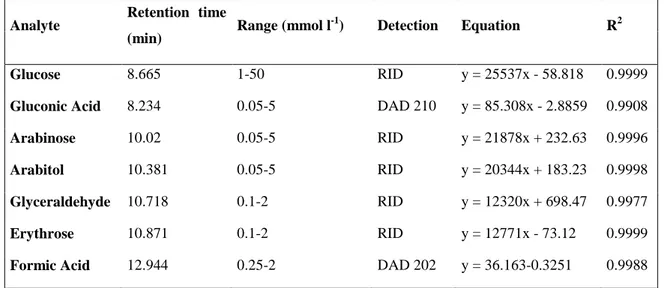
The injection of each standard solution was repeated 3 times and the values for the retention times (tr) were obtained by averaging the 15 retention times collected for each sample. As it can be seen in Table 2, the instrument had a linear response in the concentration range considered, and the linearity between the concentration and the signal is confirmed by the linear regression coefficient R2 which is greater than 0.99 for each of the molecules considered. For DA detection, wavelength of 210nm was used,
36
because absorbance of glucose is negligible at this wavelengthcompared to gluconic and glucaric acid absorbance, as recommended by Prati et al.17.
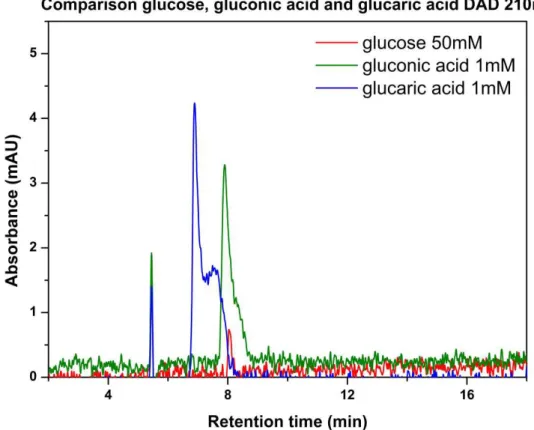
Figure 16: Comparison between Glucose 50mM, Gluconic acid 1mM and Glucaric acid 1mM absorbance
at 210nm with DAD.
Difference in absorbance can be seen in Figure 16. Peak of most concentrated glucose solution (50mM) is comparable with most diluted gluconic and glucaric acid solutions (1mM) peaks. Retention times of these three compounds are different, and peaks of glucose and gluconic acid can be evaluated with different detectors (RID for glucose, DAD for gluconic acid). Calibration curves were made in the range of 1-50mM for glucose. Due to low concentrations of some products, calibrations in the range of 0.05-5mM were made for gluconic acid and arabinose.
Calibration curves were made in the range of 0.2-2mM for some by-products, such as formic acid, erythrose and glyceraldehyde. It was impossible to define precisely the amount of erythrose and glyceraldehyde because they coelut. Their peak was evaluated using the erythrose’s calibration curve. The selectivity and the production of both were simply calculated as 50% of the total amount.
Stock solution of 50mM was prepared, and then 1-2-5-10-20-50mM solutions were used for calibration curve. Table 2 reported the calibration curve for each substance.
37
Table 2: Calibration curves of reactant and products recognized.
Analyte Retention time
(min) Range (mmol l
-1) Detection Equation R2
Glucose 8.665 1-50 RID y = 25537x - 58.818 0.9999
Gluconic Acid 8.234 0.05-5 DAD 210 y = 85.308x - 2.8859 0.9908
Arabinose 10.02 0.05-5 RID y = 21878x + 232.63 0.9996
Arabitol 10.381 0.05-5 RID y = 20344x + 183.23 0.9998
Glyceraldehyde 10.718 0.1-2 RID y = 12320x + 698.47 0.9977
Erythrose 10.871 0.1-2 RID y = 12771x - 73.12 0.9999
Formic Acid 12.944 0.25-2 DAD 202 y = 36.163-0.3251 0.9988
The accurate mass of the oxidized products obtained from cellobiose were analysed with an Agilent 6510 Q-TOF LC/MS system and interpreted using Agilent MassHunter Workstation Software (Version B.06.00). The column used for the mass spectrometry analysis was a Varian MetaCarb 67H (300 mm x 6.5 mm) (Agilent , USA) kept at 65 ˚C
using a 0.1 % w/w formic acid aqueous solution at a flow rate of 0.8 mL min-1. The
Q-TOF was operated in positive ESI mode.
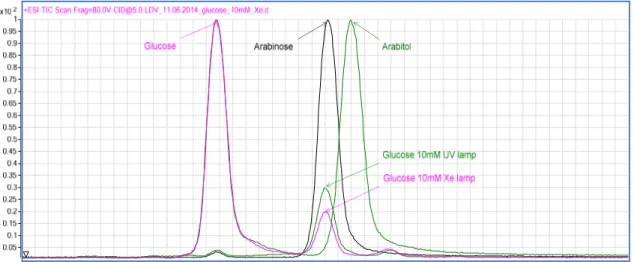
Before the analysis the samples were centrifuged at 13400 rpm for 60 seconds to remove any suspended particles. The glucose and the reaction products were determined using the same commercial standards used for the HPLC analyses. The total ion chromatograms (TIC) for the samples obtained for the reaction with the 10mM glucose solution after 4 hours under visible and UV light are reported in Figure 17. In figureErrore. L'origine riferimento non è stata trovata. are also reported the TIC for the same reaction samples along with the TIC relative to the glucose, arabinose, and arabitol standards. It can be seen how the retention time of the arabinose matches the peak observed in the samples, presence confirmed with the presence of the [M-Na]+ adduct.
38
Figure 17: Total Ion Chromatogram for the reaction samples of the 10mM glucose solution with the UV
lamp (green) and the Xe lamp (pink) after 4 hours of reaction, compared with arabinose (black) and arabitol (green) standards.
2.2.4. Catalysts characterization:
The solid UV-VIS reflectance spectra were done in the range 200-800nm (Instrument Mod. UV-2550, Shimadzu, USA). Instrument settings were: sampling interval 0.5nm, slit
5nm and BaSO4 was used as reference. The catalyst powder was put in a quartz sample
holder. The Kubelka-Munk function for scattered light was used to transform the reflectance data into absorbance data (Equation 1). The assumption of this theory is that the particle distribution is random and the dimension is much smaller than the thickness of the layer. Regular reflections of the light on the sample are not considered by this law. This function is related to the extinction factor (ε) in transmission spectroscopy and it is proportional to the concentration (as Lambert-Beer law) for dilute species. The function, as absorbance, depends on the wavelength (λ).
R = 1 − R
2R =
k s ∝
ε ∗ c
Equation 1: Kubelka-Munk function.
Where ∞ is the absolute Reflectance of the sample but it is typically substituted with the reflectance relative to a standard ′∞ (BaSO4 is a usual standard for UV-VIS range); k is the absorption factor, s is the scattering factor and c is the concentration of the sample. The relative LSPR band was recognized evaluating the indirect allowed transition. Kubelka-Munk function for the indirect allowed transition (F(R∞)*hv)^2 was plot in
39
function of the energy (eV) and the peak of characteristic LSPR value was observed. Energy bandgap (eV) and wavelength (nm) are mathematically correlated, and the equation is explained below.
XRD instrument (Mod. D8 Advance, Bruker, USA) was equipped with a Cu-kα= 1.54 Å source of radiation and a Ge monochromator in reflection mode. Scans were done for 2h in the range 2θ: 10-80. Catalyst powders were loaded on zero background silica wafers. Nanoparticle TEM images were obtained with JEOL 2100 operated at 200kV. Samples were prepared by dispersion in methanol with sonication and depositing on 300 mesh holey carbon film.
40
2.3.
Synthetic methods:
2.3.3. Synthesis of gold catalyst:
The synthesis follows the method used by Sugano et al.27. Concentrated aqueous solution
of gold salt was prepared. P25 (1.0 g) was added to water (50 mL) containing HAuCl4・
4H2O (45.8 mg). The pH of solution was adjusted to ca. 7 with 1mM NaOH, and the solution was stirred at 353 K for 3 h. The particles were recovered by centrifugation, washed thoroughly with water, and dried at 353 K for 12 h. The powders were calcined at 673 K for 2 hours under hydrogen flow, with the heating rate of 2 K min–1. Metal loadings were calculated as weight percent of total metal on the support as in Equation 2.
% =
!"
× 100
Equation 2: Calculation of metal loading of a supported catalyst.
2.3.4. Synthesis of silver catalysts:
This method was used to prepare silver catalysts with different amount of metal loaded. Different AgNO3 solutions were prepared solubilizing the salt in H2O. TiO2 P25 has been suspended in 4ml of H2O in a vial under magnetic stirring. Subsequently, the appropriate volume of the metal solution has been added and the solution was left to evaporate under magnetic stirring at 353 K. The paste obtained has been then dried overnight under vacuum at 383 K. Calcination has been conducted under static air at 673 K for 3 hours at 2 K min-1.
41
2.4.
Kinetic tests:
2.4.3. Effect of a catalyst/substrate ratio:
First of all, the optimum ratio between catalyst and substrate was investigated mantaining constant the catalyst concentration (1 g/L) as used in literature18,74, while glucose concentration was varied from 2.8mM to 50mM. Different stock solution of glucose were prepared (2.8-5-10-20-50mM) using a mixture of water/acetonitrile 50/50 v/v.5 Tests were carried out for 4 hours as previously reported, in Luzchem photoreactor for the UV tests and Xenon lamp for Visible light tests. Analysis were made as reported, but for 50mM tests the samples were diluted 1:1 with a mixture of water/acetonitrile 50/50 v/v due to the calibration range.
2.4.4. Effect of Solvent and lamp power:
The solvent effect was studied using two different solutions and two different catalysts. Luzchem and Xenon lamp systems were respectively used to perform these tests under UV and visible light. Two different glucose stock solutions were made, using pure water and the mixture of water/acetonitrile 50/50 v/v. Concentration of glucose was fixed at
20mM, and 1%Ag/TiO2 WI and TiO2 P25 were used. Reaction time was fixed at 2 hours,
and samples were taken every 30 minutes. HPLC analyses were carried out as previously reported, without any further dilutions or purifications.
The effect of solvent was crossed with the effect of lamp power. For the study of this effect, a Universal Arc Lamp Housing Family (Mod. 66902, Newport, UK) equipped with a Xenon lamp with nominal power 1000W was used. The reactions were carried out with 14mg of catalyst and 14mL of 20mM glucose solution. Reaction time was set at 2 hours, with the same procedure to take samples.
Furthermore, to compare effect of different light composition, 300W and 1000W Xenon systems were used with and without UV glass filter, in the same reaction conditions used above.
2.4.5. Adsorption of Glucose on catalyst:
Adsorption of glucose was investigated using the same system reported above. A 16mL vials were used at 303 K under magnetic stirring in Luzchem photoreactor. Glucose concentration of 20mM was used, and the stock solution was made of a mixture of
42
water/acetonitrile 50/50 v/v. The lamps were kept turned off, and tests were carried out in dark conditions for 120 minutes, with an intermediate sample after 30 minutes.
43
2.5.
Photocatalytic tests:
2.5.3. Reactions under visible and UV light:
Visible and UV reactions were carried out using the same system described for the kinetic tests. These systems were used for the investigation several parameters such as the effect of the crystalline structure, the calcination, the metal loading and the different metal used. Reaction time was kept constant at 2 hours, and samples were taken every 30
minutes. Degussa TiO2 P25 was used as a blank, and silver and gold supported catalysts
were compared.
2.5.4. Long term reactions:
Long term reactions were conducted for 24 hours with the same reaction conditions used for the kinetic studies. Luzchem and 300W Xenon lamp systems was used to carry out these tests, and TiO2 P25, 1% Au/TiO2 and 1% Ag/TiO2 were used as catalysts. Samples were taken at 2-4-6-22-24 hours and treated as previously described.
2.5.5. Recycling tests:
The recycling tests of the catalyst were done to see how much activity was lost if the catalyst was reuse several time. The tests were conducted using 1% Ag/TiO2 as sample catalysts. The reaction conditions used were the same of the photocatalytic tests, with 20mM glucose solution in 50/50 Acetonitrile/water for 2 hours at 303 K under UV and visible light. These tests were divided in three runs. In the first one, 3 reactions were performed using 14mg of catalysts, and catalysts were recovered, centrifuged and washed with water. After an overnight drying, the powders were grinded and 28mg of catalyst was used for the second run, in 2 reaction with 14mg of catalyst each. After 2 hours, the catalyst was recovered and the same procedure was applied to recover 14 mg with which the third run was conducted. The final results obtained for the conversion and selectivity values are the average of the first 3 and 2 runs respectively.
44
3.
Results and discussion:
3.1.
Optimization of reactivity tests: catalyst to substrate ratio:
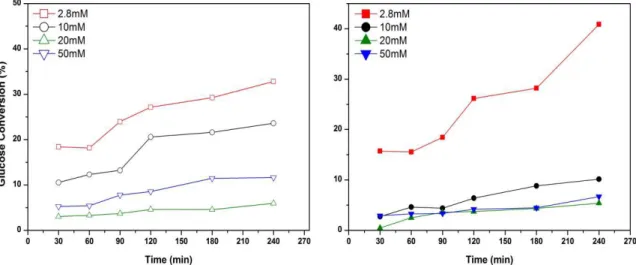
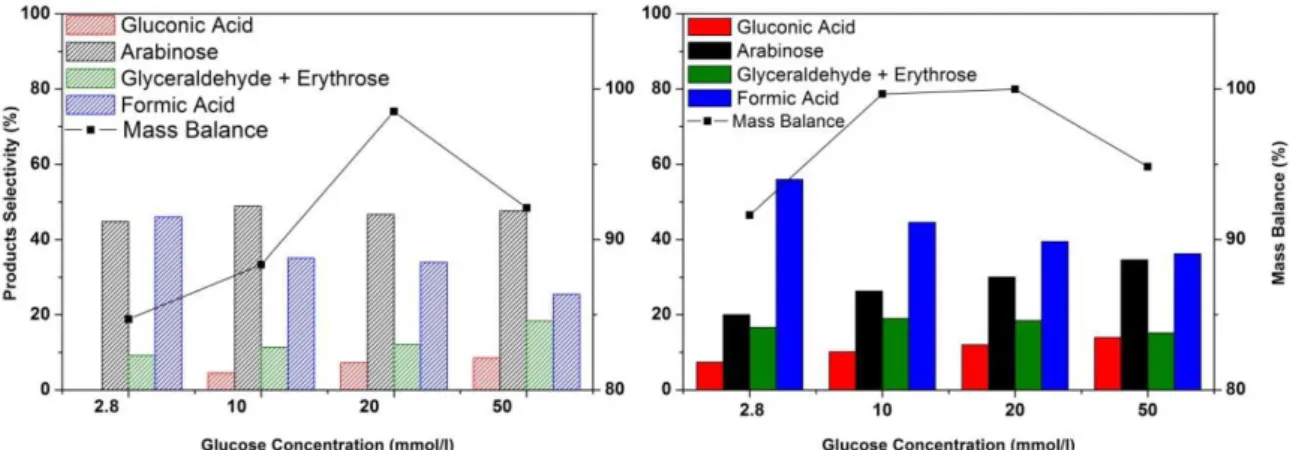
First of all, initial glucose photo oxidation testing focused on finding the optimum catalyst to substrate ratio for the standard Degussa P25. The selected range of glucose concentration varied from 2.8 to 50mM mantaining constant the quantity of the catalyst (1 g/L). The different catalyst to substrate ratios were tested in a water/acetonitrile 50/50 v/v mixture for 4 hours under visible light, using a 300W Xenon Lamp, and under UV irradiation, through Luzchem photoreactor. Selectivity values of the reaction products are comparable for all the catalyst to substrate ratios, but at the lowest glucose concentration the contribution of mineralization is significant. The total mass balances have been calculated, and for the lowest glucose concentration it was of 92% with a glucose conversion of 41% for the Xenon lamp and of 85% with a conversion of 33% for the Luzchem photoreactor.Figure 18: Time-on-line conversion at different catalyst to substrate ratio under UV light (on the left) and
45
Figure 19: Mass balance and product selectivity at different catalyst to substrate ratio under UV (left) and
visible light(right).
Significative differences can be observed in Figure 18 and Figure 19. Selectivity towards arabinose sligthly increase under UV irradiation with a similar trends for each concentration of glucose, but gluconic acid selectivities are lower than 10%. Colmenares et al.5 suggest a reaction pathway that leads to the production of gluconic acid, glucaric acid and arabitol using UV irradiation. Arabinose was found instead of arabitol leading to the hypothesis of a different mechanism patwhay involved instead of the Colmenares one. The mass balance slightly improves increasing substrate concentration in both the reaction systems considered (Table 3). The 20mM glucose concentration was used as a standard solution for all testing, in order to minimize the mineralization reactions to CO2 and H2O. The lower mass balance is considered to be due to the formation of CO2 and H2 from the total degradation or mineralization pathway which is well documented.2,5 Furthermore qualitative offline GC analysis did show the presence of CO2 and H2.
The great mineralization of 2.8mM glucose solution seems to be due to the adsorption of glucose in the reactive site and the higher rate of mineralization pathway with the smaller carbohydrates. The adsorption of glucose, at low concentration, seems to be difficult and free reactive sites can be occuped by by-product to give further reaction under visible light and mineralization in case of higher energy as UV light. The trend are the same under visible and UV light, but mineralization is higher under UV. Nevertheless further investigations are required to understand the kinetic order of reaction and the mass transfer involved.
46
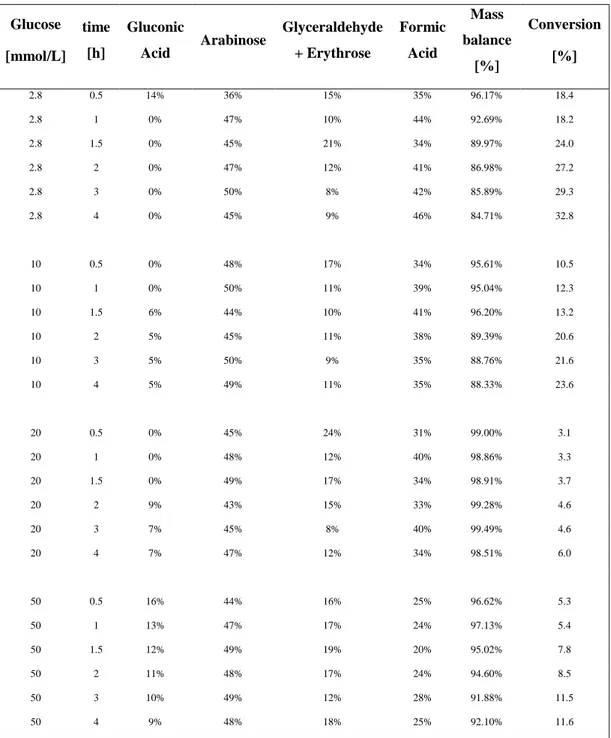
Table 3: Oxidation of glucose results at different catalyst to substrate ratio under UV light.
Products selectivity (%) Glucose [mmol/L] time [h] Gluconic Acid Arabinose Glyceraldehyde + Erythrose Formic Acid Mass balance [%] Conversion [%] 2.8 0.5 14% 36% 15% 35% 96.17% 18.4 2.8 1 0% 47% 10% 44% 92.69% 18.2 2.8 1.5 0% 45% 21% 34% 89.97% 24.0 2.8 2 0% 47% 12% 41% 86.98% 27.2 2.8 3 0% 50% 8% 42% 85.89% 29.3 2.8 4 0% 45% 9% 46% 84.71% 32.8 10 0.5 0% 48% 17% 34% 95.61% 10.5 10 1 0% 50% 11% 39% 95.04% 12.3 10 1.5 6% 44% 10% 41% 96.20% 13.2 10 2 5% 45% 11% 38% 89.39% 20.6 10 3 5% 50% 9% 35% 88.76% 21.6 10 4 5% 49% 11% 35% 88.33% 23.6 20 0.5 0% 45% 24% 31% 99.00% 3.1 20 1 0% 48% 12% 40% 98.86% 3.3 20 1.5 0% 49% 17% 34% 98.91% 3.7 20 2 9% 43% 15% 33% 99.28% 4.6 20 3 7% 45% 8% 40% 99.49% 4.6 20 4 7% 47% 12% 34% 98.51% 6.0 50 0.5 16% 44% 16% 25% 96.62% 5.3 50 1 13% 47% 17% 24% 97.13% 5.4 50 1.5 12% 49% 19% 20% 95.02% 7.8 50 2 11% 48% 17% 24% 94.60% 8.5 50 3 10% 49% 12% 28% 91.88% 11.5 50 4 9% 48% 18% 25% 92.10% 11.6