A glucosamine derivative affects
metastatic activity in two prostate
cancer cell lines by stimulating Maspin
expression
Department of Biochemical Sciences “A. Rossi Fanelli” PhD in Biochemistry
Candidate
Mariangela Lopreiato
Supervisor
Coordinator
Prof. Anna Scotto d’Abusco Prof. Stefano Gianni
1
Il piccolo principe sedette su una pietra e alzò gli occhi verso il cielo: “Mi domando” disse “se le stelle sono illuminate perché ognuno possa un giorno trovare la sua”
A Papà, Mamma, Enzo e Peppe
le mie stelle
2
Index
ACKNOWLEDGMENTS 4
1 ABSTRACT 5
2 INTRODUCTION 6
2.1 HUMAN PROSTATE: ANATOMY AND DEVELOPMENT 6
2.2 PROSTATE CANCER 10
2.2.1 GLEASON GRADING SYSTEM 12
2.2.2 PSA SCREENING AND MOLECULAR MARKERS IN PROSTATE CANCER
DIAGNOSIS 15
2.2.3 THE MOLECULAR BIOLOGY OF PROSTATE CANCER 18
2.2.3.1 PC3 and LNCaP cell lines: How androgen sensitivity affects metastatic
activity 24
2.3 MASPIN (MAMMARY SERIN PROTEASE INHIBITOR):AN UNUSUAL
MEMBER OF SERPINS SUPERFAMILY 27
2.3.1 MASPIN MOLECULAR AND BIOLOGICAL FUNCTIONS IN NORMAL
DEVELOPMENT 29
2.3.2 THE ROLE OF MASPIN IN TUMOR CELLS 33
3 AIM OF THE WORK 36
4 MATERIALS AND METHODS 38
4.1 CELL CULTURE 38
4.2 CELL TREATMENT 38
4.3 CELL VIABILITY 38
4.4 RNA EXTRACTION AND REVERSE TRANSCRIPTION 39
4.5 QUANTITATIVE REAL-TIME-PCR(Q-RT-PCR) 39
4.6 PROTEIN EXTRACTION,SDS-PAGE AND WESTERN BLOTTING 40
4.7 IMMUNOCYTOCHEMISTRY 41
4.8 FLUORESCENCE IN SITU HYBRIDIZATION (FISH) 41
4.9 TRANSMISSION ELECTRON MICROSCOPY (TEM) 41
4.10 IMMUNOFLUORESCENCE 42
4.11 FLOW CYTOMETRY 43
3
5 RESULTS 44
5.1 EFFECT OF NCPA ON CELL VIABILITY 44
5.2 EFFECT OF NCPA ON MASPIN PRODUCTION 46
5.3 EFFECT OF NCPA ON CELL CYCLE PROGRESSION AND CELL
PROLIFERATION 48
5.4 EFFECT OF NCPA ON CYCLIN D1(CCND1) GENE AMPLIFICATION 50
5.5 EFFECT OF NCPA ON MITOTIC SPINDLE ASSEMBLY IN LATE-STAGE PC3
CELL LINE 52
5.6 EFFECT OF NCPA ON APOPTOSIS IN PC3 AND LNCAP 54
5.7 EFFECT OF NCPA ON LNCAP CELLS TREATED WITH AR INHIBITOR 56
6 DISCUSSION 59
7 LIST OF ABBREVIATIONS 65
8 REFERENCES 69
4
ACKNOWLEDGMENTS
Firstly, I always will be deeply grateful to my tutor and supervisor Prof. Anna Scotto d’Abusco for the opportunity she gave me to join and be part of her lab. During my PhD course she never missed, with her strenght and energy, to support me, to discuss with me new ideas, to stimulate my curiosity, my will to do and to learn something new. Every moment has been precious, an opportunity to grow not only scientifically, but also personally. During these years I have changed a lot of my ideas, my believes and now I feel more consciousness of what I want to be when I grow up. The most important gift she gave me was to instill me love for scientific work.
I’ve never felt just part of a lab team, but every moment part of a family. A special thank to Dr. Rossana Cocchiola, for all the time spent together. She is a very special woman. I missed her every day when she started a new work experience. She taught me the first techniques and how “to live” in a laboratory. I will never forget all the teaching time (“no errors are admitted”), the laughs, the confidences about cares, dreams and future plans. I was very lucky to share my PhD course with her, to learn from her deep experience, to receive her support and love.
Thanks to Dr. Alessia Mariano, the “piccoletta” of the lab. She is an explosion of determination, profoundness and willpower. The time spent together in the lab was “only” of a year, but it was really intense. I trust she will be great in all she is going to do in future. I found in her a friend.
A special thank to Prof. Francesco Malatesta, for his support, advices and care. And last but not least, I would to give a special thank and to express my deep gratitude and love to my family, Dad, Mum, Enzo and Peppe. Without them I would have never done what I love. Each of them supported me in all my decisions, helped me to make the right choice, even when I didn’t trust it would be a good one. I know they will be always by my side, and I feel so proud of this. They are my greatest richness.
5
1 ABSTRACT
Prostate Cancer (CaP) is the most common male tumor and is the third leading cause of cancer death, with an incidence of 1.28 million cases worldwide, according to the data collected by the Global Cancer Observatory in 2018. PC3 and LNCaP cell lines represent suitable models to study CaP development, due to their different metastatic origin and their distinct sensitiveness to androgen signaling. PC3 is a hormone-insensitive cell line isolated from a vertebral metastatic prostatic tumor. It lacks of androgen receptor (AR) and its abnormal growth could be attributed to enhanced expression levels of TGF-α, EGF, and EGF-R. LNCaP cell line was isolated from a human metastatic prostate adenocarcinoma found in a lymphnode. It expresses a T877A mutated AR form, which results in an enhanced binding affinity for several steroid compounds. Both cell lines present very low basal levels of Maspin expression. Maspin, an unusual member of the Serine Proteases superfamily, has been characterized as a class II tumor suppressor gene in many cancer types, among them CaP, due to its ability to inhibit cell invasiveness and proliferation and to increase apoptosis, thus inhibiting metastasis. In normal prostate epithelial cells, Maspin is highly expressed, whereas in prostate cancer cells its expression is almost completely suppressed. Previously in our laboratory, a glucosamine derivative, NCPA, has been proved to be effective in stimulating Maspin expression and to induce its nuclear localization in an osteosarcoma cell line, 143B.
The aim of my PhD project was to evaluate the ability of NCPA to affect metastatic activity in two prostate cancer cell lines, the hormone-insensitive PC3 and the hormone-sensitive LNCaP cells, respectively representative of late-stage and early-stage CaP.
6
2 INTRODUCTION
2.1 Human Prostate: anatomy and development
The human prostate, a gland of the male reproductive system, is commonly described as a small walnut-sized organ. It is located anterior to the rectum at the base of the bladder, surrounding the prostatic urethra. The prostate is formed of both muscular and glandular tissues [Amin and Khalid, 2011]. It is an accessory gland enhancing male fertility by producing and secreting fluids containing many enzymes (acid phosphatase, β-glucuronidase, amylase, fibrinolysin, proteases), prostaglandins, spermine and spermidine, immunoglobulins and zinc, that constitute the ejaculate [Drake, 2008]. The prostate is highly susceptible to benign prostatic hypertrophy (BPH) and prostatitis onset and undergoes to oncogenic transformation more than other tissues in men. Investigating prostate anatomy and organogenesis is of great importance in understanding the site and origin of prostatic diseases. McNeal first described four anatomic zones of the prostate on the basis of biological and histological concepts. Each zone originates from prostatic urethra and displays specific architectural features: the peripheral zone, the central zone, the transitional zone and the peri-urethral zone (Figure 1) [Mcneal, 1981].
Peripheral zone covers almost 75% of the glandular tissue of the adult
prostate. It forms a disc of tissue whose ducts radiate laterally from the urethra and distal to the verumontanum, a structure located on the floor of the posterior urethra, which limits the membranous and the prostatic segment [Geavlete et al., 2016]. Almost all carcinomas arise here.
Central zone constitutes nearly 25% of the glandular tissue of the prostate. Its
ducts open close to the ejaculatory ducts into the prostatic urethra. Their orifices arise separately from those of the peripheral zone, even if its distal part
7
is surrounded by the peripheral zone. This region is relatively resistant to carcinoma and other diseases.
Transitional zone represents an evolution of the embryonic development of
the urogenital sinus (UGS), above the base of the verumontanum into the pre-prostatic urethral segment. In this zone, no major ducts are present in the proximal segment, but there is an elongation of the lateral rows of the peripheral zone. Only tiny channels of near-microscopic size and vastly simplified structure, constituting less than 1% of the mass of glandular prostate, are present in adult subjects. Although insignificant in size and probably in function importance, the transitional zone has great significance for adult pathology. It grows with age and is the common site of BPH origin.
Peri-urethral zone is a non-glandular region, representing about one third of
the volume of the tissue within the prostatic capsule. It produces a convexity in its anterior surface, covered by fibromuscular stroma. It is made of a thick sheath of tissue, continuous with the detrusor muscle at the bladder neck. In this region are present small ducts and acini not completely developed [Mcneal, 1981].
During embryogenesis the primitive UGS, the structure giving rise to urinary and reproductive organs, resulting from an endodermal origin [Seifert et al., 2008], forms a caudal elongation of the hindgut. In humans, the UGS and the hindgut are initially connected in a single excretory tract at the embryonic cloaca. Progressively, by 8 weeks of gestation, the cloaca undergoes to division into separate urogenital and anorectal tracts [Hynes and Fraher, 2004]. Subsequently, the primitive UGS is subdivided into the bladder at its rostral end, the UGS in the middle and the penile urethra in the caudal part [Toivanen and Shen, 2017]. Through epithelial development, from the UGS, starting at
8
10 weeks of gestation, the prostate takes shape [Kellokumpu-Lehtinen et al., 1980]. During birth and pre-pubertal ages prostate organogenesis continues, under the influence of circulating androgens, and reaches its mature size during puberty. Prostate development could be divided, more in detail, into the following stages: (1) pre-bud UGS origin, directly or indirectly mediated by androgens, (2) emergence of solid prostatic epithelial buds from UGS epithelium (UGE), initiating tissue outgrowth, (3) bud elongation and branching, to form a system of ducts composed of solid epithelial cords, a process that involves paracrine signaling, in which androgen receptor (AR) function mediates epithelial growth, (4) canalization of the solid epithelial cords, leading to the formation of the mature ductal network, (5) differentiation of luminal and basal epithelial cells, (6) secretory cytodifferentiation, to give origin to functional glandular epithelium with completely differentiated cell types (Figure 1) [Cunha et al., 2018; Timms, 2008].
9
Luminal and basal cells mainly constitute the mature prostatic epithelium (Figure 2). These cells derive from common progenitor/stem cells, highly concentrated in the embryonic UGS (from which prostatic epithelium origins) and presumably within the basal compartment of adult prostatic epithelium [Wang et al., 2001]. Luminal cells express cytokeratins [Verhagen et al., 1988] and secretory proteins such as prostate specific antigen (PSA) [Liu et al., 1997], largely used as biomarker for the diagnosis and screening of prostate cancer. Below the luminal layer, at the basement membrane level, basal cells express also cytokeratins [Verhagen et al., 1988], as well as p63, a biomarker required for prostate development [Signoretti et al., 2000]. Luminal cells, in addition, express high levels of AR compared to basal cells, which result negative to AR immunoreactivity tests [El-Alfy et al., 1999]. Intermediate cells co-expressing luminal and basal markers are often present in the basal layer. Ultimately, few neuroendocrine basally localized cells express secreted neuropeptides and other hormones, such as somatostatin and bombesin, to date good target for drug development in the treatment of prostate cancer [Abrahamsson, 1999; D’Angelillo et al., 2014; Kim et al., 2017b].
10 2.2 Prostate cancer
Prostate Cancer (CaP) is the most common male malignancy and is the third leading cause of cancer death, with an incidence of 1.28 million cases worldwide [Bray et al., 2018]. Epidemiological studies report how cancer risk, aggressiveness and prognosis vary by race, ethnicity and geography [Rebbeck, 2017]. CaP incidence is higher in developed countries (North America, Western and Northern Europe and Australia), in contrast its mortality is higher in African men, based on 2018 data from the Global Cancer Observatory. The variation in incidence and mortality rates among men from different countries of the world reflect the differences in lifestyle, screening and treatment behavior, individual risk factors and genetic pattern.
In the past, CaP has been considered a rare disease, due to the shorter life perspective and the few detection and screening methods. Over time, histological studies of a number of autopsies provided important informations about the development of CaP: the peripheral zone of the prostate is site of origin of the disease and the distribution of the tumor depends on the gland density; contrary to some hypotheses, the carcinoma does not origins from atrophic glandular epithelium, but it selectively rises in gland with an active epithelial activity; CaP increases with age and its growing rate has a logarithmic trend; the malignancy course of the carcinoma has a direct relationship with tumor size, for its ability to locally invade gland capsule, peri-urethral tissue and verumontanum [McNeal, 1969].
CaPs have been mainly characterized as acinar adenocarcinoma, but exists a minority of cancers classified as acinar and non-acinar variants. Subtypes of adenocarcinoma and other carcinomas rarely occur in prostate gland, such as ductal adenocarcinoma, mucinous carcinoma and signet ring cell carcinoma [Grignon, 2004; Humphrey, 2012]. The disease originates from a high-grade
11
prostatic intraepithelial neoplasia (HGPIN), considered a pre-cancerous lesion. Prostatic intraepithelial neoplasia (PIN) is histologically characterized by three increasing levels of severity [McNeal and Bostwick, 1986]. As PIN grade increases, a progressive disruption of the basal cells layer occurs, as demonstrated by the absence of basal cell-specific keratins in immunoreactivity tests [Brawer et al., 1985]. Histological studies report three ways by which PIN growth, through prostatic ducts, occurs: the first involves the replacement by neoplastic cells of the normal luminal secretory epithelium with the preservation of the basal cell layer and the basement membrane; the second involves permeation of neoplastic cells along ducts between the basal cell layer and luminal secretory layer; the third involves invasion through the duct wall, with disruption of the basal cell layer and basement membrane [Bostwick and Brawer, 1987]. The loss of the basal cell layer confirms the histological diagnosis of CaP.
12
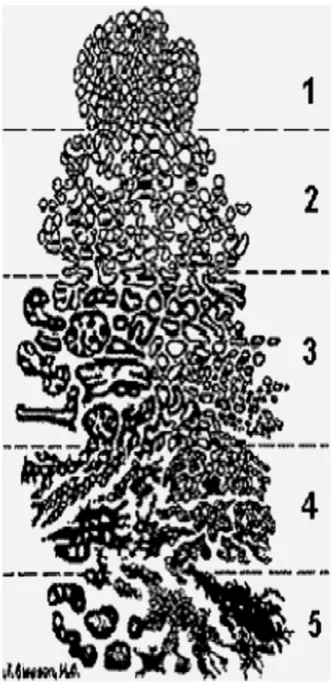
2.2.1 Gleason grading system
During 1960-1975 the Veterans Administration Cooperative Urological Research Group (VACURG) conducted a series of controlled and randomized clinical trials in order to develop a histological grading system for CaP. The classical Gleason system (Figure 3) identifies 5 histological grades analyzing by light microscope the glandular tissue: the grade is essentially based on phenotype of tumor cells compared to normal prostatic cells and a lower grade indicates a better prognosis. In the original grading system, i) Gleason pattern 1 is characterized by a well-circumscribed, nodular lesion composed of approximately uniform, well-differentiated glands of regular size; ii) Gleason pattern 2 shows variations in sizes of the neoplastic glands, slightly increased stroma between the glands, and even mild irregularity at the periphery of the nodule; iii) Gleason pattern 3, described in many series as the most common pattern, is composed of individual, discrete and distinct neoplastic glands, typically small, but often of variable sizes and infiltrating into the stroma, between the benign glands. This original pattern includes cribriform structures, with irregular contours, or within small, smooth, rounded glandular spaces, or “gland in gland formation”, i.e., glomerulation; iiii) Gleason pattern 4 exhibits fused glands, which are no longer individual or distinct, resulting in irregular fused glandular or cribriform patterns; iiiii) Gleason pattern 5 includes comedo type necrosis, solid or cordlike growth or infiltration of individual tumor cells, without any trace of gland formation (Figure 3) [Gleason, 1992].
13
Figure 3. Prostatic adenocarcinoma (histologic patterns). Standardized drawing for grading
14
Since its definition, the Gleason score underwent to constant updates, due to the modern surgery protocols and the revised cancer management, in combination with the increased use of PSA serum level measurement as screening method. The International Society of Urologic Pathology (ISUP) significantly modified the original Gleason grading system during two conferences held respectively in 2005 and 2014. The follow-up studies provided a database for the Gleason grading system, based on the extent of glandular differentiation and the tumor growth pattern in the prostatic stroma, in correlation with clinical data such as staging and prognosis. To date, the original 1 and 2 scores are included in the Gleason 3 pattern and considered as non-aggressive, thus only Gleason scores from 3 to 5 are accepted. The Gleason scores 4 and 5 are considered the more aggressive, with a metastatic potential and worse clinical outcomes. Since in most cases prostate adenocarcinoma presents cells with different grade of differentiation, two grades could be assigned. A primary grade is given to cells covering the largest area of the tumor and the secondary grade is given to the next largest area. The sum of the primary (e.g., Gleason 3) and secondary (e.g., Gleason 4) grades gives the Gleason score (e.g. Gleason score =3+4=7). Tumors with Gleason 6 (3+3) are considered low-grade, while scores ≥7, with 4 and 5 grades are considered high grade [Chen and Zhou, 2016]. Currently, the Gleason grading system is one of the best prognostic value to predict the clinical outcome of the CaP, combined with the PSA serum level measurement, a common screening method to detect prostate abnormalities.
The World Health Organization (WHO) incorporated the revised Gleason grading system for the classification of CaP.
15
2.2.2 PSA screening and molecular markers in Prostate Cancer diagnosis
Prostate-specific antigen (PSA), or kallikrein-related peptidase 3 (KLK3), is a protein belonging to kallikreins trypsin-like or chimotrypsin-like serine proteinases. The gene is one of the fifteen kallikrein subfamily members located in a cluster of chromosome 19 [Sutherland et al., 1988]. Kallikreins are known to be involved in several pathways that regulate skin desquamation, tooth enamel formation, lung and kidney function, seminal liquefaction, synaptic neural plasticity, brain function and immune system response [Kalinska et al., 2016]. PSA protein is secreted by prostatic epithelial cells as a preproenzyme and requires post-translational modification to become catalytically active. The preproenzyme (preproPSA), with a length of 261 aminoacids, is processed to a 244-aminoacids non-catalytic zymogen (proPSA), which is secreted into the seminal lumen. Human kallikreins 2 (hK2) and human kallikrein 4 (hK4) remove the pro-leader peptide, by a proteolytic cleavage of 7 aminoacids, to form the active PSA of 237 aminoacids [Väisänen et al., 1999]. The mature and catalytically active PSA forms stable complexes with α1-antichymotrypsin (ACT), α2-macroglobulin
(AMG), α1-protease inhibitor and protease C inhibitor [Christensson et al.,
1990; Christensson and Lilja, 1994; Rannikko et al., 1991].
PSA physiological function is related to the liquefaction of semen coagulum, by the cleavage of Semenogelis [Lee et al., 1989]. It is highly expressed specifically in the prostate gland and secreted into the seminal fluid at concentrations ranging from 0.2 to 5 mg/ml [Sensabaugh, 1978]. Normally, PSA is detected in the blood at very low levels, between 0 and 4 ng/ml [Martins et al., 2002]. Several clinical studies correlated the increased levels of serum PSA with the presence of prostatic adenocarcinoma. During 90’s, PSA has
16
been widely used in clinical practice as the most relevant biomarker in the diagnosis of CaP [El-Shirbiny, 1994]. However, recently it has been accepted that PSA serum level measurement by itself is not a sufficient and specific method to detect the presence of CaP, because of its onset in patients with the complete absence of increasing PSA. On the other hand, some pathological conditions, such as prostate infections, inflammation, benign prostatic hypertrophy or hyperplasia (BPH) could lead to an increase in PSA amount in the blood [Hennessy et al., 2008].
It has been proposed to combine the detection of new molecular biomarkers to PSA serum level measurement, in order to improve its accuracy in the early diagnosis of CaP. New promising biomarkers include: 1) prostate cancer antigen 3 (PCA3); 2) transmembrane protease serine 2:v-erytrhoblastosis virus E26 transforming specific (ets) oncogene homolog gene fusion (TMPRSS2:ERG); 3) specific micro RNAs (miRNAs); 4) circulating tumor cells (CTCs); 5) AR variants; 6) phosphatase and tensin homolog (PTEN). Moreover, two tissue biomarkers tests are commercially available such as Prolaris®, measuring the aggressiveness of CaP by evaluating a panel of 31 cell
cycle progression genes and Oncotype DX®, a quantitative RT-PCR assay
evaluating five housekeeping controls and 12 CaP related genes belonging to four biological pathways with a role in prostate tumorigenesis, as androgen signaling, cell proliferation, cellular organization and stromal response [Filella et al., 2018].
PCA3, an androgen responsive gene, as putative ncRNA could be involved in
transcriptional regulation, RNA splicing, DNA imprinting and demethylation, as well as in carcinogenesis, and it was found to be highly overexpressed in CaP [Bussemakers et al., 1999; Costa, 2005].
17
TMPRSS2:ERG gene fusion plays an important role in prostate tumorigenesis,
contributing to cellular invasiveness in vitro and it has been identified as the most recurrent chromosomal aberration in CaP [Perner et al., 2007; Prensner and Chinnaiyan, 2009].
miRNAs act as post-transcriptional gene regulators in several cellular processes, such as cell differentiation, proliferation, apoptosis and carcinogenesis. An aberrant expression profile of miRNAs was detected in many cancer types, including CaP. In particular, 21, 141 and miR-375 were often found upregulated in urinary exosomes isolated from patients with CaP, compared to healthy subjects [Foj et al., 2017].
CTCs by definition acquired the ability to migrate from the primary tumor site into the blood stream in a process called epithelial-mesenchymal transition (EMT). In CaP early stage, CTCs may be used to predict the risk of generating metastasis or to evaluate therapy response in advanced malignancy [Doyen et al., 2012].
AR-Vs are abnormally truncated isoforms of AR protein lacking the C-terminal domain, with intact N-C-terminal and DNA-binding domains, thus remaining constitutively active, even in the absence of ligands. AR-Vs overexpression, detected in clinical specimens such as blood samples, occurs frequently in castration resistant prostate cancer (CRPC) patients and they have been proposed as potential markers and therapeutic targets [Antonarakis et al., 2016].
PTEN is a tumor suppressor gene that is mutated in several cancer types,
including CaP, or inactivated by epigenetic mechanisms, such as promoter methylation or aberrant expression of miR-21 [Folini et al., 2010; Whang et al., 1998].
18
2.2.3 The molecular biology of Prostate Cancer
The investigation of molecular mechanisms involved in CaP initiation and progression is of great importance for developing early screening methods and selective therapeutic drugs. CaP development is driven by chromosomal alterations consisting of genetic predisposition to mutation of genes, somatic mutations that amplify oncogenes and/or lead to the loss-of-function of tumor suppressor genes. Chromosomal alterations include deletions and duplications. Deletions usually lead to regional loss-of-function, while duplications often result in regional gain-of-function of genes.
Chromosome 8, 13, 7, 10, 16, 6 and 17 are the most frequently altered in CaP [Schulz and Hoffmann, 2009]. A study conducted in 62 prostate cancer patients (53% European American and 47% African American), with mean age of 60.8 years, revealed that chromosome 8 is the most common region of genomic instability, displaying 66% loss-of-function and 19% gain-of-function at 8p locus and 24% loss-of-gain-of-function and 56% gain-of-gain-of-function at 8q locus of all tumors analyzed, with any racial differences [Cheng et al., 2012]. Anyway, besides genetic inheritance, at early stage CaP remains often euploid and numerical and structural abnormalities occur in advanced stages.
Key regulatory genes have been mapped on chromosomal region that undergoes to copy number alterations, such as NKX3.1, a negative regulator of epithelial cell growth in prostate tissue, at 8p21, MYC, a proto-oncogene involved in cell cycle progression, apoptosis and cellular transformation at 8q24, and PTEN, a tumor suppressor gene mutated at high frequency in several tumors, at 10q23 [Taylor et al., 2010].
NKX3.1 loss-of-function represents a frequent and critical event in prostate
cancer initiation, due to its important role in cell differentiation and growth [Abate-Shen et al., 2008].
19
MYC oncogene was found to be highly amplified in a subset of advanced CaP
and nuclear MYC protein is up-regulated in many PIN lesions, from which CaP origins [Gurel et al., 2008; Jenkins et al., 1997].
PTEN undergoes to copy number loss during the early stage of prostate
carcinogenesis and its inactivation has been shown to cooperate with loss-of-function of NKX3.1, up-regulation of MYC proto-oncogene, or the
TMPRSS2:ERG fusion [Carver et al., 2009; Kim et al., 2002, 2009]. PTEN
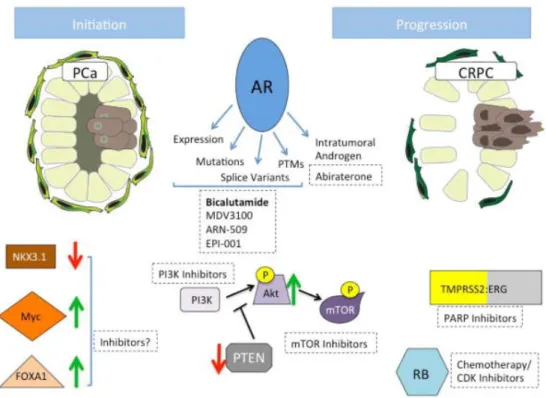
loss-of-function is also related to an up-regulation of the Akt/mTOR signaling pathway, mediated by activation of p110β isoform of phosphoinositide 3-kinase (PI3K) [Hill et al., 2010; Thomas et al., 2004]. The consequence of Akt induction are also mediated by the activation of nuclear factor kappa-light-chain-enhancer of activated B cells (NF-κB) signaling via the stimulation of IκB Kinase (IKK) complex [Dan et al., 2008]. Moreover, analyses of autochthonous transgenic adenocarcinoma of mouse prostate (TRAMP) model and cell lines revealed that nuclear IKKα, one of the two catalitic subunits of IKK complex, enhances CaP metastatic phenotype through down-regulation of maspin, a class II tumor suppressor gene [Luo et al., 2007]. A recapitulation of molecular mechanisms is depicted in Figure 4.
20
Figure 4. Molecules implicated in CaP initiation and progression [Schrecengost and
Knudsen, 2013]
An overexpression of ERG oncogene was found in more than 55% prostate cancer cases and it is driven by the fusion with TMPRSS2 gene, both located on chromosome 21 [Tomlins et al., 2012; Wang et al., 2017]. The most frequent alteration of TMPRSS2 and ERG is gene fusion, a consequence of missense mutations found in both genes [Tomlins et al., 2005; Wang et al., 2017]. TMPRSS2, a prostate-specific and androgen-response gene, encodes a protein belonging to the serine protease family, which functions in prostate carcinogenesis and relies on gene fusion with ets transcription factors, such as
21
encodes a member of the erythroblast transformation-specific family of transcription factors, and is a key regulator of cell proliferation, differentiation, angiogenesis, inflammation and apoptosis [Brenner et al., 2013]. Wang et al. demonstrated that ERG gene silencing significantly affected prostate cancer progression, by inhibiting tumor cell proliferation and by arresting cell cycle progression in G0/G1 stage [Wang et al., 2017].
CaPs are mainly acinar adenocarcinoma, expressing AR. AR gene is located on chromosome X, it is more than 90 kb long and codes for a protein that has 3 major functional domains: the N-terminal domain, DNA-binding domain, and androgen-binding domain. AR gene contains a polymorphic trinucleotide repeat region (CAG)(n) in its N-terminal transactivation domain (NTD) that
encodes a polyglutamine (polyQ) tract. Upon binding the hormone ligand, the receptor dissociates from accessory proteins, translocates into the nucleus, dimerizes, and then stimulates transcription of androgen responsive genes. The most abundant androgen is testosterone, which is synthesized by the testis and converted into the more active metabolite dihydrotestosterone (DHT) in prostate tissue through the activity of 5α-reductase [Thigpen et al., 1993]. Mutations in AR gene are associated with complete androgen insensitivity [Taplin et al., 1995]. A study conducted in the TRAMP model revealed that, among 15 unique somatic mutations, all mutations were single base substitutions, 10 were missense and 5 were silent [Han et al., 2001]. The main mechanism by which mutations lead to abnormalities in AR function is alterations in cofactor binding or reduction in ligand specificity. Somatic missense mutations were found in the polyQ tract. This mutation leads to a reduction in ligand induced N- and C-terminal interaction, but increases receptor activity more than the wild type AR [Buchanan et al., 2004]. It is possible to postulate that enhanced interactions with coactivators may
22
potentiate AR signaling in presence of low levels of circulating androgens or weaker agonists, bringing to a therapy failure. The first AR mutation frequently found in late stage CaPs was a threonine to alanine substitution at aminoacid 877, which leads to a reduction in ligand specificity by altering pocket dimension [Veldscholte et al., 1992].
Circulating androgens are essential for normal prostate homeostasis as well as CaP initiation through their interaction with AR. Androgen ablation therapy, by chemical or surgical castration, proved to be an effective strategy for the regression of prostate tumor, but it has a short-term and the recurrence of aggressive and essentially untreatable CaP is very common, an event termed “castration resistance”. Recent studies demonstrated that PTEN undergoes copy number loss as an early event in prostate carcinogenesis and this abnormality is related to the progression through aggressive, castration-resistant malignancy [Taylor et al., 2010]. Furthermore, an aberrant expression of specific miRNAs was found in castration-resistant prostate cancer, such as miR-125b, which is responsible of Bak1 down-regulation, a pro-apoptotic protein from the Bcl-2 protein family, and miR-221 and miR-222, both targeting p27/kip1, a cell-cycle regulator that blocks the cell cycle in G0/G1
stage [Shi et al., 2007; Sun et al., 2009].
Point mutations, also called somatic single nucleotide variations (SNVs), were found in several genes including FOXA1, TP53, CDKN1B, KRAS and EGF-R [David, 2017].
A variable over-expression of Cyclin D1 among prostate carcinoma cells was observed [Pereira et al., 2014]. Cyclin D1-positive cancer cells show greater motility, increased invasion capability and a hormone-independent phenotype in cell cultures, supporting the hypothesis that cyclin D1 plays an important role in aggressive prostate carcinogenesis [He et al., 2007].
23
Inflammation is highly related to prostate carcinogenesis. Infections deriving from exposure to environmental factors, such as bacterial or viral agent, dietary carcinogens, hormonal perturbation such as altered androgen and estrogen levels or physical trauma lead to chronic inflammation which is causally linked to CaP onset [Sfanos and de Marzo, 2012]. Other aging-associated mechanisms involved in prostate carcinogenesis are oxidative stress and DNA damage, telomere shortening and cellular senescence.
24
2.2.3.1 PC3 and LNCaP cell lines: How androgen sensitivity affects metastatic activity
Human derived PC3 and LNCaP cells are suitable models for prostate cancer studies. PC3 cells were isolated from a vertebral metastatic prostatic tumor in 1979 [Kaighn et al., 1979]. PC3 cell line is hormone-insensitive, lacks of AR and PSA expression at mRNA and protein level and abnormal growth could be attributed to enhanced expression levels of Transforming Growth Factor- α (TGF-α), Epidermal Growth Factor (EGF), and Epidermal Growth Factor Receptor (EGF-R) [Ching et al., 1993]. LNCaP cells were isolated from a human metastatic prostate adenocarcinoma found in a lymphnode [Horoszewicz et al., 1980]. LNCaP cells express AR, but they contain a T877A mutation in the AR coding sequence that enhances binding affinity for several steroid compounds [Veldscholte et al., 1990].
In absence of ligand, AR is located in the cytoplasm, associated with heat shock proteins (HSPs), cytoskeletal proteins and other chaperones. Androgen pathway activation is mediated by androgens as testosterone or its activated form, DHT. Upon ligand binding, a conformational change in AR occurs and helices 3, 4 and 12 within the ligand-binding domain (LBD) form the activation function 2 (AF2) binding surface. The amphipathic structure of helix 12 is positioned across the ligand-binding pocket, reducing ligand dissociation. As result of this conformational change AR dissociates from HSPs, interacts with co-regulators such as filamin-A, importin-α and AR-associated protein 70, ARA70, by binding to the AR nuclear localization signal (NLS). This event enhances nuclear targeting of AR and the consequent nuclear dimerization (Figure 5).
25
Figure 5. Classic AR activity via androgen [Sampson et al., 2013]
Several other co-activators bind to AR in the nucleus and the AR-DNA binding domain, AR-DBD, facilitates nucleic acid binding at androgen responsive elements (ARE), which promote recruitment of co-activators with histone acetyltransferase (HAT) activity (CBP/p300, P/CAF), via SRC/p160 co-activator family members, resulting in chromatine remodelling. Chromatin remodelling in turn allows binding of TATA binding protein (TBP) followed
26
by general transcription factors (GTF) and RNApolII to begin transcription. Non-ligand bound AR can shuttle back to the cytoplasm and recovered in preparation for further ligand binding or can be processed for proteosomal degradation mediated by ubiquitination under E3 ubiquitin ligase control. The nature of AR-bound ligands determines the stability of AR-DNA complexes and the amount of transcription [Bennett et al., 2010]. AR mediates cell proliferation, differentiation and apoptosis, as well as the secretory activity of proteins such as PSA.
Somatic mutations in metastatic CaPs and CPRCs have been found at the level of LBD of the AR [Yeh et al., 1998]. Mutated AR is susceptible to be bound and activated by several steroids and other molecules, which increase AR nuclear activity as indicated by an accumulation of AR dimers in the nucleus. The main mechanism by which PC3 and LNCaP display different metastatic properties regard the absence of AR expression in PC3 and its mutation in LNCaP cells. In particular, PC3 cells lack AR expression, and their metastatic features are regulated by elevated levels of EGF and EGF-R. PC3 cell proliferation is also stimulated by TGF-α. EGF and TGF-α both bind to EGF-R [Jarrard et al., 1994; Sherbet, 2011]. T877A AEGF-R mutation in LNCaP cells reduces binding specificity to its natural androgen ligand, so other molecules such as progesterone, estrogens, growth factors and many antiandrogens can also activate the protein. Among growth factors, enhanced Insulin Growth Factor-1 (IGF-1) and EGF binding to AR increases receptor signaling in cell proliferation, leading to an induction of metastatic activity [Culig et al., 1994].
27
2.3 Maspin (MAmmary Serin Protease INhibitor): An unusual member of Serpins superfamily
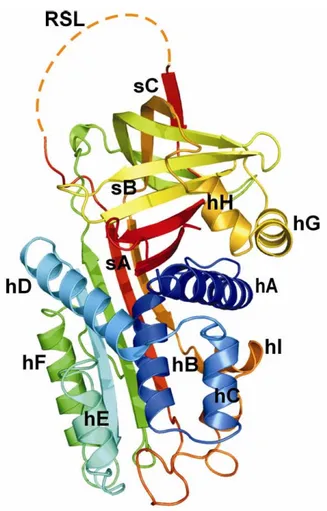
Maspin (MAmmary Serin Protease INhibitor or SerpinB5) is a 42 kDa protein, non-classical member of the ovalbumin clade of SERine Protease INhibitors (Serpins), with a lenght of 375 aminoacids (RefSeq ID: NM_002639). In humans the gene is located on chromosome 18 in a cluster containing genes for other Serpins such as Squamous Cell Carcinoma Antigen (SCCA) 1 and 2 and Plasminogen Activator Inhibitor type 2 (PAI-2) [Law et al., 2006]. Although Maspin shares a common structure with classical Serpins, the reactive site (or center) loop (RSL or RCL) possesses a non-standard hinge region, on the N-terminus of the RSL, which prevents it from undergoing a critical structural change from the stressed (S) to relaxed (R) state. This uncommon feature prevents Maspin from being able to trap and inhibit serine proteases [Narayan and Twining, 2010]. Maspin consists of nine α-helices (helix A-I) and three β-sheets (sheets A-C) and adopts the native Serpin fold with the RLS fully expelled from the A β-sheet, exhibiting a high grade of flexibility. The RSL of Maspin is unique in length, structure and position. Although the RSL is exposed and cleaved by some proteases, it functions in the uncleaved form. The RSL makes minimal contacts with the core of the protein and is very flexible. A buried salt bridge causes an unusual bulge in the region of the D and E α-helices, an area demonstrated to be important for cofactor recognition in many other Serpins. Additionally, intact Maspin can undergo a major conformational change in the G α-helix and adjacent sequences, switching between an “open” and “closed” (Figure 6) conformation, thereby altering the electrostatic properties of a presumptive cofactor binding surface of the molecule, which may affect its function [Law et al., 2005].
28
Maspin has been characterized as a class II tumor suppressor gene in many cancer types, among them CaP, in which even though its expression is down-regulated, it is not mutated. Its anti-tumor ability is due to the inhibition of cancer cell invasion, attachment to extracellular matrices, increased sensitivity to apoptosis and inhibition of angiogenesis [Bailey et al., 2006].
29
2.3.1 Maspin molecular and biological functions in normal development
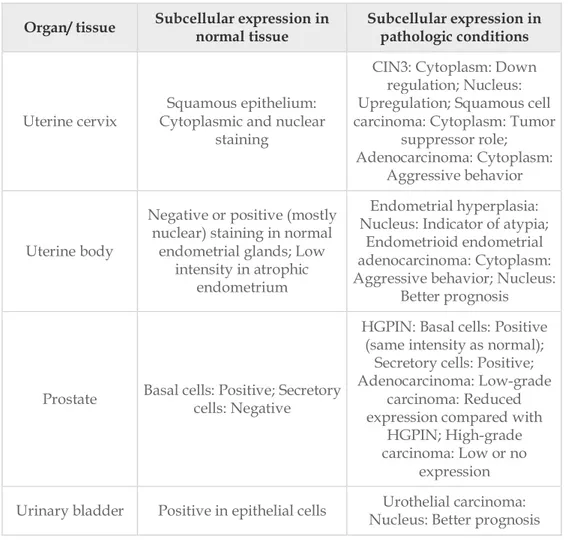
In order to understand the role of a tumor suppressor protein in cancer it is often useful to clarify its mechanism in physiological conditions. Maspin expression has been found in multiple tissues including epithelium of the breast, prostate, epidermis and lung and in the stromal cells of the cornea (Table 1) [Ngamkitidechakul et al., 2001; Reis-Filho et al., 2002; Yatabe et al., 2004].
Organ/ tissue Subcellular expression in normal tissue Subcellular expression in pathologic conditions
Placenta
Cytoplasm: Syncytio- and cytotrophoblasts, and endothelial cells; Nucleus:
Chorionic plate
Preeclampsia: Upregulation
Mammary gland
Cytoplasm: Myoepithelial cells (intense in pregnancy and lactation); Nucleus:
Myoepithelial cells
Invasive breast cancer: Maspin positivity is more
frequent in ductal than lobular carcinomas; Cytoplasm only: Negative prognostic indicator, ER and
PgR negativity; Nucleus: Better prognosis, ER and PgR positivity; Negativity: Loss or
cytoplasm to nuclear translocation in metastatic
tissue
Ovary Negative
Benign tumors: Negative or infrequent nuclear; Ovarian carcinomas: Cytoplasm only:
Cisplatin sensitivity; Mixed expression (cytoplasm and
nucleus): Indicator of low malignant potential
30
Organ/ tissue Subcellular expression in normal tissue Subcellular expression in pathologic conditions
Uterine cervix Cytoplasmic and nuclear Squamous epithelium: staining
CIN3: Cytoplasm: Down regulation; Nucleus: Upregulation; Squamous cell carcinoma: Cytoplasm: Tumor
suppressor role; Adenocarcinoma: Cytoplasm:
Aggressive behavior
Uterine body
Negative or positive (mostly nuclear) staining in normal
endometrial glands; Low intensity in atrophic
endometrium
Endometrial hyperplasia: Nucleus: Indicator of atypia;
Endometrioid endometrial adenocarcinoma: Cytoplasm: Aggressive behavior; Nucleus:
Better prognosis
Prostate Basal cells: Positive; Secretory cells: Negative
HGPIN: Basal cells: Positive (same intensity as normal);
Secretory cells: Positive; Adenocarcinoma: Low-grade
carcinoma: Reduced expression compared with
HGPIN; High-grade carcinoma: Low or no
expression Urinary bladder Positive in epithelial cells Nucleus: Better prognosis Urothelial carcinoma:
Table 1. Maspin expression in placenta, mammary gland and urogenital organs [Banias et
al., 2019]
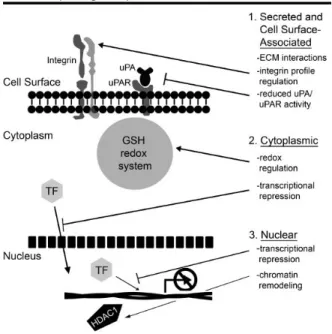
At cellular level, Maspin has been found in the cytoplasm, in the nucleus, at cell surface or secreted by extracellular vesicles [Pemberton et al., 1997; Reis-Filho et al., 2001; Zou et al., 1994]. Its different subcellular localization is related to its heterogeneous functions (Figure 7).
31
Figure 7. Possible function of Maspin depending on its cellular localization [Bailey et al.,
2006]
Maspin interacts with several intracellular proteins, such as heat shock proteins (Hsp90 and Hsp70), glutathione S-transferase (GST), interferon regulatory factor 6 (IRF6), early growth response protein 1 (Egr-1), GCrich-binding factor 2 (GCF2) and histone deacetylase 1 (HDAC1).
Hsp90 and Hsp70 are important stress-related proteins that primarily act in hormonal regulation by binding and maintaining the native conformation of AR in the cytoplasm in absence of ligands. Furthermore, Hsp90 and Hsp70 are involved in apoptotic process, thus it has been demonstrated that Maspin interaction plays an important role in the regulation of AR signaling and cell sensitivity to apoptosis upon binding with heat shock proteins [Jones et al., 2004; Müller et al., 2005].
32
Maspin is an important regulator of cellular response to oxidative stress. An enzyme of the glutathione (GSH) redox system, glutathione S-transferase (GST) has been found to be a putative Maspin interacting protein [Yin et al., 2005]. The GSH redox system is essential in protecting cells against oxidative damage, thus Maspin has a role in reducing the amount of reactive oxygen species (ROS) generated during oxidative stress. ROS generation is also related to hypoxia-induced angiogenesis and GST regulation defines the role of Maspin as an anti-angiogenic molecule [Zhang et al., 2000].
Maspin plays an important role in the EMT biology, an important process associated with embryo implantation, embryogenesis and organ development, as well as tumor invasiveness and metastasis [Kalluri and Weinberg, 2009]. It has been reported a specific interaction between Maspin and IRF6, a member of IRF family associated to EMT, through the increase of N-cadherin, a cell adhesion protein [Bailey et al., 2005].
Maspin acts also at transcriptional level. It has been found an association between Maspin and EGR1 and GCF2. Egr1 is a protein required for differentiation and morphogenesis and it is an immediate response molecule to tissue injury and cellular stress, whereas GCF2 is a transcriptional repressor induced by tissue damage and it is known to down-regulate the transcription of EGF-R, PDGF-A and TGF-α [Shankar et al., 2016]. The regulation of transcription is often associated to chromatin remodeling. Maspin interaction and inhibition of HDAC1 specifically upregulates genes promoting cell differentiation, cell cycle arrest or cell death and down-regulates genes involved in cell survival and EMT [Li et al., 2006].
33
2.3.2 The role of Maspin in tumor cells
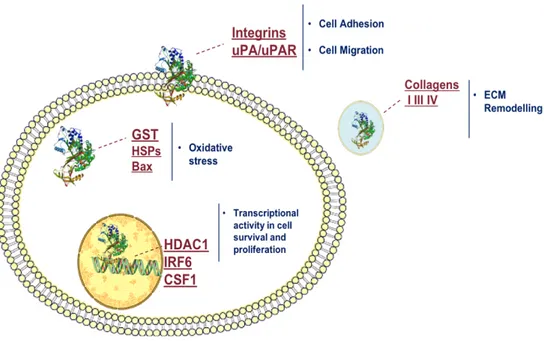
Maspin was initially identified as a candidate tumor suppressor gene with a potential role in human breast cancer, due to its expression in normal mammary epithelial cells but not in most mammary carcinoma cell lines [Zou et al., 1994]. Maspin expression seems to be correlated with better prognosis in prostate, bladder, lung, gastric, colorectal, head and neck, thyroid and melanoma cancers. In prostate, breast and ovarian cancers Maspin relevance is related to its nuclear localization localization (Figure 8) [Berardi et al., 2013].
Figure 8. Schematic representation of the role of Maspin in tumor cells depending on its
subcellular localization
It has been found that aberrant cytosine methylation and chromatin condensation of maspin promoter enhance Maspin silencing during cancer
34
development [Maass et al., 2002]. Maspin expression is differently regulated at transcriptional level: within the maspin promoter two cis elements, ets and hormonal responsive element (HRE), are present. In normal epithelial cells the
ets element positively regulates Maspin expression, but it is inactive in tumor
cells. AR can recognize and bind to the HRE which acts as a negative element, inhibiting the activity of maspin promoter [Zhang et al., 1997].
Maspin has been localized also in the Extracellular Matrix (ECM), where it interacts with and induces the expression of α5- and α3-containing integrins and reduces the levels of α2-, α4-, α6-, α(v)-, and some β1-containing integrins in metastatic human breast carcinoma cell line MDA-MB-435, stimulating cell adhesion and consequently inhibiting cell metastasis and invasion [Seftor et al., 1998]. Other potential binding proteins, whose regulation is involved in metastatic process, include type I, III and IV collagen and laminin [Blacque and Margaret Worrall, 2002; Ngamkitidechakul et al., 2001]. Extracellular Maspin interacts also with cell-surface-associated urokinase plasminogen activator, uPA, and its receptor uPAR, which converts plasminogen to plasmin, reducing the steady-state levels of both mRNA expression. The block of uPA and uPAR results in inhibition of pericellular proteolysis, correlated with significantly decreased cell invasion potential and motility [Biliran H. and Sheng, 2001]
Cytosolic relevance of Maspin has been linked to its ability to induce apoptosis. Maspin up-regulates the apoptotic inducer Bax, which in turn shuttles from the cytosol to the mitochondria. Bax stimulates the release of cytochrome c and Smac/DIABLO from the mitochondria into the cytosol. The cytochrome c release leads to APAf-1 mediated apoptosome assembly and a rapid activation of caspase-9, whereas Smac/DIABLO interacts with inhibitors of apoptotic proteases, blocking their inhibitory effects on activated caspase-9
35
and caspase-3 [Liu et al., 2004]. Nuclear Maspin anti-tumor activity relies on its mediation in the crosstalk between the tumor cells and the components of tumor microenvironment. It is associated with chromatin and is recruited to the promoter of the gene encoding the cytokine Colony-Stimulating Factor-1 (CSF-1), an important cytokine altered during metastatic process, significantly inhibiting its expression [Goulet et al., 2011]. Maspin interacts with IRF6 and HDAC1, which modulate the expression of key genes involved in the inhibition of tumor growth and angiogenesis. Maspin/HDAC1 interaction was confirmed in human prostate tissues and in prostate cancer cell lines. Following a molecular interaction, Maspin inhibits HDAC1 and leads to an increase of its target genes, such as Bax, Cytokeratin 18 (CK18) and
36
3 AIM OF THE WORK
The effects of two glucosamine-derivatives have been widely investigated previously in or laboratory. In particular, glucosamine (GlcN) and its glucosamine-derivative, 2-(N-Acetyl)-L-phenylalanylamido-2-deoxy-β-D-glucose (NAPA), designed and synthesized in our laboratory, showed a good anti-inflammatory activity, affecting MAPK pathway by the inhibition of p38 and JNK kinases, and in turn interfering with AP-1 pathway [Giordano et al., 1991; Scotto d’Abusco et al., 2007a, 2007b]. GlcN and mainly NAPA were also able to inhibit NF-κB pathway, particularly by inhibiting IKKα kinase activity and its translocation into the nucleus [Scotto d’Abusco et al., 2010]. Michael Karin, 2009 reported that inflammation enhances tumor promotion through NF-κB dependent mechanisms. NF-κB transcriptional factors are under control of IKK complex. In particular, the nuclear role of IKKα, one of the two catalytic subunits of IKK complex, has been correlated to cancer progression through the inhibition of Maspin expression [Luo et al., 2007]. In order to find a glucosamine derivative more effective than NAPA in inhibiting IKKα nuclear translocation, a new and more hydrophobic glucosamine-derivative, 2-(N-Carbobenzyloxy)-L-phenylalanylamido-2-deoxy-β-D-glucose (NCPA), was tested. As predicted by bioinformatic models, NCPA revealed to be more effective than NAPA in inhibiting IKKα nuclear translocation and it was also able to enhance Maspin production and its nuclear localization in an osteosarcoma cell line, 143B [Leopizzi et al., 2017].
Maspin was found to be highly expressed in normal prostatic epithelial cells and its expression is almost completely suppressed in metastatic prostatic cells, such as PC3, LNCaP and DU145. It displays heterogenous functions
37
depending on its subcellular localization, with an onco-suppressor role when it is located into the nucleus [Berardi et al., 2013; Yu et al., 2006]. Moreover, Maspin has been found to be highly expressed in tumor specimens from patients treated with neoadjuvant androgen ablation therapy [Zou et al., 2002]. On the other hand, patients with Maspin expressing prostate cancer had a significantly longer survival rate, suggesting a role for Maspin expression as a good prognosis biomarker [Berardi et al., 2013].
Thus, Maspin expression and its nuclear localization have been correlated to a more positive evolution of CaP.
Considering the ability of NCPA to stimulate Maspin production both at mRNA and protein level and to enhance its nuclear localization in a very aggressive osteosarcoma model, the aim of the present study was to evaluate the ability of NCPA to interfere with metastatic properties of two prostate cancer cell lines, the insensitive PC3 cell line and the hormone-sensitive LNCaP cell line, which represent good models to study the progression of CaP, due to their different metastatic origin and aggressiveness features related to their Maspin relative expression.
38
4 MATERIALS AND METHODS
4.1 Cell culture
Human prostate carcinoma cell lines PC3 and LNCaP, obtained from the American Type Culture Collection (ATCC, Rockville, MD, USA), were used. Cells were cultured in Roswell Park Memorial Institute (RPMI) 1640 Medium supplemented with 10% fetal bovine serum (FBS), 1% L-glutamine, 1%
sodium pyruvate, 1% penicillin/streptomycin solution of 10,000 U/mL penicillin and 10 mg/mL streptomycin (Sigma Aldrich, St. Louis, MO, USA). Both cell lines were cultured at 37 °C and 5% CO2 according to ATCC
recommendations. Experiments were performed using 80% confluent monolayer cells.
4.2 Cell treatment
Cells were left untreated (CTL) or treated with 0.5 mM 2 - (N - Carbobenzyloxy) - L - phenylalanylamido - 2 - deoxy - β - D-glucose (NCPA),
a glucosamine-derivative synthesized in our laboratory [Giordano et al., 1991]. For AR inhibition, cells were pre-treated overnight with 120 µM Bicalutamide (Sigma Aldrich, St. Louis, MO, USA) and then treated with 0.5 mM NCPA plus 40 µM Bicalutamide for the required time points.
4.3 Cell viability
To assess a potential cytotoxic effect of NCPA on PC3 and LNCaP cells at different concentration and time points, MTS (3 [4,5 dimethylthiazol 2 -yl] - 5 - [3-carboxymethoxyphen-yl] - 2 - [4 - sulfophen-yl] - 2H-tetrazolium) based colorimetric assay was performed (Promega Corporation, Madison, WI, USA). Briefly, 1 × 10³ PC3 cells and 3 × 10³ LNCaP cells per well, according
39
to growth rate, were seeded in a 96-well plate. The day after seeding, cells were starved overnight in reduced serum medium, in order to align cell cycle progression. Cells were then left untreated (CTL) and NCPA or Bicalutamide plus NCPA treated for 24h, 48h and 72h. After each time point, 100 µl MTS solution was added to the wells. Spectrophotometric absorbance was directly measured at 492 nm after 3h incubation. Cells were monitored at 24h, 48h and 72h under optical microscope, by Leica DM IL LED using AF6000 modular Microscope.
4.4 RNA extraction and reverse transcription
Total RNA was extracted using TRIZOL reagent (Invitrogen, Thermo Fisher Scientific), purified using micro TNeasy column (Qiagen, Valencia, CA, USA) and reverse transcribed by TetroReverse transcriptase enzyme, (Bioline, London, UK), according to the manufacturers’ instructions.
4.5 Quantitative Real-Time-PCR (q-RT-PCR)
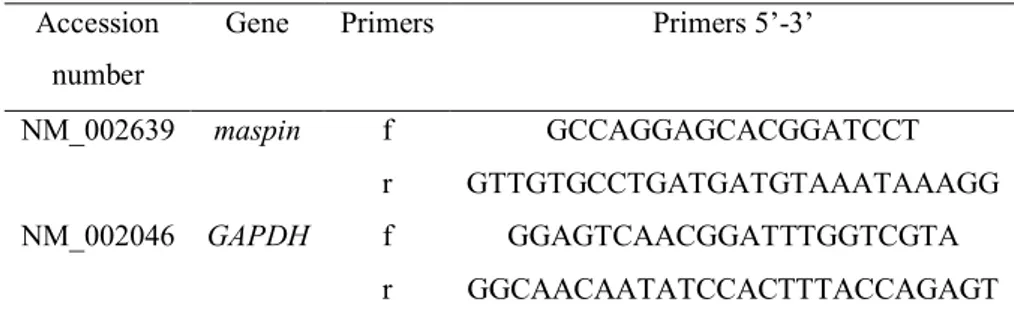
Quantitative-Real Time-PCR analysis was performed using an ABI Prism 7300 (Applied Biosystems, Thermo Fisher Scientific). Amplification was carried out using SensimixPlus SYBR Master mix (Bioline). Primers were designed using Primer Express software (Applied Biosystems) and synthesized by Biofab Research (Rome, Italy) (Table 2). Relative expression levels were normalized with glyceraldheyde-3-phosphate dehydrogenase (GAPDH) as housekeeping gene. Data were analyzed by 2−ΔΔCt method
40
Accession number
Gene Primers Primers 5’-3’
NM_002639 maspin f GCCAGGAGCACGGATCCT r GTTGTGCCTGATGATGTAAATAAAGG NM_002046 GAPDH f GGAGTCAACGGATTTGGTCGTA
r GGCAACAATATCCACTTTACCAGAGT
Table 2. GeneBank accession number and sequence of primers used to
analyze gene expression by q-RT-PCR
4.6 Protein extraction, SDS-PAGE and Western blotting
Cells, untreated and treated as previously described, were washed with phosphate buffer saline (PBS) and lysated by Nuclear Extract Kit (Active Motif, CA, USA), which allowed to separate the cytosolic from nuclear extract, in accordance with manufacturer’s instructions. Extracts were resolved on Mini-protean TGX precast gels by SDS-PAGE and transferred to PVDF membranes (Bio-Rad Laboratories, Hercules, CA, USA). Membranes were blocked in 3% Bovine Serum Albumine (BSA) solution in Tween Tris Buffer Saline (TTBS), under gentle shaking, for 1h and then probed with specific antibodies, anti-Maspin, purchased from BD Pharmingen (BD Biosciences, San Jose, CA, USA) and anti-Fibrillarin from Santa Cruz (Santa Cruz Biotechnology Inc., CA, USA), according to the manufacturers’ instructions. Nuclear proteins were detected by Chemi-Doc system (Bio-Rad) and signal quantification was performed by ImageLab software.
41 4.7 Immunocytochemistry
Immunostaining was performed by an automated staining system (Ventana BenchMark ULTRA, Roche diagnostic, Monza-Italy) in accordance with the manufacturer’s instructions. Antigen epitopes were retrieved using Ventana Benchmark CC1 standard program. The antibody anti-cyclin D1 (rabbit monoclonal clone SP4-R; Ventana Medical Systems, Inc.) was incubated for 60 minutes at 37 °C. The slides were counterstained with hematoxylin, mounted and analyzed with Leica LAS V3.8 Software (Leica Microsystems, Switzerland) associated with the Leica DMRB microscope.
4.8 Fluorescence in situ hybridization (FISH)
FISH analysis for CCND1 (Cyclin D1) gene copy number was performed using SPEC CCND1/CEN 11 Dual Color Probe ZytoLight (ZytoVision GmbH, Germany). CCND1 gene was labeled with green fluorophore, and CEN11 (centromere) was labeled with orange fluorophore, following the manufacturer’s protocol. For each specimen, at least 100 intact non-overlapping cells with good signals were analyzed. FISH images were acquired at 63x magnification utilizing Leica DM 6000B fluorescence microscope (Leica Microsystems, Switzerland) equipped with DAPI, SpectrumGreenTM, SpectrumOrangeTM filters. Images were processed by
Leica LAS V3.8 Software (Leica Microsystems, Switzerland) to obtain a quantitative analysis of genes.
4.9 Transmission electron microscopy (TEM)
Cells, after each treatment, were immediately fixed in 2.5% cacodylate-buffered glutaraldehyde, pH 7.3, for 2h at 4°C and pelleted by centrifugation
42
at 1200 rpm for 5 minutes at room temperature. Samples were washed overnight in cacodylate buffer, post-fixed in buffered 1% osmium tetroxide for 1h, dehydrated through a graded series of acetone and embedded in Epoxy resin (Araldite, Fluka). Semithin sections (1µm), were cut with a glass knife on Leica EM Uc7 Ultratome, stained with toluidine blue and examined by light microscope for a general evaluation of cells morphology. Ultrathin sections were cut with a diamond knife (Diatome) at 60-80 nm, retrieved onto copper grids, double stained with Uranyl Acetate Replacement Stain (UAR-EMS) and lead citrate and examined at 100 kV with a Philips EM208 S electron microscope.
4.10 Immunofluorescence
The distribution of mitotic spindles and centrosomes in untreated (CTL) and NCPA-treated PC3 and LNCaP cells was detected using a monoclonal antibody to acetylated α-tubulin and a polyclonal antibody to γ-tubulin, respectively. Samples were fixed with 4% paraformaldehyde for 10 min at 4°C, washed with PBS, permeabilized with 0.3% Triton X-100 for 30 min at room temperature, blocked with NGS for 1 hour at room temperature. For double labeling, the mouse anti-acetylated α-tubulin (clone 6-11B-1, 1:800; Aldrich, Milano, Italy) and the rabbit anti–γ-tubulin (1:800; Sigma-Aldrich, Milano, Italy) antibodies were concomitantly incubated overnight at 4°C. After thorough washing, samples were incubated with goat anti-mouse conjugated to Alexa 594 and goat anti-rabbit conjugated to Alexa 488 (Alexa Fluor SFX Kit, Molecular Probe, Invitrogen, Carlsbad, CA, USA) for 1h at room temperature. After a final wash step in PBS, cells were stained with DAPI and observed with a Leica DMRB microscope, associated with Leica LAS V3.8 Software (Leica Microsystems, Switzerland).
43 4.11 Flow cytometry
Cell cycle progression and apoptosis/necrosis pattern were analyzed by flow cytometry. Cells were digested with trypsin and harvested. Then, cells were pelleted at 800 g for 10 minutes at 25°C, resuspended in PBS and fixed in PBS plus 70% ethanol for 10 min at 4°C. After washing, cells were incubated with RNase A (50 µg/mL) for 30 minutes at 37 °C, sequentially stained with propidium iodide (100 µg/mL) for 1h and analyzed by BD Accuri C6 flow cytometer (BD Bioscience, Milano, Italy), to evaluate the cell cycle progression. The apoptosis/necrosis assay was performed using Annexin V-FITC kits (Immunological Sciences), according to the manufacturer’s instructions.
4.12 Statistics
All data were obtained from at least three independent experiments, each performed either in duplicate or in triplicate. Data were statistically analyzed with two-way repeated measures analysis of variance (ANOVA) with Bonferroni's multiple comparison test, using Prism 5.0 software (GraphPad Software, San Diego, CA, USA). P value < 0.05 was considered significant.
44
5 RESULTS
5.1 Effect of NCPA on cell viability
NCPA dose-response and time-course effect on cell viability was determined after exposure of PC3 and LNCaP cells to 0.1, 0.5 and 1 mM NCPA concentrations for 24h, 48h and 72h. Cell viability was measured performing an MTS assay. NCPA showed a cytotoxic effect on PC3 cell viability at 1mM concentration at all time points analyzed; it showed a mild detrimental effect at 0.5 mM both at 24h and 48h, and a major detrimental effect at 72h; finally, it resulted unable to induce any cytotoxic effect at 0.1 mM concentration at any time point. NCPA did not affect LNCaP cell viability at any time point and concentration used (Figure 9A). Furthermore, PC3 cells treated with 0.5 mM NCPA and observed under optical microscope, showed a decrease in cell number and a morphology change, whereas, in the same condition, LNCaP showed any change in cell number or morphology (Figure 9B). For further analyses, we decided to use 0.5 mM concentration, which is the concentration that induced approximately 50% reduction in cell viability in PC3 after 72h treatment and it is also the same concentration used in previous studies on osteosarcoma cell line [Leopizzi et al., 2017].
45
Figure 9. Effect of NCPA on cell viability. A: Cell viability was assessed by MTS
(3-[4,5-dimethylthiazol-2-yl]-5-[3-carboxymethoxyphenyl]-2-[4-sulfophenyl]-2H- tetrazolium) based colorimetric assay. Cells were left untreated (CTL) or treated with 0.1, 0.5 and 1 mM NCPA, for 24h, 48h and 72h; B: Representative images of cells untreated (CTL) or treated with 0.5 mM NCPA for 24h, 48h and 72h. Experiments were repeated at least three times. Photographs were taken with Leica DM IL LED using AF6000 modular Miscroscope (original magnification 20x).
46
5.2 Effect of NCPA on Maspin production
Maspin has been described to play an important role as tumor suppressor protein when it is localized into the nucleus. To determine the ability of NCPA to enhance Maspin production and nuclear localization in PC3 and LNCaP, we analyzed cells treated with 0.5 mM NCPA at different time points by Western Blot. Nuclear extracts from NCPA-treated samples showed a significant increase of Maspin production after 24h treatment (p<0.05), which restored to control level after 48h and 72h treatment, in PC3 cell line (Figure 10A). NCPA showed no effect on Maspin production and nuclear localization in LNCaP cell line at any time point (Figure 10B).
The increase in Maspin protein level in PC3 was consistent with its transcriptional up-regulation. In fact, the abundance of maspin was being significant greater after 24h treatment, compared with CTL (*p<0.05) but did not differ from 48h and 72h (Figure 10C). According to protein expression, in LNCaP cells, NCPA was not able to induce maspin mRNA expression level at any time point analyzed (Figure 10D).
47
Figure 10. NCPA enhances Maspin production in PC3 cells. A: Proteins from PC3 cells, untreated (CTL) or treated
with 0.5 mM NCPA for 24h, 48h and 72h, were extracted and nuclear extract was analyzed by Western blot, using anti-Maspin antibody and anti-Fibrillarin as loading control. Bar graph represents the densitometric analysis of positive bands normalized using the amount of fibrillarin; B: LNCaP cells were treated, extracted and analyzed as described in A; C: PC3 cells and D: LNCaP cells, treated as described in A, were harvested and mRNA was extracted and analyzed by RT-PCR. Data are expressed as mRNA level calculated by 2−ΔΔCt method with respect to GAPDH mRNA. Results represent the mean ± S.E.M. of data obtained by three independent experiments. Statistical significance was: *p < 0.05.
48
5.3 Effect of NCPA on cell cycle progression and cell proliferation
Tumor suppressor molecule Maspin is involved in the inhibition of cell motility, invasion, metastasis and apoptotic process. Considering that NCPA was able to stimulate Maspin production in PC3 and not in LNCaP cell line, we evaluated the effect of this molecule on cell cycle progression in both cell lines by flow cytometry. The percentage of NCPA-treated PC3 cells in subG1 (G0/G1) stage increases progressively at 24h (15.1%), 48h (16.7%) and remained stable at 72h (13.7%), whereas the percentage in G1 increased al all time analyzed, at 24h (59.8%), 48h (65.3%, p<0.05) and mainly at 72h (69.8%, p<0.05), alongside, percentage of cells in S (12.9% at 24h, 7.4% at 48h and 7.1% at 72h, p<0.005 for all time point analyzed) and G2/M (12.2% at 24h, 10.6% at 48h and 9.4% at 72h, p<0.05 for 48h and 72h) stages decreased (Figure 11A). The percentage of LNCaP cells was almost the same in untreated and treated samples at each time point, with no detectable subG1 (G0/G1) cells (Figure 11B). The statistical analysis was performed comparing treated cells to untreated ones (Figure 11C).
49
Figure 11. Effects of NCPA on cell cycle progression. A: PC3 Cells, untreated (CTL), or treated with 0.5 mM NCPA
for 24h, 48h and 72h were analyzed by flow cytometry, after treatment cells were harvested and stained with propidium iodide and analyzed with BD Accuri C6 flow cytometer. The percentage of cells in subG1, G1, S and G2/M stages is indicated; B: LNCaP cells were treated and analyzed as in A. C: Statistical analysis conducted comparing the treated cells to untreated one (* = p < 0.05).
50
5.4 Effect of NCPA on cyclin D1 (CCND1) gene amplification
Cyclin D1 protein is one of the major regulator of cell cycle progression. Thus, we analyzed the presence of this protein in untreated and treated cells, by immunocytochemistry, finding that Cyclin D1 was present in large amount in untreated PC3 cell nuclei, and was decreased in NCPA-treated PC3 cell nuclei, according to cell cycle arrest observed. Consistently with cell cycle analysis, LNCaP showed very low amount of Cyclin D1 levels in untreated and treated cells, respectively (Figure 12A and 12B). Cyclin D1 protein overexpression has been shown to be significantly associated to high CCND1 gene amplification, for this reason we analyzed the CCND1 amplification by FISH [Bubendorf et al., 1999]. Kim et al., 2017a defined “gene amplification” as > 6 gene copies per nucleus in gastric cancer and Turner et al., 2017 found 4–10 CCND1 gene copies per nucleus in PC3 cell line. We analyzed CCND1 gene copy number in 100 nuclei both in untreated and treated PC3 cells or LNCaP cells. A representative image of all analyzed samples is reported (Figure 12C). Comparing the average of CCND1 gene amplification in both cell lines, we observed that CCND1 average is decreased in PC3 treated cells, whereas CCND1 average was unchanged in LNCaP treated cells compared with untreated ones (Figure 12D). Amplification of CCND1 gene was detected in 40% of PC3 untreated cells, whereas in NCPA-treated cells only in 4% of cells. Conversely, in LNCaP untreated cells, amplification of CCND1 was observed in 12% of cells, while in NCPA-treated cells was observed in 7% of cells (Figure 12E).
![Figure 1. Overview of human prostate [Cunha et al., 2018]](https://thumb-eu.123doks.com/thumbv2/123dokorg/2890896.11238/9.892.275.609.602.845/figure-overview-human-prostate-cunha-et-al.webp)
![Figure 2. Differentiated cell types in the prostate [Toivanen and Shen, 2017]](https://thumb-eu.123doks.com/thumbv2/123dokorg/2890896.11238/10.892.261.629.695.890/figure-differentiated-cell-types-prostate-toivanen-shen.webp)
![Figure 5. Classic AR activity via androgen [Sampson et al., 2013]](https://thumb-eu.123doks.com/thumbv2/123dokorg/2890896.11238/26.892.167.729.102.622/figure-classic-ar-activity-androgen-sampson-et-al.webp)