Development of a new device for the
measurement and modeling of an innovative
Risk Index for Cultural Heritage application
Faculty of Civil and Industrial Engineering Department of Mechanical and Aerospace Engineering
Industrial and Management Engineering – XXXI cycle
Supervisors Ph.D. Candidate
Prof. Paolo Cappa Livio D’Alvia
Prof. Zaccaria Del Prete
INTRODUCTION 6
STATE OF ART 9
ENVIRONMENTAL PARAMETERS AND EFFECTS 15
PART 2: LABORATORY TESTS 20
INTRODUCTION 22
MATERIALS AND METHODS 24
HARDWARE 24
DESIGN OF HARDWARE AND SOFTWARE 28
EXPERIMENTAL PROCEDURE 30
RESULTS AND DISCUSSIONS 35
RESULTS OF SHOCK AND TILT DETECTION 35
ENVIRONMENTAL AND POLLUTION DETECTION 47
CONCLUSIONS 49
PART 3: APPLICATION ON SITE 51
INTRODUCTION 52
MATERIALS AND METHODS 55
FIRMWARE 55
RISK ANALYSIS 57
APPLICATION SITE 62
RESULTS AND DISCUSSION 65
CONCLUSION 72
SUMMARY AND GENERAL DISCUSSION 73
APPENDIX 75
APPENDIX A - CODE 75
APPENDIX B – OTHER RESEARCH 82
REFERENCES 87
ACADEMIC RESULTS 99
CONFERENCE 99
AWARDS 99
Finere il dottorato senza sentire più quella voce per la quale ero “sempre più alto” o semplicemente “brutto”.
Part 1: Background
This section contains a brief general survey about the air quality monitoring and a more specific survey on Cultural Heritage.
The monitoring, as a function of time, of environmental parameters in cultural heritage is essential to preserve materials, to recognize the reasons of degradation and to evaluate their effects.
The degrading effects of objects in cultural heritage field, can be classified in optical, morphological, physical-chemical/mechanical and alterations and depend by micro-climatic conditions. For this reason, in recent years, several solutions have been developed and commercialized for environmental monitoring, some compatible with general advice and others OEM (Original Equipment Manufacturing). However, the trend of application between compliant and non-ISO-compliant devices has not yet been sufficiently analyzed.
In this first section, we show how in the last ten years researchers have shifted their attention to custom-made devices based on new generation sensors despite the expense of units ISO certified.
The study based on a review of scientific articles has shown that: with the increase of low-cost and open-source technologies applied in the Environmental Impact Assessment (EIA) and in particular in the cultural heritage, led to a research advancement in the field, but, at the same time, increased non-homogeneity of the methods, impinging comparability of results.
In recent years the trend is to use low-cost automatic wireless systems. This innovation, however, opens new scenarios and challenges on how to improve their stability, longevity and sensitivity; reduce maintenance (battery replacement, including calibration or sensors); improve data analysis/management/display costs. In particular, it has highlighted the current difficulty of low-cost detectors to satisfy the robustness and reliability of regulatory and conventional stationary monitors at the expense of the
periods and aesthetics. We have therefore paid particular attention to the sensitivity and reliability of the innovative solutions presented to overcome the traditional limitations, as well as to the real feasibility of solutions regarding sustainability, adaptability to the works of art or price. We also see the need for more communication between the scientific community and the decision-makers, who have only recently opened up to this paradigm. We highlighted the need to identify recurrent or innovative topics in the various documents concerning the approaches to preventive conservation, the preservation of damage and environmental management.
The literature review reported in this section will settle the basis of the research work described in sections 2 and 3.
INTRODUCTION
In the last years, the interest of the Scientific Community in environmental monitoring has considerably increased [1], [2] due to the smog that may result in widely impacts, causing diverse effects on the environment, on human health, or the economy of developing and industrialized countries. Accordingly to these, air quality assessment is commonly required by health and environmental regulations that are both international and national, to evaluate the environmental exposure systematically [3]. The equipment used to collect pollutants and following the international standard, by environmental or government authorities are based on a network of fixed monitoring stations instrumented with certified and specialized devices for measuring multiple environmental contaminants.
Studies in which authors apply low-cost sensors were also carried out by researchers [4]–[6], showing how nowadays, it is possible to collect the environmental information by sparse and miniaturized low-cost platforms applied in a wide range of purposes and contests (such as healthcare, manufacturing, conservation) and manufactured with nonhomogeneous technologies.
In both cases, the platforms are generally equipped with devices able to measure regulatory pollutants such as nitrogen oxides (NO, NO2, NOx), carbon monoxide (CO), sulfur dioxide (SO2), ozone (O3) and particulate matter (PM10, PM2.5) [7].
The substantial difference between the traditional fixed-site stations and the other kind of platforms is that the first class of instruments must comply with EU Air Quality Directive (AQD) [8] which establishes the standard criteria for air quality monitoring, as well as defining the reference measurement methods and
the standard procedure methods for instrument data collection, post-processing and calibration..
Usually, air pollutant/air quality monitoring is performed using analytical instruments, such as chemical and optical analyzers, that are bulky, cumbersome and expensive with prices ranging between 10000 € and 90000 € per single devices or combined solution1. For instance, the investment and installation of single gas sampler could cost between 10000 € and 15000 € while the integration of particulate sampler in an existing station could cost between 10000 € to 30000 €. Ultimately, a multipollutant analyzer could cost 50000 € - 90000 € [2].
Moreover, a significant amount of resources must be added to the price for the routine procedures required to maintain and calibrate them and also to guarantee comparability and high-quality data between different stations and nations. At last to the economic problem, traditional air quality stations are located at strategic fixed-site areas and can provide accurate data only for a restricted area [9]
A current trend, in the research area, explores the possibility to use economic sensors and devices in complementarity or substitution of the traditional ones and it is supported by the report EU AQD report no. 28 [10] that provides the opportunity to do not use certified sensors to acquire indicative measurements in support of objective estimation for air quality assessment, as long as they comply with the quality objectives set for each pollutant [11].
In particular, the devices able to detect the pollutant concentrations could be classified in i) sensors that measure the interaction between the pollutant and sensing material (i.e., metal-oxide sensors or electrochemical sensors), or ii) sensors that measure the light scattering or the absorption of light (infrared and
visible range). Nowadays new kind of sensors has been added to these technologies, in particular, micro-electro-mechanical systems or MEMS.
Another advantage of a not-regulatory solution consists of integrating into a single board only sensors able to detect the concentrations of air pollutant for a selected and specific subject; this method can be used both indoors and outdoors. Nevertheless, the price of single sensors is from 15 € to 150 € while the cost of a customized sensor node can reach2 500 € – 5000 €.
Moreover, these devices are commonly accomplished with an advanced microcomputer for data manipulation, elaboration and visualization [4], [12].
The easy to use and compactness characteristic, the high spatial and temporal resolution [13], as well as the continuous real-time measurement of smog, are the reasons for increasingly widespread using [14].
Under this hypothesis, the application of spread miniaturized low-cost devices/sensors becomes useful in a particular application as the monitoring in Cultural Heritage field, where non-aesthetic fixed control units near to a monument or artefact are to be avoided.
For this reason, a state of the art of the sensors applied in the Cultural Heritage will be proposed focusing on the last ten years trends in small, portable gaseous air pollution monitor use and the technologies evolution. Also, answers will be given to two open questions and challenges will be faced regarding their application that could be summarized as follow: a) Is there a real exigency for applying low-cost air pollution detectors in an archaeological site? b) Do these low-cost solutions guarantee sensitivity, selectivity and robustness enough for reliable long-term performance?
Furthermore, an overview of the effect of the air pollution Cultural Heritage is anticipated and focused on the selected parameters into this dissertation.
State of Art
Monitoring is an activity required a both after-damage and preventive risk assessment. Different tools for the monitoring activities make available different previsions, such as episodic and/or continuous, short-term and/or long-term, or qualitative and/or quantitative. For these reasons, a literature review was conducted using the results of 3 different databases (Google Scholar, Scopus and ISI Web of Knowledge). The electronic search was performed using the combinations of the following keywords: WSN, Cultural Heritage, Monitoring Device, Air Quality. For each database, we used the same words list and their combinations. Both query structure and the keywords were arranged as a function of the writing rules required by the selected database. The electronic search of the previously mentioned database identifies 150 published studies. After a process of screening based on inclusion criteria (only scientific papers, published until 2009, written in the English language, keywords and abstract coherence) and exclusion criteria (conference proceedings were not reported), only 24 papers were considered in the present review.
The other two parameters such as dimension and cost are taken marginally in the discussion due to the arbitrariness of the definition of small-size, the lack of development of instruments from universities and the unavailability of prices.
We decided to analyze the applied technologies classifying pollution monitoring instruments into four categories: direct application of active sampling, indirect application of active sampling (such as a mathematical interpolation model of national air monitoring networks data), passive sampling and, at last, sensor-based devices [15], [16].
Direct active sampling devices
This kind of device is principally manufactured for governmental environmental monitoring. They are large and sophisticated instruments (even >
20 kg) [17], which measure pollutants (single or not), with a sensitivity higher than it is needed in the cultural heritage field. They are based on chemiluminescence and/or fluorescence proprieties where the targeted pollutant absorbs radiation or reacts with a chemical compound, leading to the emission of light as a consequence, which can then be detected and analyzed. However, the costs and the complexities of active sampling analyzers limit their application in an ordinary survey.
For example Saraga et al. [18] discussed the application of measurement units for external environmental monitoring, including: (i) ultraviolet photometry automatic analyzers for O3 (EN 14625:05); (ii) ultraviolet fluorescence for SO2 (EN 14212:05); (iii) chemiluminescence for NOx (EN 14211:05) and (iv) gravimetric measurement for PM10 (EN 12341:99) and PM2.5 (EN 14907:05). The proposed instrumentation generally has a dimension of 42.5 cm (W), 157.5 cm (H), 58.5 cm (D), occupying a volume that could be incompatible with heritage applications and having a price of 10.000 €.
Indirect active sampling devices
Recent studies show a no-cost solution: the possibility to use, when accessible, pollution data acquired from a nearby national monitoring station networks and to evaluate pollution levels using mathematical models [19]. Under this hypothesis De la Fuente et al. [20], [21] and Karaka et al. [22] evaluated a model to identify the corrosion rate of cultural heritage materials, correlating spares monitoring stations and analyzing the effect of different pollutants. Screpanti [23], [24] et al., focused their attention on both Italy and Europe using the data obtained by all Italian environmental institutions (local ARPA website) and international institution. A limitation of this technique regards the different empirical formulas provided by single authors [25].
Passive devices and Dosimeters
Passive sampling devices and dosimeters react to the presence of pollutants with observable changes in their optical/physical properties (for example corrosion or color alteration) and a qualitative measure is provided.
For example, Maskova et al. [26], Grontoft et al. [27], Worobeic et al. [28], evaluated the concentrations of NO2, SO2, O3, acetic and formic acids, HNO3 and NH3 indoors and outdoors at five different archives.
Due to their properties, they have been used to realize dosimeters for a wide range of pollutants and have been used in cultural heritage for “for a very long time environmental monitoring. Currently, they are being replaced due to the difficulty of being integrated into a compact autonomous unit and because of the cumulative response to the synergistic effects of environmental parameters that require a post-acquiring analysis (Gas or Ion Chromatography, SEM), they are causing an increase of the final cost. In their research, Carminati et al. [29] proposed pocket-sized personal dosimeters applicable on a digital camera. This solution could open the possibility to integrate a dosimeter device into the sensors based devices described above.
Sensor-based devices
The development of low-cost environmental monitoring methods has encouraged the creation of a wide number of commercially available air quality sensors and prototype sensor networks. Currently, three detection methods for pollutants exist: electrochemical, photometric and microelectromechanical (MEMS) sensors. This technology enables the integration in a small-scale, sensor-arrays solution in order to measure different pollutant compounds. Even if the technology is still in development, it presents more valuable pros as the ability to measure small pollutant concentrations such as ozone, nitrogen oxides and sulfur dioxide, typically lower then twenty ppb.
Despite an end-user perspective of low-cost sensors for outdoor air pollution monitoring, this technology finds a broad application principally in the indoor application as shown in many research [30]–[35]. All authors highlighted the importance of investigating the fluctuation of air temperature (T) and percentage relative humidity (%RH), identifying these parameters as a determinant in the deterioration of collected artifacts. At the same time, they pointed out the difficulty to install sparse measurement stations preserving artworks appearance.
In recent year [36]–[40] some authors highlight the needs of methodologies to sample the Inorganic or Volatile Organic Compounds (NOx, O3, SOx, VOC) and particulate matter. In these studies, however, the evaluation of gaseous compound is marginally compared to the analysis of Temperature or Moister level.
At the current stage, low-cost, small-scale solutions, as proposed by Mead et
al. [41] that show the real benefits related to low-cost sensing are limited only in
the generic or environmental health monitoring. It is far to be applied in cultural heritage field [42] a solution that integrated in a single board: (i) an environmental parameter sensor (temperature, relative humidity, barometric pressure); (ii) an electrochemical cell to monitor gas pollutant; (iii) one optical particle counter (OPC) to control the total particle matter; and (iv) an anemometer to analyze the wind direction and intensity.
Spinelle et al. [43], [44] The sensor-based devices, contrariwise permit to monitor
a chosen monument or museum’s room locally highlighted the sensitivity and
accuracy of low-cost sensor devices applied to environmental monitoring. In particular, they show how the evaluated accuracy for O3, NO2, NO, CO and CO2 reach the just cited Data Quality Objective (DQOs) of the European Air Quality Directive [8].
About the real exigency for applying low-cost air pollution detectors in an archeological site/museum, the proposed review shows how the application of: (i) direct active sampler is limited to spot pollution monitoring; (ii) indirect active systems provide an empirical interpretation of the corrosion rate analyzing a wide area (whole city or region) and not the environment around a specific monument; (iii) passive systems, independently to low cost, haven’t got a proper selectivity of pollutants. Contrariwise a wireless sensor network allows monitoring a chosen monument or museum’s room locally. Moreover, many proposed studies highlight how low-cost solutions guarantee sensitivity and selectivity for long-term performance.
For this reason, we decide to realize a prototype able to detect not only temperature and relative humidity fluctuation but the concentration of gaseous pollutant and structural vibration as primary output.
In the following subsection, environmental parameters and their effects are discussed.
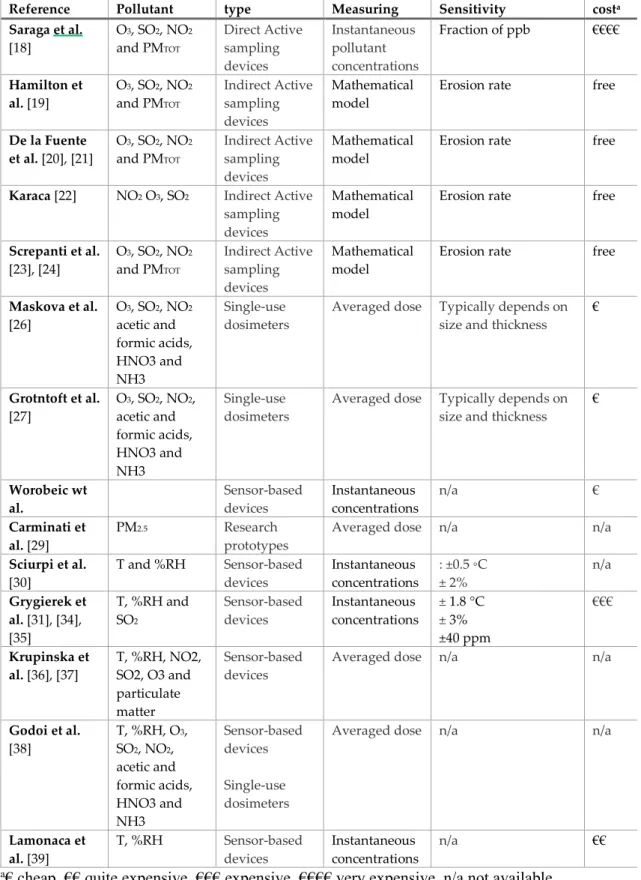
Table 1 Summary of sampling characteristics
Reference Pollutant type Measuring Sensitivity costa
Saraga et al. [18] O3, SO2, NO2 and PMTOT Direct Active sampling devices Instantaneous pollutant concentrations Fraction of ppb €€€€ Hamilton et al. [19] O3, SO2, NO2 and PMTOT Indirect Active sampling devices Mathematical model
Erosion rate free
De la Fuente et al. [20], [21] O3, SO2, NO2 and PMTOT Indirect Active sampling devices Mathematical model
Erosion rate free
Karaca [22] NO2 O3, SO2 Indirect Active
sampling devices
Mathematical model
Erosion rate free
Screpanti et al. [23], [24] O3, SO2, NO2 and PMTOT Indirect Active sampling devices Mathematical model
Erosion rate free
Maskova et al. [26] O3, SO2, NO2 acetic and formic acids, HNO3 and NH3 Single-use dosimeters
Averaged dose Typically depends on size and thickness
€ Grotntoft et al. [27] O3, SO2, NO2, acetic and formic acids, HNO3 and NH3 Single-use dosimeters
Averaged dose Typically depends on size and thickness
€ Worobeic wt al. Sensor-based devices Instantaneous concentrations n/a € Carminati et al. [29] PM2.5 Research prototypes
Averaged dose n/a n/a
Sciurpi et al. [30] T and %RH Sensor-based devices Instantaneous concentrations : ±0.5 ◦C ± 2% n/a Grygierek et al. [31], [34], [35] T, %RH and SO2 Sensor-based devices Instantaneous concentrations ± 1.8 °C ± 3% ±40 ppm €€€ Krupinska et al. [36], [37] T, %RH, NO2, SO2, O3 and particulate matter Sensor-based devices
Averaged dose n/a n/a
Godoi et al. [38] T, %RH, O3, SO2, NO2, acetic and formic acids, HNO3 and NH3 Sensor-based devices Single-use dosimeters
Averaged dose n/a n/a
Lamonaca et al. [39] T, %RH Sensor-based devices Instantaneous concentrations n/a €€
Environmental parameters and Effects
The causes of degradation are generally localized in the environment around the monument, for this reason, is possible to talk about Environmental Impact [45]. The environment has always tallied a vital role in the life-cycle of an artwork/monument, due to interaction with the materials. However, the development of industrial society and especially around the second half of the last century has produced a profound change that has drastically accelerated the degradation of cultural heritage materials [46].
Different authors, as Tidball et al. and Watt et al. [47], [48], described the degradation of materials due to atmospheric action. They point out it as responsible of the severe decline of air quality due to the copious gaseous emissions of anthropogenic activities that have introduced new agents in the environment, many of them hazardous for cultural heritage conservation [49]. Two of these, in the form of gases, nitrogen oxides NOx and sulfur dioxide SO2 are the precursors of strong acids, respectively nitric acid (HNO3) and sulfuric acid (H2SO4), extremely aggressive for the carbonate materials such as marble, limestone – widely applied in ancient architecture – and the plaster. Moreover, as widely demonstrated in the literature [50]–[54], this pollutant represent a risk for the carbonatic-based artworks due to the direct interaction between the pollutants, gaseous or in the shape of acid rains and the underlying stone layer. Gypsum is the result of this process. It can absorb and include many black carbon particles producing the so-called “black crust,” and it is responsible to the dissolution and deterioration of statues or frescos [49].
At the same time, the airborne particulate is based on coal and oil. The first one carries out a high disfiguring action, in particular, when it settles and accumulates on statues, facades, monuments, due to the black color, while the
second (demi-combust oils or other hydrocarbons) are greasy and sticky, still adhere to the surface and allow permanent attachment of other particles.
Furthermore, there are physical factors such as temperature and humidity. The danger, in this case, is not so much in the absolute values but in the fluctuations of these parameters, which generate degrading stresses in almost all the materials. Related to the humidity, the condensation conveys salts and gases in solution, accelerating the interaction with the materials constituting the works decisively. Finally, there are the other traditional physical factors such as the rain with its washing action; the insolation that causes thermal gradients; the saline solutions, which from the ground go back to capillary pores in the walls; and the wind that produces a scraping effect.
At last, there are causes of biological nature, both microbiological (lichens, fungi, algae, bacteria) and macro-biological (vegetation).
All these causes, described above, operate individually or combined and evolve both in conjunction with seasonal changes both according to the anthropic activities. For this reason, for understanding and quantifying the impact of the environmental parameters, natural and artificial, on the materials is necessary to measure the punctual values and their seasonal fluctuations.
Many authors [55]–[57], to simplify the study of environment-material interaction, categorize the alterations in the function of the kind of damage, which could be labeled as optical, physical mechanic-chemical and morphological alterations.
• Optical alterations influence visual parameters, such as color, luminosity, etc. [58].
• Physical-chemical and Physical-mechanical alterations. The first causes a hydrophobic and hydrophilic characteristic and porosity [59] variation,
while the second determines a decrease of adhesion, elasticity and cohesion [60];
• Morphological alterations can involve dimensional variation (i.e., torsion, expansion, etc.), material losses and discontinuity (crack and holes) [61];
According to this classification, in the subsection below we discuss the most significant parameter.
Temperature and Moister level
As shown in many articles Relative Humidity (RH) and Temperature (T) are leading causes of degradation of cultural heritage [62], [63] if they are not adequately controlled. Both play a fundamental role in all of the previously mentioned mechanisms (mechanical, chemical, mineralogical and biological).
In particular, changes of Temperature induce a: thermal expansion (significant for the structural stability of monuments and buildings); granular disaggregation of stones with amorphous crystalline texture (marbles or granites); acceleration of chemical reaction.
Relative Humidity is the main responsible for metal corrosion; fading of dyes; decreasing material resistance and in general of deformation of objects (expansion and compression). The combination of both parameters is the key factor in determining the habitat biological life.
Gaseous pollutants
Some air pollutants exist in the gaseous phase at ambient temperature [64]. Most significant gaseous pollutants that contribute to the alteration are SOx, NOx, COx and O3 [36].
• SOx [65] and NOx [66], [67], in the presence of humidity can turn into Sulfuric acid; Nitric acid and Nitrous acid. These acids are dangerous for metals, materials based on carbon calcium, cellulose and silk. • COx [68] in the presence of humidity can turn into Carbonic acid. This
acid is hazardous for objects based on carbon calcium as it starts the carbonization process [69].
• O3 [68], [70], [71] oxidation of organic materials.
Exist a minor set of pollutant with a corrosive effect [72] of silver [73] (H2S), copper (NH3) [74] and bronze (HCl) [75], which are products of the secondary reaction.
Particulate Matter
As shown in [28], [36], [76]–[79] particulate matter represents an important factor of artworks deterioration and intelligibility of materials. Currently, the particulate matter is in prevalence characterized by coal, semi-soluble saline solutions (nitrates and chalk), half-combusted oils and hydrocarbons with high molecular weight [80]. They can react with other pollutants [81] or with the artwork’s surface. The deposition can produce a dirtying and darkening of the surface and at last corrosion [82], [83] of the exposed material, an increasing of biological attacks (mold, bacteria and other microorganisms) [84], [85]. The particles compound is defined according to sizes [80]: total suspended particles (TSP), particles with a mean aerodynamic diameter of 10 µm (PM10), particles with a mean aerodynamic diameter of 2.5 µm (PM2,5) and fine particulate with a diameter less than 2.5 µm.
Light intensity
Light radiation natural or artificial [86], in all its component of infrared (IR), the visible band (VIS) and ultraviolet (UV) can increase different deterioration
mechanisms [87] like: color fading or blackening [88], [89]; development of biological life [90], [91]; oxidation (it has a catalytic function) [92].
Air Flow
Wind is the primary reason for loading and mechanical damage of structure [93]. Nonetheless, it can also decrease and increase the biochemical reaction of gases and/or water on the historical object. The air movements around historic structures considerably impact biological colonization, the deposition of pollutant, or the wetting-drying cycle [94]. Substantially winds transport salt, gases, dust and moister and could have an abrasive effect [95].
Vibration
Vibrations can carry out a hazard to cultural heritage objects for an assortment of reasons [96]. They could be a cause of reasonably outsized strains of objects and could origin: (i) the fallen of objects, (ii) the detachment of objects from monuments, (iii) the ruins of monuments [97], [98].
The strains have many effects and may aggravate a pre-existing mechanical faintness (opened fissures both at interfaces and at joints). Pre-existing holes or craquelures increase with recurring strains produced by vibrations. It means that letdown may be subject to the number of cycles at a specified shaking level and not upon the first instance of achieving a particular level [99], [100].
In this dissertation, we focus our attention on the temperature and moister level variation, SOx, NOx concentration and structural vibration due to their effects on cultural heritage conservation [101].
Part 2: Laboratory Tests
After a review of state of the art regarding the different sampling device applied in cultural heritage and a survey of the parameters that involve a degradation effect on the materials, in this section, we focus our attention on a sensors-based prototype able to detect: (i) temperature and relative humidity; (ii) NO, NO2 and SO2; (iii) vibrations.
In particular, this section describes the design and the validation of the Wireless Sensor Network (WSN) propose 3 , named WENDY, an acronym for Wireless Environmental moNitoring Device prototYpe.
WENDY, built on a microcontroller of ATmega328P series, gathers signals from a sensor for temperature and relative humidity; a 9-axis MIMU; and three gas detection miniature boards (NO, NO2 and SO2). Complete the board a connector for memory card (SD) and an RTC. Additionally, a module based on the ZigBee standard could be used to transmit all data. In this section, precisely, we present the performances of the WSN node in detecting: structure tilt, vibrations and the daily cycle of humidity, temperature and gas deposition.
The experimental setup used to evaluate the accuracy of MIMU system highlighted a relative error on shock acceleration measurement, in term of normalized root mean square error, lower than 0.1 % for the sinusoidal input and 0.51 % for cardinal sin input, with an average accuracy in the principal peak reconstruction of 1 % in the chosen frequency range (5 Hz to 50 Hz). The MIMU accuracy for tilt measurement, evaluated through the root mean square error was equal to 0.3° and a standard deviation always lower than 0.4° in the 0-90° tilt range. The gas detection and temperature/ humidity boards showed data comparable with the nearby certified ARPA system device.
3 The text in this section was adapted and integrated from the papers:
“D’Alvia et al. doi: 10.21014/acta_imeko.v6i3.454” “D’Alvia et al. doi: 10.1016/j.measurement.2018.07.004”
The developed system allows for prioritization of intervention both for management and interventions planning, regarding conservation, consolidation and restoration.
INTRODUCTION
In Section 1 we have discussed as a preventive monitoring permits to control the sustainability and durability of the artwork conservation [102], in this section, we focus our attention on the realized monitoring device.
The deterioration, as we know, is dependent on the nature of cultural heritage and it is exposed to the influence of many parameters [103]–[106]. For instance: (i) gaseous pollutants (SOx, O3, COx, NOx) and particulate matter; (ii) relative humidity and temperature; (iii) radiation; (iv) airflow velocity and direction; (v) sound pressure and vibration [46], [56], [57]. Consequently, both long-term monitoring of the environmental parameters and further analysis of the recorded data are necessary.
In fact, in the case of cultural heritage, the environmental monitoring is typically achieved by a data storage, with a recommended rates in a range between one sample per hour (1 sample/h) or daily (1 datum/day) [107] monitoring.
Under this hypothesis [108], the development of a monitoring system based on a wireless sensors network (WSN) presents different and valuable pros. For example:
• the absence of wired invasive infrastructures or cables; • quick and straightforward architecture scalability;
• the possibility to integrate heterogeneous and multiple sensors into a single small node;
• the capability to distribute a high number of the low-price measurement point in the historic site;
• the cooperation among the nodes for coverage extension and user interaction;
• the low cost of the hardware platform.
As shown in different papers, currently, many remote control systems for data acquisition applied to cultural heritage are developed [109], [110].
This work starts with the priority of a data-logger with a low-price able to save data of different variables from wide spaces for particular applications as the preventive conservation. A sensor-based device that uses a 2-Wire protocol to communicate with sensors is presented [111]. It is programmed to set the correct rate of data sampling meeting with the requirements of the market and standard recommendation. In particular, we have developed a novel, low-cost, wireless, scalable system, capable of controlling environmental parameters, as well as vibrations and deformation, temperature and humidity, gaseous pollutant, over a multi-stage research project, combining MEMS sensor boards and electrochemical-cells. In this dissertation section, we present WENDY and the validation setups for a) detection of tilt and shock and define the frequency limit, b) acquisition of the daily cycle of environmental pollutant.
MATERIALS AND METHODS
Hardware
The WENDY device is developed starting from both protocols of communication and the sensors technologies. It is based on a PCB ad-hoc designed, to reduce costs and dimensions of the device compared to commercial development boards (Arduino UNO, UDOO, etc.) which require external shields for each adjunctive function (ex. SD card for data logging, Real Time function, etc.). Also, we could integrate different sensors without limitation imposed by the producer (ex. Libelium). Moreover, our solution is a low-power device compared to RaspberryPI [2].
As shown in Figure 1, the device is based on a computational unit that embeds a RISC Microcontroller AVR ATmega328P (a). The solution also integrates (b) SO2-A4, NO2-A4 and NO-A4 Alphasense sensors [112]–[116]; (c) a BME280 Bosch Sensors (Pressure, Relative humidity and Temperature PRhT)
Figure 1 The system with highlighted the components: a) microcontroller board, b) gas sensors, c) BME280, d) BMO055, e) RTC and storage SD card system and the dimension.
development board [117];(d) BNO05 Bosh sensors development board [118]. A connector for memory card (SD) and an RTC ds1337 are added (e). All sensors are connected to the microcontroller via an i2c serial communication bus. The system is completed with a transmitting/receiving ZigBee unit.
Microcontroller ATmega328
The proposed wireless node is based on a Microcontroller (MCU) ATmega328P, chosen to dispose of an environment simple to program and that implements in C++ all the libraries.
It is a low power microcontroller with one I2C port used to connect all chosen sensor boards and the external clock; one SPI serial interface accustomed to connect the external SD memory and one programmable serial USART used to interface the MCU with an external PC for programming or radio-transmitter.
The microcontroller ATmega328p is chosen due to the 0.2 mA in Active Mode low power consumption at 3.7 V and the low cost. Additionally, the modality of Power-Down Mode (0.10 μA) and Power-Save Mode (0.75 μA) are provided and used. Moreover, we choose this microcontroller due to the simplicity of
bootloading and the availability of libraries in the creative common right for the
chosen sensors. Moreover, the programmable memory of 32 kB and EEPROM memory of 1 kB is enough to store all the necessary libraries, the main program and sensors output respectively.
Power Supply
A Li-ion battery with a capacity of 2 Ah, which guarantees forty days of functioning power the entire system is powered.
Radio Module
The Radio Module is a transmitting/receiving ZigBee unit IEEE 802.15.4 in 2.4 GHz band with +3dB output power and 250 kB/s transmission. It is used in AT commands directly connected to the USART of the ATmega328P.
Plug-in for Sensor Boards
The MIMU (Magnetic Inertial Measurement Unit) BNO055 is a low-cost sensor that integrates a 3-axis geomagnetic sensor, 3-axis gyro and a 3-axis accelerometer. It is possible to setting-up different factors as the g-range; the cut-off frequency of low-pass filter, or the interrupt signal generation if a particular event occurs (a changing in angular or in linear acceleration). The MIMU has a max power consumption at 3.7 V of 0.2 mA. We have chosen it due to the low-cost and the versatility of internal fusion-algorithm that permits the offset calibration of the sensor, the monitoring of the calibration status. Additionally, Kalman’s filter provides the distortion-free and refined orientation of the output vectors.
The MEMS BME280 is a low-price sensor that combines digital temperature, pressure and humidity sensing elements. It measures temperature (T) in the range -40 °C to 85 °C with an accuracy of 0.5 °C, Percent Relative Humidity (%RH) in the range 0% to 100% with an accuracy of ±3% and Pressure (P) in the range 300 hPa to 1100 hPa with an accuracy of ±1 hPa. We have principally chosen it due to the low-cost and the versatility of three-in-one sensors. At 3.7 V the power consumption is 0.2 mA.
Alphasense 810-0019-03 model is a three-input analogic front-end sensor board mounting SO2-A4, NO2-A4 and NO-A4 electrochemical cell for SO2, NO2 and NO gas concentrations. In particular, the NO-A4 and the NO2-A4 present respectively a sensitivity of 0.404 mV/ppb and 0.267 mV/ppb in the range of 0 ppm to 20 ppm, while the SO2-A4 a sensitivity of 0.267 mV/ppb in the range of 0
ppm to 50 ppm. We have chosen it because the system is calibrated and certified by the producer that gives to the user all the information needed to compensate both zero and sensitivity drift for each sensor. The Alphasense 810-0019-03 board is connected to the main microcontroller (ATmega328p) through an analog-to-I2C converter. The power consumption of 810-0019-03 board model and the four sensors is two mA at 3.3 V. All sensors have been chosen according to the values present in the literature [90], [119]–[121], as Table 2 shows.
External Clock
The real-time clock ds1337 allows acquiring and organize the data in a different format of output: calendar (days, months and years), times (seconds, minutes and hours), or complete. Also, ds1337 allows the possibility to generate two interrupt flags associated with two different time alarms: Alarm1 and Alarm2. Alarm1 works in the seconds-days range, while the second Alarm2 works in the minutes-days range. The I2C protocol is the communication protocol used to transfer data to the microcontroller. The chip has a dedicated power supply (CRC1220 3.3 V Li-ion battery) to guarantee a no time reset when the device is not powered.
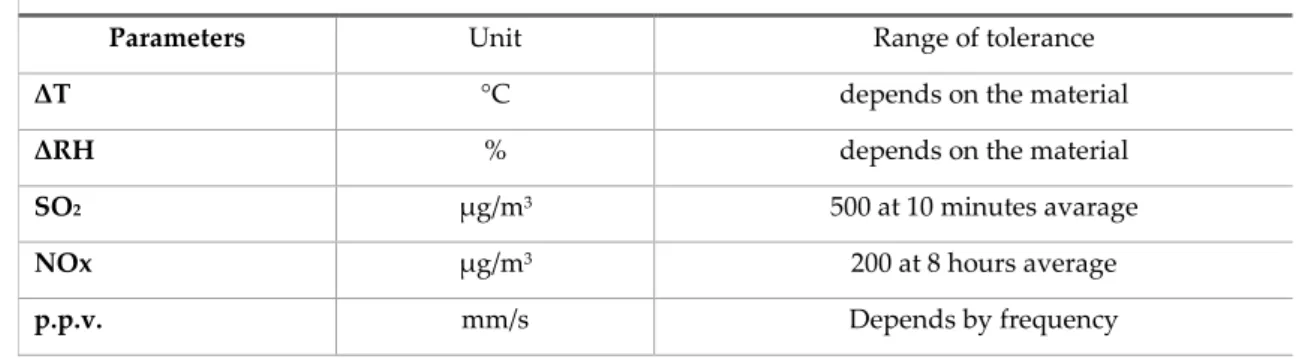
Table 2 Parameters, Measurement Units, Range of Tolerance
Parameter and range for Risk Analysis
Parameters Unit Range of tolerance
ΔT °C depends on the material
ΔRH % depends on the material
SO2 µg/m3 500 at 10 minutes avarage
NOx µg/m3 200 at 8 hours average
External Memory
All acquired data are saved into a data-logger based on an external Secure Digital memory card (SD). The SPI port is used for the communication between SD ad microcontroller.
Design of Hardware and Software
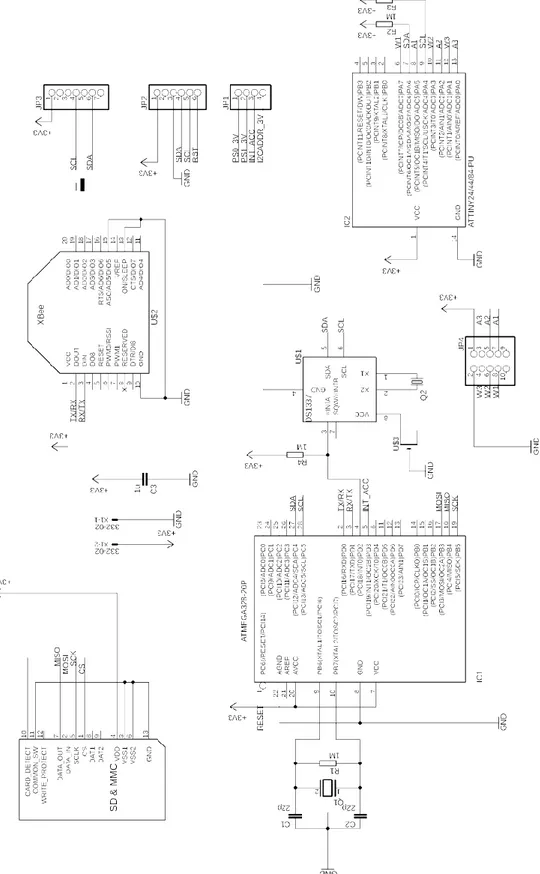
We realized the printed circuit board (PCB) using the free software “Eagle CAD”. The width of the tracks and the minimum distance between them have been chosen equal to 1.27 mm, in a conservative way, in a double layer. The PCB was etched on an FR4 board with a thickness of 1.6 mm and 100 mm 80 mm. Both layers are characterized by a ground plane. Figure 2 shows the schematic of WENDY device.
The C++ Computer language has been adopted for the writing of all algorithm programs. All the programs are designed using Arduino IDE and commands. The detailed firmware used for the “Monitoring of Minerva Medica” will be discussed in Appendix A - Code.
The final firmware, moreover, holds an interrupt routine to including a data buffer to overcome the communication timing jitter during the data communication on the i2c serial (50 Hz) for the BNO055 sampling frequency.
Experimental procedure
The MIMU sensor is employed for two monitoring activities: (a) shock detection and (b) tilt detection of the wall due to fracture and/or deformation. To assess the performance of the MIMU in these two applications, two different experimental setups have been designed: (i) the former including an electro-dynamic shaker and (ii) the latter including a rotating plate. In our node prototype, tilt and shock will be detected by different processing data from the same inertial sensor. For this reason, we set a cut-off frequency for the in-built settable low-pass filter at 250 Hz, a high value for tilt, but required for properly acquiring vibrations. The environmental sensors, for hydrothermal values and pollutant concentration, have been placed outdoor, for evaluating the system in proximity of a certified pollution monitoring system by ARPA Lazio (Lat. 41.864194°, Lon. 12.469531°).
Shock detection
The UNI 9916 recommendations describe variables and methods to measure vibrations and their effects on a building, either modern or ancient, identifying two key parameters: the peak particles velocity (p.p.v) and the peak component particles velocity (p.c.p.v). The p.p.v-value represents the maximum value of the magnitude of the velocity vector measured at a given point while p.c.p.v-value is defined as the module of one of the three orthogonal components measured simultaneously at one point. Moreover, both values could be directly measured or obtained by integration of acceleration data.
The relation between magnitude and frequency of the vibration signal is summarized in Table 1. Especially the chosen range relates in this study the range 0 Hz to 50 Hz is investigated allowing the results of other works in the filed [122], [123].
Before the application of the instrumentation on site, we conducted a validation session in our lab. In particular, we focused our attention on the accuracy of MIMU, applying both sine and cardinal sin (sinc) waveform to a Vibration Exciter Type 4809 (Bruel&Kjaer), used to provide a controlled input to the sensor. We compared the output of the filtered (250 Hz cut-off) MIMU output with a reference signal provided by a certified mono-axial accelerometer (Bruel&Kejar 4371 model.) Both sensors have been placed on top of the Vibration Exciter as shown in Figure 3.
A high accuracy waveform generator has imposed the sine and sinc motion and the amplitude of the gain was set to produce the maximum velocity acceptable for the chosen frequency. The test for the sin signal has been repeated for five different frequencies (5 Hz, 15 Hz, 25 Hz, 35 Hz and 45 Hz), range compatible with other studies in the field.
For the sinc signal, chosen as it best reproduces the vibration caused by the public transportation nearby the monument, we chose to test the signal at 5 Hz, 15 Hz and 25 Hz according to other studies in the field [123]–[125]
The described procedure has been repeated three times by aligning each time a different MIMU axis with the motion axis.
Table 3 p.c.p.v an p.p.v maximum values, according to the UNI 9916, in relation with the frequency of vibration at ground level for historic building
a. Linear relation b. Linear relation; over 0.1 kHz a speed of 10 mm/s is used as reference value.
The TYPE 2692-c (Bruel&Kjear) can integrate the accelerometer signal and evaluate the velocity. Thus, we set the proper velocity amplitude for the chosen frequency. In the post-processing phase, we compared the acquired signal of 4371 model with the signal acquired and integrated through MATLAB, of BNO055.
Accuracy has been evaluated by calculating the RMSE between test and reference signals, normalized to the peak-to-peak value of the reference sensor (nRMSE), as reported by Equation 1.
(
)
(
)
(
)
=−
−
, , , , 0 , , , , , ,nRMSE
=
max
min
n x y z x y z ref test i x y z x y z x y z test tests
s
n
s
s
(1)Also, we had determined the accuracy in the central peak reconstruction, when the sinc input was applied. In particular, we have evaluated the residual between the corresponding peaks in the two signals and then calculated the
Figure 3 The experimental setup, with Vibration Exciter Kjaer Type 4809, mono-axial accelerometer Bruel&Kejar 4371 model, charge amplifier Bruel&Kjear
average of the absolute value of the residuals as a percentage of the reference value for each frequency.
Tilt detection
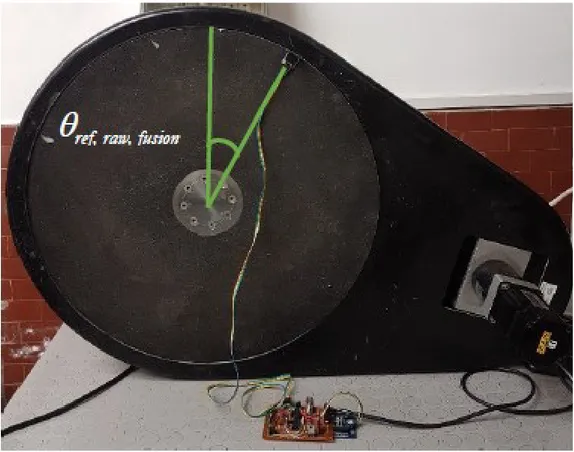
A servomotor controlled in a closed loop using an angular encoder (Sanmotion rs1a03aa) has been used to estimate the accuracy and the stability of the embedded accelerometers. Correctly, the MIMU was mounted on a vertical plate connected to the servomotor through a belt as shown in Figure 4.
The BNO055 has been programmed by setting the internal low-pass second order filter to 250 Hz and the measurement range to ±16 g (same parameters were selected for vibration detection test).
A LabVIEW program has been implemented to rotate the plate around the horizontal axis from 0° to 180° with a step of 1° every 15 minutes, simulating tilt
rotations induced by structural deformations. We acquired tilt angles measured by the encoder (θref), the roll angle (θraw) calculated directly by three acceleration
components (ax, ay, az) and the roll angle provided by the data fusion algorithm
that is embedded into the sensor (θfusion).
To validate the goodness of the built-in sensor fusion algorithm, the accuracy of the accelerometers was estimated using the Root Mean Square Error (RMSE) between the average values of the measured signals (θraw, θfusion) in the 15 minutes’
window and each reference angle (θref), gathered every 15 minutes. The standard
deviation of θraw was evaluated to estimate the noise of the accelerometers, an
important parameter to avoid misdetection, due to long-term functioning of the sensor.
Environmental parameter
In the preliminary test, we decided to put the sensor system outdoor, in the proximity to a certified monitoring system (ARPA), during a five-days acquisition. The system has been programmed with a sample period of 10 minutes, to evaluate the accuracy of the sensor output in mutable meteorological and traffic conditions. The acquired data have been post-processed by calculating the moving averages of the outputs with a one-hour step and an 8-hour window (8h-Average).
Regarding gas concentrations, the temperature dependence is corrected in post-processing using the output of the embedded Pt100. Corrected gas concentration values are calculated using the formula provided by the calibration certificate.
RESULTS AND DISCUSSIONS
Results of Shock and Tilt Detection
Shock Detection
Figure 5 and Figure 6 show the comparison between the reference acceleration 𝒗𝑟𝑒𝑓 and the test acceleration 𝒗𝑡𝑒𝑠𝑡 , in correspondence of all excitation
frequences, rispectively for sin and sinc signals. From the analysis of figures, it clearly appears that the phase shift between the acceleration measured through the MIMU and the one measured with the certified accelerometer is negligible, despite the difference in signal filtering. MIMU uses an internal second order low pass filter, with undeclared parameters, while we applied a second order Butterworth digital filter, with a 250 Hz cut-off frequency of the certified accelerometer signal. In addition, to obtain the output in term of velocity, the accelerometric signals are integrated, an operation that introduces an additional phase-shift.
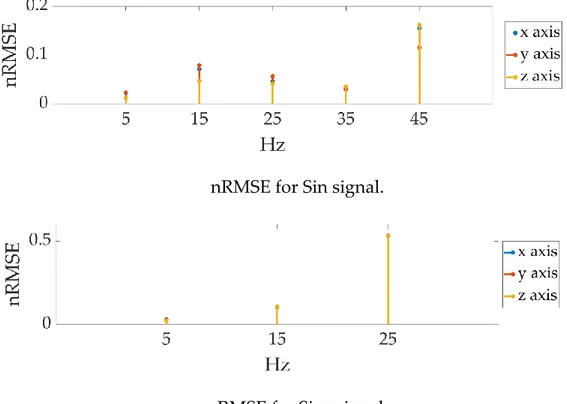
Figure 7 shows the nRMSE for the three axes for both signals at the chosen frequency. The nRMSE value of sin signal is similar for the three axes and it is lower than 0.1% for sin waveform. At 45 Hz we have an increase of nRMSE due to a timer jitter (without the buffer the nRMSE is always over the 36%)
The nRMSE value for the sinc signal is similar for the three axes at the same frequency, but increase exponentially with the frequency increases, the maximum value of 0.52 is, however, lower than the nRMSE evaluated without the buffer (0.59%).
Accuracy in main peak reconstruction when the sinc input was applied are 0.45%, 0.83% and 1.15% respectively for 5 Hz to 25 Hz signals.
Comparison between vtest and vref at 5 Hz along the x-axis
Comparison between vtest and vref at 5 Hz along the y-axis
Comparison between vtest and vref at 5 Hz along the z-axis Figure 5
Comparison between vtest and vref at 15 Hz along the x-axis
Comparison between vtest and vref at 15 Hz along the y-axis
Comparison between vtest and vref at 15 Hz along the z-axis Figure 5
Comparison between vtest and vref at 25 Hz along the x-axis
Comparison between vtest and vref at 25 Hz along the y-axis
Comparison between vtest and vref at 25 Hz along the z-axis Figure 5
Comparison between vtest and vref at 35 Hz along the x-axis
Comparison between vtest and vref at 35 Hz along the y-axis
Comparison between vtest and vref at 35 Hz along the z-axis Figure 5
Comparison between vtest and vref at 45 Hz along the x-axis
Comparison between vtest and vref at 45 Hz along the y-axis
Comparison between vtest and vref at 45 Hz along the z-axis Figure 5 Comparison between vtest and vref at 5 Hz to 45 Hz
Comparison between vtest and vref at 5 Hz along the x-axis
Comparison between vtest and vref at 5 Hz along the y-axis
Comparison between vtest and vref at 5 Hz along the z-axis Figure 6
Comparison between vtest and vref at 15 Hz along the x-axis
Comparison between vtest and vref at 15 Hz along the y-axis
Comparison between vtest and vref at 15 Hz along the z-axis Figure 6
Comparison between vtest and vref at 25 Hz along the x-axis
Comparison between vtest and vref at 25 Hz along the y-axis
Comparison between vtest and vref at 25 Hz along the z-axis Figure 6 Comparison between vtest and vref at 5 Hz to 25 Hz
nRMSE for Sin signal.
nRMSE for Sinc signal.
Figure 7 nRMSE for Sin and Sinc Signal with highlighted the respective chosen frequency
Tilt Detection
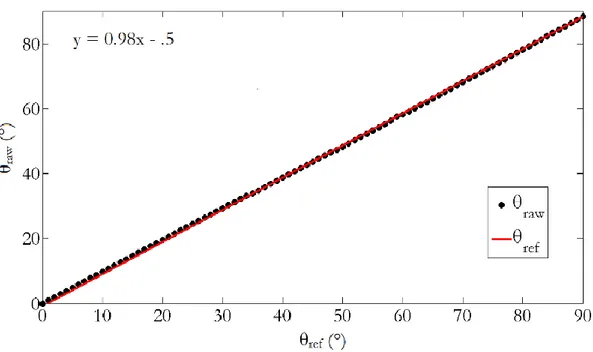
The relation between θref and θraw is shown in Figure 9. The MIMU accuracy
for this measurement, evaluated through the RMSE, was equal to 0.3°. The SD of the MIMU output was always lower than 0.4° in the 0-90° tilt range.
Figure 9 reports the test results in the 0-90° range: the RMSE between θfusion.
Moreover, θref was equal to 0.2° and the Standard Deviation StD was always
lower than 0.2° in the 0°-180° tilt range.
This wide range was chosen to assess accuracy in the tilt angle measurement regardless of the initial placement of the sensor since MEMS accelerometers embedded into MIMUs can present different accuracy levels for each axis.
Figure 8 shows the comparison between θraw and the one provided by the internal sensor fusion algorithm θfusion. Figure 8 highlights how the fusion
algorithm output is less sensible to noise and, consequently, more stable over time, with a maximum SD of 0.2°. The embedded data fusion algorithm, based on Kalman’s filter, can filter noise; however, due to the slow dynamics of the phenomenon, the increased stability is not paid in term of noise, as demonstrated by the RMSE.
Figure 8. Example of acceleration signals acquired via the two systems
Environmental and pollution detection
Figure 10 reports the outdoor concentration of pollutant gasses in ppb in two chosen days, between 12:00 AM on Friday 02/10/17 to 12:00 AM of Sunday 02/12/17. Generally, the gaseous pollutant concentration is higher during the daytime than during the night. Values are well-matched with the concentration values given by the ARPA monitoring station [126], [127] and inferior to the normalized day limits (140 ppb for SO2, 100 ppb for NO2 and NO). The Arpa System reported a maximum of NO2 hourly concentration at 7 pm for both 10 and 11 February 2017. These peaks have a time-correspondence with the ones in Figure 8, even if the actual value measured with our WSN (37 ppb against 60 ppb from ARPA system) is affected by the height difference.
The maximum level of SO2 concentration appears to be 1 ppm. SO2 is an impurity compound of fossil fuel commonly used in buildings.
The highest values of hourly SD were 0.7 ppb for NO2, 0.2 ppb for NO, 0.8 ppb for SO2.
Figure 11 shows the day-night cycle of temperature and moister level in the two chosen days, between 12:00 AM on Friday 02/10/17 to 12:00 AM of Sunday 02/12/17. As expected, the sensor shows an evident decrease in RH, in correspondenceto an increase in temperature (ex. 12 AM). Maximum values of hourly SD were 0.4 °C and 0.6% for temperature and relative humidity, respectively. A certified thermohydrometer is placed near WENDY to evaluate the accuracy of the sensors. The RMSE is 0.11 °C and 0.18% respectively for temperature and percent relative humidity.
Figure 10 8h-average gas concentration for SO2, NO2, NO with 8h-SD.
Figure 11 8h-average for temperature and relative humidity with hourly SD and RMSE.
Conclusions
We designed and analyzed the performances of a low-cost wireless sensor network node for the environmental monitoring of cultural heritage. At this stage of development, we focused on the assessment of the accuracy and stability of tilt angle and shock detection, measurement of gas concentration and thermo-hygrometric parameters.
The tilt measurement demonstrated a good accuracy for the targeted application. The observed stability was acceptable in the chosen measuring field, demonstrating the robustness of the solution as a function of time. The embedded data fusion algorithm demonstrated a good capability of filtering noise without losing responsiveness for this application.
The experimental setup for vibration detection demonstrated a stable behavior over the chosen frequency range (5 Hz to 45 Hz), along with the three different axes. Despite relative error on shock acceleration measurement is not negligible (nRMSE up to 10% in sin setup and up to 52% for sinc setup), it can be considered acceptable for shock detection due to the good accuracy in the primary peak reconstruction (lower than 1.15%).
Outdoor behavior confirmed the expected inverse proportionality between temperature and RH.
Gas concentration sensors showed a trend over time comparable to data from the ARPA system, with a time correspondence in peak values, even if a difference in average values was observable due to a different height positioning.
Despite the full operating range (0 to 20 ppm) of the gas sensors, in general, gas concentrations at street level are in the range of 20-200 ppb for SOX and NOX, according to the OMS guideline. Values found in this study are in line with expectations.
Alphasense’s electrochemical cells present limitation due to cross sensitivity to other chemical compounds, lifetime (2 years) and drift. However, the limited cost (ca. 50 € each) allows for a massive diffusion of sensor’s nodes in a limited area.
Part 3: Application on site
In this section, we proposed a measuring unit and presented the collected data. The aim of this work is monitoring effects of different factors which affect the “Minerva Medica Temple,” an archeological site in Rome. In particular, we focus on: (i) the seasonal thermal variations on the structure; (ii) the contamination due to by local traffic regarding gaseous pollutant and (iii) the dynamic response of the structure to a tramway line located in Rome and called “Roma- Giardinetti.” The developed system allows for prioritization of intervention both for management and interventions planning, regarding restoration, consolidation and conservation.
Moreover, the software structure of the environmental monitoring device is presented and expounded in detail.4
Always in this section, an innovative procedure for the evaluation of the environmental hazard in cultural heritage is proposed. This risk assessment can be considered as a “relative risk assessment methodology.” In particular, it considers the impacts of microclimatic conditions on the monument, based on the international norms and the current scientific knowledge. For measurement campaigns with WENDY, the risk method proposed is applied to the results of two measurement campaigns carried out between 2017 and 2018 over two different periods (September-December and March-July), at “Minerva Medica Temple,” in Rome.
4 The text in this section was adapted and integrated from the papers:
D’Alvia et al. doi: 10.1016/j.measurement.2018.07.004 D’Alvia et al., IEEE Catalog Number: CFP18O73-USB
INTRODUCTION
In the last years, the attention to novel technologies and methodologies for the real-time monitoring for the maintenance of archeological sites and conservation of cultural heritage and artworks has increased significantly [46]. Despite the necessity for preventive conservation and remote (or local) monitoring has been widely documented, is still challenging to find a standard approach, due to the intrinsic heterogeneity of problems related to each monument or artifact [103], [109]. As widely discussed in Sections 1 and 2, outdoor environmental monitoring is based on sparse stations, holding dedicated units for capturing, processing and displaying data about macro and micro-pollutants. In general, these stations are instrumented with expensive air quality sensor devices, which provide accurate data but only in a few pre-defined locations, usually far from structures of interest, due to their dimensions [11]. The expensiveness of commercial solutions, regarding purchasing, running and maintaining costs, actually limits the number of installations. Also, the correlation of all stations provides an urban gradient of pollution [21], eventually helpful to identify the areas most affected by pollution, but does not guarantee proper information about the site taken into consideration. Moreover, those devices are cumbersome, bulky and unaesthetic when placed next to artifacts, as originally designed for assessing human exposure to atmospheric pollutants.
An exciting novelty to support this approach is provided by the European Air Quality Directives and reports [8], [10] that established the possibility to use not ISO recommended sensors to obtain indicative measurements or in support of "objective estimation" for air quality assessment, as long as they comply with the quality objectives set for each pollutant.
In this scenario, the deployment of a wireless sensors network (WSN) monitoring system presents valuable pros, such as: architecture scalability,
capability to integrate multiple and heterogeneous sensors on a single small node and possibility to distribute a high number of wireless and low-cost measurement points in the exhibition areas or at Historic sites [6], [128]. Moreover in literature is discussed and validate the possibility to use low-cost commercial sensors according to data quality objective (DQOs) of the citied directives [43], [44], [129].
Furthermore, in the last year, the same approach used for a technology transfer from assessing human exposure to cultural heritage exposure is applied to evaluate Risk Analyses following the standard recommendations [130]. Andretta et al. in particular, proposed “a new environmental risk assessment in indoor” cultural heritage protection based on a combination between the “Risk Index Methodology” and the “Dose-Response Methodology” [131]. In this research, we propose to evaluate a “Risk Index” for outdoor artifact or monument, where DOQs provide the upper bound limits for the single pollutant. As above mentioned, recent studies showed how new instrumentations are developed to quantify the risk of cultural heritage about pollution. So we have realized and applied a complete solution, integrating sensors for environmental parameters (temperature and relative humidity), sensors for pollutant concentrations detection (SO2, NOx) and sensors for tilt and vibration detection [132], [133] tested in the site of so-called “Minerva Medica Temple.” The device is expected to fuse the benefits of different non-integrated solutions recently proposed [40], [41], [98].
The aim of this work is monitoring effects of different factors affecting the “Minerva Medica Temple,” an archeological site in Rome. In particular, we focus on: (i) the seasonal thermal variations on the structure; (ii) the contamination due to by local traffic regarding gaseous pollutant and (iii) the dynamic response of the structure to the “Roma- Giardinetti” tramway line.
In this research, we focus our attention principally on the description of the setup of WENDY. We also describe the software architecture and the Risk Analysis theory. Results of the research are presented and discussed.
MATERIALS AND METHODS
Firmware
WENDY firmware is realized with a bottom-up strategy and it is based on two external interrupts, one triggered by ds1337 RTC and one generated by BNO055. Figure 12 shows the measurement firmware flowchart with highlighted the most important functions.
The first interrupt (Alarm1) is set every minute. When entering the interrupt routine, the microcontroller firstly reads the Temperature (T in °C) value, relative humidity (RH in %) value and NO, NO2, SO2 (ppb) concentrations.
The second interrupt (Motion) is used to acquire data provided by the BNO055 when vibrations exceed a fixed threshold in term of acceleration.
It stores all data before in the internal EEPROM and then into an external SD memory card (to reduce the power supply consumption).
The MIMU is set with a cut-off frequency at 250 Hz and an acceleration range of ±2 g with a threshold of 3.91 mg as LSB and 996 mg as MSB. The value is chosen based on the UNI 9916 recommendation [120] as it will be explained in the following section. Both interrupts help to reduce the power consumption of battery power supply concerning a polling routine as, after the reading, sensors are switched off or put in safe-mode and the microcontroller enters the “sleep mode.”. For the complete code, see Appendix A - Code.
All acquired data are analyzed in post-processing via MATLAB. In particular, for the data collected in “Timer Interrupt” stage, it is calculated the moving averages of the outputs, with a one-hour step and an 8-hour window (8h-Average). For data collected during the “Vibration Interrupt,” the frequency and the velocity of vibration are evaluated and compared with the recommended values. To convert the data of gas sensors, we used the formula (Equation 2) provided by ISO 37120 [134]
(
) (
) ( )
(
)
3 12.187 / 273.15 t = + concentration M µg m (2)Figure 12 Measurement flow chart which highlighted the different states: the “void main (),” the “void loop ()” with the two internal interrupts: Motion and
Where M is the molecular weight of the gaseous pollutant, concentration is the gaseous pollutant concentration expressed in ppm and t the temperature expressed in °C.
Risk Analysis
Over the last year, many studies [23], [52] have provided to increase the knowledge about the kinetics and mechanisms of interactions environment-artworks and the impact of the climate changes on cultural heritage.
As discussed in the first sections, the application of mathematical models which integrate the data of active institutional samplers currently it is used to analyze the erosion/corrosion rate of the materials; they are based on the empirical Lipfert's formula and its variants [25], [135], [136]. An example is shown in Equation 3 below [137].
(
+)
=3.1 0.01 85 0.59+ + 60 2 + 7.8 60 3 +5.4 +2.58 10
R t Rh SO Rh HNO Rain H PM (3)
R (expressed in μm) is the loss of mass due to corrosion, t (in years) is the time,
the nitrogen oxides were indirectly considered to measure the HNO3 (in mg⸱m−3), to start from the temperature values T (°C), relative humidity RH lower then 60%, NOx and O3 (mg⸱m−3). Even if these formulas correlate some pollutants, such as PM10, SO2, HNO3 or acid rain amount, tend to underestimate the phenomenon and, do not have an overall solution because they are valid only for single material [52], [91], [138]; also this kind of model does not respond to any regulatory.
Fortunately, recent studies [139]–[141], have proposed a new approach to analyzing the cultural heritage’s problems of protection and preservation and they are based on the risk management techniques, which is instead supported by the international standard regulatory [130].