INDEX
Table of abbreviation
Abstract
1-21. Intoduction
31.1 Forensic analysis
31.1.1 Alcohol abuse and its determination in the forensic field 3-4
1.2 Carbohydrate-deficient transferrin
4-5 1.2.1 Background: human metabolism of alcohol 5-6
1.2.2 Carbohydrate-deficient transferrin: biomarker of chronic
alcohol abuse 6-8
1.2.3 Review of methods of analysis for carbohydrate-deficient
transferrin 8-9
1.3 Analytical Technology
9-101.3.1 Capillary Electrophoresis 10
1.3.2 Basic principles and composition of the CE instrument 10-15
1.3.3 Method development and parameters to consider in CE
analysis 15-16
1.3.4 Principal CE separation modes 16-23
1.3.5 Advantages and main applications of CE 23-24
2. Aim of the thesis
253. Materials and methods
263.1 Materials
263.2 CE instrumentation and analytical conditions
263.3 Speciemen collection
273.4 Sample preparation
273.5 Asialo-Transferrin identification and quantification
28-294. Results and discussion
30-45
5. Conclusions and future perspectives
466. Acknowledgements
47Table of abbreviations
Abbreviation Meaning
CE Capillary Electrophoresis
Tf Transferrin
CDT Carbohydrate-deficient transferrin BAC Blood alcohol concentration GGT γ-glutamyltransferase
ADH Alcohol dehydrogenase
ALDH Aldehyde dehydrogenase
ABV Alcohol by volume
IEF Isoelectric focusing
HPLC High-performance liquid chromatography CIEF Capillary isoelectric focusing
LC Liquid Chromatography
EOF Electrophoretic-osmotic-flow
ESI-MS Electrospray ionisation mass spectrometer CZE Capillary Zone Electrophoresis
MEKC Micellar electrokinetic chromatography CCE Chiral capillary electrophoresis
CEC Capillary electrochromatography CGE/SDS-PAGE Capillary gel electrophoresis MS Mass spectrometry techniques NPS New Psychoactive Substance
LiCl Lithium Cloride
H3BO3 Boric Acid
DAB Diaminobenzide (1,4-diaminobutane)
HCl Hydrochloric Acid
NaOH Sodium Hydroxide
PEG Polyethylene glycol
RB10X Run buffer 10 times diluted Psi Pounds per square inch Rpm Revolutions per minute
WG-CDT Working Group on Standardization of CDT USP United States Pharmacopeia
ASTM American Society for Testing and Materials
IFCC International Federation of Clinical Chemistry and Laboratory Medicine IUPAC International Union of Pure and Applied Chemistry
ACS American Chemical Society
LOD Limit of Detection
𝑇𝑚 Migration time (experimental parameter) 𝑇𝑚𝑟 Relative migration time
R Resolution
%A Percentage of peak area 𝜎^2 Sample variance
SD Standard deviation
1
Abstract
In forensic sciences, the analysis of Carbohydrate-deficient transferrin (CDT) is used in the diagnostics of alcohol abuse, because it is known that the concentration of CDT increases after alcohol consumption.
The human Transferrin (Tf) is the iron transport serum glycoprotein characterized by oligosaccharide chains that can be n-“antennary” (from zero to four) each one with a sialic-acid residue. Consequently, there are different isoforms with different numbers of sialic-sialic-acid residues and CDT includes the monosialo-, the asialo-, and the disialo-Tf isoforms characterized by absence, one or two sialic-acid residues.
Currently, CDT analyses are based on the relative quantification of disialo-Tf isoform in respect to the total Tf isoforms identified (up to pentasialo-Tf).
At present, the available analytical methods to perform CDT analysis based on immunochemical assay, liquid chromatography (LC) and capillary electrophoresis (CE) do not allow for an accurate identification of asialo-Tf because of its low concentration.
Taking into account these premises, this project, starting from an existing capillary electrophoretic method performing “routine” CDT analyses, was aimed at developing an improved procedure suitable for asialo-Tf determination.
The “new” CE method was developed by optimizing different experimental parameters such as temperature, electrical potentials, injection time and types, stacking procedures and the running buffer composition.
The selected conditions have been 28 °C of temperature and 30 kV of applied voltage combined withthe increase of the amount of the loaded material by increasing the injection time up to 50 s and with the use of an optimized running buffer adjusted to the 1,4-diaminobutane (DAB) 9 mM concentration. In addition, a sample pre-treatment procedure with polyethylene glycol 8000 (PEG 8000) at final concentration of 20% was introduced to
2 further improve the asialo-Tf detection through the precipitation of interfering proteins present in the serum sample.
The analysis of results showed an additional peak, in both disialo-Tf “positive” and “negative” samples, with the relative migration time (𝑇𝑚𝑟) ascribable to asialo-Tfand quantifiable up to minimal concentration of 0.2%. The resolution (R) between other isoforms was maintained (R=1.5 between disialo- and trisialo-Tf) with an increase of signal intensity of two times in respected to the results obtained using the “traditional” method.
The intra-day reproducibility study of asialo-Tf showed a coefficient of variation (CV) of 23%, for concentrations of asialo-Tf ≤ 0.2% and a CV of 7%, for concentrations ≥ 0.7%. The inter-days reproducibility was characterized by a CV range from 22.5% (for an asialo-Tf concentration of 0.21%) to 5% (for an asialo-Tf concentration of 1.23%). These results can be considered acceptable taking into account the instrumental sensitivity of CE.
Although a final validation is still lacking (e.g. by applying immunoextraction and/or immunosubtraction test), at the present stage of the work, we can state that for the first time in the literature a method suitable for the detection and quantification of asialo-Tf in human serum has been developed and preliminarily validated.
3
1. Introduction
1.1 Forensic analysis
In the recent decades, CE has proved to be a powerful technique also in forensic analyses because of its excellent separation efficiency, high resoluion and selectivity, short analysis time, low reagent consumption, sample volume and cost [1-4].
It is known that CE is one of the most popular separation techniques by which it is possible to identify the human Transferrin (Tf) and its isoforms in the examination of Carbohydrate-deficient transferrin (CDT): important biomarkers used to determine alcohol abuse and related diseases. Consequently, today CE is a routinary technique usedto investigate chronic alcohol abuse in the context of driving licences restitution after suspension for drunk driving [5-10].
1.1.1 Alcohol abuse and its determination in the forensic field
“Alcohol” (ethanol or ethyl alcohol) is one of the most commonly consumed psychoactive compounds in the world often used to promote social interaction and generally legally accepted in most countries. However, alcohol is a depressant that can impair a person's abilities such as to operate a motor vehicle and therefore one of the most popular forensic chemical analyses performed for criminal and medico-legal purposes is to determine blood alcohol concentration (BAC). Indeed, a recent review article evaluating 69 epidemiological studies found that 52% of driving-related fatalities and 35% of driving-related injuries were associated with positive blood alcohol tests [11].
Although alcohol metabolism has been studied for over 100 years, accurately predicting BAC following alcohol consumption remains an open question. In fact, precise estimation of the BAC at a given time point is complicated by individual variability in body and metabolism characteristics (e.g. age, body mass index, liver health, state of nourishment, state of hydration and basal metabolic rate), variability
4 in mass or concentration of alcohol present in beverages (e.g. beer, wine, spirits), modes of drinking, biological matrices sampled etc. This makes complex the identification of the intoxication state of a person if blood alcohol analysis has not been performed in the immediacy of the forensically relevant event or action.
On the other hand, much more difficult is the identification of a chronic alcohol abuser, in whose body alcohol is not always present. To this aim, biomarkers have been adopted to provide objective evidence onto which a decision could be grounded.
Actually, in this field, the CE is a routinary technique used in many clinical and forensic laboratories and for this reason, in consideration of the previous experience of our research group, it been chosen for the development of the present study.
1.2
Carbohydrate-deficient transferrin
There is evidence concerning not only road crashes and drunk driving, but also the correlation between the long-term drinking habits and the risk of causing or being involved in a traffic accident. Consequently, when persons whose driving license was confiscated for “drunk driving” apply for license re-granting, it is necessary to evaluate the risk for the subject of relapse to alcohol abuse [5, 12].
In many European countries the evaluation of this delicate matter include a medical visit, patient interview and the determination of some biomarkers of alcohol abuse among which the CDT is by far the most popular.
It is known that CDT serum concentration increases after sustained and repeated alcohol intake (> 60-80 g of alcohol/day for at least 10-15 days) [12]. Among CDT isoforms the disialo-Tf isoform as stated by the Working Group on Standardization of CDT (WG-CDT) as “primary taget analyte” for CDT determination in the diagnostics of alcohol abuse [13].
There are some published studies supporting the correlation between CDT concentrations with the risk of driving under the influence of alcohol and with alcohol diseases in physiological and pathological conditions (tobacco smoking, liver diseases, diabetes mellitus, treatment with anti-epileptic drugs, etc.) [14-16].
5 In recently years, most literature based on advanced techniques as specific immunoassays, high-performance liquid chromatography (HPLC) and CE proved that diagnostics specificity of CDT is extremely high, approaching 100%.
Thus, the scientific interest is focused on improvement the analitycal methods used to identify and quantify this biomarker which could provide important additional informations in forensic and clinical environment.
1.2.1 Background: human metabolism of alcohol
Ethanol (or ethyl alcohol) is a linear alkyl chain alcohol (CH3CH2OH). It is a small, polar molecule that accumulates in water-rich areas of the body and does not diffuse info lipids. Following ingestion, alcohol is absorbed slowly in the stomach and rapidly in the small intestines. The rate of alcohol absorption is affected by the rate of gastric emptying influenced by various factors (e.g. food ingestion, age, sex, etc.).
Many enzymes are responsible for alcohol metabolism including alcohol dehydrogenase (ADH) in the liver, aldehyde dehydrogenase (ALDH) and cytochrome P450 2E1 (CYP2E1) in the brain and liver (Fig. 1.) [11]. Around the 90-98% of ingested alcohol is metabolized through the ADH and ALDH pathway and other phase II metabolic pathways, while the remaining 2-10% is excreted un-modified in breath, sweat and urine.
6 In cases of low consumption, alcohol is metabolized and eliminated without significant physiological effects. However, once a threshold exposure is reached (which varies among individuals), the metabolic enzymes are saturated and excess alcohol begins to accumulate in the blood stream where it will diffuse across the blood brain barrier causing inebriation and impairment of physiological responses.
The BAC changes as a function of time increasing following an exponential curve until a maximum of absorption (absorption phase), and it decreases linearly during its elimination until a very low levels (< 0.01/0.02% of BAC) starting from which the decrease becomes exponential (elimination phase). The alcohol content varies widely by type of drink and influences the BAC. Indeed, the percentage of alcohol by volume (ABV) impacts the rate of absorption: drinks with 10-30% ABV are absorbed faster while stronger or weaker drinks are absorbed more slowly. It is when the elimination phase has been reached and BAC is declining that the biological influence of alcohol can be evaluated.
1.2.2 Carbohydrate-deficient transferrin: biomarker of chronic alcohol abuse
Human Tf is the main iron transport serum glycoprotein (Fig. 2.a).
Tf consists of a polypeptide chain with two binding sites for iron (F𝑒3+) and two N-linked oligosaccharide chains (Fig. 2.b).
7
Fig. 2. The cycle of Tf [16]. (a) The Fe-Tf binds the receptor TfR and the complex is internalized by
endosomes. The iron is released and transported in the cytosol by the divalent metal Transporter 1 (DMT1). (b) Structure of Tf based on PyMOL rendering of PDB 1a8e. [UniProt P02787 human serum Transferrin].
There are different Tf isoforms because the two N-linked oligosaccharide chains can be n-“antennary” at the extremity with a different numbers of sialic acid residues. A group of human Tf isoforms is called CDT. These are characterized by zero, one or two sialic acid residues and include monosialo-, asialo- and disialo-Tf. These isoforms are present in blood at low concentration in comparison to the main isotransferrin called tetrasialo-Tf with four sialic acid residues (> 90% after the complete F𝑒3+ saturation) (Fig. 3.).
Fig. 3. Schematic representation of the clinically relevant Tf isoforms [10]. Asn, asparagine
residue; hexagon, N-acetylglucosamine; pentagon, mannose; diamond, galactose; and triangle, sialic-acid.
Helena Stibler has introduced CDT as biomarker of alcohol abuse at the end of the 1970s [17]. Nowadays, it has been extensively studied and the less glycosylated isoforms as asialo- and disialo-Tf are considered the most reliable markers to verify alcohol abuse [18-23].
It is believed that an ethanol intake > 50-80 g/day for one to two weeks leads to abnormal increase of serum CDT, which has a half-life of about 15 days. The exact
8 mechanism of this phenomenon has not been clarified yet, but the inhibition of glycosylation enzymes mediated by acetaldehyde, the major metabolite of ethanol, is probably involved.
1.2.3 Review of methods of analysis for carbohydrate-deficient transferrin
Until recently, the analytical determination of CDT has been based on chromatographic techniques (e.g. anion-exchange chromatography or chromatofocusing) followed by immunofixation or western blotting. These multi-step techniques are too complex, time consuming for routine application and suffer from poor quantitative reliability due to the complex manual procedures required [24-26].
The first commercial method to test CDT in serum (CDT tech) was available in 1992 and was based on a two-step procedure that included the elimination of trisialo- and more glycosylated Tf isoforms by ion-exchange micro-columns and the determination of the remaining Tf-like immunoreactivity (expressing CDT) by immunoassay [20].
However, to meet the basic requirements for any forensic applications, results from immunoassay need to be verify by an independent, non-correlated analytical method (e.g. chromatography or electrophoresis) with the limit that the quantitative reliability of gel electrophoresis or chromatography off-line coupled to immunoassay is generally poor.
An alternative method to perform CDT analysis is HPLC [24] with visible radiation absorbance detection (460 nm). In fact, HPLC–UV–Vis is based on physio-chemical characteristics of the molecules which are independent of ‘‘antigenicity’’ and, therefore, can be considered inherently ‘‘orthogonal’’ to IA. Unfortunately, HPLC– UV–Vis, even in its more recent evolution, needs complex sample preparation and expensive and delicate column regeneration.
Already in 1989, Kilar and Hjerten reported the successful application of CE in either capillary isoelectric focusing (CIEF) [25] or CZE [26] modes to resolve the major forms of human Tf (in pure solutions), according to the different content of sialic acid and different degree of iron complexation. In 1996, Oda and Landers published a
9 detailed study aimed at testing the ability of CZE to separate Tf isoforms of different species [27], including human Tf, with the ultimate goal of developing a clinical diagnostic test. The results showed the separation of the iron-saturated human Tf isoforms from trisialo- to hexasialo-Tf, but according to the authors themselves, the assay was inadequate for application to human sera because of long analysis time and mediocre peaks resolution. Later, Prasad et al. [18] and Oda et al. [28] using DB-17 coated capillaries and buffers containing hydroxy-ethyl cellulose or methyl cellulose, respectively, improved resolution and analysis time.
However, to achieve the needed sensitivity for clinical application (e.g. diagnostics of CDG syndrome or alcohol abuse) a sophisticated, expensive and time-consuming sample preparation based on immunoextraction of Tf from serum samples was required before CE to avoid differences in CDT quantification in comparison to the results obtained using different techniques that require a different calibration. Indeed, in order to identify “positive” CDT samples, each method has its specific cut-off that change depending on the reliability required (e.g. CE has a cut-off ˃ 1.6% in a range of 1.3% to 1.6%, HPLC cut-off is ˃ 1.7% in a range until ˃ 20%, and immunoassay has a cut-off ˃ 2.5% that depending on application can be fixed a ˃ 2.2% or ˃ 2.6%). Furthermore, there is inter- and intra-individual variability for these analytes.
Actually, different multi-levels studies are underway for CDT standardization [5, 13] because internationally recognized as the most specific test among alcohol consumption biomarkers (by IFCC, the International Federation of Clinical Chemistry and Laboratory medicine).
1.3 Analytical Technology
At present, the most used instrumental analytical techniques can be grouped in three categories: chromatographic, spectroscopic and electrophoretic.
Nowadays, microfluidics has improved analytical techniques for which it offers a series of very useful functions as the possibility of using very small quantities of samples and reagents and performing separations and detections with high
10 resolution and sensitivity, at low cost, in short times and in a small footprint for analytical devices.
The possibility of producing micro-flows of liquids in channels with dimensions in the range 10 to 100 μm has permitted in the last years an increased utilization of devices based on microfluidic system [29, 30].
1.3.1 Capillary Electrophoresis
The CE is historically the micro-separative technique for excellence that permits to pursue different analytical aims by using few nL of sample.
Currently, the microfluidic devices are utilized in different fields like environmental and industrial analyses, molecular biology and pharmaceutical fields, clinical and forensic application [30].
CE has been shown to be a valuable technology for the analysis of a variety of analytes including larger molecules such as DNA and proteins. Protein separation can be achieved effectively with CZE, if the analytes have significant differences in electrophoretic mobility to be well resolved.
In the field of protein separation, CE has been shown to be particularly effective for the resolution of protein glycoforms that can be difficult to using conventional methods. There are evidences in literature that highlighting the CE-based resolution of glycoforms of ovalbumin [31], recombinant erythropoietin [32] and Tf [18, 28, 29].
1.3.2 Basic principles and composition of the CE instrument
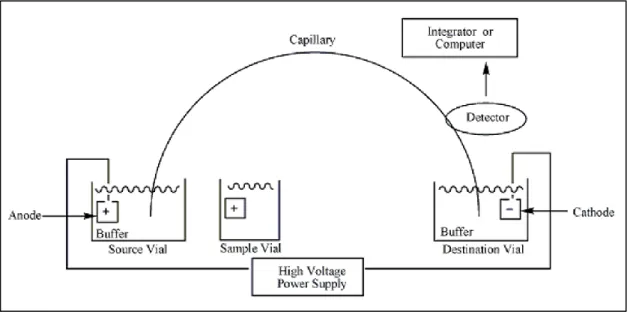
CE may be considered as an improvement of flat bed electrophoresis. Both techniques share the same basic principles but differ from each other in the physical compartment where the electrophoretic separation takes place. Indeed, in the traditional electrophoresis is applied to slab gels, while in CE a separation compartment is a narrow capillary filled with an electrolytic solution (Fig. 4.). The narrow capillary is generally made of fused silica and is enclosed in a thin layer of
11 polyamide that acts as a “shell” for the glass capillary that is fragile and of minute dimensions (usually with inner diameter of 20-100 µm).
Fig. 4. Schematic representation of the CE system.
In summary, electrophoresis was introduced by Tiselius in 1937 [33]. It is a separation analytical technique based on different migration of charged particles in solution under the influence of an electric field. In order to avoid the thermal diffusion and convection phenomena, the technique has traditionally been fitted with anti-convective media such as gels or cellulose. In CE this phenomenon has been reduced by performing separations in capillaries.
Capillary analysis occurs moving fluids through micro channels by applying a pressure or by exploiting a voltage. In the first case, a laminar flow is formed driven by pressure assuming a parabolic profile as consequences of the interaction between the fluid and the wall of the capillary. Another method to move fluids into micro-channels is the application of an electric field. When using internally charged micro channels, the ions of the separation buffer generate a double layer close to the wall of the capillary. The counter ions placed close to the charged moieties of the channel move toward the extremity with opposite charge as consequences of the applied voltage. Thence, a flow is formed with uniform velocity along the capillary, also colse to the capillary wall, known as electroosmotic flow (EOF).
12 The basic principle of all electrophoretic separation methods is that different particles with different effective charges and sizes migrate with different velocities.
The separation process is based on different velocities of the components of the sample that can be expressed as Eq. 1.
Eq. 1.
v = 𝜇𝑒E
v = velocity
𝜇𝑒 = electrophoretic mobility E (volts/cm) = electrical field strength
Electrophoretic mobility 𝜇𝑒 can be calculated on the basis of the electric and the frictional force (Eq. 2.).
Eq. 2. 𝜇𝑒 = ( 𝑞 6 𝜋 𝑟 𝜂) 𝜇𝑒 = electrophoretic mobility q = ion charge r = ion radius η = solution viscosity
Highly charged and small ions have a high velocity of migration and vice versa.
The voltage is applied with an external voltage source between two electrodes in small vials in contact with the solution at both ends of a separation compartment. After the application of the potential, the cathode attracts the cations and the solution follows in this same direction. This flow is defined electroendosmotic flow (EOF) and its velocity depends on the electric field (Eq. 3.).
13
Eq. 3.
𝜇𝜀𝑂𝐹 = 𝜀𝜉 𝜂
𝜇𝜀𝑂𝐹 = electrophoretic field mobility ε = solution dielectric constant ξ = zeta potential
η = solution viscosity
The velocity of EOF is also pH dependent. In fact, for low concentration of H+ the EOF is higher than for acid buffer. The EOF has been observed also for not charged capillary wall like Teflon maybe due to the adsorption of the negative ions. If the EOF is higher than the mobility of the anions compounds, consequently also the negatively charged compounds move toward the cathode allowing the detection in a single run of cations, anions and neutrals (these last are not separated). Additives can be added to the buffer solution that modify the EOF.
The apparent velocity of the cations and anions in terms of mobility is expressed as
Eq. 4.
Eq. 4.
𝜇𝑎 = 𝐸𝐿 𝑇𝐿 𝑇𝑚 𝑉
𝜇𝑎 = apparent mobility
EL= effective capillary length (until to detector) TL = total length
𝑇𝑚 = migration time of analyte V = applied voltage
In CE the sample can be injected in the capillary hydrodynamically or electrokinetically. The first case uses a pressure difference (e.g. by applying pressure at the inlet, or vacuum at the outlet, or by raising the inlet to create a siphon).
14 In the latter case, a voltage is applied to the sample vial and the combination of the analyte mobility with the EOF drives the sample into the capillary.
The most used method is the hydrodynamic injection that applies a pressure to pump the sample in the capillary. The volume (vol/cm) is estimated by using the Hagen-Poiseuille equation (Eq. 5.).
Eq. 5.
𝑉𝑜𝑙 = 𝛥𝑃 𝑑 4 𝜋 𝑡 (128 𝜂 𝑇𝐿)
Vol = volume of injection
ΔP = pressure difference across the capillary d = inner diameter of the capillary
t = time
η = buffer viscosity
TL = total length of the capillary
At the end of analysis, a detector records the signal. There are a lot of detection modes in CE (Table. 1.). The detection mode is dictated by the properties of analytes and the aim of analysis.
Table. 1. Detection modes in CE.
Detection modes in CE
Direct UV detection Indirect UV detection Fluorescence detection MS detection
The most commonly detection mode used in CE is the UV detection. The analyte must possess a chromophore which is capable of absorbing ultraviolet or visible radiations. The capillary is illuminated with UV radiations or with light of a specific wavelength (fixed or not). The absorbance of an analyte is a function of the absorptivity, the path length and the concentration of the analyte (Eq. 6.).
15 Eq. 6. Abs = εcl Abs = absorbance ε = molar absorptivity c = analyte concentration l = path length
Another detector system is based on indirect UV detection that is used for the detection of non-absorbing ions (e.g. inorganic ions). The capillary is filled with an absorbing background buffer.
Instead, in fluorescence detection a excitation wavelength is absorbed by a suitable fluorescent analyte that emits a different, usually longer, wavelength.
A special detector for CE is the mass sensitive detector, which allows determination of the molecular mass of analytes. The outlet of CE capillary is coupled to the mass spectrometric detector via an ionisation interface.
1.3.3 Method development and parameters to consider in CE analysis
The process of method development for CE is conditioned by the properties of the analytes and of the available samples. The CE is characterized by low sample preparation requirements but still there are procedures that should be followed. Samples should be filtered through a 0.2 μm pore prior to analysis and care should be taken that the filter material is inert with the sample matrix. The second procedure is the desalting. In this procedure biological samples should be diluted, if there is sufficient concentration, dialyzed or extracted with organic solvents. It is important that the analyte is soluble in the run buffer. In fact, the injected sample must dissolve in the run buffer, also if it concentrates in a single zone, Such as in stacking procedures. In this case, if the analyte is slightly soluble, it could precipitate affecting separation.
16 Thence, the choice of buffer and its composition is the key element to obtain high resolution in CE that is also influenced by efficiency, selectivity and the capacity factor (Eq. 7.). Eq. 7. 𝑅𝑠 = √𝑁 4 ∗ 𝛼 − 1 𝛼 ∗ 𝐾′ 1 + 𝐾′ 𝑅𝑠 = resolution √𝑁 4 = efficiency 𝛼−1 𝛼 = selectivity 𝐾′ 1+ 𝐾′ = capacity factor
In the process of an analytical method development, the main goals are to achieve high resolution between the peaks of interest and to optimize the selectivity for target compounds. The obtained separation has to be stable such that subsequent analyses change as little as possible from each other. In particular, the parameters that have not to change are resolution and the migration time and so any parameter, which can affect them, has to be stable. Only after the statistical validation of the method, it is possible to carry out a quantitative analysis and to obtain reliable results.
1.3.4 Principal CE separation modes
One of the major advantages of CE is the flexibility to perform analysis using a wide variety of separation modes depending on the characteristics of compounds and the objectives of the analysis (Table. 2.) [34]. In many cases, you can switch from one separation mode to another simply by changing the buffer system.
17
Table. 2. Separation methods.
Using CE mode… For analysis of…
Capillary zone electrophoresis (CZE) Ions, etc.
Micellar electrokinetic chromatography (MEKC) Neutral and ionic analytes
Chiral capillary electrophoresis (CCE) Chiral molecules
Capillary electrochromatography (CEC) Small molecules
Capillary gel electrophoresis (CGE/SDS-PAGE) DNA/RNA size/protein MW Capillary isoelectric focussing (CIEF) Protein/peptide isoelectric point
Capillary isotachophoresis (CITIP) Ions
CZE is the basic mode of CE in which analytes in solution are separated based on mobility or charge-to-mass ratio differences (section 1.3.2). In CZE separation, small and highly charged cations have high mobility and travel fast through the capillary, while large cations with small charge-to-mass ratio elute next. Instead, neutral molecules travel in the flow, but are not separated. These are followed by large anions with low negative mobility and as last by small anions with high negative mobility (Fig. 5.).
18 In CZE, neutral compounds are not separated. This can be performed by MEKC separation. In this mode of CE, selectivity is based on the differences in hydrophobicity. This is achieved adding to the run buffer a surfactant able to form micelles. The most used micellar-forming agent is SDS. Above critical concentration, SDS molecules associate their hydrophobic tails together creating a hydrophobic core with charge ends directed towards the run buffer. The analytes will spend more or less time inside the micelles depending on their hydrophobicity. The degree of inclusion in the micelle will determine the speed of migration. Analytes that stay longer in the micelles will have a long migration time and vice versa (Fig. 6.).
Fig. 6. Schematic representation of the MEKC separation [34].
CE is a promising technique also to perform enantiomeric separation. In particular, CCE mode is used to separate enantiomers, isomeric compounds that are mirror images of each other. Two enantiomers are sterically different, therefore they interact differently with the chiral substances added to the run buffer. These different interactions or binding imply that the two enantiomers will have different mobility and thereby will be separated (Fig. 7.).
19
Fig. 7. Schematic representation of the CCE separation [34].
In capillary electochromatography (CEC), the EOF is used to drive analytes through a capillary that is filled with LC-like packing materials. The separation is the result of the differential partition of analytes between the mobile and the stationary phases (Fig. 8.).
20
Fig. 8. Schematic representation of the CEC separation [34].
Capillary gel electrophoresis (CGE) is used to separate large biomolecules. The separation obtained is analogous to those obtained from slab gel electrophoresis of which the CGE can be viewed as the instrumental version. In CGE, the capillary is filled with a polymer, which forms an entangled matrix that acts as a molecular sieve where small molecules migrate more quickly than large molecules (Fig. 9.).
21
Fig. 9. Schematic representation of the CGE separation [34].
A particular CE mode is CIEF that is specifically used to determine the isoelectric point of peptides and proteins. The analyses are performed in two-step. At first, the capillary is filled with a solution containing a complex ampholyte mixture composed by the marker proteins and the sample. An electric field is applied whereby the background ampholytes establish a pH gradient and proteins migrating depending on their net charge. When a protein reaches a point inside the capillary at which the pH equals its isoelectric point, it becomes electrically neutral and stops migration. In the second step, the bands are mobilized towards the detection window keeping the electric field applied. The mobilization can be accomplished electrochemically or by applying external pressure (Fig. 10.).
22
Fig. 10. Schematic representation of the CIEF separation [34].
Differently from other CE modes, Isotachophoresis (CITP) uses a discontinuous buffer system. Firstly, a leading electrolyte solution containing ions of high mobility is introduced into the capillary, followed by a sample plug injection, and finally a tailing electrolyte solution containing low mobility ions is introduced. The leading electrolyte solution contains ions with highest mobility than any other present in the sample. Since differences in the strength of the local electric field establish sharp boundaries among leading electrolytes, all different sample components and the tailing electrolytes so that components elute in the order of their mobility (Fig. 11.).
23
Fig.11. Schematic representation of the CITP separation [34].
1.3.5 Advantages and main applications of CE
In the recent decades, CE has been proved as powerful analytical technique because of its excellent separation efficiency, high resolution and selectivity, acceptable analysis time, low consumption of sample and chemical reagents and low costs. Both in laboratory research and in routine analyses, the development of CE technology has been a fundamental step forward becoming today a standard technique worldwide [35, 36].
In particular, the CE is known to be one of the best separation techniques used for enantioselective analysis [37, 38]. In forensic sciences, many studies focus on the development of new CE analytical methods for stereo selective separations of New Psychoactive Substances (NPS) and new therapeutic drugs.
The number of publications underlines the increase of interest in the development of CE-based assays for clinical research and forensic application. The aim is to detect useful biomarkers related to pathologies and use of drugs and alcohol.
In recent years, the use of modern versions of CE in the high-throughput capillary array configuration is steadily increasing, particularly in DNA and protein analysis.
24 These technologies do not require elaborate sample pre-treatment and they can be fully automated.
Future perspectives are also focusing on coupled CE with Mass Spectrometry (MS) or other detection devices (e.g. fluorimetric, optical, etc.).
25
2 Aim of thesis
The present research aims at developing an optimized CE method for CDT analysis in order to identify and quantify asialo-Tf isoform.
Currently, the disialo-Tf isoform has been stated by the Working Group on Standardization of CDT (WG-CDT) as “primary target analyte” for CDT determination. Nowadays, several commercial or home-made assays based on different analytical techniques for CDT determination are available such as I.A, LC or HPLC and CE. These methods are widely reported for CDT identification and quantification, but they do not allow for accurate determination of the asialo-Tf isoform because of its low concentration.
This present work was started focused on testing different experimental conditions (temperature, type and time injection, electrical potential), including sample stacking steps, changes of the running buffer composition and pre-treatment of samples, in order to obtain the highest CE sensitivity and resolution for asialo-Tf allowing its quantification.
The identification of asialo-Tf isoform may provide important additional information in CDT analysis that could be useful for forensic and administrative purposes to monitor abstinence in alcohol abusers.
26
3 Materials and Methods
3.1 Materials
All used chemicals were of analytical grade. Preliminary analyses were performedon a CDT test solution (Clin Test®) from Recipe (Munich, Germany). The Fe3+ ion-containing solution was obtained from Analis (Namur, Belgium).
Boric acid (H3BO3) was purchased from PlusOne Amersham Biosciences (Little Chalfont, UK). 1,4-diaminobutane 99% (DAB) was from Sigma-Aldrich (St. Louis, MO, USA). Lithium chloride (HCl) 37% and sodium hydroxide (NaOH) were from Carlo Erba Reagenti (Milano, Italy). Polyethylene glycol (PEG) 8.000 was purchased from Sigma Aldrich (Steinhei, Germany). Milli-Q water, produced with a Millipore Ultra-pure water system (Millipore, Bedford, MA, USA), was used for preparation of the buffers and all aqueous solutions.
3.2 CE instrumentation and analytical conditions
All CE experiments were performed using a PA 800plus CE apparatus equipped with UV-DAD detection (Sciex, Framingham, MA, USA). All experiments were performed at the detection wavelength of 200 nm.
An uncoated fused-silica capillary with internal diameter (i.d) of 30 μm and total length of 60 cm (48 cm to the detection window) was used throughout the study. The capillary was rinsed everyday with NaOH 1 M (10 min/50 psi), NaOH 0.1 M (5 min/50 psi), water (10 min/50 psi) and running buffer (15 min/50 psi). Between analyses, the capillary was further rinsed with NaOH 1 M (3 min/50 psi), water (2 min/50 psi) and running buffer (5 min/50 psi).
The capillary cartridge temperature was maintained at 28 °C.
Analyses were carried out using a running buffer containing H3BO3 500 mM pH 8.1/8.2 adjusted with NaOH 6 M, DAB 90 mMol/L prepared in HCl 0.05 M and water.
Serum samples were injected by using hydrodynamic injection by application of a positive pressure of 0.5 psi for 50 s at the injection side; the separation occurred under an applied voltage of 30 kV.
27
3.3 Specimen
collection
Anonymous sera from patients undergoing CDT analysis for re-issuing of the driving license were obtained from the departmental laboratory of forensic toxicology.
All sera were obtained from blood samples drawn by venepuncture and collected in plastic tubes without any additive (BD Vacutainer System, Plymouth, UK; 6 mL). After clotting at room temperature, the blood samples were centrifuged for 10 min at 5000 rpm and the supernatant was then transferred into 6.0 mL polypropylene tubes. All sera were stored at −24°C.
3.4 Sample
preparation
After preliminary tests performed to select the optimal analysis conditions, the following conditions were adopted: temperature of 28 °C, applied voltage of 30 kV, sample injection time of 50 s at 0.5 psi, running buffer added with DAB 9 mM, final concentration. The running buffer was prepared every three days and stored at 4 °C.
Sera samples were fresh prepared before analysis.
Samples analyzed without PEG-8000 pre-treatment were diluted 1:8 (v/v) with the iron solution and centrifuged at 7500 rpm for 15 min to remove particulate material caused by precipitation or aggregation of the serum components.
Specific analytical conditions were used in selected experiments, as described in the text.
Samples analyzed with PEG-8000 pre-treatment, using a previously optimized procedure [6], followed a different preparation. Equal volumes (1:1, v/v) of serum and of PEG-8000 40% solution were mixed and briefly vortexed. This mixture was centrifuged at 7500 rpm for 15 min to obtain precipitation of proteins with high molecular weight (e.g. immunoglobulin). The supernatant was subsequently diluted (1:1, v/v) with the ferric solution for Tf saturation. The analyses took place under selected experimental conditions further described in the text.
28
3.5 Asialo Transferrin identification and quantification
The identification criteria of asialo-Tf were based on its 𝑇𝑚𝑟 calculated as the ratio of the migration time (𝑇𝑚) of the presumptive asialo-Tf peak and the 𝑇𝑚 of tetrasialo-Tf (Eq. 8.).
Eq. 8.
𝑇𝑚𝑟 =
𝑇𝑚 𝑝𝑒𝑎𝑘 𝑋 𝑇𝑚 𝑡𝑒𝑡𝑟𝑎𝑠𝑖𝑎𝑙𝑜−𝑇𝑓
𝑇𝑚𝑟 = relative migration time (experimental parameter) 𝑇𝑚 = migration time (experimental parameter)
X = presumptive peak of the asialo-Tf
The resolution among Tf isoforms was calculated according to the USP (United States Pharmacopeia) and ASTM (American Society for Testing and Materials) guidelines (Eq. 9.). Eq. 9. 𝑅𝑠 = 𝑡2− 𝑡1 𝑊1+ 𝑊2 2 𝑅𝑠 = resolution
𝑡2− 𝑡1 = difference of migration time of two adjacent peaks 𝑊1+ 𝑊2 = width at the baseline of the two adjacent peaks
Peak areas of all Tf glycoforms were determined by peak integration.
The asialo-Tf quantification was based on the percent ratio between the area of asialo-Tf and the sum of the total area of all the Tf isoform peaks identified. (Eq. 10.).
29
Eq. 10.
% A of asialo-Tf = 𝐴𝑎𝑠𝑖𝑎𝑙𝑜
𝐴𝑎𝑠𝑖𝑎𝑙𝑜 + 𝐴𝑑𝑖𝑠𝑖𝑎𝑙𝑜 + 𝐴𝑡𝑟𝑖𝑠𝑖𝑎𝑙𝑜 + 𝐴𝑡𝑒𝑡𝑟𝑎𝑠𝑖𝑎𝑙𝑜/𝑝𝑒𝑛𝑡𝑎𝑠𝑖𝑎𝑙𝑜 * 100
A = area
At present, the CDT analyses to test alcohol abuse is based on the disialo-Tf quantification and it is considered "positive" using the usual cut-off 1.8% [39].
30
4 Results and discussion
In the present work, a new CE method for the analysis of the human Tf glycoforms, stemmed from a “traditional” method [8], has been developed. This method is able to provide the identification and the relative quantification of asialo-Tf, a secondary diagnostic parameter, in addition to disialo-Tf, to assess chronic alcohol abuse.
In a previous study that compared HPLC and immunochemical assay with CE, the last one was reported as the most promising, although still unsatisfactory, analytical technique for its ability to identify the asialo-Tf peak. In fact, CE proved efficient in separating CDT [39-42] in terms of plates number/column (Eq. 11.), that underlined a superior ability to describe the electrophoretic peaks even with small intensity.
Eq. 11.
𝑁 = 5.54 ∗ ( 𝑇𝑚 𝑊1 2
)2
N = efficiency expresses in theoretical plates
𝑇𝑚 = migration time 𝑊1
2
= the bandwidth at half peak height, W, is defined as 4σ, where σ is the standard deviation (SD)
Nevertheless, many problems affected the CDT separation in CE, in particular the limited instrumental sensitivity, which affected the detection of the asialo-Tf because of its low concentration. Furthermore, the detection at 200 nm wavelength caused interferences due to co-elution of spurious peaks of unidentified serum proteins (i.e, C-reactive proteins, immunoglobulin and their light chains, etc.).
The optimized procedure has been developed starting from the CE “traditional” method based on an alkaline borate running buffer contained cationic additives, which act as a dynamic coating to avoid that proteins stick to the capillary walls.
31 Primarily, a range of experimental conditions was tested selecting those that provided better separation among Tf isoforms decresing background noise.
A reference CDT solution and real samples with higher disialo-Tf concentration than the usual cut-off (disialo-Tf “positive” ≥ 1.8%) were analyzed.
Experiments were performed maintaining the original running buffer composition, but changing the temperature, from 15 to 30° C, the injection time, from 10 to 99 s and the applied voltage, from 10 to 30 kV (by steps of five units).
The best results in terms of “cleanness” of the electropherogram with a relatively flat baseline were obtained at 28° C, injection time of 25 s at 0.5 psi and voltage of 30 kV (Fig. 1.a), while a lot of interferences were observed with “traditional” conditions (Fig. 1.b). The selected experimental conditions allowed for the identification of a “new” peak with the relative migration time (𝑇𝑚𝑟) of 0.8 in correspondence with the migration region of asialo-Tf isoform (Fig. 1.a). However, the asialo-Tf peak intensity, based on IUPAC and ACS definitions (LOD), calculated as the ratio of signal to noise (S/N), resulted low (S/N=2) as the peak was in part not distinguished from the matrix-related noise. Instead, in the result of the analysis performed with “traditional” method, this peak was not detectable and remained completely hidden in the matrix-related noise (Fig. 1.b).
On the other hand, under the selected conditions, an increase of the quality of the separation of all Tf isoforms was found. Indeed, the diasialo- and trisialo-Tf had an acceptable resolution (R) of 1.3 and the pentasialo- and hexasialo-Tf isoforms
showed a R=1.4 (Fig. 1.a), while they were unresolved using the “traditional” method (Fig. 1.b).
32
Fig. 1. A standard solution of CDT analyzed according to selected experimental parameters (a), and
compared to the “traditional method” (b).
a) The analysis was carried out under the selected experimental conditions of 28° C, 25 s at 0.5 psi of
injection time and applied voltage of 30 kV. The electropherogram showed a good resolution for all Tf glycoforms, notwithstanding a fairly troubled baseline. A peak corresponding to the asialo-Tf was
R=1.4
R=1.3
𝑆
33 identified, even if partially hidden by the matrix-related noise. However, there was a net noise improvement in respect to the electropherogram resulted with the “traditional method” (b) that showed poor resolution of penta- and hexasialo-Tf glycoforms, a long 𝑇𝑚, for all Tf isoforms and the asialo-Tf
peak completely not detectable.
As previously stated, the identification of the "new peak" with asialo-Tf was based on 𝑇𝑚𝑟.
Fifty samples, in which the peak of the asialo-Tf was detectable, were tested to estabilish the variability of the 𝑇𝑚𝑟 of asialo-Tf peak. Based on experimental data, the mean 𝑇𝑚𝑟 resulted 0.747, as average value of four repetitions for each sample, with a coefficient of variability (CV) of 4% (Eq. 12-14.). Thus, in the further analyses, the presumptive peak has been attributed to asialo-Tf, if the 𝑇𝑚𝑟 was included in a range between 0.69 and 0.82. Eq. 12. 𝜎^2 = ∑ (𝑋𝑖− 𝜇) 𝑁 𝑖 = 1 𝑁 − 1 𝜎^2 = sample variance
i = index (from 1 to 50 samples)
𝑋𝑖 = the 𝑇𝑚𝑟 of peak related to the asialo-Tf 𝜇 = average value of the 𝑇𝑚𝑟 of asialo-Tf
N = number of samples
Eq. 13.
± SD = √𝜎^2
SD = standard deviation
34 Eq. 14. CV = 𝑆𝐷 𝜇 * 100 CV = coefficient of Variability SD = standard deviation
𝜇 = average value among the 𝑇𝑚𝑟 of asialo-Tf
Several attempts were executed with different running buffer composition to optimize the asialo-Tf detection, we mention the following.
At First, the running buffer was added with lithium cloride (LiCl) in order to reduce the ion-exchange interactions of the proteins with the capillary wall silanols by competition with the small lithium cations. The running buffer added with LiCl at different concentrations, from 20 to 400 mM (by steps of ten units), was tested.
The results showed that increasing the concentration of LiCl the current raised up, but above the concentration of 30 mM the quality of separation dropped down. Instead, slight improvements of the separation were obtained at the concentration of LiCl 30 mM (Fig. 2).This critical point could be due to the initial beneficial effect of the Li ions on the separation, that disappeared at higher concentrations, because the increment of the conductivity and subsequently of the internal capillary temperature affecting the conformation and stability of proteins.
The minor effect obtained on the optimization of Tf isoforms separation with the use of suitable concentration of the additive, in respect to the previous results (Fig. 1.a), led to discard this approach in the process under development.
35
Fig. 2. A standard solution of CDT analyzed using the running buffer added with LiCl 30 mM. The Tf peaks had a shorter 𝑇𝑚 than in Fig. 1.a. All isoforms were separated up to the hexasialo-Tf. No relevant
changes have been observed.
Furthermore, the concentration of DAB was changed, from 0 to 20 mM (by steps of three units).
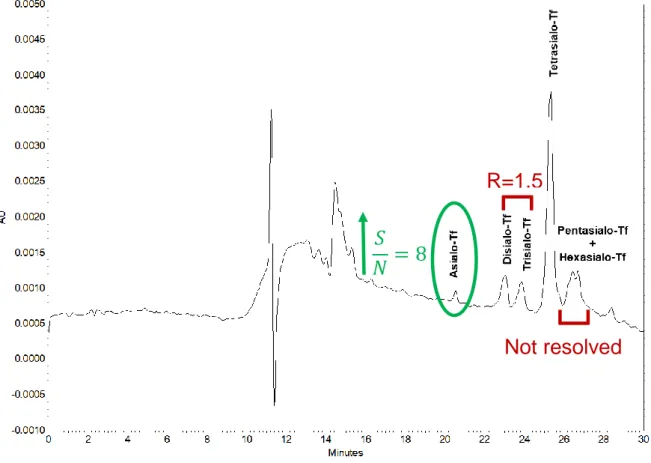
Regarding the identification of asialo-Tf peak, the best results were obtained using DAB at 9 mM (Fig. 3). Under these conditions, the asialo-Tf peak intensity improved four times (S/N=8) compared to previous result (Fig. 1.a) obtained using DAB 6 mM.
In addition, the resolution between disialo-Tf and trisialo-Tfincreased (R=1.5), despite of the resolution loss between the pentasialo- and hexasialo-Tf, in respect to Fig. 1.a. Nevertheless, this lack of resolution does not represent a problem to quantify asialo-Tf. In fact, in any case, the percentage area of asialo-Tf peak it has been calculated using the ratio percent between the area of asialo-Tf and the sum of the total area of all the Tf isoforms, among which the tetrasialo-Tf is the most abundant.
36 The data showed that the 𝑇𝑚 of all Tf isoforms was longer than in Fig. 1.a, as expected because of the reduction of EOF due to the masking effect of surface negative charges generated by the increase of DAB concentration.
In the following analyses, the DAB concentration was maintained at 9 mM in the composition of the running buffer.
Fig. 3. A standard solution of CDT analyzed using the running buffer added with DAB 9 mM. The Tf
peaks had a longer 𝑇𝑚, in respect to Fig. 1.a because of the reduction of EOF. The asialo-Tf showed
four times increase of intensity compared to Fig. 1.a. The resolution was maintained up to the tetrasialo-Tf, while pentasialo- and hexasialo-Tf remained unresolved.
The next step focused on overcoming the instrumental sensitivity limitations by increasing the sample load, in order to obtain a “better representation” of the asialo-Tf signal.
At first, the injection time of sample was increased up to 99 s. In addition, a sample stacking procedure was applied by using two subsequent hydrodynamic injections: one injection of sample and one injection of running buffer ten times diluted (RB 10X). We tested separately the injection of RB 10X plug before and after the injection of the
Not resolved
R=1.5
𝑆
37 serum sample, optimizing both injection times (tested from 5 to 99 s, by steps of five units).
The electropherogram obtained without stacking, but simply increasing the injection time of sample at 99 s (Fig. 4.a), showed that the absorbance intensity for asialo-Tf peak increased 2 times compared to Fig. 3 (injection time set at 25 s), as that resulted from stacking (Fig. 4.b).
The result obtained with stacking (Fig. 4.b) showed an asialo-Tf area increase up to 0.24% and a slight decrease of 0.07% in disialo-Tf quantification, in respect to the results obtained by simply increasing the injection time (Fig. 4.a).
Instead, in both cases, part of pentasialo-Tf co-eluted with the peak of the tetrasialo-Tf (R=0.8), while the hexasialo-Tf remained completely hidden in the matrix-related noise. However, this was expected because of an increase of the loaded material. For the same reason, the data showed a longer 𝑇𝑚 of all Tf isoforms than the 𝑇𝑚 previously obtained (Fig. 1.a and Fig. 3).
A preliminary study on thirty serum samples was carried out comparing the stacking method with the only increase in the injection time. The stacking procedure allowed a quantification of asialo-Tf down to 0.2%, notwithstanding a slight decrease in the quantification of the disialo-Tf of about 0.3% (average values on thirty sample).
However, the problem of background noise due to the other proteins present in the sample affected the reproducibility of results suggesting to avoid the stacking approach in the method under development.
38
39
Fig. 4. Serum sample analyzed without (a) and with (b) stacking of the sample.
a) The electropherogram obtained increasing the injection time of sample at 99 s showed an
improvement of the asialo-Tf peak intensity (S/N=10) compared to Fig. 3. It was observed a partial co-elution of pentasialo-Tf with tetrasialo-Tf (R=0.8) and a hexasialo-Tf peaks completely unresolved. The data showed a longer 𝑇𝑚 of all Tf isoforms than the 𝑇𝑚 previously obtained (Fig. 3) because of the
increase of the loaded material.
b) The result obtained applying the stacking procedure of the sample showed that the asialo-Tf peak
was “better quantified” with an increase to 0.24% in the percentage area calculation. No changes have been observed for the other isoforms in respect to Fig. 4.a.
Taking into account the reproducibility problems, the best compromise to increase the amount of the loaded material was to increase the injection time of sample up to 50 s (Fig. 5.a), without applying stacking.
40 This has allowed asialo-Tf peak identification, despite its low concentration avoiding too intense interferences. However, the asialo-Tf peak even if detectable was difficult to quantify because of broad peaks and the increase of the matrix-related noise in its migration region (S/N=2).
In order to reduce noise, the method developed was combined with a sample pre-treatment based on a selective protein precipitation. The sample pre-pre-treatment consisted in the use of PEG-8000 at final concentration of 20%, following a procedure previously developed in our laboratory, to precipitate proteins that could interfere with Tf isoforms detection [10].
Seventeen sample were analysed with and without the pre-treatment.
Compared to the results obtained without the PEG-8000 pre-treatment (Fig. 5.a) the use of PEG-8000 (Fig. 5.b) showed a better detectability of asialo-Tf, despite a reduction of the disialo-Tf peak.
Furthermore, the results showed a five times improvement in the intensity of asialo-Tf signal (S/N=10), in respect to result obtained without pre-treatment (S/N=2), also maintaining the resolution between disialo- and trisialo-Tf peaks (R=1.35).
Moreover, the use of PEG-8000 pre-treatment halved the total time of the analysis, as result of the deproteinization of the sample.
41
𝑆
42
Fig. 5. Serum sample disialo-Tf “positive” analysed with injection time of 50 s at 0.5 psi, without (a) and
with (b) sample pre-treatment with PEG-8000 20%.
a) The electropherogram showed the asialo-Tf peak, but a high baseline drift in its migration region
(S/N=2) preventing its accurate quantification.
b) The electropherogram obtained with PEG-8000 pre-treatment showed a neat reduction of the
matrix-related interference, as demonstrated by the increase of 0.06% in the percentage area of asialo-Tf calculation and by the improvement of five times in its intensity signal (S/N=10) in respect to Fig. 4.a.
The seventeen samples analysed with and without pre-treatment, including both disialo-Tf "positive" and "negative" (disialo-Tf < 1.8%) samples.
R=1.35
𝑆
43 The results showed that the detection of asialo-Tf was possible not only in samples “positive” for disialo-Tf (Fig. 5.a and b), but also in samples “negative” for disialo-Tf (Fig. 6.a and b).
44
Fig. 6. Serum sample disialo-Tf “negative” analyzed without (a) and with (b) PEG-8000 20%
pre-treatment of the sample.
a) The electropherogram obtained without pre-treatment showed asialo-Tf peak with a percentage area
of 0.41%.
b) The result obtained after PEG-8000 pre-treatment of the sample, as in the results obtained for
disialo-Tf “positive” sample (Fig. 5.a and b), showed an increase in the signal intensity of asialo-disialo-Tf peak and a reduction of 𝑇𝑚 of all Tf isoforms, in respect to Fig. 6.a. In this case, it could observe a slight increase
of 0.21% in the calculation of asialo-Tf percentage area and a slight decrease of 0.05% for that of the disialo-Tf.
It is important to underline that the PEG-8000 pre-treatment produced a slight reduction (of about 0.5%), average value on seventeen samples, in the percentage
45 area of disialo-Tf. For this reason, in view of a practical application of this “new” method, the cut-off for disialo-Tf should be re-considered.
Under the conditions described above, a reproducibility study was performed.
The intra-day reproducibility data were calculated as mean of four analyses performed for each of seventeen samples. The 𝑇𝑚𝑟 of asialo-Tf peak was characterized by a CV of 2%. Instead, the variability of the asialo-Tf peak percent areas, considering the range of detection between 0.2% and 0.8%, showed a CV of 23% (for low concentrations of asialo-Tf, such as from 0.2% to 0.6%) and a CV of 7% (for high concentrations of asialo-Tf, such as from 0.7% upwards)
The inter-days reproducibility study was carried out on two sera representative of low and high concentrations within the detection range of asialo-Tf. The results were calculated as average values of four analyses repeated for four day. The sample with a mean percentage area of asialo-Tf peak of 0.21% showed a CV of 22.5%, as expected for this low concentration. Instead, the sample with a mean percentage area of asialo-Tf peak of 1.03% showed a CV of 5%, that could be considered acceptable taking into account the instrumental sensitivity limit of CE.
46
5 Conclusions and future perspectives
In the present work, it was realized a profound optimization of a “routine” CE method for CDT determination in view of making possible the simultaneous identification of the two main components of this important biomarker of alcohol abuse, such as disialo-Tf and asialo-Tf.
The optimizedprocedure includes a preliminary pre-treatment of the sample with PEG-8000 [10], followed by CE analysis performed using newanalytical conditions including 28 °C temperature, 50 s injection time at 0.5 psi and 30 kV applied voltage and run buffer composition added of DAB 9 mM.
Through the reduction of the matrix-related interferences, a new peak with the 𝑇𝑚 in correspondence with the asialo-Tf migration region was detectable with a sufficient resolution to allow its quantification. This occurred on both disialo-Tf “positive” and “negative” samples for the 85% of the analysed human sera.
The new method allowed for the separation among Tf isoforms up to tetrasialo-Tf. In addition, the higher peak areas led to describe the electrophoretic peaks, even if with small intensity, permitting the asialo-Tf identification and quantification.
A reproducibility study tested positively the statistic confidence of the results.
So, at the present stage of development, we can state that for the first time in the literature a method suitable for the detection and quantification of asialo-Tf in human serum has been developed and preliminarily validated.
Future prospects should be aimed to verify the identity of the presumptive asialo-Tf peak by using immuno-subtraction or immuno-extraction. The main objective should be to provide an accurate quantification of asialo-Tf in physiological and pathological conditions in order to clarify its role in alcohol-related abuse or diseases.
In addition, future studies should focus on coupling CE with other detection devices (e.g. MS, fluorimetric, optical, etc.) able to provide better sensitivity and selectivity.
47
6 Acknowledgements
I would like to thank all the forensic medicine staff.
In particular, my supervisor Professor Franco Tagliaro who
patiently followed the development of the work, providing
help, support and motivation. I also thank my colleagues
and the laboratory technicians for their advices and
practical assistance.
Furthermore, I would like to remember heartfelt my family
and my friends who, even if far away, have never stopped
to support and encourage me.
I would like to add a special dedication to my
grandmother who has inspired my entire course of study.
With gratitude,
48
7 References
1. Tagliaro F., Bortolotti F., Recent advances in the application of CE to forensic sciences (2001-2004); (2006). Electrophoresis, Review article, 231-243:27.
DOI: 10.1002/elps.200500697
2. Bortolotti F., Giorgia De Paoli, Tagliaro F., Recent advances in the application of CE to forensic sciences (2005-2007); (2008). Electrophoresis, Review article,
260-268:29(1). DOI: 10.1002/elps.200700708
3. Tagliaro F., Pascali J., Fanigliulo A., Bortolotti F., Recent advances in the application of CE to forensic sciences: an update over years 2007-2009; (2010).
Electrophoresis, Review article, 251-259:31. DOI: 10.1002/elps.200900482
4. Tycova A., Ledvina V., Kleparnik K., Recent advances in CE-MS coupling: Instrumentation, methodology, and applications; (2017). Electrophoresis,
Review article, 115-134:38(1). DOI: 10.1002/elps.201600366
5. Bortolotti F., Micciolo R., Canal L., Tagliaro F., First Objective Association Between Elevated Carbohydrate-Deficient Transferrin Concentrations and Alcohol-Related Traffic Accidents; (2015). Alcoholism: Clinical and Experiemental Research, 2108-2114:39. DOI: 10.1111/acer.12879
6. Veronesi A. et al., Carbohydrate-Deficient Transferrin Determination in a Clinical Setting: Consistency between Capillary Electrophoresis Assays and Utility of HPLC as a Confirmatory Test; (2016). Journal of Clinical Laboratory Analysis,
494-499:30. DOI: 10.1002/jcla.21885
7. Weykamp C., Wielders J., Helander A. et al., Harmonization of measurement results of the alcohol biomarker carbohydrate-deficient transferrin by use of the toolbox of technical procedures of the international consortium for harmonization
49
of clinical laboratory results; (2014). Clinical Chemistry, 60–67:7. DOI:
10.1373/clinchem.2014.221531
8. Crivellante F., Fracasso G., Valentini R., Manetto G., Riviera A.P., Tagliaro F., Improved method for carbohydrate-deficient transferrin determination in human serum by capillary zone electrophoresis; (2000). Journal of Chromatography B
Biomed Sci Appl., 81-93:739(1). PMID: 10744316
9. Weykamp C., Wielders J., Helander A. et al., Toward standardization of carbohydrate-deficient transferrin (CDT) measurements: III. Performance of native serum and serum spiked with disialo-transferrin proves that harmonization of CDT assays is possible; (2013). Clinical Chemistry Lab. Med.,
991–996:51(5). DOI: 10.1515/cclm-2012-0767
10. Porpiglia N.M., De palo E.F., Savchuk S.A., Appolonova S.A., Bortolotti F.,
Tagliaro F., A new sample treatment for asialo-Tf determination with capillary
electrophoresis: an added value to the analysis of CDT; (2018). Clinica Chimica
Acta, 256-262:483. DOI: 10.1016/j.cca.2018.05.019
11. Dallas M. Cowan et al., Best-practices approach to determination of blood alcohol concentration (BAC) at specific time points: Combination of ante-mortem alcohol pharmacokinetic modelling and post-ante-mortem alcohol generation and transport considerations; (2016). Regulatory Toxixology and Pharmacology, 24-36:78. DOI: 10.1016/j.yrtph.2016.03.020
12. Bortolotti F., Giorgia De Paoli, Tagliaro F., Carbohydrate-deficient transferrin (CDT) as a marker of alcohol abuse: A critical review of the literature 2001-2005;
(2006). Journal of Chromatography B, Review article, 96-109:841. DOI: 10.1016/j.jchromb.2006.05.005
13. Jeppsson J.O., Arndt T., Schellenberg F., Wielders J.P.M., Anton R.F., Whitfield
50
(CDT) measurements: I. Analyte definition and proposal of a candidate reference method; (2007). Clin. Chem. Lab. Med., 558-562:45(4). DOI:
10.1515/CCLM.2007.107
14. Bianchi V. et al., Use of carbohydrate-deficient transferrin (CDT) and a combination of GGT and CDT (GGT-CDT) to assess heavy alcohol consumption in traffic medicine; (2010). Alcohol Alcohol, 247-251:45(3). DOI:
10.1093/alcalc/agq006
15. Jastrzebska I., Zwolak A., Szcyrek M., Wawryniuk A., Skrzdlo-Radomariska B.,
Daniluk J., Biomarkers of alcohol misuse: recent advances and future
prospects; (2016). Prz Gastroenterol, Review article, 78-79:11(2). DOI:
10.5114/pg.2016.60252
16. Zecca L., Moussa B. H. Youdim, Riederer P., Connor J. R., Crichton R. R., Iron, brain ageing and neurodegenerative disorders; (2004). Nature, Review article,
863-873:5
17. Stilber H., Allgulander C., Borg S., Kjellin K.J., Abnormal Microheterogeneity of Transferrin in serum and Cerebrospinal Fluid in Alcoholism; (1978). Acta Medica
Scandinavica, 49-56:204(1-2). PMID: 685730
18. Prasad R., Stout R.L., Coffin D., Smith J., Analysis of carbohydrate deficient transferrin by capillary zone electrophoresis; (1997). Electrophoresis, 1814–
1818:18. DOI: 0173-0835/97/1010-1814
19. Musshoff F., Chromatographic method for the determination of markers of chronic and acute alcohol consumption; (2002). Journal of Chromatography B,
![Fig. 1. Human metabolic pathway of alcohol [11].](https://thumb-eu.123doks.com/thumbv2/123dokorg/8244458.129308/8.892.139.622.788.1083/fig-human-metabolic-pathway-alcohol.webp)
![Fig. 3. Schematic representation of the clinically relevant Tf isoforms [10]. Asn, asparagine residue; hexagon, N-acetylglucosamine; pentagon, mannose; diamond, galactose; and triangle, sialic-acid](https://thumb-eu.123doks.com/thumbv2/123dokorg/8244458.129308/10.892.142.618.489.829/schematic-representation-clinically-relevant-isoforms-asparagine-acetylglucosamine-galactose.webp)
![Fig. 5. Schematic representation of the CZE separation [34].](https://thumb-eu.123doks.com/thumbv2/123dokorg/8244458.129308/20.892.155.751.157.376/fig-schematic-representation-cze-separation.webp)
![Fig. 6. Schematic representation of the MEKC separation [34].](https://thumb-eu.123doks.com/thumbv2/123dokorg/8244458.129308/21.892.146.617.421.826/fig-schematic-representation-mekc-separation.webp)