I, the undersigned, certify that this thesis submitted for the degree of PhD in chemistry is the result of my own research, except where otherwise acknowledged, and that this thesis (or any part of the same) has not been submitted for a higher degree to any other university or institution.
This thesis is dedicated to my beloved family
My father, Benabdelkamel Houssine
My mother, Benouzzi Naima
My sibling
Youness, Othmane
Soufian, Mehdi and Safaa
and
In the name of Allah, most Gracious, most Merciful Only by His grace and
mercy this thesis can be completed.
I would like to thank
Professor Giovanni Sindona, for giving me the
opportunity to prepare my thesis in his, mass spectroscopy laboratory at the
University of Calabria . His expert knowledge has been a great support for
my work. I was always encouraged to invest maximum effort due to his
excellent ability to motivate resulting in important outcomes for further
investigations. Furthermore, I would like to thank him for the many
opportunities to participate in national and international congresses.
I wish to express my most sincere acknowledgment and deepest
appreciation to my supervisor, Professor Bartolo Gabriele and Dr Antonio
Tagarelli for supervising this work and their support during the whole
thesis. I am grateful for their great ideas, them constructive and exciting
discussions and for the chance to realise them into practice I would like to
thank my colleagues for creating a helpful and friendly atmosphere.
I am thankful to professor Anna Napoli, Dr Leonardo DiDonna , Dr Fabio
mazzotti (jimmi fountana),Dr Pierluigi Plastina, Monica Nardi, Rafaelle
salerno for their help during my whole thesis.
I am also beholden to all staffs of Industry chemistry laboratory, University
of Calabria, for their help and cooperation. Much appreciation also goes to
professor G. Salerno, My gratitude goes to all my colleagues PhD, for their
support and the good time we spent together during the work with the test
persons. A great thank goes to our Technician Lab Mr.Santoro ( zio
franco..portare per me un cammello) for his help and making my time
encouragement
My deepest thanks go to my family and my closest friends for their love,
encouragement and support during my PhD.
disease prevention provided an opportunity for individuals to affect their own health. This expanding body of information helped people to understand how the environment and their own behaviour affected their body. People now had powerful tools to help maintaining and protecting their health. The understanding of how our diet affects our well being has dramatically changed the lifestyles and attitudes of people, who began to make menu and purchasing decisions based on how foods would affect their heath. A shift toward healthier lifestyles and healthier diets began. Food processors and marketers had to refocus their efforts from promoting foods for pleasure to promoting foods that fit in to a healthy diet. Primarily, the focus was on reducing fat and cholesterol in the diet and supplementing vitamins and minerals. Research began to demonstrate the presence of various phytochemicals in wine and juice make it from fruits and vegetables( such as stilbenes, falvoniods, polyphenols…) and specially in olive oil as ( polyphenol in dialdehyed form: oleochanthal, hydroxyoleocanthal..) These compounds have come to be known as nutraceuticals. The list of nutraceuticals present in wine, fruit drink and olive oil that are believed to have positive biological properties has been expanding. Food processors and developers have become very interested in exploiting these nutraceuticals for the production of foods that are not only part of a healthy diet but also improve the consumer’s health in another specific way. These foods have become known as “functional foods” means quality marker.
The aim of this thesis has been to develop a analytical methods to determine the concentration of a group of these nutraceuticals in food , such as, quantitative determination of resveratrol in wine, pterostilbene in blueberry juice and dialdehyde form in olive oil using a sensitive high-performance liquid chromatographic separation method coupling with tandem-mass and isotope dilution to order to optimal the conditions for the analysis method, such as extraction procedure, matrices, column, quality controls, wavelength, mobile phases, run time, optimal separation (gradient, retention times), temperature, capillary voltage, cone voltages, vacuum and labelled internal standards, resulting in the best sensitivity and selectivity,
of detection (LLOD), quality controls, precision(RSD %), accuracy, recovery, stability and matrix effects.
In conclusion, the described high-performance liquid chromatographic separation method with tandem-mass spectrometry detection and isotope dilution showed a satisfactory overall analytical performance well suited for applications in food quality control.
Contents xi
Abbreviations xv
1 Introduction
31.1 Introduction to Mass Spectroscopy 3
1.1.1 The History of Mass Spectrometry 3
1.2 Mass Spectrometry 4
1.2.1 Ionisation 5
1.2.1.1 The Z-spray™ source 6
1.2.1.2 Electrospray Ionisation 6
1.2.1.3 Atmospheric Pressure Chemical Ionisation 8
1.2.2 Mass Analysers 9
1.2.2.1 Quadrupole Mass Analysers 9
1.2.2.2 Tandem Mass Spectroscopy (MS/MS) and High Resolution
11 1.2.2.3 Triple Quadrupole Mass Spectrometers 13
1.2.2.4 Collision-Induced Dissociation 13
1.2.2.5 Scanning Techniques in Tandem Mass Spectrometry 14
1.2.2.5.1 Product-Ion Scanning 14
1.2.2.5.2 Precursor Ion Scanning 15
1.2.2.5.3 Constant Neutral Loss (CNL) Scanning 15 1.2.2.5.4 Selected Reaction Monitoring (SRM). 15
1.2.3
Detection 151.3 Liquid Chromatography 16
1.3.1
Retention, Resolution and Efficiency 161.3.2
Band Broadening 171.3.3 Reversed phase HPLC 18
1.3.4 Normal Phase HPLC 19
1.4 Stable Isotope Dilution Assay 19
1.5 Conclusions 21
References 22
2
Assay of Resveratrol by Tandem Mass Spectrometry
and Isotope Dilution Method
27
2.1 Literature Review 29
2.1.1 Resveratrol 29
2.1.2 Health Benefits 30
2.1.3 Early Studies 32
2.1.4 Effect of UV Light on Resveratrol 34
2.2.3 Experimental 41
2.2.4 Conclusion 45
2.3 Assay of Resveratrol by Tandem Mass Spectrometry and Isotope
Dilution Method 46 2.3.1 Introduction 46 2.3.2 Experimental 47 2.3.2.1 Sample Preparation 48 2.3.3.1.a Wine 48 2.3.3.1.b Plasma 48 2.3.2.2 Mass Spectrometry 49
2.3.2.3 H/D isomerization in the dissociation of [M+H]+ of
D4-Resveratrol 49
2.3.3 Results and discussion 52
2.3.3.1 Selected Ion Monitoring (SIM) approach 55 2.3.3.2 Multiple reaction Monitoring (MRM) approach
2.3.4 Conclusion 58
References 60
62
3
The assay of Pterostilbene in spiked matrices by liquid
chromatography tandem mass spectrometry and
isotope dilution method
71 3.1 Introduction 73 3.2 Experimental 74 3.2.1 Synthesis of d6-pterostilbene 74 3.2.2 Sample Preparation 76 3.2.2.1 Juice 76 3.2.2.2 Plasma 76 3.2.3 Mass Spectrometry 76
3.3
Results and discussion 773.4 Conclusion 83
References 84
4
Screening of quality marker in olive oil by isotope
dilution and mass spectroscopy
874.1 Introduction 89
4.2 Phenolic compounds in VOO 90
4.3 The family of phenolic compounds : their antioxidant, health, and
sensory properties 92
4.5.1 Experimental 96 4.5.1.1 Syntheses of O-Methylhydroxylammonium chloride 96 4.5.1.2 Synthesis of standard derivative
98
4.5.1.3 Sample preparation 98
4.5.2 Results and discussion 99
4.5.2.1 Mass spectroscopy detection
99
4.5.2.2 Perspective 102
APCI Atmospheric Pressure Chemical Ionisation API Atmospheric Pressure Ionisation
APPI Atmospheric Pressure Photoionisation
CE Capillary Electrophoresis
CHD Coronary Heart Disease
CID Collision Induced Dissociation
COX Cyclooxygenase
D Deuterium
DC Direct Current
DDQ 2,3-Dichloro-5,6-dicyano-1,4-benzoquinone
DLI Direct Liquid Introduction
DMSO Dimethyl Sulfoxide
DNA Deoxyribonucleic Acid
ESI+ Electrospray Ionisation in positive ion mode
FAB Fast-atom Bombardment
FTICR Fourier Transform Ion Cyclotron Resonance HETP Height Equivalent to Theoretical Plate
HILIC Hydrophilic Interaction Liquid Chromatography
HLMs Human Liver Microsomes
HPLC High Performance Liquid Chromatography
k Capacity Factor
K
m Michaelis Constant
LC Liquid Chromatography
LOD Limit of Detection
LOQ Limit of Quantitation
M/Z Mass-to-charge ratio
MALDI Matrix Assisted Laser Desorption Ionisation
MB Moving Belt
MRM Multiple Reaction Monitoring
MS Mass Spectrometry
MS/MS Mass Spectrometry/ Mass Spectrometry
NMR Nuclear Magnetic Resonance
P Product
P450 Cytochrome P450
RSD% Reproducible
S Substrate
S/N Signal-to-noise ratio
SPE Solid Phase Extraction
SRM Selected Reaction Monitoring
THF Tetrahydrofuran
TLC Thin layer chromatography
TMS Tandem Mass Spectrometry
ToF Time-of-Flight
t
R
Retention time
U A term describing a fixed DC potential applied to a quadrupole mass filter assembly.
UV Ultra-violet
V A term describing the amplitude of a radio-frequency.
CHAPTER 1
1.1 Introduction to Mass Spectrometry 1.1.1 The History of Mass Spectrometry
The developments that have lead to days modern mass spectrometers began in 1897, when J. J. Thomson (1856 – 1940) built an apparatus that allowed a stream of ions present in a positive ray discharge to be separated according to their mass-to-charge ratio (m/z). Subsequent work allowed Thomson to provide the first experimental evidence that stable elements consist of a number of isotopes (Griffiths, 1997). F. W. Aston (1877 – 1945) made considerable improvements to the work started by Thomson at the Cavendish Laboratory in Cambridge, resulting in the development of a mass spectrograph. However, the first instrumentation to be termed a mass spectrometer was developed by A. J. Dempster (1886 – 1950) in Chicago, where a focused beam of ions of selected m/z was allowed to passed through a slit and measured electrically (Chapman, 1997).
Until this point the use of mass spectrometry had been limited to the measurement of masses or relative abundance of isotope ratios. Amongst the first to use mass spectrometry for the analysis of complex mixture was A. O. Nier (1911 – 1994) and it was this work that lead to the commercial production of mass spectrometers in the United States, circa 1940. At about the same time, the Metropolitan Vickers Electrical Company (Trafford Park, Manchester) became involved in the production of mass spectrometers and seeded the mass spectrometry industry in Manchester, the location of approximately 20 mass spectrometry companies today (Chapman, 1997).
1.2 Mass Spectrometry.
The basis of mass spectrometry is the production of ions that are subsequently separated or filtered according to the their mass-to-charge (m/z) ratio. A mass spectrum is produced when the abundance of these mass analyzed ions is plotted against their m/z ratio. Regardless of their complexity, all mass spectrometers comprise of five principle components: an inlet, an ion source, a mass analyzer, a detector and a data system. The ion source generates ions from the sample supplied by the inlet and these are then passed to the analyzer. The trajectory of ions is controlled by magnetic or electrical fields,
depending on the type of analyzer, until they reach the detector where their arrival is recorded by a data system (Grayson, 2002).
1.2.1 Ionization.
The need to study organic molecules of wide ranging chemical and physical properties by mass spectrometry has resulted in many different methods of ion formation. Where the inlet system supplies the sample in a liquid i.e. an HPLC system, a problem arises due to the high gas load that will be generated by a liquid buffer or solvent. As the mass analysis and detection regions of the mass spectrometer operate under reduced pressure, the pumping system needs to cope with the large gas volumes generated. Several different source designs and approaches have been used to reduce this problem most commonly by reducing the amount of solvent/liquid entering the mass spectrometer via miniaturisation of the separation system or by splitting the flow.
Table 1.1 Some of the major techniques used to interface liquid chromatography with mass spectrometry.
Arguably, the most commonly used type of ion source used in the drug development and clinical settings operates at near atmospheric pressure; atmospheric pressure ionization (API). The generation of ions in this ways alleviates the gas-burden on the pumping system of the mass spectrometer by allowing sampling of ions from a region of space at a controlled rate. Two ionization techniques are commonly
Employed today, electrospray ionization (ESI) and atmospheric pressure chemical ionization (APcI). A more recently developed technique known as atmospheric pressure photoionisation (APPI) may also become more common (Robb et al., 2000).
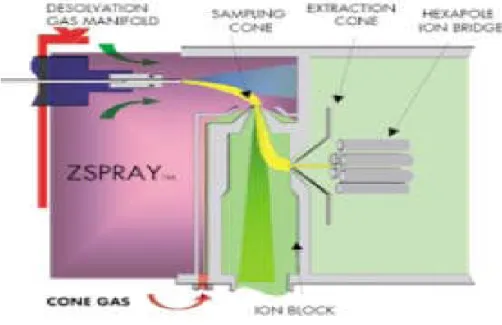
1.2.1.1 The Z-spray™ source.
Interface Reference
Moving Belt (MB) Alcock et al., 1982. Direct Liquid Introduction (DLI) Melera, 1980
Particle Beam (PB) Willoughby and Browner, 1984 Winkler et al., 1988 Fast-atom Bombardment (FAB) Caprioli et al., 1986 Matrix-assisted Laser Desorption Ionisation
(MALDI)
The Z- spray source was developed by Micromass (Wythenshawe, Manchester, UK) in 1996 and is a cleaner, more efficient way of generating and separating analyte ions from solvent, mobile phase modifiers and sample matrices (Figure 1.1).
Figure 1.1 schematic diagram of the Z-spray™ion source displaying the flattened Z-shaped path of ions entering the mass spectrometer courtesy of the Waters Corporation.
The droplets emerge from the inlet probe (ESI or APCI) in a cone-shaped spray. Low molecular weight components diffuse away from the central axis of the spray while higher molecular weight components continue along their origin trajectory, due to their higher momentum, until they reach the entrance to the mass spectrometer, the skimmer. In conventional electrospray sources, the ions produced travel along a linear trajectory from formation to entering the skimmer. Some of the neutral molecules contained in the spray strike the surface of the skimmer and are deposited there, where they accumulate and eventually block the entrance to the mass spectrometer (Herbert and Johnstone, 2003).
The Z-spray source draws the ion beam through a different trajectory that resembles a flattened Z-shape. A first skimmer orifice is positioned at right angles to the initial spray direction. As ions form in the background gas, they follow the gas stream toward the vacuum region of the mass spectrometer and pass through the skimmer orifice with some residual solvent vapor. A small voltage is applied to the skimmer cone that enhances the
extraction of ions from the initial spray. Further solvent removal occurs behind the skimmer and the ion beam is drawn through a further 90 degrees by a second skimmer, the extractor cone. Ions and background gas (typically nitrogen) are then drawn into the mass analyzer
1.1.2.2 Electrospray Ionization.
Electrospray ionization has gained unsurpassed acceptance as a liquid introduction technique for mass spectrometry. The first thorough descriptions of the technique were provided by Zeleny (Zeleny, 1914, 1915, 1917) in the early 20
th
century and the pioneering work using electrospray for the analysis of macro-ions using rudimentary MS was carried out by Dole et al. in the 1960’s (Dole et al., 1968; Mack et al., 1970). This early work provided the inspiration for Fenn (Yamishita et al., 1984; Whitehouse et al., 1985) and Alexandrov (Alexandrov et al., 1984) who independently used the technique to generate gas phase ions for mass spectrometric detection successfully for the first time, demonstrating the potential of the technique. Bruins et al. introduced pneumatically assisted electrospray (or Ionspray) in 1987 in which a nebulising gas aids the formation of the charged aerosol (Bruins et al., 1987).
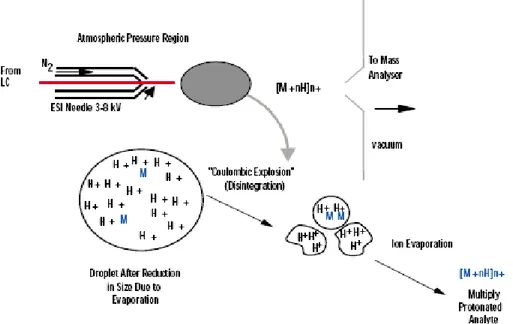
Figure 1.2 schematic diagram of the electrospray process; permission of the Waters Corporation. The electrospray process when applied to ESI-MS can be divided into three stages: Nebulisation of a sample solution into electrically charged droplets, the formation of ions
from these droplets and transportation of ions from the source region (at atmospheric pressure) into the vacuum region of the mass spectrometer (Fenn et al., 1990; Kebarle and Tang, 1993; Bruins, 1998).
A sample solution is fed through a fine, stainless steel capillary to which a high electric potential is applied (Figure 1.2). In the case of positive ionization, the high electric field pulls positive charge toward the liquid front where electrostatic repulsion overcomes the surface tension of the liquid. At this point, small charged droplets leave the surface of the liquid and travel toward a counter electrode through the surrounding gas. The counter electrode is usually the entrance to the vacuum region of the mass spectrometer although electrospray may equally, though not commonly, be carried out with the sprayer tip at ground potential and the counter electrode at high potential.
Electrospray as described above may be considered as ‘pure electrospray’ and it is the electric field alone that results in droplet formation. Increases in surface tension, electrolyte concentration and flow rate will therefore impede the ability of the charge to form the desired aerosol for mass spectrometry. Several modifications to the simple electrospray system are aimed at increasing the tolerance toward these adverse effects. The addition of co-axial sheath flow of organic solvent serves to reduce the surface tension associated with samples present in highly aqueous media. This approach was originally used for the combination of capillary electrophoresis (Olivares et al., 1987) with mass spectrometry but later work has proven the value of liquid sheath flows during sample infusion and LC/MS. More commonly, the nebulisation process is adversely affected by the rate at which solvent emerges from the capillary tip. The use of a co-axial, high velocity gas is commonplace in electrospray mass spectrometry and the formation of droplets is carried out by the action of the gas stream on the sample bearing solvent. The capillary now serves only to charge the resulting droplets and such electrospray systems can manage higher flow rates of aqueous samples much more effectively than pure electrospray. Such assemblies are termed pneumatically assisted electrospray (Bruins, 1998).
When droplets emerge from the capillary tip, electrostatic repulsion has become greater than the cohesive properties that bind the liquid together. The droplet size (~1μm) is then reduced by evaporation of solvent molecules as they pass through a heated bath gas. The reduction in droplet size is accompanied with an increase in the charge density of the droplet and shear forces resulting from interaction with the relatively dense gas act upon it. The combination of these two effects deform the droplet giving rise to protrusions at which localized high
electric fields form. At points where the combination of the high electric field and deformation are sufficient, the surface tension of the droplet is overcome and the droplet becomes unstable. Smaller droplets (~0.1μm) are thus produced in turn and the process repeated until the droplets reach a size of ~ 10nm. Smaller droplets (~0.1μm) may also be produced as a jet of microdroplets. The upper limit of charge on a single droplet is termed the Rayleigh stability limit.
The precise mechanism by which ions are formed from the smallest droplets is not yet fully understood. However, two theories exist and the distinction between the details of the ion formation process has little or no effect on the use of ESI. In the smallest droplets, charge reduction at the Rayleigh stability limit does not take place by further fragmentation. Iribarne and Thomson propose that instead ions are emitted from the surface of the droplet into the surrounding gas, ion evaporation (Iribarne and Thomson, 1976 and 1979). Alternatively, Schmelzeisen-Redecker et al. (1989) propose that ions surrounded by one or more salvation shells separate from the parent droplet. Solvent molecules are then lost as this nanodroplet passes toward the entrance to the mass spectrometer. The mild ionization, high ion transmission, excellent sensitivity at low flow-rates, the ability to analyze large biomolecules with mass spectrometers with low upper mass ranges have led to widespread use of this technique in biological mass spectrometry (Chapman, 1996).
1.1.2.3 Atmospheric Pressure Chemical Ionization.
The first reported use of chemical ionization at atmospheric pressure coupled to mass spectrometry was carried out by Shahin (1966; 1967) in the 1960s. Horning et al. were the first to apply this as an ionization technique for LC/MS in 1973 (Horning et al., 1973). Further improvements to the technology were made by the groups of Kambara (1979; 1982), Henion (1982) and Covey (1986) during the late 1970s and early 1980s including the introduction of a heated pneumatic nebuliser.
APCI offers a soft ionization technique for the analysis of low to moderate polarity compounds having some volatility however, the high temperatures involved can restrict its use for some thermally labile compounds. The production of ions occurs via gas phase molecular reactions at atmospheric pressure. The sample inlet capillary is surrounded by a coaxial nebuliser capillary. Nebulisation takes place in a heated section in which a flow of
auxiliary gas minimizes interactions of the analytes with the tube wall as they are flash vaporized. As the resulting vapor emerges from the end of the probe, a corona discharge needle initiates a series of gas phase reactions, seeding the region with protonated reagent species, ultimately leading to sample ionization.
Ionization may take place by several routes depending on the mode of ionization; either
positive or negative. In positive mode proton transfer, charge transfer or adduct
formation may take place whereas in negative mode, proton abstraction, electron capture or anion attachment is commonly observed.
1.2.2 Mass Analyzer.
A variety of mass analyzers are commercially available such as: quadrupole; quadrupole ion trap; time-of-flight (ToF); Fourier transform ion cyclotron resonance (FTICR) and magnetic/electric sector instruments that offer application dependent benefits. The four parameters of greatest importance for a mass analyzer are: the upper mass limit governing the highest m/z ratio that can be measured; the transmission efficiency; the linear dynamic range for quantization and the resolution. The latter is the ability to yield distinct signals for ions with small differences in m/z ratio and is particularly applicable to time-of-flight (ToF) mass analyzers. The quadrupole mass analyzer has become the most widely used in the food control quality fields due to its overall robustness.
1.2.2.1 Quadrupole Mass Analyzers.
Quadrupole mass analyzers possess considerable advantages over other mass analyzers where resolving power is of minor importance. Their relatively small size for comparable resolving power, linear mass scale, fast scanning, simplicity of construction and ease of cleaning make them suitable for the routine, high-throughput environment. It is an entirely electrical device making it highly compatible to undertake complex automated tasks. The relatively low voltages under which these systems operate also renders them more amenable to atmospheric pressure ionization techniques as the risk of ‘arcing’ is reduced.
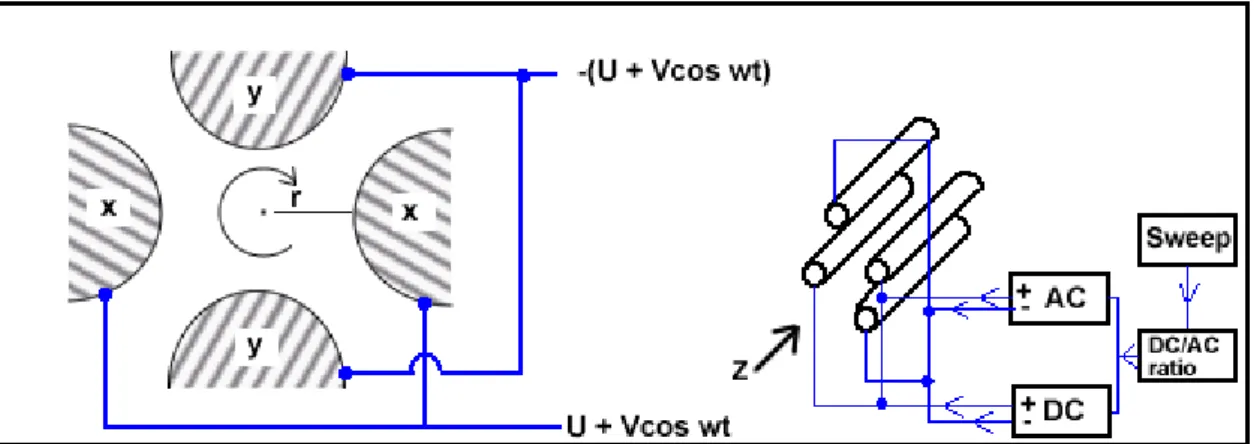
The quadrupole mass analyzer consists of four precisely machined, parallel rods or poles that are equidistant from one another. These have fixed DC voltages and alternating RF voltages applied to them. Depending on the field strengths applied, ions of a particular m/z
ratio can be selected and allowed to pass through the rod assembly whilst others are deflected away toward the poles or the vacuum system (Figure 1.3). The four poles are often cylindrical although theoretically these should be hyperbolic in cross-section; cylindrical poles offering adequate performance if correctly oriented. Two opposite poles have a potential + (U + V cos(ωt)) and the other two – (U + V cos (ωt)), where U is a fixed DC potential and V cos(ωt) represents a radio frequency (RF) field of amplitude (V) and frequency (ω/2π). Along the central (z) axis and the two planes shown in figure 1.3, the resultant electrical field is zero.
In the transverse direction in a quadrupole analyzer, an ion will oscillate between the poles in a complex fashion, depending on its mass, the voltages (U, V) and the angular frequency (ω) of the alternating RF potential. The theory behind the operation of the quadrupole is mathematically complex and will not be treated here. However, its operation is achieved by suitable choices of U, V and ω, it can be arranged that only ions of one mass will oscillate in a stable trajectory (resonant ions) about the central axis. In this case all other ions will oscillate with greater and greater amplitude until eventually they strike one of the poles and are lost; unstable trajectories. The operation of a quadrupole mass analyzer has resulted in it being regarded as more of a mass filter than an analyzer. Scanning of the quadrupole assembly is carried out by varying U and V such that U/V remains constant. This permits ions of increasing or decreasing m/z ratio to successively traverse the assembly.
Figure 1.3 schematic diagram of a quadrupole mass analyzer showing the hypothetical trajectories of ions which are resonant and non-resonant; the resonant ion being passed through the assembly (Neissen and van der Greef, 1992).
Figure 1.4 schematic diagram of a quadrupole assembly showing the planes through which the electric field strength is zero.
1.2.2.2. Tandem Mass Spectroscopy (MS/MS) and High Resolution
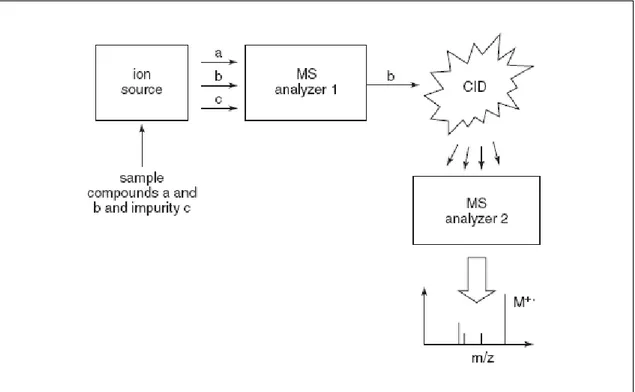
Desorption ionization techniques like FAB and MALDI and LC/MS ionization techniques like ESI and APCI facilitate the molecular weight determination of a wide range of polar and nonpolar, low- and high-molecular-weight compounds. However, the “soft” ionization character of these techniques means that most of the ion current is concentrated in molecular ions and few structurally significant fragment ions are formed. In order to enhance the amount of structural information in these mass spectra, collision-induced dissociation (CID) may be used to produce abundant fragment ions from molecular ion precursors formed and isolated during the first stage of mass spectrometry Then, a second mass spectrometry analysis may be used to characterize the resulting product ions. This process is called tandem mass spectrometry or MS/MS and is illustrated in Figure A.3A.4. Another advantage of the use of tandem mass spectrometry is the ability to isolate a particular ion such as the molecular ion of the analyte of interest during the first mass spectrometry stage. This precursor ion is essentially purified in the gas phase and is free of impurities such as solvent ions, matrix ions, or other analytes. Finally, the selected ion is fragmented using CID and analyzed using a second mass spectrometry stage. In this manner, the resulting tandem mass spectrum contains exclusively analyte ions without impurities that might interfere with the interpretation of the fragmentation patterns. In summary, CID may be used with LC/MS/MS or desorption ionization and MS/MS to obtain structural information such as amino acid
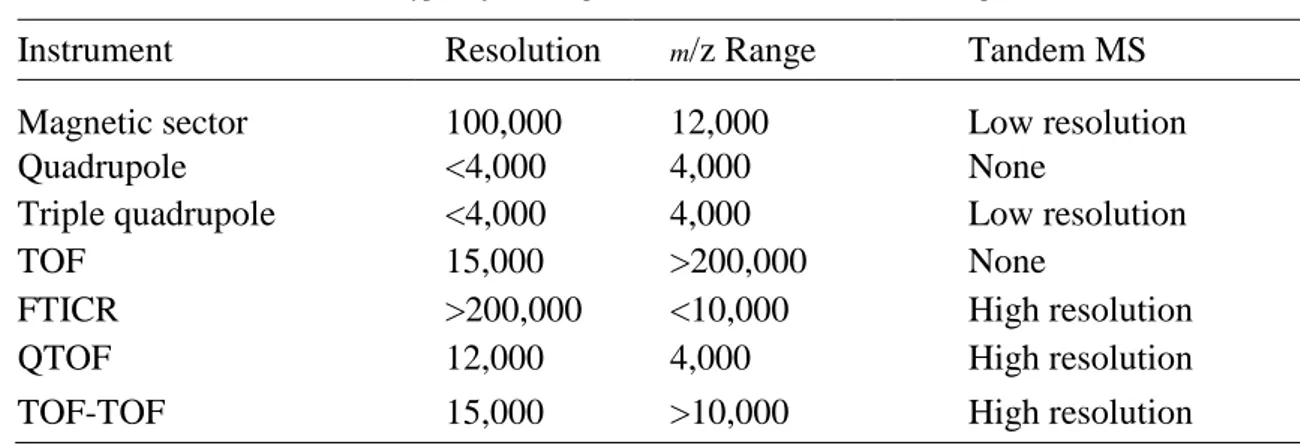
isomers such as -carotene and lycopene. The most common types of MS/MS instruments available to researchers in food chemistry include triple quadrupole mass spectrometers and ion traps. Less common but commercially produced tandem mass spectrometers include magnetic sector instruments, Fourier transform ion cyclotron resonance (FTICR) mass spectrometers, and quadrupole time-offlight (QTOF) hybrid instruments (Table 1.2). Beginning in 2001, TOF-TOF tandem mass spectrometers became available from instrument manufacturers. These instruments have the potential to deliver high-resolution tandem mass spectra with high speed and should be compatible with the chip-based chromatography systems now under development. In addition to MS/MS with CID to obtain structural information, it is also useful to use high-resolution exact mass measurements to confirm the elemental compositions of ions. Essentially, exact mass measurements permit the unambiguous composition analysis of lowmolecular- weight compounds (mol. wt. <500) through precise and accurate m/z measurements. The types of mass spectrometers capable of exact mass measurements include magnetic sector mass spectrometers, QTOF hybrid mass spectrometers, reflectron TOF instruments, and FTICR mass spectrometers (Table 1.2 ). Some of these instruments permit the simultaneous use of tandem mass spectrometry and exact mass measurement of fragment ions. These include FTICR instruments, QTOF, and the TOF-TOF.
Table 1.2 Types of Mass Spectrometers and Tandem Mass Spectrometers
Instrument Resolution m/z Range Tandem MS
Magnetic sector 100,000 12,000 Low resolution
Quadrupole <4,000 4,000 None
Triple quadrupole <4,000 4,000 Low resolution
TOF 15,000 >200,000 None
FTICR >200,000 <10,000 High resolution
QTOF 12,000 4,000 High resolution
TOF-TOF 15,000 >10,000 High resolution
The triple quadrupole mass spectrometer, as its name suggests, is comprised of three quadrupoles; MS1, MS2 and MS3. The second quadrupole is not used as a mass separation device but as an RF-only collision cell where CID is performed. More recent developments in hardware have seen MS2 replaced by hexapole or ion-tunnel devices (Giles et al., 2004). Such devices offer much deeper potential energy wells to ions providing greater control and transmission efficiency.
1.2.2.4 Collision-Induced Dissociation (CID).
Upon entering the collision cell, mass analyzed ions undergo non-elastic collisions with a neutral gas typically argon (Herbert and Johnstone, 2003). The kinetic energy lost in these collisions is converted into internal energy (rotational, vibrational and electronic) within the ions of interest, the precursor ions. The amount of internal energy increases to such a point that it is great enough to break bonds within the molecule and this is termed fragmentation. The extent to which this occurs can be controlled by the nature of the gas within the cell, its pressure and the velocity with which the ion is passed through the cell. The latter is effected by varying the potential across the collision cell (figure 1.5). The function of the ion guide is to contain the parent and resulting fragment ions and pass them to the second stage of mass spectrometry. The collisions with neutral gas molecules gives rise to a scattering effect that should be minimized to maximize transmission efficiency, the multiple analyzer is an ideal device to efficiently focus these fragments and achieve high sensitivity. However, it is a scanning device which is inherently less efficient than some other mass analyzers, such as, time-of-flight and the storage device the quadrupole ion trap.
Figure 1.5. Scheme illustrating the selectivity of MS/MS and the process by collision induced dissociation
(CID) facilitates fragmentation of reselected ions
1.2.2.5 Scanning Techniques in Tandem Mass Spectrometry 1.2.2.5.1 Product-Ion Scanning
This scanning mode is known as daughter-ion scanning. The first stage of mass spectrometry (MS1) is used to isolate an ion of interest and this ion is termed the precursor ion. This is commonly, though not always, the molecular ion of a species formed in the ion source. This ion is then subject to CID in the collision cell and the second stage of mass spectrometry is scanned to produce a spectrum of all the ions formed i.e. the product (fragment) ions. Such information can then be interrogated and the significance of the observed ions with respect to the structure of the precursor ion assessed. These experiments are also used to select a suitable product ion to utilize in a selected reaction monitoring (SRM) experiment.
1.2.2.5.2 Precursor Ion Scanning.
In this type of scan, the second stage of mass spectrometry (MS3) is set to pass only a particular product. The first stage of mass spectrometry (MS1) scans across the mass range
of interest sequentially passing ions to the collision cell to undergo CID. A signal is only passed to the detector when a precursor ion that forms the required product ion is passed to the collision cell. This type of scan is of particular benefit when a number of structurally related ions are studied and is especially widely used in neonatal screening applications (Rashed et al., 1995).
1.2.2.5.3 Constant Neutral Loss (CNL) Scanning.
The constant neutral loss scan is carried out be scanning both stages of mass spectrometry with a constant mass difference between them. In this way, a signal is only passed to the detector if a precursor ion enters the collision cell forming a product ion by loss of a neutral species that matches the mass offset of the two stages of MS. Again, this scanning mode is utilized to great extent in neonatal screening (Chace et al., 1993).
1.2.2.5.4 Selected Reaction Monitoring (SRM).
This scan mode introduces a high degree of selectivity into analyses performed by LC/MS/MS and is very sensitive. It may be regarded as product ion scanning in which only a single product ion is monitored. Each stage of MS is set to pass only ions of one m/z; MS1 the precursor ion and MS3 the product ion of interest. A response will only be recorded by the data system when a precursor ion of the selected m/z enters the collision cell forming a product ion of the selected m/z. This scan mode is widely used in the quantitative bioanalysis industry where trace levels of analytes are measured in complex matrices such as plasma, blood and urine.
1 1.2.3 Detection.
Tandem mass spectrometers utilize point ion detectors as opposed to array detectors such as micro-channel plates common in ToF-MS. The function of the detector is to convert the ion beam into an electrical signal to be recorded by the data system. The ion beam impinges upon a conversion dynode that produces a stream of electrons. The work in this thesis was carried out using Micro mass (Wythenshawe, Manchester, UK) tandem MS systems that employ photomultiplier detectors. First the ions are allowed to strike a conversion dynode, where ions resale secondary electrons from a metal surface. This stream of electrons is directed towards a phosphor screen and, upon contact with this, the electrons cause the emission of photons that are subsequently monitored in the sealed photomultiplier tube and
converted to an electrical signal. As this detector is sealed it essentially has an unlimited life and can withstand poor vacuum conditions.
1.3 Liquid Chromatography.
Despite the high selectivity of tandem mass spectrometry, some type of chromatography is usually necessary post sample preparation. Although the cumbersome and time-consuming baseline separation of analytes required for UV detection and other less specific techniques is not usually necessary when using tandem mass spectrometry, there are situations in which chromatography must be used to prevent interferences. This is especially true in the case of conjugated metabolites of drugs such as glucuronides (Vogheser et al., 2001a) and sulfates. Such conjugates can often degrade in the ion source to form the parent drug. If the parent drug and the metabolite are not separated chromatographically, falsely elevated signals corresponding to the parent drug will result.
Chromatography is also used to improve the yield of analyte ions from a sample by reducing the effects of ion suppression (Annesley, 2003; King et al., 2000; Dams et al., 2003). By allowing the compounds of interest to elute at a different time to the bulk of the sample matrix, competition for charge within the ion source is reduced. Co-elution of analytes once the adverse effects of ion suppression have been minimized is then preferable as several analytes may be monitored simultaneously in much shorter analysis times.
The Principles of Chromatography. Although the exact mechanisms of retention for the various types of chromatography differ, all are based upon the establishment of equilibrium between the stationary and mobile phase. Separations therefore occur due to differing distribution coefficients of individual analytes.
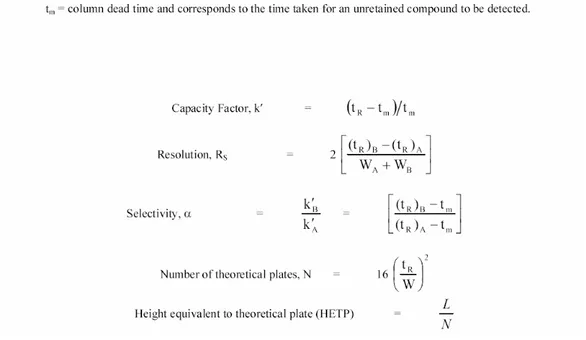
1.3.1 Retention, Resolution and Efficiency.
A number of fundamental equations have been derived to describe chromatographic parameters (Figure 1.6). Chromatographic retention is described in terms of t
R, retention
time, and defines the time between injection of the analyte and the corresponding peak maximum. A preferred method for assessment of retention is the calculation of a capacity factor, k'. The capacity factor defines retention characteristics that are independent of the mobile phase velocity and column length. Resolution, R
S, is defined as the degree of
separation between two analytes and may be calculated using t
Rand the base width (W) of
when R
S≥ 1.5. The selectivity of a column, α, measures the ability of a given column to
separate two analytes and is calculated as ratio between the capacity factors for the analytes in question. Column efficiency is measured in terms of the number of theoretical plates (N) and may be calculated as shown in figure 1.6 using information from a chromatogram. Using this value, the height equivalent to a theoretical plate (HETP) may be calculated since it refers to the number of theoretical plates per unit length of the column (L). Column efficiency improves with the number of theoretical plates and decreasing plate height as each theoretical plate is deemed an equilibrium step.
1.3.2 Band Broadening.
Band broadening is a term that essentially refers to increasing chromatographic peak width thus increased HETP (or decreased efficiency). The largest contributions to this are found within the column itself however, careful reduction of dead volumes within ancillary tubing and connectors will reduce band
Figure 1.6 Illustration of HPLC Parameters commonly used to determine capacity factors, selectivity, resolution and height equivalent to theoretical plate.
broadening. The van Deemter equation describes contributions to this effect in relation to the velocity of the mobile phase, μ,HETP = A + B/μ + (C
s+ Cm)μ where A represents
eddy diffusion, B represents molecular diffusion and C terms describe mass transfer effects in the mobile (C
m), and stationary (Cs) phases, respectively.
1.3.2 Reversed phase HPLC.
Reversed phase liquid chromatography accounts for ~90% of all HPLC separations performed in the drug development and clinical applications (Lee and Kerns, 1999). Hydrophobic analytes are retained more strongly than hydrophilic analytes and are eluted by changing the composition of the mobile phase, typically by increasing the percentage of organic solvent. The stationary phase typically consists of modified silica particles in which the a proportion of the surface silanol groups are reacted with alkyl- or aryl- chlorosilanes, arguably the most common of which is the octadecylsilane (ODS or C
18). A procedure
termed endcapping is commonly carried out post-modification as unreacted silanol groups may remain (due to steric hinderance) that can result in severe peak tailing for basic analytes (Waters, 2003). Mobile phases typically consist of water and one or more organic solvents
such as methanol, acetonitrile, ethanol or tetrahydrofuran. Commonly, and especially in the LC/MS applications, the mobile phase may contain additives to improve the performance of the liquid chromatography and ionization process. Buffered mobile phases are used where ionization of functional groups (acidic or basic) may result in asymmetric chromatographic peak shape. Adjusting the pH of the mobile phase within two or three units of the analytes pK
awill reduce this effect in most instances. Weak organic acids such as formic or acetic are
frequently used to lower pH whereas ammonium hydroxide is used to buffer solutions for basic analytes. Buffered solutions such as ammonium format or ammonium acetate also interact with unreacted silanol groups and minimize potential ion exchange interactions that may contribute to peak asymmetry; peak tailing for basic analytes.
1.3.3 Normal Phase HPLC.
Normal phase chromatography is the classical form of chromatography where polarities of the stationary and mobile phases are reversed. The functional groups of polar analytes interact with the polar groups on the surface of the stationary phase and a non-polar mobile phase. Unbonded alumina and silica were originally used however, these have been superseded by bonded stationary phases that equilibrate much faster and have a greater resistance to very small amounts of water that have a detrimental affect on this technique. An extension of this technique is hydrophilic-interaction chromatography (HILIC) in which a polar stationary phase is used with an aqueous-organic mobile phase. Contrary to reversed phase chromatography, retention increases with the concentration of organic solvent in the mobile phase and analytes are eluted using the aqueous solvent (Grumbach et al., 2003).
1.4 Stable Isotope Dilution Assay-SIDA
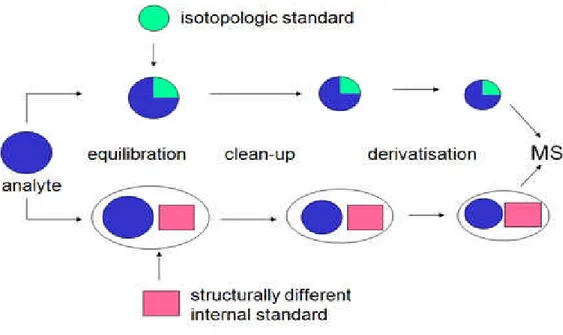
In order to overcome matrix effects and related quantification problems external matrix calibration for each commodity tested was recommended so far, which is extremely time-consuming and proved to be very unpractical under routine conditions, where one is confronted with a variety of matrices every day. As an alternative approach the use of [stable] isotope labelled internal standards has been introduced recently( Sindona et al, 2009,2008,2006) ). These substances are not present in real world samples but have identical properties to the analytes. Internal standards are substances which are highly similar to the analytical target substances, i.e. their molecular structure should be as close as possible to the target analyte, while the molecular weight has to be different (see
figure 1.7 ). Within the analytical process internal standards are added to both, the calibration solutions and analytical samples, and by comparing the peak area ratio of internal standard and analyte, the concentration of the analyte can be determined.
Figure 1.7
Ideal internal standards are isotope-marked molecules of a respective target analyte, which are usually prepared via organic synthesis by exchanging some of the hydrogen atoms by deuterium, or by exchanging carbon [12C] atoms by [13C]. Physico-chemical properties of such substances and especially their ionization potential is very similar to or nearly the same as of their naturally occurring target analytes, but because of their higher molecular weight (due to the incorporated isotopes) distinction between internal standard and target analyte is possible. Variations during sample preparation and clean-up as well as during ionization are compensated so that methods with especially high analytical accuracy and precision can be developed. Optimally these isotope labeled analogues must have a large enough mass difference to nullify the effect of natural abundance heavy isotopes in the analyte. This mass difference will depend generally on the molecular weight of the analyte itself, in case of molecules with a molecular weight range of 200 to 500, a minimum of three extra mass units might be required. Isotope labeled standards supplied by Biopure is fully labeled thus providing an optimum mass unit difference between labeled standard and target analyte. For example,
the [13C15]-DON standard, which is available as liquid calibrant (25mgl-1) was thoroughly characterized by Häubl et al. with regard to purity and isotope distribution and substitution, the latter being close to 99%. Fortification experiments with maize proved the excellent suitability of [13C15]-DON as internal standard indicating a correlation coefficient (R2) of 0.9977 and a recovery rate of 101% +/- 2.4%. The same analyses without considering the internal standard resulted in R2=0.9974 and a recovery rate of 76% +/- 1.9%, underlining the successful compensation for losses due to sample preparation and ion suppression effects by isotope labeled internal standards.
1.5 Conclusions
Direct coupling between a liquid phase separation technique such as liquid chromatography and mass spectrometry has been recognized as a powerful tool for analysis of highly complex mixtures. The main advantages include low detection limits, the ability to generate structural information, the requirement of minimal sample treatment and the possibility to cover a wide range of analytes differing in their polarities. Depending on the applied interface technique a wide range of organic compounds can be detected and flows up to 1.5ml/min can be handled. Despite their high sensitivity and selectivity LC/MS/MS instruments are limited to some extent due to matrix-induced differences in ionization efficiencies and signal intensities between calibrants and analytes; ion suppression/enhancement due to matrix compounds entering the mass spectrometer together with the analytes limit also ruggedness and accuracy and pose a potential source of systematic errors. Stable isotopes labeled internal standards have been proven to overcome these problems as well as to compensate also for fluctuations in sample preparation, extraction and clean-up. Numerous LC/MS/MS methods for the determination of nutraceuticals in food have been developed and published in recent years(sindona e al 2006,2007,2008,2009) however so far only a few were based on stable isotope labeled analytes,. For this reason we are interesting to development a methods being suitable for the quantitative determination of many types of analyte/matrix combinations poses a great challenge in food control quality in the future.
References
Alcock NJ, Eckers C, Games DE, Games MPL, Lant MS, McDowall MA, Rossiter M, Smith RW, Westwood SA, Wong H (1982) High-Performance Liquid Chromatography – Mass Spectrometry with Transport Interfaces Journal of Chromatography A 251: 165 – 175.
Alexandrov ML, Gall LN, Krasnov MV, Nikolaev VI, Pavelenko VI, Shkurov VA (1984) (Title in Russian) Zh. Anal. Khim. 40: 1570 – 1575.
Annesley T (2003) Ion suppression in Mass Spectrometry. Clinical Chemistry 49: 1041 – 1044.
Bruins AP (1998) Mechanistic Aspects of Electrospray Ionisation Journal of
Chromatography A 794: 345 – 357.
Bruins AP, Covey TR, Henion JD (1987) An Ion Spray Interface for Combined Liquid Chromatography/Atmospheric Pressure Ionization Mass Spectrometry. Analytical
Chemistry 59: 2642 – 2646.
Caprioli RM, Fan T, Cotrell JS (1986) A Continuous Flow Sample Probe for Fast Atom Bombardment Mass Spectrometry. Analytical Chemistry 58: 2949 – 2954. Chapter 1 Chace DH, Millington DS, Terada N, Kahler SG, Roe CR, Hofman LF (1993) Rapid Diagnosis of Phenylketonuria by Quantitative Analysis for Phenylalanine and Tyrosine in Neonatal Blood Spots by Tandem Mass Spectrometry. Clinical Chemistry 39: 66 – 71.
Chapman JR, Errock GA, Race JA (1997) Science and Technology in Manchester: The Nurture of Mass Spectrometry. Rapid Communications in Mass Spectrometry 11: 1575 – 1586.
Chapman JR (1996) Chapter 2: Mass Spectrometry: Ionization Methods and Instrument ation in Protein and Peptide Analysis by Mass Spectrometry, Humana Press, Totowa, NJ, USA.
Covey TR, Lee ED, Bruins AP, Henion JD (1986) Liquid Chromatography / Mass Spectrometry. Analytical Chemistry 58: 1451A – 1459A
Dams R, Huestis MA, Lambert WE, Murphy CM (2003) Matrix effects in Bio-Analysis of Illicit Drugs with LC-MS/MS: Infleunce of Ionisation Type, Sample Preparation and Biofluid Journal of the American Society for Mass Spectrometry 14: 1290 - 1294
Dole M, Mack LL, Hines RL, Mobley RC, Ferguson LC, and Alice MB (1968) Molecular Beams of Macroions. Journal of Chemical Physics 49: 2240 - 2249
Fenn JB, Mann M, Meng CK, Wong SF (1990) Electrospray Ionization – Principles and Practice. Mass Spectrometry Reviews 9: 37 – 70.
Frahnert C, Rao ML, Grasmader K (2003) Analysis of Eighteen Antidepressant, Four Atypical Antipsychotics and Active Metabolites in Serum by Liquid Chromatography: A Simple Tool for Therapeutic Drug Monitoring. Journal of Chromatography B 794: 35 – 47.
Ghoshal AK, Soldin SJ (2003) Improved Method for Concurrent Quantification of Anti-Retrovirals by Liquid Chromatography – Mass Spectrometry. Therapeutic Drug
Monitoring 25: 541 – 543.
Giles K, Pringle SD, Worthington KR, Little D, Wildgoose JL, Bateman RH (2004) Applications of a Travelling Wave-Based Radio Frequency-Only Stacked Ring Ion Guide Rapid Communicatiosn in Mass Spectrometry 18: 2401 – 2414.
Grayson MA (2002) Measuring Mass: From Positive Rays to Proteins, published by the
Chemical Heritage Association, Philadelphia, USA.
Griffiths IW (1997) J. J.Thomson – The Centenary of His Discovery of the Electron and his Invention of Mass Spectrometry. Rapid Communications in Mass Spectrometry 11: 2 – 16.
Grumbach ES, Diehl DM, Alden B, Iraneta P, Neue U, Mazzeo J (2003) Hydrophilic Interaction Chromatography (HILIC) for Small Molecules: Retaining Very Polar Analytes. Poster presented at HPLC, Nice, France 15th-19thJune.
Henion JD, Thompson BA, Dawson PH (1982) Determination of Sulfa Drugs in Biological Fluids by Liquid Chromatography/Mass Spectrometry/Mass Spectrometry.
Analytical Chemistry 54: 451 – 455.
Herbert CG and Johnstone RAW (2003) Mass Spectrometry Basics, published by CRC
Press, Boca Raton, Florida, USA.
Horning EC, Horning MG, Carroll DI., Dzidic I, Stillwell RN (1973) New Picogram Detection System Based on a Mass Spectrometer with an External Ionization Source at Atmospheric Pressure. Analytical Chemistry 45: 936 – 943
Iribarne JV, Thompson BA (1976) On the Evaporation of Small Ions from Charged Droplets Journal of Chemical Physics 64: 2287 – 2294.
Kambara H (1982) Sample Introduction System for Atmospheric Pressure Ionization Mass Spectrometry of Non-Volatile Compounds. Analytical Chemistry 54: 143 – 146. Kambara H, Mitsui Y, Kanomata I (1979) Identification of Clusters Produced in an Atmospheric Pressure Ionization Process by a Collisional Dissociation Method.
Analytical Chemistry 51: 1447 - 1452
Kebarle P, Tang L (1993) From Ions in Solution to Ions in the Gas Phase. Analytical
King R, Bonfiglio R, Fernandez-Metzler C, Miller-Stein C, Olah T (2000) Mechanistic Investigation of Ionization Suppression in Electrospray Ionisation. Journal of the
American Society for Mass Spectrometry 11: 942 – 950.
Lee MS, Kerns EH (1999) LC/MS Applications in Drug Development. Mass
Spectrometry Reviews 18: 187 – 279.
Mack LL, Kralie P, Rehude A, Dole M (1970) Molecular Beams of Macroions II.
Journal of Chemical Physics 52: 4977 – 4986.
Moyer SC, Cotter RJ (2002) Atmospheric Pressure MALDI. Analytical Chemistry 74: 469A – 476A.
Neissen WMA, van der Greef (1992) Liquid Chromatography – Mass Spectrometry
published by Marcel and Dekker, New York, USA.
Olivares JA, Nguyen NT, Yonken CR, Smith RD (1987) On-line Mass Spectrometric Detection for Capillary Zone Electrophoresis Analytical Chemistry 59: 1230 – 1232. Rashed MS, Ozand PT, Bucknall MP, Little D (1995) Diagnosis of Inborn Errors of Metabolism from Blood Spots by Acylcarnitines and Amino Acids Profiling using Automated Electrospray Tandem Mass Spectrometry. Peadiatric Research 38: 324 – 331.
Schmelzeisen-Redecker G, Butfering L, Rollgen FW (1989) Desolvation of Ions and Molecules in Thermospray Mass Spectrometry. International Journal of Mass
Spectrometry and Ion Processes 90: 139 – 150.
Shahin MM (1966) Mass Spectrometric Studies of Corona Discharges in Air at Atmospheic Pressure. Journal of Chemical Physics 45: 2600 – 2605.
Shahin MM (1967) The Use of Corona Discharges for the Study of Ion-Molecule Reactions. Journal of Chemical Physics 47: 4392 – 4398.
Thomson BA, Iribarne JV (1979) Field Induced Ion Evaporation from Liquid Surfaces at Atmospheric Pressure Journal of Chemical Physics 71: 4451 – 4463.
Vogheser M, Zachoval R, Spohrer U, Jacob K (2001a) Potential Lack of Specificity Using Electrospray – Tandem Mass Spectrometry for the Analysis of Mycophenolic Acid in Serum. Therapeutic Drug Monitoring 23: 722 – 724.
Waters Chromatography Columns and Supplies Catalogue (2003-2004), Waters
Corporation, Milford, MA, USA.
Whitehouse CM, Dryer RN, Yamishita M, Fenn JB (1985) An Electrospray Interface for Liquid Chromatographs and Mass Spectrometers. Analytical Chemistry 57: 675 – 679.
Willoughby RC, Browner RF (1984) Monodisperse Aerosol Generation Interface for Combining Liquid Chromatography with Mass Spectroscopy. Analytical Chemistry 56: 2626 – 2631.
Winkler PC, Perkins DD, Williams WK, Browner RF (1988) Performance of an Improved Monodisperse Aerosol Generation Interface for Liquid Chromatography/Mass Spectrometry. Analytical Chemistry 60: 489 – 493.
Yamishita M and Fenn JB (1984) Electrospray Ion Source: Another Variation of the Free-Jet Theme. Journal of Physical Chemistry 88: 4451 - 4459.
Zeleny J (1914).The Electrical Discharge from Liquid Points, and a Hydrostatic Method of Measuring the Electric Intensity at Their Surfaces. Physical Reviews 3: 69 – 72. Zeleny J (1915) On the Conditions of Instability of Electrified Drops, with Applications to the Electrical Discharge from Liquid Points. Proceedings of the Cambridge
Philosophical Society. 18: 71 – 84.
CHAPTER 2
2.1 Literature Review
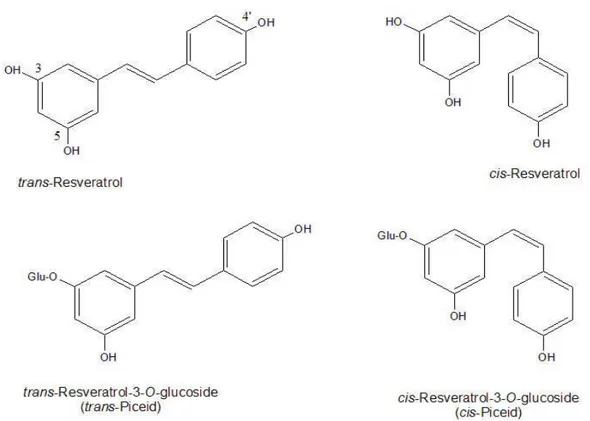
2.1.2 Resveratrol. Resveratrol (3,5,4' -trihydroxystilbene) is a polyphenolic compound classified as a stilbene. It is synthesized from p-coumaroyl CoA and malonyl CoA by an enzyme called stilbene synthase. Its biosynthesis is stimulated by stress, including injury, infection or UV irradiation. It has been demonstrated to provide resistance in grapes to fungal diseases (Jeandet et al., 1995). It is synthesized almost exclusively in the skins of V. vinifera grapes but is also synthesized in the seeds of muscadine grapes (Jeandet et al., 1995; Ector et al., 1996). It exists in both trans and cis isomeric forms. The cis form is rarely found in Figure 1.1 Chemical structures. grapes in significant concentration, but it is found in substantial amounts in wines (Jeandet et al., 1995; Mattivi et al., 1995; Lamuela-Raventos et al., 1995). The reaction producing resveratrol in the plant is very similar to another reaction using the same products catalyzed by a similar enzyme, chalcone synthase (Goodwin et al., 2000). Chalcone synthase combines p-coumaroyl CoA and malonyl CoA to form chalcones including naringenin and eriodictyol which go on to form flavonoids which are responsible for the anthocyanins. Anthocyanins are a class of compounds that include the pigments in grapes (Croteau et al., 2000). Developmental studies have demonstrated that resveratrol concentration decreases with veraison, (pigment formation) in the grape (Jeandet et al., 1991; Strigler et al., 2005). It is suggested that the formation of chalcones to produce anthocyanins may come at the expense of resveratrol production by stilbene synthase. Resveratrol also exists in a glucoside form called piceid (5,4' dihydroxy-3- glucopyranosylstilbene). The two compounds are from a class of secondary metabolites called stilbenes. Studies have shown that piceid can exist in large amounts, sometimes exceeding resveratrol, in both wine and grapes (Mattivi et al., 1995; Romero-Perez et al, 1996a, 1996b; Romero-Perez et al., 2001). During fermentation there can be complex changes in the concentrations of the four monomers of resveratrol and piceid (Mattivi et al., 1995; Lamuela-Raventos et al., 1997; Romero-Perez et al., 1999). Many early studies only quantified trans resveratrol and sometimes the cis isomer. With the quantification of all four monomers, a more accurate representation of the beneficial properties of a wine or juice can be obtained.
Figure 2.1 Chemical structures.
2.1.3 Health Benefits. During the 1980's, researchers looking into World Health Organization data from the United States and Europe noted an anomaly with regard to diet and mortality from heart disease (NRC, 1989). Data from the United States showed that generally with increased consumption of fatty foods there was a similar increase in the rate of coronary heart disease (CHD). Data from areas in France did not follow this pattern. In some areas where diets were traditionally high in fat, there were not similar elevations in CHD. This phenomenon has become known as “the French Paradox”. In 1992, Renaud and Lorgeril demonstrated that wine consumption was statistically the only factor correlated to the reduction in CHD. Subsequent data suggested that somehow wine consumption resulted in a larger reduction in CHD than did the consumption of beer and spirits. It was proposed that, although alcohol was a factor, there were other components in wine that were providing the protection. Prior to these investigations, a number of studies established that a phytoalexin called resveratrol (3,5,4' trihydroxystilbene) was present in grape skins ( Langcake and Pryce, 1976; Pool et al., 1981; Jeandet et al., 1991). Initially, these studies focused on resveratrol’s presence as a marker for disease resistance. Some demonstrated that resveratrol metabolism can be stimulated by plant pathogen infection and by exposure to ultraviolet light (Langcake
and Price, 1976). Similarly, a group of scientists investigating a traditional Japanese folk remedy demonstrated that resveratrol was the primary active ingredient in a medicine composed of the dried powdered root of the Japanese knotweed (Polygonum cuspidatum Sieb. et Zucc.) (Arichi et al., 1982). For more than two decades, scientists have been reporting the various ways that resveratrol can positively effect our health (Arichi et al., 1982; Kimura et al., 1985; Kinsella et al., 1993; Jang et al., 1997; Lu and Serrero, 1999; De Santi, et al., 2000a, 2000b; Brakenhielm et al., 2001; El-Mowafy, 2002). By the mid to late nineties, work was underway around the world to both quantify resveratrol in wine and grapes and to verify its mode of action as a protective agent for human health. In 1985, Kimura et al. reported that resveratrol inhibited platelet aggregation in rats Jang et al., reported in 1997 that resveratrol acted as an antioxidant and as an anti-mutagen. Resveratrol reduced tumour formation in rats and reduced initiation and promotion of human cancer cells. In a 1999 publication, Cheong et al. reported that resveratrol had anti-allergenic properties. Resveratrol inhibited the release of hexosaminidase from mast cells. hexosaminidase is released along with histamine in response to allergic reactions. Resveratrol has also been reported to inhibit the growth of human breast cancer cells by acting as a estrogens receptor antagonist (Lu and Serrero, 1999). Tedesco et al. (2000) studied the effect of red wine extract and resveratrol singularly on red blood cells. They reported that the red wine extract acted as a strong antioxidant and that resveratrol by itself did not have as strong an effect. They suggested that the effects of red wine may be associated with the combined effect of the components of the wine and not with the individual compounds. Huang et al. (1999), proposed that resveratrol reduced tumor growth by inducing apoptosis (programmed cell death). Although there is a substantial amount of information about the effect of resveratrol in vitro, it is unclear how and how much of the compound is absorbed in the digestive tract. Kuhnle et al. (2000) studied the absorption of resveratrol in rat intestines. They reported that only small amounts were absorbed, but larger amounts of a resveratrol glucuronide was absorbed through the intestine. The authors suggested that resveratrol was converted to the glucuronide during absorption and postulated that the resulting molecule could be cleaved back into resveratrol in various organs of the body. The presence of flavanoids in products containing resveratrol may improve its bio-availability. Two studies in 2000 suggested that flavanoids inhibit the sulphation and
glucuronidation of resveratrol in the liver and therefore improve the bio-availability of the compound (De Santi et al., 2000a, 2000b). Kimura and Okuda reported in a 2001 study that resveratrol inhibited tumor growth in mice and inhibited angiogenesis in human umbilical cells which suggests a mechanism for the reduction in tumor growth. Another 2001 study demonstrated that resveratrol suppressed angiogenesis and tumor growth, but also reduced wound healing in bovine and mouse cells. Resveratrol has also been shown to inhibit human squalene monooxygenase, an enzyme that is part of the cholesterol biosynthetic pathway (Laden and Porter, 2001). A 2002 (El-Mowafy, 2002) study reports that resveratrol has vascular relaxation properties. The authors suggest that resveratrol could have significant effects on vascular disorders such as atherosclerosis, chronic hyperlipidemia and diabetes.
2.1.4 Early Studies. In 1976 Langcake and Pryce published a paper demonstrating that resveratrol was produced by “Vitis vinifera ... as a response to infection or injury”. This work was focused exclusively on its effect on disease resistance. For the next 15 years, resveratrol was studied extensively in grapes (Langcake and Pryce, 1977; Creasy and Coffee, 1988; Derecks and Creasy, 1989; Jeandet et al., 1991). In 1992, Siemann and Creasy published a paper demonstrating that resveratrol (sum of trans and cis) was present in finished wine. They sampled 22 wines and found resveratrol (HPLC with UV detector) concentrations ranging from below detection to 0.7 mg/L. In general, red wines had higher resveratrol levels than white wines although this was not always the case. The authors proposed that since resveratrol is produced almost exclusively in the skins, wines with longer skin contact during vinification (red wines) should have higher levels of resveratrol. Their data also suggested that growing region had an effect on resveratrol concentration. Chardonnays from New York had higher resveratrol concentrations than Chardonnays from California. The authors proposed that since resveratrol production is stimulated by fungal attack, regions with greater fungal pressure would produce grapes with higher resveratrol concentration. In 1993, Jeandet et al. quantified resveratrol in Burgundy wines using gas chromatography and a mass spectrophotometer. Their results confirmed the findings of Siemann and Creasy. Resveratrol concentrations were higher in red wines than in white and they also found differences based on the growing conditions. Unlike Siemann and Creasy, they were able to quantify the trans and cis
isomers of resveratrol, separately. They were surprised to find, since it had not been found in grapes, that the cis isomer was the predominant form in the wines. The authors suggested that exposure to sunlight during processing or reactions occurring during vinification converted the trans isomer to the cis. This study found slightly greater amounts of resveratrol than did Siemann and Creasy. They found levels from not detected to 0.06 mg/L for Chardonnay to 0.4 to 2.0 mg/L for Pinot Noir. The previous two studies demonstrated conclusively that cis and trans resveratrol was present in finished wines. Although studies had concluded by then that resveratrol had biological activity (Frankel et al., 1993; Shan et al., 1990; Kimura et al., 1985; Kimura et al., 1983), there were still those who argued that the small amounts of resveratrol in wines were unlikely to have a meaningful effect on human health. A 1994 study by Waterhouse and Lamuela-Raventos demonstrated that grape berries contained not only resveratrol but also contained a 3-beta-glucoside of resveratrol (piceid). This compound could be converted to resveratrol during vinification and could also provide for a greater biological effect from wine if it survives processing and is present in the finished wine. Two studies (Lamuela-Raventos et al., 1995a, 1995b; Romero-Perez et al., 1996a, 1996b) subsequently demonstrated that piceid was present in wine. The 1995 article reports that resveratrol and piceid (stilbenes) were present in wines in proportions that agree with previous studies (Lamuela-Raventos and Waterhouse, 1993; McMurtey et al., 1997; Soleas et al., 1995). They report that Pinot Noir wines generally have the highest levels of stilbenes (9.39 mg/L) followed by Merlot (9.19 mg/L), Grenache (6.37 mg/L), Cabernet Sauvignon (3.23 mg/L) and Tempranillo (3.43mg/L). Romero-Perez et al., in a 1996 study of resveratrol and piceid isomers in Spanish white wines, reports that isomers of both compounds are present in all samples and the levels range from 0.46 to 1.24 mg/L total stilbenes. This is consistent with previous reports of lower levels in white wines. When considering trans and cis resveratrol and trans and cis piceid, the doses one would receive from a typical serving of wine is significantly greater than when only trans resveratrol was considered alone. Since glycosidase is known to be present in the digestive tract, it is possible that piceid could be converted to resveratrol and absorbed during digestion (Hackett, 1986). Several studies have demonstrated that piceid is itself biologically active in animal systems (Shan et al., 1990; Kimura et al., 1995).
2.1.5 Effect of UV Light on Resveratrol. A number of studies have demonstrated that UV light can induce the production of resveratrol in grapevine tissues (Langcake and Pryce, 1977; Jendet et al., 1997). In more recent years there have been several additional studies conducted in this area. In 1999, Douillet-Breuil et al. studied changes in the phytoalexin concentration of grape leaf tissue after exposure to UV light. The authors studied four Vitis species: three American species (Vitis rupestris, Vitis cineria and Vitis
labrusca) and three cultivars of Vitis vinifera. All three American species showed a
higher capacity for resveratrol synthesis than V. vinifera. Although, V. rupestris and V.
cineria had higher resveratrol synthesis capacity than V. labrusca. All American species
took longer to reach peak resveratrol concentration (30 to 45 15 hours) than V. vinifera (18 to 25 hours). The American species were considered to be more disease resistant than V. vinifera. The authors proposed that the results they obtained confirmed the role of resveratrol in defense of the plant against fungal attack. Adrian et al., in 2000, studied the concentration of various stilbenes in grape berries in response to UV light and level of infection of Botrytis cinerea. Three cultivars of V. vinifera (‘Gamay’, ‘Pinot Noir’ and ‘Chardonnay’) were studied. Five compounds were quantified trans piceid, cis piceid, trans resveratrol, ,-viniferin (resveratrol dimer) and pterostilbene (3,5methylated resveratrol). For ‘Gamay’ and ‘Chardonnay’, all compounds were detected in berries that were not UV elicited except for the highly infected berries. For the highly infected berries little or none of the compounds was quantified. This was probably due to the ability of the fungal organism to enzymatically degrade the compounds produced by the plant to defend itself. For the non-UV induced ‘Pinot Noir’, the only compounds detected were trans resveratrol and ,-viniferin and only in infected berries and those surrounding the infected berries. For UV elicited berries, neither trans nor cis piceid was detected in the ‘Pinot Noir’ cultivar and only very small amounts of pterostilbene was detected. Pterostilbene was only detected in very small amounts for all berries. Trans piceid, cis piceid, trans resveratrol and , viniferin were quantified in UV elicited berries of both ‘Chardonnay’ and ‘Gamay’ cultivars. Generally incubation of 48 hours after UV elicitation produced greater concentrations of the compounds than an incubation of only 24 hours. Like the non-induced berries, concentrations of all compounds were lower in the highly infected berries than for lesser infected or noninfected berries. Overall, UV elicitation increased the concentration of all compounds in the berries. The data reported