Autore:
Massimo Aliberti
_______________
Relatori:
Prof. Luca Fanucci ___________________
Dott. Vittorio Miori ___________________
Green Buildings and Ambient Intelligence:
case study for N.A.S.A. Sustainability Base
and future Smart Infrastructures
Anno 2013
UNIVERSITÀ DI PISA
Scuola di Dottorato in Ingegneria “Leonardo da Vinci”
Corso di Dottorato di Ricerca in
Ingegneria dell’Informazione
(SSD: Ing-Inf-01)
Tesi di Dottorato di Ricerca
SOMMARIO
Con la diffusione delle smart infrastructures, espressione con cui ci si riferisce collettivamente ai concetti di smart cities e smart grid, i sistemi di building automation vedono il proprio ruolo espandersi oltre i tradizionali limiti degli ambienti isolati che sono progettati per gestire, supervisionare ed ottimizzare. Da sistemi isolati all’interno di edifici residenziali o commerciali, stanno iniziando ad ottenere un ruolo importante su scala più ampia nell’ambito di scenari più complessi a livello urbano o a livello di infrastruttura. Esempi di questa tendenza possono essere le attuali sperimentazioni in varie città del mondo per automatizzare l’illuminazione pubblica, complessi residenziali diffusi (spesso denominati smart connected comunities) e microgrid locali generate dalla federazione di varie unità residenziali a formare cosidette virtual power plants. A causa di questo processo, ci sono aspettative crescenti circa il potenziale delle reti di automazione di introdurre funzionalità sofisticate da un parte ed efficienza energetica dall’altra, ed entrambi gli aspetti su vasta scala. Sfortunatamente questi due obiettivi sono per diversi motivi in conflitto ed è dunque inevitabile individuare un ragionevole compromesso di progettazione. Questa ricerca realizza una caratterizzazione delle attuali tecnologie di automazione per identificare i termini di tale compromesso, con un’attenzione maggiormente polarizzata sugli aspetti di efficienza energetica, analizzata seguendo un approccio olistico, affrontando diversi aspetti del problema. Indubbiamente, data la complessità del vasto scenario tecnologico delle future smart infrastructures, non c’è una finalità sistematica nel lavoro. Piuttosto si intende fornire un contributo alla conoscenza, dando priorità ad alcune sfide di ricerca che sono altresì spesso sottovalutate. Il Green networking, ovvero l’efficienza energetica nel funzionamento di rete, è una di tali sfide. L’attuale infrastruttura IT globale è costruita su attrezzature che collettivamente consumano 21.4 TWh/anno (Global e-Sustainability Initiative, 2010). Questo è dovuto alla scarsa consapevolezza del fatto che le specifiche dei protocolli di comunicazione hanno varie implicazioni sull’efficienza energetica e alla generale tendenza ad una progettazione ridondante e sovra-dimensionata per il caso peggiore. Questo problema potrebbe essere riscontrato anche nelle reti di automazione, specialmente data la tendenza di cui si discuteva sopra, e in tal caso, queste potrebbero introdurre un ulteriore carbon footprint, in aggiunta a quello della rete internet. In questa ricerca si intende dimensionare tale problema e proporre approcci alternativi agli attuali modelli di hardware e protocollo tipici delle tecnologie di automazione in commercio. Spostandosi dalla rete di controllo all’ambiente fisico, altro obiettivo di questo lavoro è la caratterizzazione di sistemi di gestione automatica dei plug loads, carichi elettrici altrimenti non gestiti da alcun impianto di building automation. Per tali sistemi verranno mostrati i limiti e le potenzialità, identificando potenziali problematiche di design e proponendo un approccio integrato di tali sistemi all’interno di sistemi più ampi di gestione dell’energia.
Infine, il meccanismo introdotto nella parte di green networking è potenzialmente in grado di fornire informazioni in tempo reale circa il contesto controllato. Si tratta di un potenziale sfruttabile per sviluppare soluzioni di Demand Side Management, allo scopo di effettuare previsioni di picco e di carico. Questa analisi è attualmente in corso, attraverso una partnership con Enel Distribuzione.
4
ABSTRACT
With the advent of smart infrastructures, collective expression used here to refer to novel concepts such as smart cities and smart grid, building automation and control networks are having their role expanded beyond the traditional boundaries of the isolated environments they are designed to manage, supervise and optimize. From being confined within residential or commercial buildings as islanded, self-contained systems, they are starting to gain an important role on a wider scale for more complex scenarios at urban or infrastructure level. Example of this ongoing process are current experimental setups in cities worldwide to automate urban street lighting, diffused residential facilities (also often addressed to as smart connected communities) and local micro-grids generated by the federation of several residential units into so-called virtual power plants.
Given this underlying process, expectations are dramatically increasing about the potential of control networks to introduce sophisticated features on one side and energy efficiency on the other, and both on a wide scale. Unfortunately, these two objectives are, in several ways, conflicting, and impose to settle for reasonable trade-offs.
This research work performs an assessment of current control and automation technologies to identify the terms of this trade-off with a stronger focus on energy efficiency which is analyzed following a holistic approach covering several aspects of the problem. Nevertheless, given the complexity of the wide technology scenario of future smart infrastructure, there isn’t a systematic intention in the work. Rather, this research will aim at providing valuable contribution to the knowledge in the field, prioritizing challenges within the whole picture that are often neglected. Green networking, that is energy efficiency of the very network operation, is one of these challenges. The current worldwide IT infrastructure is built upon networking equipment that collectively consume 21.4 TWh/year (Global e-Sustainability Initiative, 2010). This is the result of an overall unawareness of energy efficiency implications of communication protocols specifications and a tendency toward over-provisioning and redundancy in architecture design. As automation and control networks become global, they may be subject to the same issue and introduce an additional carbon footprint along with that of the internet. This research work performs an assessment of the dimension of this problem and proposes an alternative approach to current hardware and protocol design found in commercial building automation technologies.
Shifting from the control network to the physical environment, another objective of this work is related to plug load management systems, which will be characterized as to their performance and limitations, highlighting potential design pitfalls and proposing an approach toward integrating these systems into more general energy management systems.
Finally, the mechanism introduced above to increase networking energy efficiency also demonstrated a potential to provide real-time awareness about the context being managed. This potential is currently under investigation for its implications in performing basic load/peak forecasting to support demand side management architectures for the smart grid, through a partnership with the Italian electric utility.
TABLE OF CONTENTS
SOMMARIO
3
ABSTRACT
4
TABLE OF CONTENTS
5
LIST OF FIGURES
10
LIST OF TABLES
15
1.
INTRODUCTION
16
1.1. Structure of this document 16
1.2. Building Automation 17
1.2.1. Historical overview of Home and Building Automation 18 1.2.2. Benefits and challenges of HBAS integration 18
1.2.3. Building Automation three-tier model 19
1.2.3.1 Field level 19
1.2.3.2 Automation level 19
1.2.3.3 Management level 20
1.2.4. Intelligence distribution 21
1.2.4.1 Functional blocks 21
1.2.5. Home and Building Automation standard ISO/IEC14543-3 22
1.2.5.1. KNX network media 22
1.2.5.2. KNX network topology 22
1.2.5.3. KNX application layer 23
1.2.5.4. KNX interworking 24
1.3. Green networking 24
1.3.1 Green Networking concepts and techniques 26
1.3.1.1. Resource consolidation 26 1.3.1.2. Selective connectedness 26 1.3.1.3 Virtualization 27 1.3.1.4 Proportional Computing 27 1.4. Smart Grid 28 1.4.1. Demand-side management 29 1.4.2. Demand-Response 29 1.4.2.1 Demand-response programs 29
6
Price-based Demand-response 30
Incentive-based Demand-response 30
1.4.3. Automated Demand-response architectures 30
1.4.3.1. OpenADR 30
1.4.3.2. Whirlpool Smart Device Network 30
1.4.3.3. Australian HAN guideline 31
1.4.3.4. PowerMatcher 31
2.
SERVICE ORIENTED ARCHITECTURE FOR HBAS
INTEROPERABILITY
32
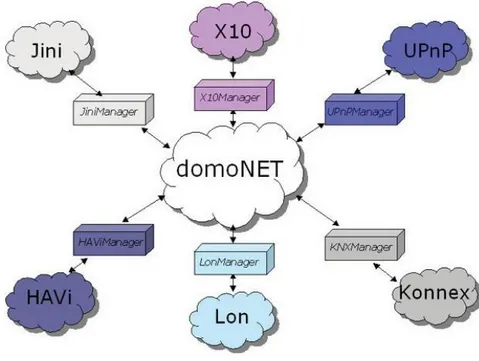
2.1. Domonet architecture and interaction model 33
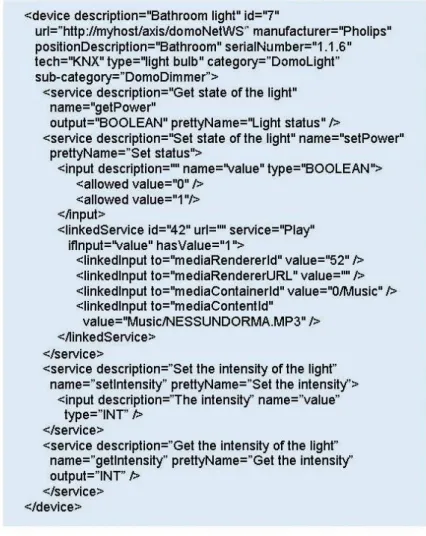
2.2. The domotic Xml language 35
2.2.1 domoDevice 35
2.2.2 domoMessage 37
2.3. The domotic system Gateways (the techManager) 37
2.4. The Domonet engine 38
2.5. The Prototype 39
2.6. Conclusion 39
3.
GREEN NETWORKING IN HOME AND BUILDING AUTOMATION
THROUGH POWER STATE SWITCHING
41
3.1. Energy demand in HBAS devices and networks 41 3.2. Energy consumption due to HBAS networked devices 42 3.3. Assessing the introduction of Power Management techniques in HBAS hardware
and protocols 45
3.3.1. Green Networking Approaches 45
3.3.2. Power – QoS Trade-off 45
3.3.3. Policy distribution 46
3.3.4. Energy Budget 47
3.3.5. Policy implementation 47
3.4. Applying DPM to KNX 49
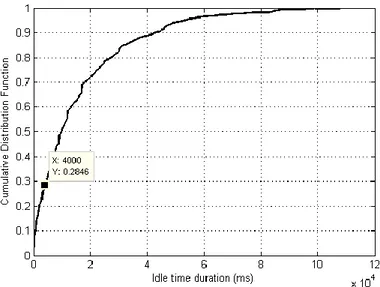
3.4.1. Statistical distribution of idle intervals 49
3.4.2. Uncoordinated DPM challenges 50
3.5. Towards a power state switching hardware model in HBAS networks 54
3.5.1. Experimental setup 55
3.5.2. Requirements for the target green networking solution 57
3.5.2.1. Close-to-market/pre-market solution 57
3.5.2.2. Backwards compatibility with current standard 57 3.5.2.3. Co-existence of green and non-green devices 57
3.5.2.4. Absence of central elements 58
3.5.2.5. Zero impact on network load 58
3.5.2.6. Low impact on QoS 58
3.5.2.7. Transparency with regard to integration middleware 58
3.5.2.8. Disabling command 58
3.5.2.9. Robustness against external middleware 58
3.5.2.10. Auto-configuration 58
3.5.3. Experimental approach 58
3.5.4. Patterns in HBAS network trace 60
3.5.5. Adjacency Sets 60
3.5.6. Leveraging identified patterns to maximize PoQoS trade-off 61
3.5.7. Simulation results 62
4.
N.A.S.A. SUSTAINABILITY BASE: DESIGN AND ASSESSMENT OF
A PLUG LOAD MANAGEMENT SYSTEM
65
4.1. Motivation for a Plug Load Management system 66
4.2. Pilot Study 66
4.2.1. Testing equipment 66
4.2.2. Physical locations for the test environment 67
4.2.3. Appliances population 68
4.2.4. Methodology 68
4.3. Results 69
4.3.1. Workload dependent appliances 70
4.3.2. Appliances affected by start-up issues 72
4.3.3. Complex devices and built-in power management policies 74
4.4. Global outcome of the experimental PLMS 76
4.4.1 Workstations 77
4.4.2. Break Room 79
4.5. Limitations of the approach 80
4.5.1. Definition of contexts and policies 81
4.5.1.1. Coarse grained definition of contexts 81
4.5.1.2. Mutual exclusivity 82
8
5.
RESTRUCTURING SUSTAINABILITY BASE PLUG LOAD
MANAGEMENT SYSTEM EXPLOITING SMART BUILDING
TECHNOLOGIES
83
5.1. Contribution to technical knowledge and practices 83
5.2. Applicable norms and regulations 84
5.3. Exploiting building automation systems for energy auditing: concepts and
methods 85
5.3.1. Technology choice 87
5.3.2. Energy metering by adopting special purpose actuators 88 5.3.3. Indirect energy metering by exploiting database knowledge 90
5.4. Data collection system architecture 94
5.4.1. Centralized energy monitoring at the supervisory system 94 5.4.2. Centralized or distributed energy monitoring by means of embedded systems 95
6.
SMART GRID DEMAND SIDE MANAGEMENT EXPLOITING
ADJACENCY SETS
96
6.1. Building automation as a key enabler for the Smart Grid 96 6.2. Local context detection and load forecasting exploiting adjacency sets 97
6.3. Limitations of the proposed approach 98
6.4. Overall research method 98
6.4.1. Continuous energy curve estimation 99
6.4.2. Context detection through HBAS network monitoring and adjacency sets packet
classification 100
6.5. Target system requirements 101
6.5.1. Local peak occurrence forecasting 101
6.5.2. Load forecasting 101
6.5.3. Estimation of the curtailment potential 101
6.5.4. Introduction of an interruptible virtual electric sub-system 101 6.5.5. Introduction of a general enabling command for Demand Response operated by
the user 102
6.5.6. Managing grid policies at local or neighborhood level against renewable
production 102
6.5.7. Energy efficiency features 102
6.5.7.1. Context-based energy monitoring 102
6.5.7.2. Indirect NILM with estimation of the structure of energy consumption 103
6.6. Testing equipment and methodology 104
6.7. Testing methodology 107
6.8. Testing location 108
CONCLUSIONS
110
10
LIST OF FIGURES
FIG. 1.1 – AUTOMATION HIERARCHY [51] ... 20
FIG. 1.2 – AN EXAMPLE FOR A DATA POINT GRAPH USING
DIFFERENT FUNCTIONAL BLOCKS AND AGGREGATION [51] ... 21
FIG. 1.3 – EXAMPLES OF ENERGY-WORKLOAD RELATIONSHIP [62]
... 27
FIG. 1.4 – ENERGY FOOTPRINT OF DIFFERENT SYSTEMS,
OPTIMIZED FOR DISTINCT OPERATIONAL WORKLOADS [62] ... 28
FIG. 1.5 – DEMAND RESPONSE ARCHITECTURES [105] ... 31
FIG. 2.1 – DOMONET ARCHITECTURE ... 34
FIG. 2.2 – DOMONET PROTOCOL STACK... 35
FIG. 2.3 – USE DIAGRAM FOR THE INTEROPERABILITY ... 38
FIG. 3.1 – MEASUREMENT SYSTEM... 42
FIG. 3.2 – ENERGY CONSUMPTION BY KNX NETWORK ... 43
FIG. 3.3 – POWER CHARACTERISTICS: IDEAL AND MEASURED CASE
... 44
FIG. 3.4 – IDLE TIME DURATION CUMULATIVE DISTRIBUTION ... 50
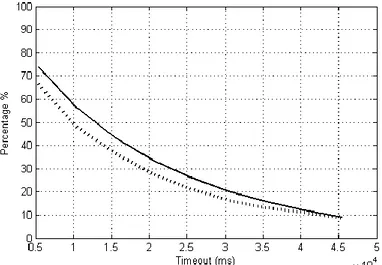
FIG. 3.5 – FIXED TIMEOUT DPM SIMULATION RESULTS:
ACCUMULATED SLEEP TIME (SOLID LINE) AND TOTAL RATE OF
WAKE-UP EVENTS (DOTTED LINE) SIMULATED WITH A RANGE OF
TIMEOUT VALUES ... 51
FIG. 3.7 – AUTOCORRELATION OF TRAFFIC TRACE ... 52
FIG. 3.8 – DEVICE ACTIVITY: PERCENTAGE OF HOURS WITH GIVEN
NUMBER OF SENT/RECEIVED FRAMES ... 53
FIG. 3.9 – RESULTS OF FIXED TIMEOUT DPM SIMULATION WITH
POWER PROXYING: ACCUMULATED SLEEP TIME (SOLID LINE) AND
TOTAL RATE OF WAKE-UP EVENTS (DOTTED LINE) SIMULATED
WITH A RANGE OF TIMEOUT VALUES ... 54
FIG. 3.10 – SCHEMATIC DIAGRAM OF THE EXPERIMENTAL SETUP
AND WORKFLOW OF ANALYSIS ... 55
FIG. 3.11 – PACKET INTER-ARRIVAL TIMES WITHIN THE FILTERED
TRACE... 61
FIG. 3.12 – SIMULATION RESULTS OBTAINED EXPLOITING THE
SPATIAL ADJACENCY SET: SLEEP TIME (BLUE, SOLID CURVE) AND
RATE OF WAKE-UPS (GREEN, DOTTED CURVE) ... 62
FIG. 3.13 - SIMULATION RESULTS OBTAINED WITH THE
FUNCTIONAL ADJACENCY SET: SLEEP TIME (BLUE, SOLID CURVE)
AND RATE OF WAKE-UPS (GREEN, DOTTED CURVE) ... 63
FIG. 3.14 – SIMULATION RESULTS WITHOUT PACKET FILTERING:
SLEEP TIME (BLUE, SOLID CURVE) AND RATE OF WAKE-UPS
(GREEN, DOTTED CURVE) ... 63
FIG. 4.1 – RENDERING OF SUSTAINABILITY BASE (PHOTO
COURTESY OF NASA) ... 65
FIG. 4.2 – SMART POWER STRIP DEPLOYED FOR THE STUDY
(PHOTO BY ENMETRIC, INC.) ... 67
FIG. 4.3 – 802.15.4 BRIDGE INTERFACING WITH THE POWER
12
FIG. 4.4 - PILOT STUDY POWER PORTS (GREEN) AND BRIDGE
LOCATIONS (RED) ... 69
FIG. 4.5 – USE-DEPENDENT POWER DRAW PATTERN ... 70
FIG. 4.6 – STAND-BY POWER DRAW (MICROWAVE OVEN) ... 71
FIG. 4.7 – USE-DEPENDENT APPLIANCE WITH WARM UP CYCLES . 72
FIG. 4.8 – REFRIGERATION CYCLES FOR THE DRINK VENDING
MACHINE ... 73
FIG. 4.9 – START-UP CYCLE FOR THE REFRIGERATOR TO REACH
OPERATING TEMPERATURE ... 74
FIG. 4.10 – 30” MONITOR ENERGY CONSUMPTION (SEE ALSO [95])
... 75
FIG. 4.11 – BLACK AND WHITE PRINTER POWER DRAW ... 75
FIG. 4.12 – BLACK AND WHITE POWER DRAW IN STAND-BY MODE
... 76
FIG. 4.13 – UNCONTROLLED AND CONTROLLED AVERAGE DAILY
ENERGY USAGE [95] ... 77
FIG. 4.14 – BOXPLOTS FOR AVERAGE WORKSTATION POWER
DRAW [95] ... 78
FIG. 4.15 – COPIER STAND-BY POWER DRAW... 79
FIG. 4.16 – COPIER IDLE STATE POWER CONSUMPTION ... 80
FIG. 5.1 – POWER METERING WITH DEDICATED CIRCUITS
(EN-15193) ... 85
FIG. 5.2 – MULTIPLE CIRCUITS SEGREGATION (EN-15193) ... 86
FIG. 5.3 – ENERGY METERING BY MEANS OF BUS BASED LIGHTING
CONTROLLERS (EN-15193) ... 86
FIG. 5.4 – ISO/IEC 14543-3 MULTICHANNEL ACTUATOR WITH
POWER METERING ... 89
FIG. 5.5 – ISO/IEC 14543-3 MULTICHANNEL ACTUATOR WITH
SINGLE POWER METER ... 89
FIG. 5.6 – ISO/IEC 14543-3 MULTICHANNEL ACTUATOR WITH
FEEDBACK OBJECTS ... 91
FIG. 5.7 – EXAMPLE BACS SCENARIO ... 92
FIG. 5.8 – FEEDBACK OBJECTS IN THE EXAMPLE CASE ... 92
FIG. 6.1 – DAILY POWER DRAW WITHIN THE MONITORED
LOCATION (SMART METER DATA) ... 99
FIG. 6.2 – EXAMPLE SCENARIO OF THE COMBINED DATASETS .... 100
FIG. 6.3 – ENEL’S SMART METER ... 104
FIG. 6.4 – ENEL’S SMART INFO (COURTESY OF ENEL
DISTRIBUZIONE) ... 105
FIG. 6.5 – ENEL SMART INFO REFERENCE ARCHITECTURE
(COURTESY OF ENEL DISTRIBUZIONE) ... 105
FIG. 6.6 – PROSPECTED METHODOLOGY OF DATA ANALYSIS ... 107
FIG. 6.7 – ROOM CONTROLLER (SECOND FLOOR), ABOVE, AND
TOUCH SCREEN PANEL WITH LOGIC FUNCTIONS AND SCENARIOS
(LIVING ROOM), BELOW ... 108
14
FIG. 6.8 – TWO ELECTRICAL CLOSETS WITH HBAS DEVICES
DISTRIBUTION (FIRST FLOOR, ABOVE, AND SECOND FLOOR,
LIST OF TABLES
TABLE 2.1 – DOMOML STRUCTURE EXAMPLE OF A DOMODEVICE 36
TABLE 2.2 – SCHEMA AND TAGS USED TO DESCRIBE A
DOMOMESSAGE ... 37
TABLE 3.1 – RAW HBAS TRAFFIC EXCERPT ... 56
TABLE 3.2 – HUMAN READABLE TRAFFIC EXCERPT FROM THE
EXPERIMENTAL SETUP WITH THE INDICATION OF INTER-ARRIVAL
TIMES BETWEEN PACKETS ... 57
TABLE 4.1 – PLUG LOAD DEVICE BREAKDOWN ... 68
TABLE 6.1 – SMART INFO DATAFLOW ... 106
16
1. INTRODUCTION
Automation and control networks have been evolving, over the last few decades, relatively slowly, in terms of global dimension and pervasiveness, if compared to the worldwide data networking infrastructure. The latter has quickly consolidated into a complex, yet coherent, distributed asset, gaining the role of a more than established critical resource, shaping people’s life, providing access to knowledge and business opportunities to virtually everyone on the planet. For a number of reasons, the same process has not emerged yet for automation and control infrastructures. Visions such as the “Smart Grid”, the “Smart City” and even “Smart Buildings” (all referred to as “Smart Infrastructures”, or SIs, within the scope of this document) still suffer from a tangible gap between technical opportunities and actual adoption rate. A thorough estimation of this gap, as well as a comprehensive explanation of its socio-economic reasons, is beyond the scope of this research work, which aims, instead, at focusing on the identification of the foundational technical challenges that will have to be addressed in order to support an economically and environmentally sustainable growth of SIs. This introduction intends to inform the reader about the motivations of this study and the research questions that have been explored throughout the work. In the following paragraphs, an overall perspective will be provided about the structure of the research effort and, especially, how the underlying vision evolved and specialized into the one described here. The work is structured in four distinct lines, one of which is an ongoing effort.
1.1. Structure of this document
The present document is structured as follows. The present chapter introduces the reader to the body of knowledge pertaining to subjects covered within this work. Chapter 2 describes an original contribution in the field of interoperability among heterogeneous building automation standards. This chapter was also featured as a journal publication in [102]. The work described in this chapter was developed under a research grant at Italian National Research Council (Consiglio Nazionale delle Ricerche) at the Research Area of Pisa, Italy.
Chapter 3 discusses design issues of a green networking prototype model in building automation, developed by the author and published as a journal publication in [103]. This research effort was privately funded.
Chapter 4 and chapter 5 regard research effort conducted within the “Sustainability Base” project for the development of a plug load management system to be deployed at a net zero energy building. The work was conducted under a Fulbright Fellowship grant at N.A.S.A. Ames Research Center, Mountain View, California and is based on the author’s collaboration with the Intelligent Systems Division. Chapter 4, in particular, contains both original (and unpublished) author’s contributions, as well as reporting on the overall project outcome, featured in more details in [95]. Chapter 5 is dedicated exclusively to author’s analysis, exploiting previous results published in [104].
Chapter 6 describes current, ongoing work conducted under a research agreement with the Italian public utility for electrical energy, Enel, aiming at exploiting results
discussed in Chapter 3 for the development of a Smart Grid Demand Side Management system.
Introduction to the body of knowledge, below, is structured in three sections dealing with a brief overview of state of the art technologies and research.
First, an overview of the building automation scenario is presented in paragraph 1.2. This section restructures and summarizes relevant literature material [51] providing the reader with a quick understanding of concepts related to the contribution in Chapter 2 as well as Chapter 5.
The subsequent paragraph provides insight on issues related to energy efficiency in networking equipment in the perspective of the research described in Chapter 3. This survey structure summarizes an overview of relevant literature [62], even though specific work regarding green networking in building automation is not commonly found in other currently published works.
Finally the last section introduces the reader to the concept of Smart Grid, with special regard to Demand Side Management. Only a very brief introduction is provided here, following literature approach as in [105], in the perspective to inform the reader for a better understanding of the research line introduced in Chapter 6.
1.2. Building Automation
Home and Building Automation Systems (HBASs) have been neglected by the scientific community [31] for several years, since their first introduction1 and until lately. This has led to a fragmented technical scenario where each technology and even each deployed system has traditionally been considered as an isolated instance. As a consequence, ad-hoc solutions and design strategies have proliferated, along with several standardization efforts (although incompatible with each other) and proprietary technologies. In the perspective of an upcoming process of convergence of SIs, as most authors expect (see for example [100]), this fragmentation will jeopardize the overall target coherence and, hence, performance, stability, dependability and cost-effectiveness of SIs. Many, if not most, commercial and residential buildings currently equipped with an HBAS, will not be easily “plugged” into higher-level SIs, and, in a more general sense, protection of past investments will not be maintained in all cases.
On a wide perspective, Home and building automation systems (HBAS) deal with enhancing the process of interaction with and between devices, appliances and systems within indoor habitats, ranging from very small networks to large infrastructures. The latter category has recently expanded from the traditional concept of “buildings” (including office buildings, hospitals, warehouses, or department stores) to define large distributed complexes made of a federation of smaller installations (such as distributed corporate premises, “diffused” residential facilities, connected communities and Smart Cities). The key value proposition leveraged by the building automation market is the perspective of gaining increased comfort levels while optimizing operation costs. Thus, several regulatory efforts have been introduced in order to facilitate, or even mandate the use of HBAS.
18
The principle behind these regulations is that economical and financial considerations suggest that introducing HBAS, although this investment typically results in higher construction cost, is economically feasible if examined by considering the entire building life cycle. In fact, operational costs of a building over its lifetime may sum up to even about seven times the initial investment for construction. Therefore, it is paramount to adopt a building concept that targets optimal life cycle costs, rather than minimum investment.This is also confirmed by the existence of several performance contracting offers. In these models, the financial risk is taken by the contractor, in the perspective that future savings will offset the initial investment within an economically reasonable time. Below a few introductory concepts will be provided to inform the reader about important pieces of knowledge to appreciate the upcoming original contributions. The interested reader will surely find beneficial reading full survey overview of building automation [51] and, for specific technologies, to relevant standardization documents.
1.2.1. Historical overview of Home and Building Automation
The origins of HBAS technologies are tightly connected to Heating Ventilation and Air Conditioning (HVAC), core functionality dedicated to human comfort, and therefore main focus of building automation since early 20th century until today. Early systems were designed leveraging pneumatic-based communication mechanisms, exchanging information based on air pressure levels, within the range between 0,2 to 1 bar.
Then, electrical and electronic systems appeared, in which the information exchange mechanism was instead based on voltage or current levels, e.g. the well-known 4-20mA.
Finally, microprocessors were deployed, and concepts such as Direct Digital Control (DDC), and Programmable Logic Controllers (PLCs), a category of devices exploited both for industrial and building automation, begun to appear.
Supervisory Control and Data Acquisition (SCADA) were then introduced as systems for building management, with the purpose to significantly facilitate operation and maintenance tasks, which could be executed remotely, rather than on-site, at each piece of equipment’s location, reducing the burden and costs to service, troubleshoot and audit large building automation systems.
Historical data logging functionalities were then introduced giving life to so-called Building Management Systems (BMS) enabling assessment of operation costs, analysis of trend logs with the aim of improving the overall system design and optimize control strategies.
1.2.2. Benefits and challenges of HBAS integration
The general HBAS derived benefits mentioned above, that is enhancing of functionality and comfort on one side and reduction of life-cycle costs, reach their maximum as more systems are combined and integrated. Unified supervision and management potentially reduces maintenance costs. Large setups with several buildings spread out geographically over large distances would greatly benefit from an harmonization of the building network infrastructure.
This desirable scenario, however, is currently jeopardized by the fact that different manufacturers use proprietary communication interfaces, and, at the same time, no manufacturer is able to provide a complete offer of user-required applications (nor willing to invest toward this goal). The opposite approach, given by open standards,
which define common frameworks, interfaces, communication protocols and even hardware models, facilitate multi-vendor system design.
Beyond the mentioned need to offer a wider range of applications, the concept of system integration is also crucial in that advanced functionalities require as many sources of information as possible in order to adopt suitable decision-making procedures. This concept will be explored in deeper detail in subsequent chapters, since it is at the base of the original contributions of this research work. Here, it is important to outline that correlating multiple pieces of information is necessary both within the HBAS (to enable sensor fusion techniques, for example) and between the HBAS and other systems, such as the IT data infrastructure, as well as standalone security or access control systems, to name a few.
Synergies among systems are becoming more and more feasible also by the trend toward adopting traditional LAN technologies within building automation. Tunneling techniques, as well as native support for IP-based connectivity are very common in HBAS technologies (protocols such as Knx or Bacnet have included such practices within their standards).
Highly integrated systems, however, are typically very challenging due to their complexity. Troubleshooting malfunctioning systems could require extensive knowledge of several technologies and isolating faults within a single sub-system might not be always possible. This can have an undesired impact on collaboration schemes between design professionals and on liability determination. When life safety is involved, this problem becomes strictly critical. For this very reason, fire alarm systems traditionally have been required by building codes to be kept completely separate from other building control systems.
1.2.3. Building Automation three-tier model
The structure of HBAS is logically divided into three layers, to facilitate consistent design and analysis of different systems. This division is usually addressed to as automation pyramid or hierarchy, and is represented in Fig. 1.1. The following paragraphs briefly describe each of the three layers.
1.2.3.1 Field level
The field level is the closest to the controlled physical processes. Here is where we have the sensing part (collection and transmission of environmental data) on one side, and the actuating part (physical control of environmental parameters) on the other. Due to their nature, field devices may engage in analog to digital conversions, as well as driving motors, etc. Field devices may be equipped, depending on the specific technology, with various degrees of computational power.
1.2.3.2 Automation level
Data coming from the field is then aggregated and further manipulated by the automation level, which introduces logical elaborations and control actions at a higher level of abstraction. At this level, data related to distinct sub-systems may be aggregated horizontally both for further action and for access by the upper layers. The device depicted in Fig. 6.7 (touch screen) is an example of this layer, in that it provides logical functions correlating field-level data as well as coordination of underlying system functions by enacting scenarios (sequences of commands delivered to various field devices upon a single user request).
20 1.2.3.3 Management level
At the management level, information from the entire system is consolidated and made accessible for visualization. This layer is also responsible for logging historical data. Building operators interact with this level to engage in typical maintenance and verification procedures. More complex interpretation of data is also usually executed at this level, since it is composed by devices with significant computational abilities. SCADA systems pertain to this layer.
Common HBAS systems often exhibit hybrid combinations of these three layers. While the field level is always present, the other two might be included only in higher-end installations. Also, coordination functions might be present at field level as well as management tools might directly request action at field level.
1.2.4. Intelligence distribution
In HBAS networks, nodes (sensors, actuators and controllers) are connected to a shared network and communicate using a common protocol. Communication procedures may be horizontal (data exchange between sensors and actuators) or vertical (such as in data logging procedures or for commands sent directly to actuators from upper layers, in command-driven, rather than data-driven, models). The whole HBAS restructures the underlying physical process exploiting logical elements known as data points, which are made available to the application level. Data points are directly handled by field devices which can manage one or more of them. Logical bindings between data points are then expressed to actually build the distributed application, which defines the procedures to process input data points into output ones. This logical structure can be visualized by means of a directed graph (see below). Note that there is a distinction between the mentioned logical structure and the physical distribution of field devices as well as their physical connections to the shared medium.
1.2.4.1 Functional blocks
Specific functions or subsets of the distributed application, can be identified by logical grouping of points in the data point graph. This groups are commonly known as functional blocks. They represent a convenient design tool in that system builders can conceive the whole distributed application as a connection between several functional blocks.
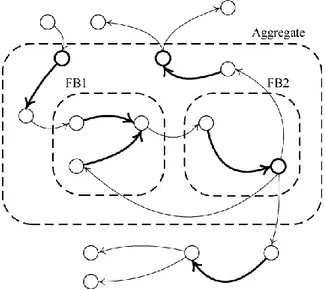
This concept is illustrated in Fig. 1.2. In the graph, data points (vertices) are grouped into functional blocks FB1 and FB2. Network connections are represented by the thin lines, while processing dataflow is represented by bold lines. As anticipated above, FB1 and FB2 may be implemented by single physical devices or
Fig. 1.2 – An example for a data point graph using different functional blocks and
22
may be spread over many devices. The indicated aggregation box is a further possible grouping of functional blocks at higher levels of abstractions, when convenient for the designer (for example grouping all HVAC-related functional blocks).
1.2.5. Home and Building Automation standard ISO/IEC14543-3
In this section, we will go through standardization aspects pertaining to one of the most representative HBAS protocols, the ISO/IEC 14543-3 [35], commercially known under the brand name KNXTM. It belongs to a category of open standards, especially valued among practitioners in that they enable a wide range of building automation applications. Other significant examples of this category of standards are BACnet [81] and LonWorks [84], about which the interested reader might find introductory material in [51].
Beyond these examples, several other protocols are possible and important for HBAS, both proprietary and open. However, purpose of this paragraph is to introduce the reader to the common structure of one of the most general purpose technology, as details of specialized protocols are outside the scope of this work. Also, the technology here introduced is exploited for the subsequent original contributions in the following chapters, especially in Chapter 3, 5 and 6.
With the intention to give life to a Europe wide standard, in 2002 three then common technologies were merged into a new standard. European Installation Bus (EIB), Batibus and EHS (European Home System) were thus merged into the new technology, under the name of KNX, which was then subsequently recognized as ISO/IEC 14543-3 standard.
1.2.5.1. KNX network media
KNX support a variety of network media. Here we will introduce the most significant of them, namely twisted pair cabling and radio frequency.
Twisted pair cables carry both data and DC power to networked devices. Data is transmitted by means of a balanced base band signal, with CSMA/CA network access. Power is delivered by means of 29V DC running on the same physical cable. Collisions are handled through bit-wise arbitration and four priority levels. Twisted pair segments are single broadcast domains, connected into lines by bridges (line repeaters).
KNX RF allocates a band segment within the band reserved for Short Range Devices (SRD), that is the 868 MHz. Since many KNX RF devices typically operate on battery, specifications are defined to allow for simple mono-directional communication (devices only able to transmit commands, such as remote controllers with no feedback indication) along with bi-directional ones. Even with this distinction, KNX RF communication adheres to the general peer to peer approach of the technology.
1.2.5.2. KNX network topology
KNX networks are divided on three levels, namely areas, lines and single devices within one line. Each device then is identified by its unique 16-bit physical address, made up of three dotted figures (‘area.line.device’). Up to 254 devices are allocated on a single line, for a total of over 60 thousands devices on a single installation. Lines are connected to areas with line couplers, while areas are connected to a common backbone.
Communication within KNX networks can be unicast or multicast. The former are only used during commissioning or maintenance (for example for programming the devices) and make use of the device physical address. During runtime, instead, communications are multicast and based on a separate address space, within which nodes are assigned non-unique addresses, called group addresses. These are at the core of the KNX structure, in fact, each group address identifies a network variable (or data point, in the terminology used in previous paragraphs) and logical bindings within the distributed application are expressed by assigning several devices to the same group address. For example, a simple switching command is realized by binding the sensor button and the switch actuator to the same group address, for the specific data point. Since each device may contain various data points, a single device may be addressable through many group addresses. Group address routing is executed by the area and line couplers by means of suitable tables. Frames to group addresses are acknowledged in group simultaneously (negative acks override positive ones, therefore success is given by the absence of failing devices). It has to be noted that this choice, however, cannot detect lost communications directed to specific devices.
1.2.5.3. KNX application layer
KNX application model is data driven in that it is based on network shared variables representing a specific elementary unit of functionality. These shared variables are accessible by logically linked devices which can write to (producers) or read from (consumers) them, according to a publisher-subscriber model. Group addresses identify access to each shared variable as exemplified above. Each device holds an internal representation of the shared variable, in so-called group objects. Group objects are modified either from the network (received status update) or from within the device itself (status change to be propagated to the network). Assignment to a group address is defined at group object level. Nodes can contain many group objects, hence they can belong to several group addresses. Communication within members of a group is always peer-to-peer. More in detail, the single device doesn’t have visibility over the group composition, and only knows about the related group address. This has implications on security, since there is no underlying authentication.
As anticipated, individual addressing through the physical address (unique for each device) is only used for commissioning. The device is manageable through so-called system interface objects and their properties, accessible through a client-server model. Properties may contain application parameters as well as other programming details, whereas low level configuration (such as assignment of the physical address) is provided by other specific device services.
As to the hardware model, each KNX device is comprised of a network interface, called Bus Coupling Unit (BCU), responsible for extraction of DC supply from the bus as well as transmission and reception of frames and subsequent handling. In the most common hardware profile, BCUs host the complete network stack and user application (i.e. the logic to handle local group objects) and the configuration tables to hold the configured bindings between group objects and group addresses. In this simple model, an additional module may be attached to the BCU, called the Application Module, communicating with the BCU through a 10-pin external interface (PEI) and providing basic I/O capabilities. In more complex devices, these application modules may contain significant parts of the user
24
application and be equipped with an additional microprocessor, where the computational power offered by the BCU is not sufficient. For such complex devices, the application module’s microprocessor can be provided with access to the network stack via the PEI, using serial communication locally with the BCU. 1.2.5.4. KNX interworking
The KNX interworking model is defined to ensure that devices from distinct manufacturers can be coherently commissioned with transparency about their specific hardware implementation, and only taking into account standard data types and functional blocks. Several semantic data types and functional block definitions have been added to the KNX specification over time.
All of this structure can be managed by a design tool called ETS (Engineering Tool Software). Every KNX device must be manageable by this tool, through certified and device specific firmware, that can be uploaded and parameterized onto the device by the PC based commissioning location. ETS is the tool where logical bindings between data points are defined and programmed into end nodes.
1.3. Green networking
Dissemination efforts in the ICT area have enabled, in recent years, an increasing awareness in end users about equipment’s energy efficiency both for the immediate economic benefits that green technologies can offer and for the indirect environmental impact.
In this scenario, even small negative contributions receive close attention. EU Directive 1275/2008, published 17 December 2008, deals directly with “ecodesign requirements for standby and off mode electric power consumption of electrical and electronic household and office equipment” and fixes upper boundaries for power drawn by EuP (Electricity using Products) and ErP (Electricity related Products) during inactivity periods. The rationale of this regulation is that energy unconscious design can create huge global impact when very common devices are involved (TV sets and consumer electronics in general, but also typical appliances, battery chargers and other common categories).
Recent studies [12] have investigated the issue of energy efficiency with particular regard to ICT networks, proving that a substantial percentage of energy is wasted and that more careful approaches are available and feasible to reduce such waste. Reasons have been individuated mainly on two levels.
Electronic design of devices is generally over-provisioned and targeted to the worst case: while this is a solid approach for reliability, unfortunately its side-effect is that efficiency drops to unacceptable values for low or very low workload conditions (this concept is generally referred to as energy proportional computing and will be better examined later and referred to the KNX case).
Communication protocols are generally designed without any energy awareness. Nodes are expected to be always fully functional to maintain network presence, even when no task is being performed. As a consequence, network devices work in the low efficiency region for most of the time, and even worse, idle periods (0% workload) account for percentages around 75% of time or even more.
This is true for most ICT systems, especially when nodes are power consuming elements, such as desktop PCs or servers, connected to the internet. However, similar inefficiencies have been reported in the literature with regard to HBASs as well. B. Nordman [19] envisions a “Darwinian” future where automated buildings may end up consuming more energy than they used to do until today, with little or no automation in place. Energy unaware design of products and networks will be one of the main factors for this potential unexpected result. As a matter of fact, since HBAS vendors market their systems by leveraging the energy saving potential they can offer, it is un-doubtfully advisable that a coherent approach is applied when designing their own products.
Traditionally, instead, energy conservation has been a major requirement only within wireless HBAS protocols, due to the need to promote battery duration, whereas in wire-line systems this issue has been greatly overlooked.
This work intends to investigate on the subject, focusing on the KNX system and on a real environment study case, providing a first contribution to be further discussed and extended, in the direction of a greener networking in KNX standard (see Chapter 3). Since KNX is widely known as a “green technology” in that it promotes energy savings in the controlled systems, it would not be coherent that possible internal inefficiencies are left in the controlling system.
Limits imposed by the above cited EU Directive are 0,5W in the medium term for the majority of devices and apparently less for specific categories of products and/or functional modes. Evaluation of applicability of EU regulation to HBAS is outside the scope of current work, and it is questionable whether limits should be applied to the single device or to the system as a whole, but the results of current work suggest that power consumption may pose EU compliance issues in the near future.
Apart from regulatory processes, also standardization bodies have been active in defining new protocol versions for popular technologies, in the perspective of reaching lower power demands both on a global and local scale. These efforts involve both wireless and wired technologies. Energy Efficient Ethernet (also known as “Green Ethernet”, IEEE 802.3az) introduces interesting modifications to the standard that would allow network nodes to engage in more energy aware communication procedures. These new features are being analyzed with regard to their impact on Industrial Ethernet automation protocols. One example is found in [8] where the impact of Green Ethernet is evaluated with regard to the Powerlink protocol. Since KNX as well is moving towards the introduction of “IP only” devices, it can be expected that the solutions being discussed in the 802.3az task force will involve possible improvements to be exploited in KNX IP devices.
Moreover, regarding IP, a huge drive towards IP for smart objects can be registered in the scientific community, where small footprint versions of the IP stack are successfully being tested on embedded platforms. Among these efforts, it is worth mentioning the 6LowPAN protocol (acronym for “IPv6 over Low Power wireless Area Networks”) developed within the IP for Smart Objects Alliance (IPSOA). This research area aims at building the basis for the “Internet of things” vision, where intelligent devices are spread ubiquitously in the indoor and outdoor environment. Energy efficiency has been recognized as a foundational requirement for such kind of devices [20]. The drive towards ubiquitous computing through IP enabled smart objects is a future scenario that should not be overlooked by more
26
homes would greatly benefit from a tight integration between HBAS and Smart Objects, and it is therefore necessary that the former do not interfere with the power efficiency of the latter.
Green approaches have also already entered the Home Automation area, where power-hungry protocols such as UPnP have been revised in the direction of reducing energy impact [21] and research findings have subsequently been recognized by the UPnP Forum and introduced in the standard [22].
Even for well-known power aware protocols, such as ZigBee, research [10] has proved that there is still room for improvement towards more energy efficiency, showing that also very small sources of power consumption should be avoided, if it’s technically feasible and economically reasonable.
The experience of Bluetooth Low Energy [25] indicates how it is possible to introduce power-efficient mechanisms and at the same time ensuring backwards compatibility. In the BT Low Energy specification, this is tackled with by allowing manufacturers to produce devices able to operate in a so-called “dual mode” where classic BT circuitry can be maintained and integrated with the new low energy features (even higher energy efficiency can be reached in the “single mode” with completely new BT chips, though at the cost of incompatibility with previous versions).
In this evolving technological scenario, this work intends to raise awareness to the implication of green networking in HBAS (see Chapter 3). This is especially important if we consider that, even though it might be considered not cost-effective to introduce modifications to current standards, it is important, however that the terms of the problem are clearly stated and that future standard developments will be evaluated also with regard to the energy efficiency impact they might have.
1.3.1 Green Networking concepts and techniques
Below, a few classes of solutions found in literature [62] are presented, which map to research directions targeting applications in device, protocol and architecture design.
1.3.1.1. Resource consolidation
Resource consolidation is a first paradigm that stems from the fact that most network devices are underutilized for considerable percentages of time. This approach aims at adapting the level of active over-provisioning to actual network load. While still guaranteeing adequate performance, resource usage will be dimensioned for current network traffic demand rather than for the peak demand. This method may involve shutting down under-utilized routers and rerouting the traffic on a consolidated smaller number of active network equipment. This approach is also very common in related fields, such as data centers.
1.3.1.2. Selective connectedness
Selective connectedness is, among green networking paradigms, the closest to the approach on which this thesis work is based on. Selective connectedness promotes distributed mechanisms enabling single devices to enter idle or low-power states for as long as possible, without affecting QoS and transparently with regard to the rest of the network. This scenario can be actually implemented in several differing ways that will be detailed further in upcoming sections, usually involving the intervention of coordination mechanisms, as well as functional proxies.
1.3.1.3 Virtualization
Virtualization techniques are based on the assumption that a single machine under high workload consumes less energy and power than several underutilized machines operating simultaneously. If the above is true, it might prove convenient to consolidate more than one service on a single machine or device, exploiting virtualized low level resources, in order to masquerade applications from their actual running environment. Thus, resource virtualization (even though not exclusively thought for this purpose) typically results in a lowered overall energy consumption.
Virtualization is a relatively mature field, therefore the interested reader might find more in-depth analysis and survey in [63] from a computer architecture perspective, and in [64] for a networking perspective.
1.3.1.4 Proportional Computing
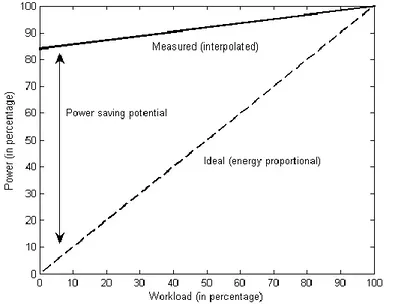
Energy-proportional computing [65] is a general concept dealing with the idea that energy consumption and workload should be tied by a proportional relation. This concept can be applied to entire systems, network protocols (which will be objective of original contributions of this work), as well as to individual devices and even components. Refer to Fig. 1.3 and Fig. 1.4 to better understand this concept. Fig. 1.3 depicts different profiles of possible relationships between energy consumption and workload for a given entity. The two dimensions have been normalized and expressed as ranging from 0 to 1. Depending on the specific behavior, the following device classes can be identified on the graph:
Energy-agnostic devices (worst case), where energy consumption is independent of the workload. These devices consume maximum power when in operation (single power state).
Energy-aware devices (optimal case), where energy consumption and Fig. 1.3 – Examples of energy-workload relationship [62]
28
Single step and multi-step devices (intermediate cases), where the energy-load relationship is coarse grained. More in particular:
o Single step devices have two operation modes (this means introducing an intermediate operation mode between fully on and fully off)
o Multi-step devices have several power states.
Energy-proportional computing might be applied at device level, for example in hardware (Dynamic Voltage Scaling at CPU level to adapt energy state to system load), or at network level (Adaptive Link Rate reducing link capacity, to reduce consumption for low levels of network load).
Since optimal energy-proportional systems are an ideal, and typically unfeasible, case, real systems will mostly fall into the intermediate, multi-step, coarse-grained class. In these systems, optimized design requires accurate determination of the most typical target workload for a given system or device, and the related power state(s). This optimization may prove ineffective in case wrong estimates are taken into account. For instance, Fig. 1.4 depicts two design options: one targeting devices and protocols operating normally under higher workload, and the other one with an efficiency profile optimized for lower workloads. In the remainder of this work, it will be clear that HBAS control networks commonly fall under this second case, therefore, the optimization that the research described here is targeting, aims at introducing coarse grained intermediate power levels acting especially in the low workload region.
1.4. Smart Grid
Smart Grid efforts deal with increasing cost-effectiveness of the electric power grid by optimizing energy efficiency and reliability of the whole process, which involves four macro-phases, namely generation, transmission, distribution and demand.
Fig. 1.4 – Energy footprint of different systems, optimized for distinct operational workloads [62]
While utilities have been enhancing their processes with regard to the first three items, the demand side still is an open technical and research challenge. Up to recent times, loads have been regarded mostly as passive elements of the grid, hard to be managed directly and to predict.
Demand-side has, nevertheless, an important influence both on the grid’s energy efficiency and on its stability. Since line loss is proportional to the current squared, it is easily observed that a grid is more energy-efficient with a flatter demand curve, and of course with lower demand levels, when transmission issues are considered [105]. Much more importantly, flattening the demand curve is crucial in that it enables utilities to avoid over-provisioning their power supply, in the perspective of possible critical peak conditions. Hence, at demand-side, Smart Grid performance improvement involves activities such as load shaping, peak shifting and, more in general, reliable forecasting. All of these objectives are collectively known as Demand Side Management.
1.4.1. Demand-side management
Demand-side management (DSM) is the set of strategies and activities that utilities perform in order to reach the above mentioned objectives. A DSM definition can be found in [85], where it is stated that DSM means “to plan, implement and monitor activities designed to influence customer uses of electricity in ways that will produce desired changes in the utility’s load shape”. DSM is traditionally associated with six load shape objectives, out of which two are most relevant for the above mentioned energy efficiency goals:
peak clipping: reduction of peak load
load shifting: shifting of load from peak to off-peak periods
These two techniques combined imply a general flattening of the energy demand curve and an increased grid stability. At local, user level, complying with these Grid’s objectives would typically imply various methods of demand planning and load scheduling, which could definitely benefit by the existence of an HBAS.
1.4.2. Demand-Response
The enforcement of Grid policies is very hard to perform due to the low level of information and control capabilities (if any) the utilities have upon final users (Chapter 6 will present current efforts of this research toward the objective of increasing these Grid’s capabilities upon end users). Therefore desired runtime behavior can currently almost only be indirectly influenced with particular programs usually called Demand Response (DR). A DR program is “a tariff or program established to motivate changes in electric use by end-use customers in response to changes in the price of electricity over time, or to give incentive payments designed to induce lower electricity use at times of high market prices or when grid reliability is jeopardized” [86]. In other terms, DR programs aim at the general Grid optimization objectives by making desired user behavior more economically convenient and discouraging undesired ones.
1.4.2.1 Demand-response programs
DR programs follow two possible models: price-based or incentive-based, that will be briefly described in the following paragraphs.
30 Price-based Demand-response
Price-based DR programs are based on variable tariffs, which change over time reflecting (more or less closely) the actual real-time energy cost. Two sub-categories are possible: critical peak pricing and time-of-use pricing. The latter implies distinct time intervals within the day, with different tariffs, whereas the latter (also referred to as dynamic peak pricing), involves more unpredictable changes in energy price, and customers are notified in advance of critical peak times during which the tariffs will increase.
In price-based DR, a typical undesired phenomenon may be experienced at the end of a high tariff time interval, when several appliances and loads are possibly reconnected simultaneously, with serious consequences on grid stability. This phenomenon is known as rebound effect [88]. See also Chapter 4 for a more practical demonstration of this problem on a real study case.
Incentive-based Demand-response
Incentive-based DR programs are based on reward mechanisms for users actively participating and complying with run-time requests from the Grid. Participation might be in the form of an overall energy demand reduction at the customer’s premises during peak times, for which users receive a credit or a rebate (peak-time rebate programs [89]). Another kind of user participation might be in the form of accepting direct control by the utility over a certain appliance or set of appliances or building subsystem (direct load control programs [86]).
1.4.3. Automated Demand-response architectures
The original contributions in Chapter 6 aim at making it feasible for utilities and users to manage such kind of participating relationships with the highest degree of flexibility, thus increasing user acceptance.
The general concept of Automated Demand Response (ADR) is based on the idea that more efficient operation can be provided by the deployment of both grid-level and local (home or building) level automation, such that load management can be orchestrated without side effects, such as the rebound effect mentioned earlier and both the Smart Grid and the user can maximize their objectives relying on automatic enforcement of mutually agreed policies. At the core of any DR architecture is the Advanced Metering Infrastructure (AMI) which features automatic meter reading and updated tariff information.
Below, a brief overview of some existing ADR architectures, depicted in Fig. 1.5. 1.4.3.1. OpenADR
OpenADR (Open Automated DR) [90] is an open specification aiming at DR interoperability based on standard data models. DR signals induce automatic action through local building or industrial automation networks. The OpenADR architecture (see Fig. 1.5(a)) is based on the central DR Automation Server (DRAS) which is accessed by Utilities, on one side, to manage DR programs and participants, on the other, through a distinct interface to opt in and opt out of DR programs, provide feedback and perform biddings.
1.4.3.2. Whirlpool Smart Device Network
Whirlpool Smart Device Network [91] is an ADR architecture based on a collection of web services, aggregated by the Whirlpool Integrated Service Environment (see Fig. 1.5(b)) providing interfaces to both Utilities and DR participants (refer to the role of OpenADR DR Automation Server). The Integrated Service Environment
also controls the load management algorithms hosted by the Smart Device Controller and providing energy management functionalities at HAN level.
1.4.3.3. Australian HAN guideline
The Australian HAN guideline [92] is a very interesting architecture, whose concepts will be also exploited in the DSM research contribution within this work (see the concept of virtual DSM circuit in Chapter 6). This architecture subdivides a general Home Automation Network into two logically separate portions: a Utility Private HAN, including the collection of HBAS/HAN devices directly manageable by the Utility, and a Customer HAN, bridged by a Premise EMS (Energy Management System) (see Fig. 1.5(c)), including the HBAS/HAN devices outside of the Utility’s range of action.
1.4.3.4. PowerMatcher
PowerMatcher [93] (see Fig. 1.5(d)) is an agent based model aiming at dynamic matching of supply and demand. Every device hosts an Exchange Agent responsible for bidding and buying/selling from/to the electricity market. User’s preferences are taken into account by the Home Energy Management Box in order to implements optimal local strategies.

![Fig. 1.4 – Energy footprint of different systems, optimized for distinct operational workloads [62]](https://thumb-eu.123doks.com/thumbv2/123dokorg/7615087.115674/28.722.168.552.279.550/energy-footprint-different-systems-optimized-distinct-operational-workloads.webp)
![Fig. 1.5 – Demand response architectures [105]](https://thumb-eu.123doks.com/thumbv2/123dokorg/7615087.115674/31.722.155.559.158.514/fig-demand-response-architectures.webp)