SCUOLA DI DOTTORATO IN INGEGNERIA CIVILE E ARCHITETTURA
DOTTORATO IN INGEGNERIA STRUTTURALE E GEOTECNICA
Seismic vulnerability assessment
of New Zealand unreinforced
masonry churches
Alessandra Marotta
XXVIII Ciclo – A.A. 2015/2016
Abstract
Churches are an important part of the New Zealand historical and architectural heritage, and the extensive damage occurred to stone and clay-brick unreinforced masonry portfolio after the 2010-2011 Canterbury earthquakes emphasises the necessity to better understand this structural type. An effort was undertaken to identify the national stock of unreinforced masonry churches and to interpret the damage observed in the area affected by the earthquakes: of 309 religious buildings recognized and surveyed nationwide, a sample of 80 churches belonging to the Canterbury region is studied and their performance analysed statistically. Structural behaviour is described in terms of mechanisms affecting the so-called macro-elements, and discrete local damage levels are correlated firstly with macroseismic intensity through Damage Probability Matrices, computed for the whole building and for each mechanism. The results show that the severity of shaking alone is not capable to fully explain the damage, strongly influenced by structural details that can worsen the seismic performance or improve it through earthquake-resistant elements. Simple-linear regressions, correlating the mean damage of each mechanism with the macroseismic intensity, but neglecting the difference in the vulnerability of different churches subjected to the same level of shaking, are then improved through use of multiple-linear regressions accounting for vulnerability modifiers. Several statistical procedures are considered in order to select the best regression equation and to assess which parameters have closer relationships with damage. Results show good consistency between observed and expected damage, and the proposed regression models can be used as predictive tools to help determine appropriate seismic retrofit measure to be taken. The conclusions drawn for the Canterbury region are then extended to the whole national stock and a quantitative seismic risk assessment for existing unreinforced masonry churches in New Zealand is presented, using different intensity measures to model the seismic hazard. Seismic risk
is first computed mechanism by mechanism, highlighting how some mechanisms are more frequent than others, and that very large damage levels are expected for some New Zealand regions. Whereupon, an alternative synthetic damage index purely based on observed data is proposed to summarise damage related to several mechanisms and it is used to validate the choice of the best index for describing the global damage of a church when dealing with a territorial assessment. Territorial scale assessment of the seismic vulnerability of churches can assist emergency management efforts and facilitate the identification of priorities for more in-depth analysis of individual buildings. Finally, a preliminary attempt for dynamically characterize the response of unreinforced masonry church is conducted.
Acknowledgements
I wish to express my deepest gratitude to my supervisors, Dr. Luigi Sorrentino and Prof. Domenico Liberatore, for their wise guidance, constant support and inspiring suggestions during the whole research period.
I would like to greatly thank Prof. Jason Ingham, for coordinating the stimulating period at University of Auckland and for his crucial reviews, from which the present research has been significantly benefited. Prof. Sherif Beskhyroun is acknowledged for the assistance in performing the ambient vibration tests.
Special and affectionate thanks are owed to Prof. Luis D. Decanini, for conveying to me the passion for the discipline and for his precious and constant encouragement during my studies.
All the colleagues and members of the Department of Structural and Geotechnical Engineering in Rome are gratefully acknowledged for all the stimulating talks over the years, and, above all, for their sincere friendship.
A special thanks to my parents, Lucrezia e Matteo, and to my brother, Gianluca, for their invaluable support.
Finally, I have to deeply thank Stefano, without whom nothing would have been possible.
Table of Contents
1. Introduction 1
1.1. Thesis format and chapter content 4
1.1.1. Chapter 2. An inventory of unreinforced masonry churches in New Zealand 4
1.1.2. Chapter 3. Vulnerability assessment of unreinforced masonry churches
following the 2010-2011 Canterbury earthquake sequence 5
1.1.3. Chapter 4. Territorial seismic risk assessment of New Zealand unreinforced
masonry churches 5
1.1.4. Chapter 5. Ambient vibration tests on New Zealand unreinforced masonry
churches 6
2. An inventory of unreinforced masonry churches in New Zealand 7
2.1. Introduction 7
2.2. Inventory collection procedure 8
2.3. History of unreinforced masonry churches in New Zealand 10
2.4. Churches characteristics 13 2.4.1. Geographical distribution 13 2.4.2. Typological classification 15 2.4.3. Architectural features 19 2.4.4. Structural characteristics 25 2.5. Conclusions 32 2.6. References 34
3. Vulnerability assessment of unreinforced masonry churches following the
2010-2011 Canterbury earthquake sequence 39
3.1. Introduction 39
3.2. Seismic event 42
3.3. Damage and vulnerability assessment 43
3.3.1. The sample of churches and the data collected 43
3.4. Damage probability matrices 49
3.4.1. Damage probability matrices for global damage 49
3.4.2. Damage probability matrices for local damage 53
3.5. Correlation between mechanisms 57
3.6. Regression models 58
3.6.1. Simple-linear regressions 58
3.6.2. Multiple-linear regressions 59
3.7. Conclusions 74
3.8. References 75
4. Territorial seismic risk assessment of New Zealand unreinforced masonry
churches 83
4.1. Introduction 83
4.2. Ground motion intensity measures 85
4.3. Vulnerability calibration of local mechanisms 87
4.4. Vulnerability calibration of global response 92
4.4.1. Estimation of the global damage index of churches with limited access 99
4.5. Seismic risk 101
4.6. Conclusions 104
4.7. Calculation section 106
4.7.1. Computation of the synthetic damage index 106
4.7.2. Computation of the mean damage considering the church as partially
accessible 107
4.8. References 108
5. Ambient vibration tests on New Zealand unreinforced masonry churches 115
5.1. Introduction 116
5.2. Local mechanisms analysis according to the Italian Building Code 117
5.3. Operational modal analysis 121
5.4. Description of the tested churches 124
5.5. Test setup 125
5.6. Modal parameter identification 128
5.7. Preliminary conclusions and future development 131
5.8. References 132
6. Conclusions 135
Appendix A: List of the unreinforced masonry churches in New Zealand,
disaggregated for each region 139
Appendix B: Damage Probability Matrices and binomial distribution of the 20
Appendix C: Goodness-of-fit test of the 20 considered mechanisms 159 Appendix D: Linear regressions between occurred damage levels and
macroseismic intensity for the 20 considered mechanisms 163
Appendix E: Comparison in the correlation between damage observed and damage predicted using simple- or multiple-linear regression models for the 20
considered mechanisms 167
Appendix F: Regression coefficients for all considered intensity measures 173
List of figures
Figure 1.1. Examples of damage caused to churches by recent earthquakes. 2 Figure 1.2. a) Cumulative damage ratio distribution for houses and churches (D’Ayala,
1999); b) Vulnerability curves of palaces and churches (Lagomarsino, 2006). Data
of both graphs are referred to the 1997 Umbria-Marche earthquake. 2
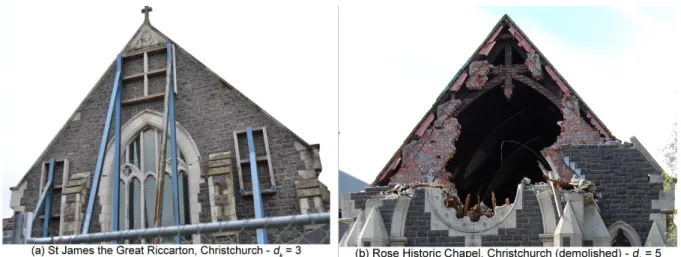
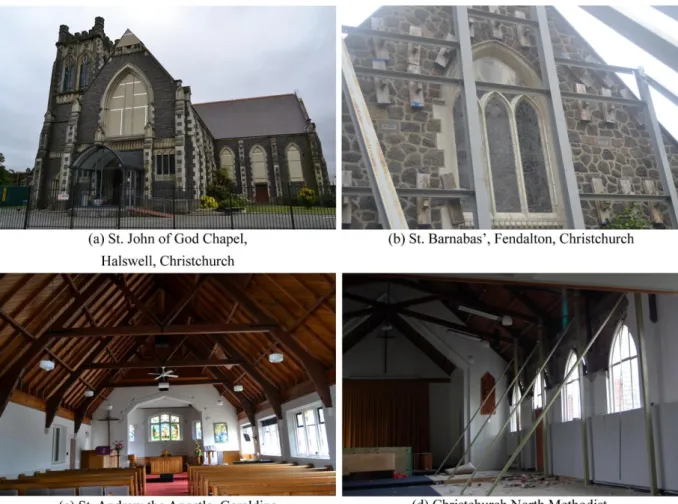
Figure 2.1. Examples of damage caused by the 2010-2011 Canterbury earthquakes. 9
Figure 2.2. Distribution of URM churches in New Zealand. 12
Figure 2.3. Percentage of existing URM churches registered within the New Zealand
Heritage List (HNZ), grouped per region. 12
Figure 2.4. Percentage of URM churches according to construction period (for available
date of construction). 13
Figure 2.5. URM church denomination and use. 13
Figure 2.6. Estimated provincial percentage of existing URM churches. 15
Figure 2.7. Distribution of URM churches compared with the New Zealand national
seismic hazard model (Stirling et al., 2012). 16
Figure 2.8. Percentage of URM churches according to hazard factor (Z). 17
Figure 2.9. Typological classification of URM churches in New Zealand. 17
Figure 2.10. Examples of types of URM churches, based on plan and spatial
configuration. 18
Figure 2.11. Recurring types of URM churches. 19
Figure 2.12. Schematic plan showing the common parts of a church. 20
Figure 2.13. Approximate foot-print area. 21
Figure 2.14. Wall geometric ratios. 21
Figure 2.15. Examples of porch/nartex. 22
Figure 2.16. Regularity of URM churches, both in plan and in elevation. 22 Figure 2.17. Example of geometric irregularities in plan and elevation and position with
respect to other buildings. 23
Figure 2.18. Examples of bell-tower included in the façade, flanked to the façade or
along the longitudinal walls. 24
Figure 2.19. Examples of churches whose use has been changed. 24
Figure 2.20. Masonry types of existing URM churches. 25
Figure 2.21. Examples of church construction materials. 25
Figure 2.22. Masonry type distribution per region. 26
Figure 2.23. Examples of stone types in New Zealand. 27
Figure 2.24. Example of bad masonry quality. 29
Figure 2.26. Type of nave cover and roof support (related to the sub-inventory for an
accessible interior). 30
Figure 2.27. Statical schemes of New Zealand sloping roofs. 30
Figure 2.28. Examples of roof types. 31
Figure 2.29. Examples of soaring elements. 32
Figure 2.30. Examples of presence of tie rods. 32
Figure 3.1. Locations of the 80 URM churches with their NZMMI assignments 44 Figure 3.2. Examples of building materials of the URM churches in the Canterbury
region. Photo (b) is courtesy of João Leite. 44
Figure 3.3. Collapse mechanisms in the Italian survey form for churches (PCM-DPC
MiBAC 2006). 46
Figure 3.4. Examples of damage ascription for mechanism no. 2 (gable mechanisms).
Photo (b) is courtesy of João Leite. 47
Figure 3.5. Percentage of possible (over the sample of 80 churches) and activated (over
the sample of possible) mechanisms depicted in Figure 3.3. 47
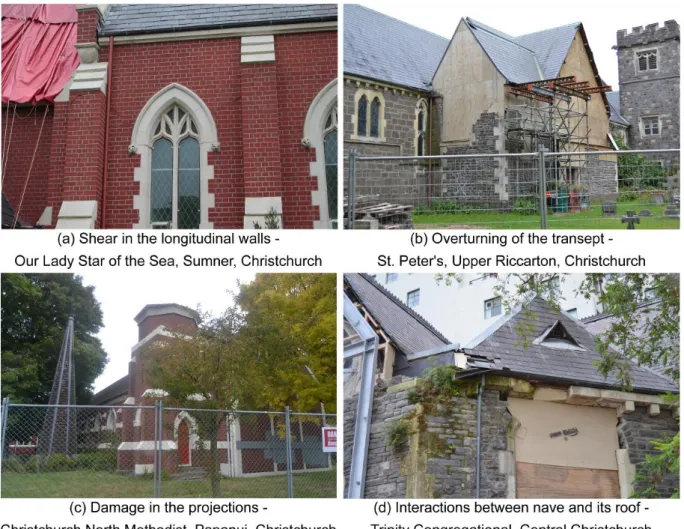
Figure 3.6. Examples of some of the most activated mechanisms. Photo (a) is courtesy
of João Leite. 48
Figure 3.7. Mean damage for the 28 mechanisms. 48
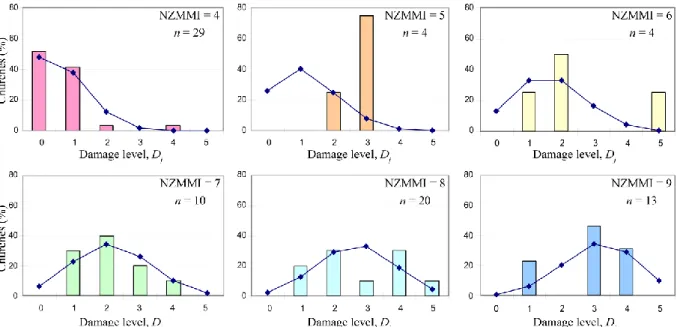
Figure 3.8. Distribution of the damage index, id, with NZMM intensity. 52 Figure 3.9. Percentage of the damage level (Di) for the 80 observed churches. 52 Figure 3.10. Damage Probability Matrices and binomial distribution of the 80 observed
churches for given intensities. 53
Figure 3.11. Goodness-of-fit test of the 80 observed churches for given intensities. The contribution of each damage level to the statistic S, Eq. (6), is reported. The
ordinate values are cut between approximately 25 and 50. 53
Figure 3.12. Damage Probability Matrix and binomial distribution for two of the 20
considered mechanisms (refer to Figure 3.3). 55
Figure 3.13. Damage Probability Matrix and beta distribution for two of the 20
considered mechanisms (refer to Figure 3.3). 56
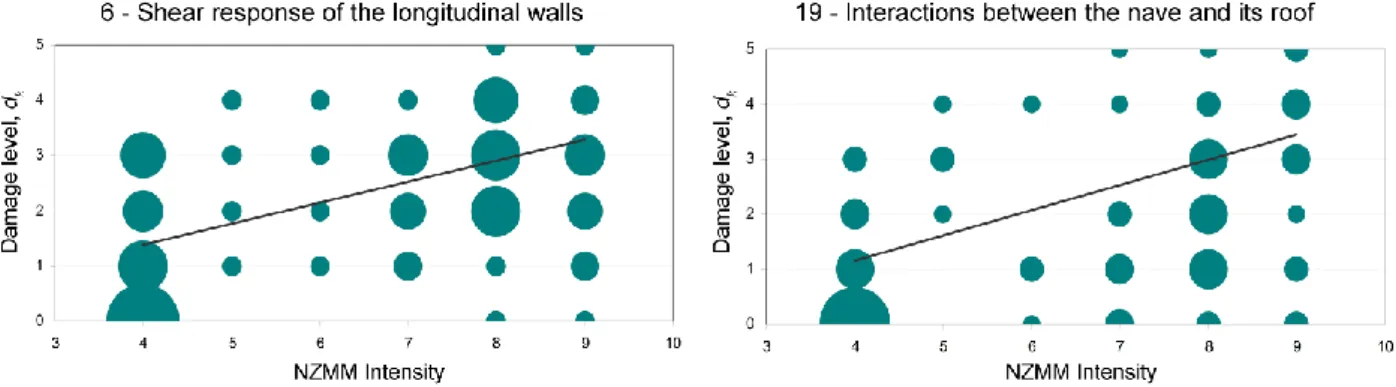
Figure 3.14. Goodness-of-fit test for two of the 20 considered mechanisms. 56 Figure 3.15. Correlation between mechanisms: 1 implies a total positive correlation. 58 Figure 3.16. Linear regressions between occurred damage levels and macroseismic
intensity for sample mechanisms. 59
Figure 3.17. Examples of vulnerability modifiers: (a-b) presence/lack of buttresses; (c-d) presence/lack of a horizontal element able to absorb the thrust of the roof. 60 Figure 3.18. Analysis of residuals for two of the variables accounted for in mechanism
no. 1. 63
Figure 3.19. Comparison in the correlation between damage observed and damage predicted using simple- or multiple-linear regression models for sample
mechanisms. 64
Figure 3.20. Comparison between the R2adj for all regression models (for the
simple-linear regression, it is the value of R2). 65
Figure 3.21. Comparison between the regression coefficients for all the regression
models among all the considered mechanisms (refer to Figure 3.3). 68
Figure 3.22. Examples of poor quality masonry: (a-b) undressed natural stone units;
(c-d) cavity walls. Photos (b-c-(c-d) are courtesy of João Leite. 72
Figure 3.23. Examples of limited effectiveness of earthquake-resistant elements: (a-b-c-d) buttresses; (e-f) tie rods. Photos (d-e) are courtesy of João Leite. 73
Figure 4.1. Comparison between adjusted coefficients of determination, R2adj, for different intensity measures based on mechanisms reported in Table 4.1. NZMMI
data after §3.2. 90
Figure 4.2. Expected regional damage. Left axis: number of damaged churches, disaggregated in terms of damage levels. Right axis: normalised mean damage, weighted on building foot-print area. Regions: 1 = Auckland, 2 = Waikato, 3 = Manawatu-Wanganui, 4 = Wellington, 5 = Canterbury, 6 = Otago, 7 = Southland, 8 = others (Northland, Bay of Plenty, Gisborne, Hawke’s Bay, Taranaki,
Marlborough, Nelson, Tasman, West Coast). Mechanism description given in
Table 4.1. 93
Figure 4.3. Surface area of the façade macroelement (associated to mechanisms #1 and
#3) and church total surface area. 94
Figure 4.4. Correlation between weighted mean damage, D, observed in the Canterbury churches (Eq. (22), ρk = 1) and: a) observed synthetic damage index (Eq. (27)); b)
predicted synthetic damage index (Eq. (30)). 98
Figure 4.5. Global damage index, Ds, as a combination of hazard, x1, and vulnerability,
V: a) church with high V and low x1; b) church with same Ds as in a) but higher x1
and lower V; c) church with same V as in b) but lower x1 (shorter event return
period). 99
Figure 4.6. Correlation between mean damage, D, observed in the Canterbury churches and the damage computed applying the coefficients in Table 4.4, Dc. 100 Figure 4.7. Predicted synthetic damage index, Ds, computed according to Eq (30), for
churches belonging to different regions: a) Bay of Plenty; b) Manawatu-Wanganui;
c) Otago. 102
Figure 4.8. Seismic risk values of New Zealand regions computed with the churches individual values of damage, D, and foot-print area. Values in boxes are regional
averages of D, IH, and V, and regional total of foot-print area. 104
Figure 4.9. Church of the Good Shepherd (Lake Tekapo): a) external view from the
street; b) internal view. 106
Figure 5.1. Tested churches, located in Auckland and deemed to be representative of the
New Zealand portfolio. 126
Figure 5.2. Accelerometer X6-1A and Sensor Orientation (www.gcdataconcepts.com). 127 Figure 5.3. Layout and distribution of accelerometers in the four tested churches. 128 Figure 5.4. Acceleration time series under random excitation and ambient noise of the Z
(out-of-plane) component of three vertically aligned sensors in the façade of the Church of Our Lady of Assumption (accelerations are measured in m/s2). 129 Figure 5.5. Power Spectral Density plot of the Z (out-of-plane) component of three
vertically aligned sensors in the façade of the Church of Our Lady of Assumption. 130 Figure 5.6. Power Spectral Density plot of the Z (out-of-plane) component of four
List of tables
Table 2.1. Parameters considered in the inventory of New Zealand URM churches. 11
Table 2.2. Summary of typological classification of URM churches. 17
Table 3.1. Correlation between damage index, id, and damage level, Dj. 51 Table 3.2. Coefficients R2j and VIFj of the xj dependent variable of mechanism no.1. 63 Table 3.3. Coefficients m and P-value of the multiple-linear regression of mechanism
no.1. 65
Table 3.4. Comparison between the R2 for the simple-linear regression and R2adj for all multiple-linear regression of all the considered mechanisms (SR = Simple-linear regression; MR = Multiple-linear regression; S = Stepwise procedure; BS = Best
Subsets procedure). 65
Table 3.5. Comparison between the regression coefficients for all the regression models. (SR: simple-linear regression, MR: multiple-linear regression, S: Stepwise
procedure, BS: Best Subsets Procedure). 69
Table 3.6. Regression coefficients of the stepwise models. Modifiers added with respect
to the DPCM February, 9 2011 are boldface. 74
Table 4.1. List of the damage mechanisms observed in Canterbury churches.
Numbering refers to the 28 mechanisms in the Italian form (Lagomarsino et al.
2004). 88
Table 4.2. Comparison between adjusted coefficients of determination, R2adj, for
different intensity measures based on mechanisms reported in Table 4.1. 90 Table 4.3. Computed coefficients of the regression models (Eq. (19)) for IH as intensity
measure 91
Table 4.4. Estimation of damage in churches with partial accessibility, through simple-linear regressions. The columns report mechanisms with inspected damage; the rows report mechanisms that cannot be inspected. When more than one
independent variable is present the highest R2 value is shown in boldface. An
example of the use of this table is given in §4.7. 100
Table 4.5. Scenario analysis of the 2011 February event for the Canterbury region,
according with the different global damage 103
Table 4.6. Expected Annual Loss of New Zealand regions, according with the different
global damage 103
Table 4.7. Modifier attribution and computed vector c for each mechanism of the
sample church. 108
Table 5.1. Seismic demand peak acceleration and spectral displacement demand according to Damage Limitation Limit State (DLLS) and Life Safety Limit State
(LSLS). 120
Table 5.2. Characteristics of the MEMS accelerometer. 127
Table 5.3. Natural frequencies identified according to PP technique. 130
Table 0.1. Computed coefficients of the regression models for NZMMI as intensity
measure 173
Table 0.2. Computed coefficients of the regression models for PGA as intensity
measure 174
Table 0.3. Computed coefficients of the regression models for PGV as intensity
measure 175
Table 0.4. Computed coefficients of the regression models for IA as intensity measure 176 Table 0.5. Computed coefficients of the regression models for mIH as intensity measure
Chapter 1
Introduction
The major physical consequences of an earthquake for human beings are, obviously, human casualties and damage caused to the built and natural environments. Both financially and technically, it is possible to reduce these consequences in view of future strong earthquakes, by minimizing the seismic risk of a territory. In order to predispose effective tools for planning and retrofitting, it is of paramount importance to evaluate the earthquake vulnerability of the built and natural environments, and this is pursuable by developing models calibrated on the damage observed in past earthquakes.
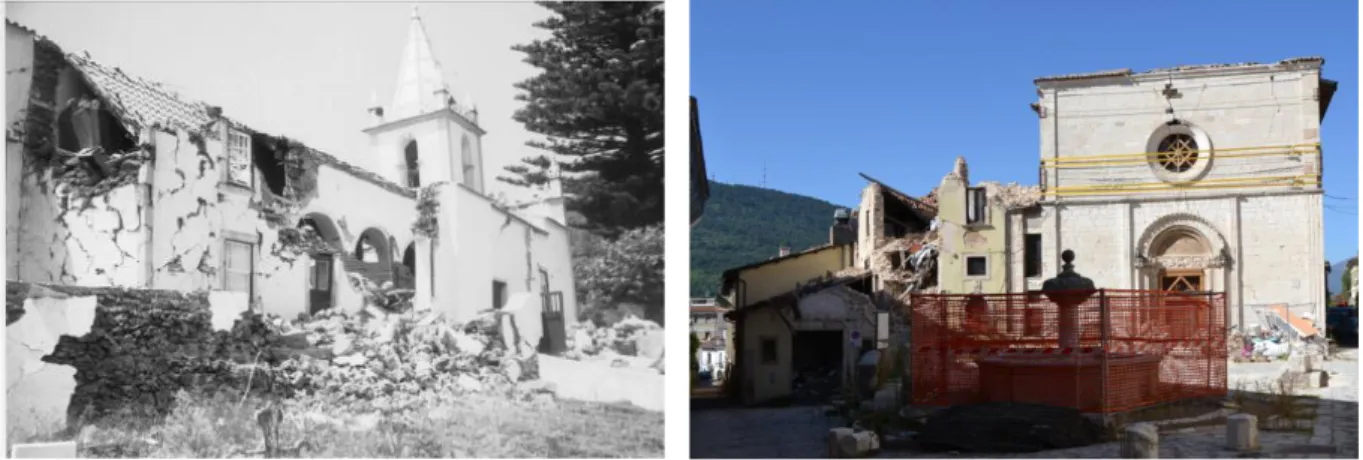
Among the building portfolio of a country, various earthquakes around the world have emphasized the high vulnerability of the monumental buildings, often the most heavily stricken by a seismic event. The uniqueness of each piece that is part of the cultural heritage, togheter with its historical, artistical, and societal values, does not allow applying the standardized procedures established for ordinary buildings. Within the invaluable buindings part of the cultural heritage of a nation, churches are of foundamental importance not only for historical and architectural reasons, but also for the symbolic significance they assume for the communities they belong to. For this reason, the analysis of their vulnerability has attracted strong interest after several major events throughout the world, when their worse performance compared to both ordinary and monumental buildings has highlighted their intrinsic structural vulnerability (Figure 1.1 and Figure 1.2). As the seismic vulnerability of a building is defined as its propensity to suffer certain damage when subjected to an earthquake, the aim of a seismic vulnerability assessment is to provide a measure of the tendency of a building to be damaged if hit by an earthquake, and operatively it consists in correlating the seismic hazard to the physical damage suffered.
Ribeirinha church, Faial Island, Azores (1998) (photo from Guerreiro et al. 2000)
Santi Marciano e Nicandro, L’Aquila, Italy (2006)
Basílica del Salvador, Santiago, Chile (2010) (photo from Sorrentino et al. 2011)
San Lorenzo a Flaviano, Amatrice, Italy (2016)
Figure 1.1. Examples of damage caused to churches by recent earthquakes.
a) b)
Figure 1.2. a) Cumulative damage ratio distribution for houses and churches (D’Ayala, 1999); b) Vulnerability curves of palaces and churches (Lagomarsino, 2006). Data of both graphs are referred to the 1997 Umbria-Marche earthquake.
Urban and territorial scale vulnerability assessment methods have been developed from the early 1970’s to the present time considering different approaches for the collection
and interpretation of data. These vulnerability assessment methods are classified as either empirical or analytical/mechanical. Empirical methods are based on selected parameters collected from in situ observation or expert judgement and are suited to identify the seismic vulnerability of a building stock. Analytical/mechanical methods are based on computational analysis defining a direct relationship amongst construction characteristics, structural response to seismic action, and damage effects. Obviously, the aforementioned approaches differ in computational burden and in the applicability at geographical scale: while the empirical methods are based on the collection of a small number of significant parameters and they are representative of the vulnerability of homogeneous typologies of buildings, the analytical methods require more specific information and are valid for a limited number of buildings. Both approaches are herein accounted in different proportion. Given the good amount of available information about the damage occurred to New Zealand churches during the 2010-2011 earthquake sequence and the extensive homogeneity of the buildings portfolio, an empirical approach is at first assumed for the analysis of New Zealand churches. According to such approach, observed vulnerabilities are based on statistical observations of recorded damage data as a function of the felt intensity, and the so-pursued seismic vulnerability assessment is spreadable at territorial scale. Large part of the vulnerability assessment of New Zealand unreinforced masonry churches herein conducted is based on such approach.
On the other hand, analytical methods tend to feature more detailed vulnerability assessment algorithms with direct physical meaning and they need experimental validation of the parameters used to define the vulnerability. As for historical churches, mechanical models have been widely adopted accounting for collapse mechanism analyses (refer, e.g., to Giovinazzi et al., 2006; Lagomarsino, 2006; Sorrentino et al., 2014a), based on acquired geometrical data. Less addressed, for the time being, is the issue related to the filter effect that the macro-elements of the building develop on the response of soaring elements. For this reason, a dynamic test campaign has been conducted on a number of representative New Zealand churches, whose results can provide information on modal parameters, and thus contribute to such estimation. A preliminary attempt in such direction is presented in the last part of this research.
1.1. Thesis format and chapter content
This manuscript is a “thesis by publications” wherein each chapter (plus seven Appendices) represents an article or combination of articles that have, at the time of thesis submission, been published, accepted, or submitted to a publisher for external peer review. Due to the “thesis by publications” format and the common motivations for the studies reported in the individual chapters, there is some unavoidable repetition of information throughout the manuscript. The following sub-sections include brief summaries of the studies pertaining to each chapter and references to the included publications. The referenced publications are typically journal or conference articles added to the thesis manuscript with slight changes to writing style and to in-text references made to other sections, figures, tables, or appendices within the thesis.
1.1.1. Chapter 2. An inventory of unreinforced masonry churches in New Zealand
An accurate documentation was undertaken in order to identify the New Zealand stock of unreinforced masonry churches, as a first step in understanding the relevance of the damage observed in the area affected by the Canterbury earthquakes and aimed to the subsequent implementation of effective conservation strategies. A country-wide inventory is then compiled based on bibliographic and archival investigation, and on a 10 000 km field trip, with estimated 297 unreinforced masonry churches currently present throughout New Zealand, excluding 12 churches already demolished in Christchurch because of heavy damage sustained during 2010-2011. The compiled database includes general information about the buildings, their architectural features and structural characteristics. Moreover, statistics about the occurrence of each feature are provided and preliminary interpretations of their role on seismic vulnerability are discussed.
Included publication:
Marotta, A., Goded, T., Giovinazzi, S., Lagomarsino, S., Liberatore, D., Sorrentino, L. and Ingham, J.M. (2015) An inventory of unreinforced masonry churches in New Zealand, Bulletin of the New Zealand Society for Earthquake Engineering 48(3), 170-189.
1.1.2. Chapter 3. Vulnerability assessment of unreinforced masonry churches following the 2010-2011 Canterbury earthquake sequence
Of 309 unreinforced masonry churches identified nationwide, including the 12 demolished in Christchurch, a sample of 80 buildings belonging to the affected region is studied and their performance analysed statistically. Structural behaviour of religious buildings is described in terms of mechanisms affecting the so-called macro-elements, being portions of the building behaving more or less independently. Discrete local damage levels are correlated with macroseismic shaking intensity through Damage Probability Matrices. Multiple-linear regressions are also considered, accounting for additional modifiers increasing/reducing the vulnerability of the macro-elements. Results show the relevance of the proposed multiple-linear regression models for the national heritage of churches and the advisability of extending mechanism-based regressions to other countries besides New Zealand.
Included publication:
Marotta, A., Sorrentino, L., Liberatore, D., and Ingham, J.M., 2016. Vulnerability assessment of unreinforced masonry churches following the 2010-2011 Canterbury
earthquake sequence, Journal of Earthquake Engineering.
DOI:10.1080/13632469.2016.1206761.
Marotta, A., Sorrentino, L., Liberatore, D., and Ingham, J.M., 2016. Statistical seismic vulnerability of New Zealand unreinforced masonry churches, in Proceedings of the 10th International Conference on Structural Analysis of Historical Constructions, 13-15 September, 2016, Leuven, Belgium, 1536 - 1543.
1.1.3. Chapter 4. Territorial seismic risk assessment of New Zealand unreinforced masonry churches
A quantitative seismic risk assessment for the existing unreinforced masonry churches in New Zealand is presented. Regression models correlating mean damage levels against ground-motion parameters are re-calibrated for all observed collapse mechanisms, accounting for different intensity measures. Due to the homogeneity of
New Zealand churches, the so-developed vulnerability models are extended to the whole national inventory. In order to summarise damage related to several mechanisms, different global damage indexes are accounted and an alternative synthetic damage index is proposed. The synthetic damage index has the advantage of not requiring a conventional estimation of the weights used in previous definitions of a global damage index and is entirely based on observed data. The computed damage indexes are then weighted on the foot-print area of each building and compared, and a risk level for unreinforced masonry churches is ascribed to the different New Zealand regions. Results can be used for the emergency management at regional scale in case of earthquake or for the identification of churches in need for more in-depth analysis in a preventive management of emergency.
Included publication:
Marotta, A., Sorrentino, L., Liberatore, D., and Ingham, J.M., 2017. Seismic risk assessment of New Zealand unreinforced masonry churches using statistical procedures, International Journal of Architectural Heritage. Accepted.
1.1.4. Chapter 5. Ambient vibration tests on New Zealand unreinforced masonry churches
Ambient vibration tests are carried out on a number of representative churches located in Auckland. Preliminary results from the dynamic tests are the base for future identification of the dynamic performance and construction weakness of different structural components, thus guiding the recognition of possible collapse mechanisms and estimating the filter effect that the building can develop on the response of soaring elements (e.g., gables, pinnacles).
Included publication:
Marotta, A., Beskhyroun, S., Sorrentino, L., Liberatore, D., and Ingham, J.M., 2017. Ambient vibration tests on New Zealand unreinforced masonry churches, Proceedings of the 10th International Conference on Structural Dynamics - Eurodyn 2017, 10-13 September, 2017, Rome, Italy. Abstract accepted.
Chapter 2
An inventory of unreinforced masonry
churches in New Zealand
After a bibliographic and archival investigation, and a 10 000 km field trip, it is estimated that currently 297 unreinforced masonry churches are present throughout New Zealand, excluding 12 churches demolished in Christchurch because of heavy damage sustained during the Canterbury earthquake sequence. The compiled database includes general information about the buildings, their architectural features and structural characteristics, and any architectural and structural transformations that have occurred in the past. Statistics about the occurrence of each feature are provided and preliminary interpretations of their role on seismic vulnerability are discussed. The list of identified churches is reported in Appendix A, supporting their identification and providing their address.
2.1. Introduction
Unreinforced masonry (URM) is one of the construction materials that was most frequently used in New Zealand’s early built heritage and URM churches represent a significant proportion of the heritage building stock of New Zealand. Churches, aside from having relevant historical and architectural value, often assume a symbolic significance for the communities that they belong to. The 2010-2011 Canterbury earthquakes had a dramatic impact on the community: 185 people died and many thousands were injured (Johnston et al., 2014), but also the extensive damage and collapse of churches deeply marked their communities, who placed a high value on
these heritage religious buildings, seen as an important part of the region's character and history (CEHBF, 2013). Therefore, the importance of preserving such buildings is a fundamental societal issue.
It is also widely known that URM churches frequently perform poorly even in moderate earthquakes, because of their intrinsic structural vulnerability (D'Ayala, 2000). URM churches are particularly vulnerable to earthquakes because of their open plan, large wall height-to-thickness and length-to-thickness ratios, and the use of thrusting horizontal structural elements for vaults and roofs. Their use of low strength materials often causes decay and damage due to poor maintenance, and the connections between the various structural components are often insufficient to resist loads generated during earthquakes (Ingham et al., 2012; Lagomarsino, 2012; Sorrentino et al., 2014). Additionally, damage is related to architectural types and construction details, which may vary from country to country. The 2010-2011 Canterbury earthquakes caused widespread damage to stone and clay-brick URM churches (Figure 2.1) (Leite et al., 2013). Hence, a research project was undertaken to identify the New Zealand stock of URM churches and to interpret the damage observed in the area affected by the Canterbury earthquakes (Cattari et al., 2015). An accurate documentation of architectural heritage is the first step in understanding the relevance of the damage observed and in the implementation of effective conservation strategies. Consequently, a national inventory of URM churches is presented, accounting for the geometry, construction details, building and transformation history, and the preservation state. In the following section the inventory collection procedure is presented, and in the third section an outline of the history of URM churches in New Zealand is provided based on bibliographic and field research undertaken as part of this study. An overview of the characteristics of churches, with reference to geographical distribution, types, architectural features, and structural characteristics is given in the fourth section. Possible applications of the results of this research are given in the final notes. Almost three hundred URM churches are listed in Appendix A for each region of New Zealand.
2.2. Inventory collection procedure
For the purpose of understanding the scale and nature of the seismic risk of existing URM churches in New Zealand it is useful to investigate their number and national distribution. In the absence of a complete list of churches present across the country,
several reference sources were utilised, leading to the identification of 297 URM churches currently existing in New Zealand (Figure 2.2). This total does not account for 12 churches demolished in Christchurch because of heavy damage suffered during the Canterbury earthquake sequence.
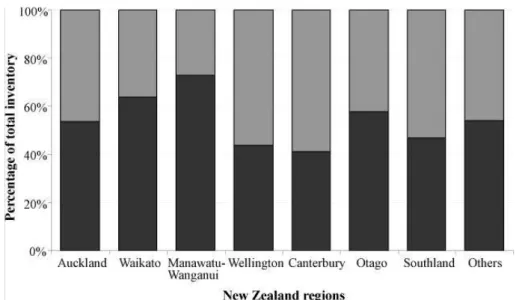
The first identification source considered was the Heritage New Zealand List (HNZ, 2014), formerly referred to as the Register. Approximately half of the identified churches are recorded therein (Figure 2.3). Some of the non-registered buildings were identified through the online inventories of the different religious denominations in New Zealand, archive documentation, architectural books (Warren, 1957; Fearnley, 1977; Anonymous, 1979a and 1979b; Wells and Ward, 1987; Kidd, 1991; Knight, 1993; Donovan, 2002; Wells, 2003) and reports. Such research led to acquiring knowledge of churches constructed of all types of structural materials. Hence, a subsequent filtering was performed by preliminary observation using Google Street View. Finally, additional churches were identified during the field survey along the 10 000 km itinerary that was planned based on the previously identified sites. This field survey aimed to acquire technical information for all URM churches, and to appropriately identify numerous non-registered buildings considered to be potentially significant examples of early New Zealand architecture. Despite the care and effort put into the definition of this inventory, the existence of other churches along routes not explored during the field trip cannot be excluded.
The inventory database is subdivided into geographical regions and the information is gathered into three groups: (i) general data; (ii) architectural features; and (iii) structural characteristics. Table 2.1 shows the parameters considered for each main data group.
(a) St Peter's Church (1875), Christchurch (b) St Joseph’s Church (1921), Christchurch
2.3. History of unreinforced masonry churches in New Zealand
As soon as settlers became established in New Zealand they started to build churches because of their strong Christian faith (Wells, 2003). The first churches were built mainly with timber, because of the ease of construction in terms of time and material availability (Tonks and Chapman, 2009). The architecture was in accordance with Early English style, familiar to both clergy and architects (Walden, 1961). Auckland and Wellington saw early examples of brick churches (respectively, St Paul’s in 1841 and Wesley Chapel in 1844, the latter destroyed by the 1848 Marlborough earthquake (Mw 7.5)), both plastered to give an appearance of stone (Dowsett, 1985).
However, stone and clay-brick masonry buildings started being used largely from around 1880, when clay became readily available and prosperity increased. The 1931 Hawke’s Bay earthquake (Mw 7.8) demonstrated the poor performance of URM and marked the beginning of the decline in use of URM (Dowrick, 1998; Reitherman, 2006). After the destruction caused by the Hawke’s Bay earthquake, the New Zealand Standards Institute was formed to regulate building practice, and URM constructions were prohibited in 1965 (NZSI, 1965; Dowrick, 1998; Goodwin, 2009). After this ban, the use of reinforced concrete became predominant. However, the bibliographic and field research undertaken as part of this study has shown that reinforced-concrete construction was applied starting as early as the first quarter of the 20th century, either alone or together with masonry (e.g., reinforced-concrete frame + clay-brick infill, or reinforced masonry).
The period of construction has been determined for 86% of the masonry churches in the inventory, and in Figure 2.4 the churches of known construction date are grouped according to decade of construction. The majority of this building stock was established between the 1870s and 1931 (84%), with a few cases (13%) built between 1931 and 1965. The trend in age shows that most of the construction activity occurred between 1910 and 1940, with a peak around 1930. The age statistic confirms that New Zealand ecclesiastic masonry-construction heritage was built over a short time span, compared to other countries worldwide.
In New Zealand the majority of religious buildings are Christian churches. The religious history of the country after the arrival of the Europeans was characterised by significant missionary activity. The Anglican Church of England brought Christianity to New Zealand through the Church Missionary Society, while Presbyterianism and
Catholicism were respectively and largely brought by Scottish and French settlers (Davidson, 2004). Methodism arrived slightly later and the Baptist Church, which had grown rapidly in early 19th century in England, established its first congregations in New Zealand in about 1850 (Hearn, 2012). Later missionaries brought other religious denominations. With reference to the building inventory the four largest denominations are Anglican, Presbyterian, Catholic and Methodist (Figure 2.5a) and their churches can be found in all parts of the country. A much more limited number of buildings are, in decreasing order: Union parishes (grouping of Anglican, Presbyterian, Methodist and Congregationalist), Baptist, Congregationalist, Jewish, and Reformed.
Some of the ecclesiastic buildings are no longer used as was originally intended and are currently utilised for other functions, ranging from civic facilities to private usages. Both original and changed-use churches were included in the inventory. Figure 2.5b shows the proportion of URM buildings still used as originally intended (91%). The remainder of the inventory is made of buildings that have their use changed (7%), that are not in use (1%), or whose use could not be determined at the time of the survey (1%).
Table 2.1. Parameters considered in the inventory of New Zealand URM churches.
General Data
Name
Religious denomination
Location (region, city, suburb, street, #) Former and current use
Construction date and architect HNZ registered number Phone contact and web-links
Architectural Features
Typological classification Overall dimensions
Position (isolated or connected to other structures) Plan and elevation regularity
Alterations / additions
Structural characteristics
Masonry type and quality
Wall texture and wall cross-section morphology Type of roof
Presence of thrusting structures (e.g., arches, vaults, domes, roofs without bottom chord) Additional vulnerability factors (e.g., soaring elements, large openings, heavy roof covers) Additional strengthening factors (e.g., buttresses, tie-rods)
Figure 2.2. Distribution of URM churches in New Zealand.
Figure 2.4. Percentage of URM churches according to construction period (for available date of construction).
(a) Religious denomination (b) Current use
Figure 2.5. URM church denomination and use.
2.4. Churches characteristics
2.4.1. Geographical distribution
For the purpose of understanding the history of URM churches in New Zealand it is useful to consider their distribution nationally. Almost 70% of the inventory is concentrated in the South Island, with a prevalence of churches located in the Otago (30%) and Canterbury regions (29%), as shown in Figure 2.6.
The comparatively low proportion of buildings in the Auckland region (14%), despite the region having always been the most populated of New Zealand (STATS, 2013), can be explained because of the larger use of timber in construction. There are at least two
explanations for this fact. First, stone was less readily available in the area, whereas Kauri trees were common, especially on the Coromandel Peninsula and in northern areas (Orwin, 2012). Consequently most early constructions, including churches, were made with timber. For example, St Mary’s in Parnell, Auckland, was originally designed in brick and stone masonry, but due to budget limitations was instead built in timber (Tonks and Chapman, 2009). Second, at the time of the 1848 Marlborough and 1855 Wairarapa (Mw 8.2) earthquakes, it was observed that masonry buildings were susceptible to destruction while wooden buildings appeared more able to withstand such forces (Schrader, 2013). In some cases, even wind induced damage in masonry churches. For example, St. Stephen’s Chapel in Parnell, Auckland, was originally constructed in stone in 1844, but after being destroyed by a hurricane three years later was replaced in 1857 by the current timber building (Tonks and Chapman, 2009). Hence, timber ecclesiastic buildings became predominant in Auckland and acquired such a specific style as to be dubbed ‘Selwyn churches’, after the nation’s first Anglican Bishop (1841-1867) George Augustus Selwyn (Sedcole and Crookes, 1930; Knight, 1972). Wooden churches, sometimes intended as temporary buildings, are in general still standing today and in good condition (Tonks and Chapman, 2009). This resilience was also proved by the Canterbury earthquakes, during which timber churches had the best overall performance, with no cases of structural damage (Leite et al., 2013). However, over time there was a change in building practice after several severe fires affected timber structures, and because masonry construction conveyed a sense of permanency, which was deemed to be a fundamental attribute for any church establishment in a new colony (Walden, 1964; Dowsett, 1985).
The Hawke’s Bay region has a fairly low (1%) number of URM buildings, although many major churches were located in and around Napier up till 1931. In that year the Mw 7.8 Hawke’s Bay earthquake and subsequent fire caused extensive damage and induced reconstruction with materials other than URM. The same reasoning can reliably be proposed for the Tasman, Nelson, and Marlborough regions, and for the upper portion of the West Coast region (combined 5%), which were strongly stricken by the 1929 Arthur’s Pass (Mw 7.1) and 1929 Murchison (Mw 7.8) earthquakes (McSaveney, 2012). Similarly, it is worth mentioning that the upper portion of the Canterbury region has almost no URM churches.
Figure 2.6. Estimated provincial percentage of existing URM churches.
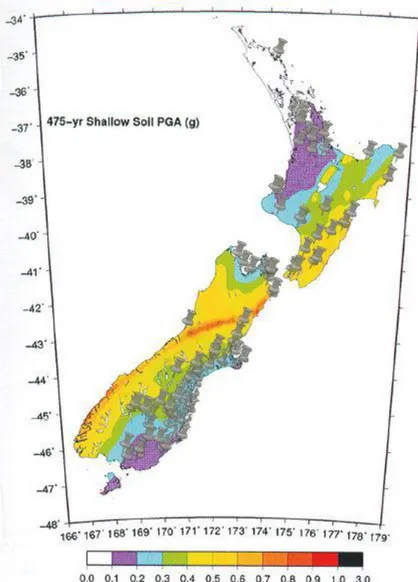
The geographical distribution of URM churches was compared with the seismic hazard map of New Zealand, considering expected peak ground accelerations (PGAs) for a 475-year-return-period earthquake for shallow soils (Figure 2.7) (Stirling et al., 2012). The comparison was further explored by computation of the seismic hazard factor, Z, defined by New Zealand Standards (NZS 1170.5, 2004), where the hazard factor has been derived as 0.5 times the magnitude-weighted 5% damped response spectrum acceleration for 0.5 s period for site class C (shallow soils) with a return period of 500 years. This factor is determined through the Initial Evaluation Procedure (IEP) spreadsheet provided by the New Zealand Society for Earthquake Engineering (NZSEEG 2013). For church locations not listed in the IEP spreadsheet (about 20%), interpolation of the hazard factor was used. 27% of the inventory is located in zones with a hazard factor of 0.21 ≤ Z ≤ 0.30, 10% in zones of 0.31 ≤ Z ≤ 0.40 (Figure 2.8). A total of 13% of the inventory is located in high hazard areas, with a hazard factor greater than 0.30, being the current Z factor for Christchurch (raised from 0.22 by the Department of Building and Housing in May 2011 (McVerry et al., 2012)). This outcome confirms the relationship between the geographical distribution of currently existing URM churches and the seismic history of the country, and suggests that those churches located in the highest hazard zones should be investigated and possibly strengthened ahead of the remainder.
2.4.2. Typological classification
Within the characterisation of URM buildings, a very important classification is that concerning the overall building configuration. The seismic performance of a URM structure strongly depends on its general size and shape. Accordingly, a typological classification based on the plan and spatial features is developed, grouping structures
that may display a similar seismic behaviour. Six types are identified within the New Zealand URM church stock, as outlined in Figure 2.9 and Table 2.2. Photographic examples are given in Figure 2.10. The graph in Figure 2.11 shows the frequency of the types for the entire stock. Note that the majority of churches (58%) are part of the A type, underlining the simplicity of the architecture of New Zealand churches. The At
type includes the presence of the transept and reaches 21%, such that the combined percentage of A and At types covers almost 80% of the analysed stock. Within the A
type there is a group of small buildings, often officially denominated as chapels, that can be considered as votive churches, originally erected by wealthy families for devotion reasons or for celebrating a deceased. Generally, those churches are not part of a town centre, but are located in the countryside.
Figure 2.7. Distribution of URM churches compared with the New Zealand national seismic hazard model (Stirling et al., 2012).
Figure 2.8. Percentage of URM churches according to hazard factor (Z).
Figure 2.9. Typological classification of URM churches in New Zealand.
Table 2.2. Summary of typological classification of URM churches.
Type Plan No. of naves Nave cover
A Longitudinal 1 Roof At* Longitudinal 1 Roof
B Longitudinal 3 Roof/Vaults C Central 1 Roof D** Central/ Longitudinal 1 Soffit E*** Longitudinal 3 or more Roof/Vaults
*At: one nave with transept;
**D: large hall without internal walls, with “box type” behaviour and exteriors as a building; ***E: Basilica, similar to B but much larger.
(a) St Andrew (1938), Maheno - A type (b) All Saints' Church (1865), Dunedin - At type
(c) St Matthew's Church (1874), Dunedin - B type (d) Trinity Church (now Fortune Theatre) (1869), Dunedin - C type
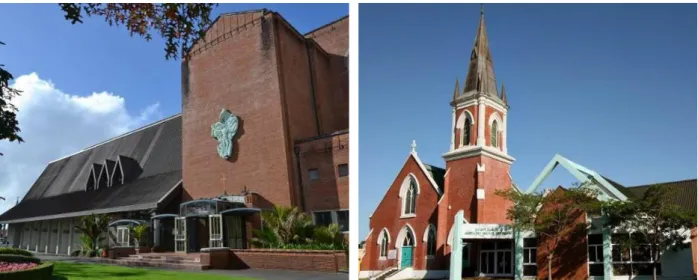
(e) Sacred Heart Cathedral (1899), Wellington - D type
(f) St Matthew in the City (1905), Auckland - E type
Figure 2.10. Examples of types of URM churches, based on plan and spatial configuration.
Figure 2.11. Recurring types of URM churches.
2.4.3. Architectural features
New Zealand URM churches tend to have similar characteristics, in terms of both architectural features and construction details. This similarity occurs because most of the structures were built over a relatively short time span, and were often designed by the same architects.
Focusing on the architectural characteristics of the churches, it has already been observed that the religious heritage is mainly represented by longitudinal plan churches, with a long nave eventually crossed by a transept (technical terminology is explained in Figure 2.12). The body of the building is arranged in naves. The main nave is at times flanked by lower aisles, and rows of piers or columns separate them. The main nave can end with a circular or polygonal apse.
Churches were first analysed according to their overall dimensions, noting geometric irregularities in plan and elevation (e.g., whether they are isolated or attached/connected to other buildings). The foot-print area data was sorted into five value ranges: 31% have an area ranging from 50 to 200 m2, being mostly chapels and countryside churches, and 53% have an area ranging from 201 to 500 m2 (Figure 2.13).
For churches where it was possible to identify the wall thickness, the mean ratio between the peak height (hf) of the façade and its thickness (tf) is 23.8, with a coefficient of variation equal to 7.8 (Figure 2.14a). In addition to the vertical slenderness, the horizontal slenderness was computed, with the average ratio between the length (lf) and the thickness of the façade being 24.3, whereas the coefficient of variation is equal to 8.5 (Figure 2.14b). In the same way the ratio between the height (hw) of the longitudinal walls and their thickness (tw) was investigated (mean value and coefficient of variation
equal to 12.3 and 4.3, Figure 2.14c), as well as the ratio between their length (lw) and thickness (mean value and coefficient of variation equal to 58.2 and 24.3, Figure 2.14d). These ratios can guide a preliminary vulnerability assessment, especially for those cases that show extreme values. Moreover, it would be interesting to compare New Zealand ratios with those from churches in other countries of both high and low seismic hazards, because existing data are limited and mostly restricted to ordinary buildings (Sorrentino 2014).
The presence of a porch/nartex (55%) is fairly widespread, being the church entrance. The porch/nartex is usually located facing the façade and opposite the church altar (37%), but sometimes is located on a side of the building, close to the corner of the façade (18%) (Figure 2.15).
A presbytery (refer to Figure 2.12) is also generally present (46%), while the apse is rarer (20%) and frequently polygonal (17%) rather than circular (3%). The apse is mainly present in three-nave churches and Basilicas.
Plan and elevation symmetry and regularity were also recorded. It can be observed that nearly 20% of churches are symmetrical and regular in both plan and elevation (Figure 2.16). Cases of asymmetry are often due to extensions in plan that occurred during the life of the building, or the presence of adjacent buildings and/or raised structural elements (Figure 2.17).
Figure 2.13. Approximate foot-print area.
(a) Peak height/thickness ratio of the façade (b) Length/thickness ratio of the façade
(c) Height/thickness ratio of longitudinal walls (d) Length/thickness ratio of longitudinal walls
(a) St Johns (1922), Auckland - Porch facing the
façade (b) St Patrick Basilica (1894), Oamaru - Nartex
(c) St Oswald's Church (1914), Westmere - Porch on a side
Figure 2.15. Examples of porch/nartex.
(a) Holy Trinity (1898), Auckland - Extension in plan
(b) Wesley Broadway Methodist Church (1911), Palmerston North - Presence of adjacent buildings
and raised element
Figure 2.17. Example of geometric irregularities in plan and elevation and position with respect to other buildings.
Raised elements can be domes and bell-towers, although the former is rarely present, and was found in only two churches of the inventory. Bell-towers are observed in 34% of the inventory, are always connected to the nave and can be the cause of vulnerability due to their different dynamic properties. In the majority of cases the bell-tower is flanked to the façade or along the longitudinal walls (80%), although sometimes it is included in the façade (20%) as seen in Figure 2.18. In 66% of cases bell-towers present buttresses and 53% have large openings up their height.
Chapels are present in 43% of the inventory, often not spread along the whole nave wall, and sometimes in an asymmetrical position with respect to the plan configuration (33%).
Sometimes the change from original use (refer to Figure 2.5b) caused alterations to the structure and/or configuration (Figure 2.19). These modifications could contribute to improve or worsen the earthquake performance of the building, e.g., depending on the addition of connections or the removal of structural elements and the increase of mass.
(a) St Mary's (1888), Pleasant Point - Bell tower included in the façade
(b) Sacred Heart (1926), Ranfurly - Bell tower flanked to the façade
(c) St Peter's (1932), Queenstown - Bell tower along the longitudinal walls
Figure 2.18. Examples of bell-tower included in the façade, flanked to the façade or along the longitudinal walls.
(a) Moray Place Congregational Church (1864), Dunedin - Residential apartments
(b) Hanover Street Baptist Church (1912), Dunedin - Bar
2.4.4. Structural characteristics
As shown in Figure 2.20, 55% of the inventory is constructed of clay-brick URM (Figure 2.21a) and 39% is constructed of natural-stone URM (Figure 2.21b). In 3% of cases, building stones were limited to facings, basement walls, and the main façade, probably because stone was more expensive than clay brick. For the remainder of the inventory the presence of plaster hampered a positive identification of the masonry type, although the date of construction indicates a traditional building technique and response to simple percussion excludes the use of timber.
Figure 2.20. Masonry types of existing URM churches.
(a) St. Paul’s church (1916), Auckland - Clay brick
(b) Caversham Church (1883), Dunedin - Natural stone
The construction types were connected to local geology, with almost all stone URM buildings in New Zealand being constructed in areas where the material was available nearby from local quarries, fields and rivers (e.g., the volcanic rocks of Auckland, New Plymouth, Christchurch, Timaru and Dunedin, the limestone in Oamaru, and the schist in central Otago) (Nathan and Hayward, 2012). The natural-stone buildings are mostly concentrated in the South Island, in Canterbury and Otago regions (Figure 2.22), characterised by metamorphic rocks (such as schist, Figure 2.23a) and sedimentary rocks (such as limestone, Figure 2.23b), respectively. Igneous rocks are widely distributed throughout the country with a prevalence of basalt (Figure 2.23c) (Giaretton et al., 2013).
As already widely known, the quality of construction materials plays a key role in the response of URM buildings. Wall construction quality appears to have improved over the years, with early churches sometimes constructed using roughly shaped stone blocks with gaps filled with poor mortar. In Christchurch, in the aftermath of the Canterbury earthquakes, different levels of stone and mortar quality were detected in structures (Dizhur et al., 2011) and it was confirmed that the use of undressed stone units, in conjunction with low-strength lime mortar, often led to poor earthquake response (Figure 2.24).
Mortar is typically lime based, sometimes with a low compressive strength. In a few cases, modern cement mortar has been used to repoint existing masonry joints.
(a) St John's Church (1895), Middlemarch - Schist (b) St Martin's Church (1901), Duntroon - Limestone
(c) St Paul's Church (1895), Auckland - Basalt
Figure 2.23. Examples of stone types in New Zealand.
In the investigation of the wall cross-sections, 61% of the inventory (that was possible to survey) is made of single-material solid walls, while 39% of identifiable cases can be sorted into the following types showing:
a cavity wall (presenting a continuous air gap separating wythes from one another), with either clay-brick (Figure 2.25a) or natural-stone (Figure 2.25b) leaves;
a two-layer wall, with a stone external facing and one or two clay-brick leaves (Figure 2.25c).
Field observations have shown a rather high seismic vulnerability of non-solid walls, which are prone to failure of one or more leaves. Nonetheless, solid walls can also display inadequate performance, when the wythes are not properly connected and undressed units are used.
Unlike other countries, in New Zealand the nave cover is rarely a URM vault. Considering only those churches where a survey of the interior was possible, stone vaults are present in 7% of the cases, being just two type B and five type E churches. A sloping roof, visible from the nave, is registered in 77% of the subset of the churches surveyed internally (Figure 2.26a). In the remainder of cases the roof is concealed by a ceiling. In Britain and its colonies, trussed roofs started to be adopted in the 17th century and were developed up to the 19th century, initially hidden above the ceiling and later revealed as a visible feature of the buildings (Yeomans, 1992). As shown in Figure 2.27, there are four main statical schemes of sloping roofs in New Zealand:
1. king-post trusses (28% of visible roofs), with a bottom chord in just one case and a raised tie in the remainder 24 cases (Figure 2.28a);
2. queen-post trusses (4%), with one metal bottom tie, one bottom chord, and two raised ties (Figure 2.28b);
3. an elegant elaboration of timber truss consisting of a scissors roof (23%), with or without a raised tie (19% vs. 81%) (Figure 2.28c);
4. a rafter roof (19%), with a timber arch below the rafters in 83% of cases, and with or without a horizontal top beam, also dubbed collar (66% vs. 34%) (Figure 2.28d). Roofs without a chord at support level develop a thrust that can worsen earthquake performance of the building (Sorrentino et al., 2008). The remaining 9% of the visible sloping roofs are partially hidden by a ceiling that prevents an assured classification (Figure 2.28e). As shown in Figure 2.26b the roof support is a corbel stone (60%), a timber beam (33%), or a reinforced-concrete beam (7%).
The occurrence of additional structural details, such as soaring elements, large openings and heavy roof covers, which might increase the vulnerability of the building, was also investigated. Soaring elements are recurrently present in New Zealand churches and in 62% of cases a pinnacle, a parapet-belfry, or a crenellation was encountered (Figure 2.29). Large openings on the longitudinal walls and rose windows on the façade are respectively present in 21% and 61% of cases. A heavy roof cover (e.g., thin stones) is present in 36% of the inventory.
St Cuthbert's Church (1860), Governors Bay
Figure 2.24. Example of bad masonry quality.
(a) St Joseph’s Church (1921), Christchurch – Clay-brick cavity wall
(b) Trinity Congregational Church (1873), Christchurch – Natural-stone cavity wall
(c) St Peter's Church (1875), Christchurch (Photo courtesy of Joao Leite) - Two-layer wall
(a) Nave cover (b) Type of roof support
Figure 2.26. Type of nave cover and roof support (related to the sub-inventory for an accessible interior).
Figure 2.27. Statical schemes of New Zealand sloping roofs.
Different strengthening elements have been surveyed in the churches, with URM lateral buttresses observed in 82% of cases, whereas façade buttresses are present in 26% of the inventory. Tie rods are more rare, being used to eliminate the thrust of the roof in 24% of the surveyed cases (Figure 2.30a), or laid transversally and/or longitudinally in 18% of the sample (Figure 2.30b). Ring beams were detected in just two cases, but elsewhere they may be concealed by plaster or masonry facing.
A good state of preservation was encountered for 54% of the surveyed buildings in the inventory. However, the few churches not in use show some lack of maintenance in plaster and roof, and 27% show a limited number of small cracks or no more than two larger cracks induced by soil settlement and lack of connections (17 churches in Auckland, 10 in Dunedin, 5 in Wellington). Some churches (5%) show more relevant problems, presenting more than two large cracks, but the overall condition is still acceptable. Another 14% fall within Christchurch and have been damaged by the 2010-2011 Canterbury earthquakes.
St Gerard's Church (1908), Wellington - King-post truss
(b) St Joseph and St Joachim (1926), Auckland - Queen-post truss
Sacred Heart (1918), Takaka - Scissors roof (d) All Saints (1913), Palmerston North - Rafters roof
(e) St Andrew’s Church (1914), Auckland - Roof partially hidden by ceiling
(a) Garin Memorial Chapel (Wakapuaka Cemetery) (1890), Nelson - Parapet-belfry (on the
left side)
(b) St Joseph’s (1879), Temuka - Pinnacles
Figure 2.29. Examples of soaring elements.
(a) St Luke's (1908), Wellington - Tie rods in the roof
(b) St Magnus (1897), Duntroon - Tie rods connecting walls
Figure 2.30. Examples of presence of tie rods.
2.5. Conclusions
The 2010-2011 Canterbury earthquakes have again demonstrated the unsatisfactory earthquake performance of unstrengthened URM churches, with approximately 15% of the affected buildings demolished due to the heavy damage suffered. Due to the high seismicity of New Zealand, the large concentration of people that may occur in religious buildings, and the societal relevance of these structures for historical and symbolical reasons, assessment and mitigation of the earthquake vulnerability of URM churches are of paramount importance. Despite such prominence, a comprehensive list of New
detailed inventory of URM churches throughout New Zealand was compiled, with a total of 297 buildings being located, excluding 12 buildings that were demolished after the Canterbury earthquakes. It is possible that additional churches are located across the country, along routes not explored during the 10 000 km field trip.
The analysis of the collected data led to the following considerations on the URM religious heritage buildings in existence in New Zealand:
The buildings were constructed mainly between 1870 and 1940 and now approximately half of the entire inventory is registered with HNZ.
The main religious denominations are: Anglican (33%), Presbyterian (23%), Catholic (20%) and Methodist (12%). Approximately ninety percent of churches are still used for their original function.
The existing stock is concentrated in the Otago (30%), Canterbury (29%) and Auckland (14%) regions.
A limited number of unreinforced masonry churches (13%) are located in high seismic hazard zones (Z hazard factor greater than 0.30).
New Zealand churches usually have a simple layout when compared to European standards. 58% of the sampled buildings have a single nave, and in 21% of cases a transept is added to the nave. The most frequent gross foot-print area is larger than 200 m2 and smaller than 500 m2. Most of the buildings are not regular in plan or in elevation, due to the presence of added parts and connected bell-towers.
In more than half of the inventory clay-brick masonry is used, while natural stone is slightly less common. Lime mortars are typically used. Masonry quality can vary significantly throughout New Zealand and it appears that the quality of construction improved over time. Cross-sections frequently show multiple leaves that are inadequately connected or even separated by cavities.
The roof is usually sloping and has a raised tie in most cases, instead of a bottom chord. This detail can increase the vulnerability of the building due to exerted thrust. Vaults are rather seldom. In contrast, soaring elements (such as pinnacles, parapet-belfries and crenellations) are frequent.
Buttresses are very frequent in New Zealand churches. In contrast, strengthening details such as tie rods are present in less than 20% of the cases. This absence of securing may be the result of the application of British construction practices, with a low awareness of detailing to safeguard against earthquakes.