Abstract
This paper is focused on the vehicle dynamics caused by the forces exchanged, through buffers and draw gears, by consecutive vehicles on a curve. The results have been obtained by adding a buffers/draw gears contact model on an existing multibody code, previously developed by the authors. The multibody code manages rigid bodies connected by elastic and rigid constraints; the wheel/rail contact model is three dimensional and employs an elastic constraint among wheel and rail. The wheel/rail contact is managed by means of a numerical model called TOAM (third order approximation method). Numerical tests and experimental validations of the proposed model are here presented, considering a train made by three vehicles, running on an S shaped curve, subjected to parametric compressive forces.
Keywords: train dynamics, wheel rail contact, buffers contact, longitudinal forces, derailment, train simulator.
1 Introduction
Safety and efficiency of train transportation are more and more requested by the railway operators. In order to provide a reliable and flexible tool to study the dynamics of a train and to reduce the expensive experimental tests, a new numerical model have been proposed by the author [1-3].
In those previous papers, an original multibody software, capable to manage the dynamics of any number of rigid bodies (each one with six degrees of freedom -dofs-) coupled by elastic or rigid joints, has been developed. Moreover, the developed code considers a three-dimensional contact between the surfaces of wheel and rail, by considering also an elastic interaction among them.
The further development that has been introduced in this paper is the adding of a new module, which integrates the buffers contact in the multibody code; by this way, the multibody dynamics of three consecutive vehicles, subjected to
Paper 25
The Train Dynamics of Wheel Rail Contact and
Longitudinal Lateral Interaction between Vehicles
L. Cantone, D. Negretti and V. Vullo
Department of Mechanical Engineering
University of Rome “Tor Vergata”, Italy
©Civil-Comp Press, 2011
Proceedings of the Thirteenth International Conference on Civil, Structural and Environmental Engineering Computing, B.H.V. Topping and Y. Tsompanakis, (Editors),
longitudinal compressive forces (LCF), are investigated by computing the contact forces exchanged by the buffer heads of adjacent vehicles, running on a 3D track. Not only the normal contact forces but also the friction forces between the buffer heads are considered in the proposed model; the latter forces grow up due to the relative movements of wagons, during the running on a curve.
As proved by experimental pushing tests performed by Railways Operators (DB, SNCF) [4], the normal force on the buffer heads, due to LCF between consecutive vehicles, and also the friction coefficient between the buffer heads influence significantly the derailment risk. The above experimental tests refer to a series of vehicles where the first performs a braking and the last a traction, in order to impose a constant compressive longitudinal forces on the test wagon running on an S shaped curve.
In the paper, the main mathematical models are shortly described. Then a comparison between simulated and experimental data is shown. Lastly the effects of some operational parameters, such as the buffers gap and the friction coefficient between the buffer heads, on running safety, are investigated.
2 The numerical models
2.1 The TOAM wheel rail contact model
In order to accurately reproduce the wheel-rail interaction forces, an on-line three-dimensional contact model has been developed [1-3]; such model will be afterwards mentioned by using the acronyms TOAM (third order approximation method). General profiles of wheel and rail can be managed by the model and they can be defined from the user by input points; a mathematical definition of the profile is performed by employing the minimum number of third order polynomial functions that fit the input points with a tolerance defined by the user. The wheel and rail profiles used in the simulations proposed in this paper are respectively ORE 1002 and UIC 60 defined in [5, 6]. These profiles are defined by 284 points for the wheel and 190 for the rail; the tolerance used to fit these points is 0.001 mm, obtaining, respectively, 9 third order polynomial functions for the rail and 16 for the wheel.
The evaluation of contact points is based on the DIFF method [7-9], which has been modified, by introducing a numerical approximation of the wheel surface, in order to improve the time efficiency of contact points detection, by a forward analytical development of the mathematical model. This approximation does not influence significantly the accuracy of the contact point detection as described in [1]; particularly, a good accuracy is obtained (with an error on the conicity angle below 5 %, respect to commercial software), if the maximum relative angles between the surfaces of wheel and rail are enclose in the common domain for railway operations (experimentally they are lower than 20 mrad for the attack angle and 33 mrad for the roll angle, as it can be inferred by [4]) .
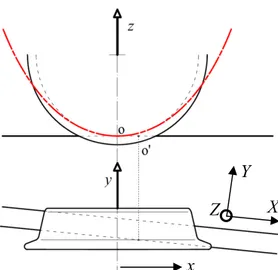
The previously mentioned approximation of the wheel surface consists in developing the wheel profile along a parabolic function that approximates the wheel circle in the lower point, as described in Figure 1.
Figure 1: Wheel and rail reference system and wheel surface approximation. Here, the track and the wheelset reference systems are indicated, respectively, by {X,Y,Z} and {x,y,z}. The Z axis is perpendicular to the track plane, the X axis is oriented as the rail extrusion and the Y axis is obtained by means of the right hand convention. The second reference system {x,y,z} is located at the wheelset mass center, the y axis is parallel to the wheelset axle, the x axis is parallel to the track plane (X,Y) and the z axis is obtained according to a right-hand reference system. By employing the DIFF method, the contact points are detected, by looking for the lower points of the difference function, defined as the mathematical difference along the Z axis of the wheel and rail surfaces, as described in the Equation ( 1 ); where
Σw and Σr are, respectively, the wheel and rail surfaces.
(
)
Σw X Y, Σ ( )r Y
= −
D ( 1 )
According to the DIFF method, the contact points detection requires to find the minimum points of a two variable function. In order to reduce the computational effort, a further mathematical development is carried out, by introducing another necessary but no sufficient condition for the contact points detection. This condition imposes that the contact points must be located in a region of wheel surface where the derivative, computed along the direction of rail extrusion in the wheelset reference system, is null; such further condition provides a mathematical relation between X(y) and Y(y). Equation ( 1 ) can be rewritten in the Equation ( 2 ) and the contact points can be detected, by finding the minimum of a one variable equation; by this way the computational efficiency is improved and the on-line implementation is managed more easily.
( )
Σw y Σ ( )r y
= −
D ( 2 )
By knowing the position and the geometrical parameters at the contact points, the normal elastic contact forces are computed by using the Hertz theory [10]; moreover, the friction forces are computed by using the Polach friction model [11, 12].
X Y
x Z
2.2
In thro mu cor at Tra mo dim the con pla geo mo gea are buf and com spe2 The bu
order to c ough their ultibody cod This new m rresponding the Univer ansport of odel is now The geome mensional c e buffer he nsidered; bu ane. The forces ometry of b oreover, the ars defined e obtained b ffers and dr d in Figure 3 Figure 2: From the mpute the b The buffer ecified in UIuffers con
consider th buffers, a n de [3]. module has g previous m rsdity of Ro Italy and a adapted and try of conta ontact but a eights over ut only the exchanged buffers, in e experimen by the use by employi raw gear, ta 3. Buffer cha force-displa uffers and d head geom IC Leaflet 5ntact mod
he interactio new modul been deve model emplo ome Tor V afterwards d implemen act between as a planar r the track effect of n d by consec terms of th ntal load-un er are emplo ing the exp aken by [4] racteristic. acement ch draw gears f metry here c 527-1, pointel
on forces e le has been eloped by th oyed in Tra Vergata wit certified by nted in the m n the buffer h contact; in k plane be normal and utive vehic heir positio nload elasti oyed. The n perimental l Appendix F haracteristic forces acco considered t 1.4. exchanged n added to t he Authors inDy [13], w th the finan y the UIC multibody co heads is not fact, in this etween con d friction focles are eva n on the v c character numerical r load-unload 14 and 15, Figure 3: Dr cs defined rding to the has a curv by consec the previou , in order t which has b ncial suppo [14]. The ode. t still evalua s study the nsecutive v orces parall aluated by c vehicle and ristic of buf results, show d elastic cha and display
raw gear cha
above, it e model repo vature radiu cutive vehic usly mentio to improve been develo ort of Faive buffer con ated as a thr offset betw ehicles is el to the tr considering of head ra ffers and d wn afterwa aracteristics yed in Figur aracteristic. is possible orted in [13 us of 1.5 m cles oned the oped eley ntact ree-ween not rack the adii; draw ards, s of re 2 e to 3]. , as
3 The vehicle dynamics in pushing tests
3.1 Test data
In order to analyse the effects of the forces exchanged by buffers and draw gears, on vehicle dynamics, some pushing tests proposed in [4] are reproduced by means of the developed multibody code and the additional module introduced in the above paragraph. In particular, the effects of longitudinal compressing forces (LCF), of the gap and of the friction coefficient between the buffer heads are considered.
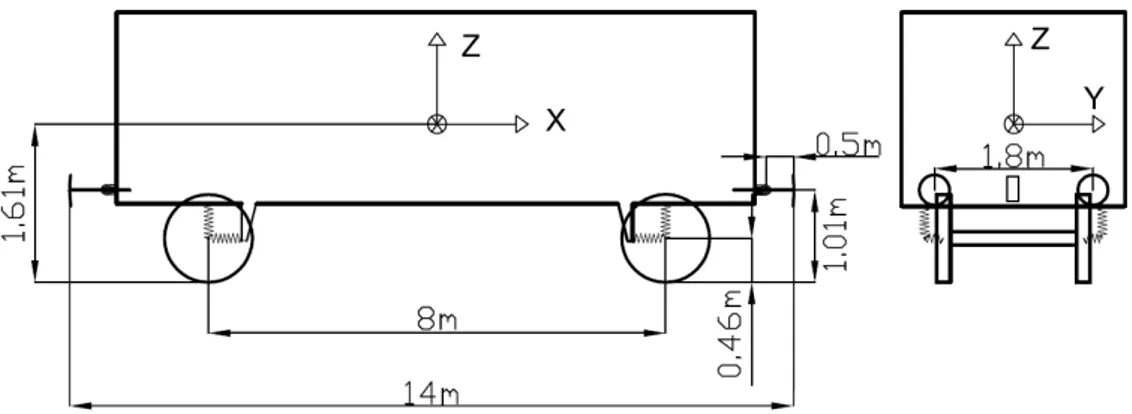
The simulated vehicle is a SNCF Gbs 254; the main geometrical characteristics of this vehicle, defined in [4] Appendix 4.1, are reported in Figure 4.
Figure 4: Gbs 254 wagon geometry.
The mass and inertia characteristics of the vehicle are reported in Table 1; moreover the elastic characteristics of the suspension are reported in Table 2.
Mass [kg] Ixx [kg·m2] Iyy [kg·m2] Izz [kg·m2]
Car body 13300 32000 420000 413000
Wheelset 1490 988 90 988
Table 1: Mass and inertia characteristics of the simulated wagon. X Y Z
K [N/m] 12·106 1.4·106 970·103 C [N·s2/m] 12·104 1.8·105 640·103
Table 2: Primary suspension characteristics.
The track gauge considered in the simulations is 1435 mm; the wheel and rail profiles used are, respectively, the ORE S1002 and the UIC 60.
In the experimental tests reported in [4], nine consecutive vehicles are employed; the monitored test wagon is placed in the middle of the train. In order to impose a
fixed value of longitudinal forces, the first vehicle performs a braking whereas the last vehicle, a locomotive, performs a controlled traction. The vehicles adjacent to the test wagon are a Tds on the front and an Rs wagon on the rear; these wagons are loaded whereas the test wagon is unloaded, in order to reduce the wheel lifting risk of the non-tested wagons. In the experimental tests, with the train placed on a straight track, the draw gears between the tested wagon and each one of the adjacent wagons were drawn, until the buffers were put in contact.
In order to reduce the computational effort and the complexity of the problem, only three equal consecutive vehicles are simulated. The central vehicle is the test vehicle and the adjacent vehicles are loaded with 30 tons, in order to avoid the wheel lifting. The external buffers of the adjacent vehicles are loaded with longitudinal forces along the X axis of the car body (see Figure 4); by this way the compression of the train is imposed.
The track layout considered in the test is a 150 m track curve, with reverse curve and intermediate straight section, as it is specified in UIC Leaflet 527-1; this track layout is considered, according to the Railways Operators, as the most demanding from the point of view of running safety under a longitudinal compressive force.
The running speed used for the simulation is 30 km/h. Moreover, the experimental tests taken in account consider lubricated buffer heads; for this reason, a friction coefficient of 0.1 is considered in the numerical tests.
3.2 Tests results
In this paragraph, the numerical results are compared against experimental data; such data refer to a series of experimental tests carried on a family of wagons with characteristics similar to those reported above. In particular, in [4], several experimental tests are carried out considering similar two-axle vehicles in order to infer general safety rules. The differences, among the vehicles of this family, concern the stiffness of the primary suspensions, the stiffness of the axle journal, the torsional stiffness of the wagon and wheel base distance (some wagons have this parameters set to 9 m, instead the simulated wagon has a wheel base distance equal to 8 m). The other parameters, such as the wagon length (over buffers), the mass, the wheelset geometry and the buffers and draw gears elastic characteristics are the same for all the wagons of the family considered and are the same with respect to the simulated vehicle.
In order to define the operational limits, some criterions are taken into account as in [4]: the most limiting criterions for these tests are the “Distortion of journal axle” and the “Lateral displacement of the track”.
According to [4], the “Distortion of journal axle” criterion prescribes that the distortion of the axle journal measured 380 mm below the lower flange of the sole-bar must not exceed 25 mm; it corresponds to the limit of elastic deformation given in [4].
The “Lateral displacement of the track” criterion prescribes that the maximum lateral force applied to the track is function of the static axle load “P” (in kN); for reinforced track the value can be computed by the Equation ( 3 ), according to [4].
exp in a In and The crit coe buf eac con of exp by com the goo Fi By adm also of exp The “Y/Q” perimental o a critical co Figure 5, th d applied to e lateral for terion, abov efficient bet ffer heads. T ch point re nsidering on the origin perimental t the develop ming from t e simulated od accuracy gure 5: Max using the missible lon o experime experiment perimental o (H ” criterion or simulate ondition. he maximum o the track a rceFy is c2m ve mention tween buffe The experim epresents t nly the 95% nal test dis tests perform ped multibo the same fa counterpar y the experim ximum later above me ngitudinal f ntal data. T tal tests car or simulated 2 ) 25 lim m H = + does not re d tests, i.e. m lateral fo as function computed a ned. The co er heads of mental data the mean % of data cl stribution). med employ ody code, w amily of wa rt, it is evid mental beha
ral force (ov entioned cr forces for a These value rried on th d, the “Dist 0.6 P 6 + C = each the pr according orceFy , c2m of the LCF as an averag ontinuous l f 0.1; this v are indicate value of a ose to the o The circl ying a test whereas the agons. By c dent that the
aviour. ver 2m) app riterions, it a given wag s are summ he wagon G tortion of th 64 [kN ] rescribed li to this crite computed by F, is reporte ge on 2 m, a line is obta value is assu ed by mean a series of overall mea e describes wagon iden triangles ar omparing th e model pro plied to the is possibl gon, by me marized in T Gbs 254 are he journal ax imit (Y/Q = erion, the v y the develo ed, with a co according to ained by us umed valid ns of a circle f nominally an (i.e. disca s the resu ntical to the re the exper he experime oposed repr track as fun le to find eans of the Table 3, wh e reported. xle” criterio ( = 1.2), in vehicle is ne oped simula ontinuous l o the prescri sing a frict d for lubrica e and triang y equal te arding the t ults of sev e one simula rimental res ental data w roduces wit nction of LC the maxim simulated here, the res In each c on that lead 3 ) any ever ator ine. ibed tion ated gles: ests, tails eral ated sults with th a CF. mum and sults ase, ds in
this dis exp and (se Ta Fig fun bet par effe wa sho mm s case to placement perimental a d 61 kN, lo e Equation Later able 3: Com gure 6: Max Figure 6 sh nction of LC tween the rameter is n fect of the g agons have b ows the resu m. In this fig a limit va of the tra and simulat ower than th ( 3 )). Longitudin ral force on mparison of the “Distor ximum valu bu hows the evo CF and of t buffer hea not used to gap. The co been drawn ults when th gure it is cle alue of 25 ack” criteri ted lateral f he limiting nal forces [k the track F experiment rtion of the ue of Y/Q2m r uffer heads olution of th the gap bet ds of 0.1 evaluate th ontinuous l
until the bu he wagon ar ear that with
mm, has on. When forces on th value of 64 kN] 2m Fy [kN]
tal and simu axle journa reached as f with lubric he Y/Q2m, c tween buffe (lubricated he safety li ine is comp uffers were re drawn un h a longitud been reac the first he track
(
Fy 4 kN define Experime 165 55 ulated safety al” criterion function of ated surface computed w ers, conside d buffers). imits, but in puted consi put in conta ntil the buff dinal compr ched before criterion is)
2m Fy are, re ed by the se ental Simu 1 6 y limits, wh is reached. the LCF an es. with an aver ering a frict In this cas n order to idering 0 m act, instead fer heads ha ressive forc e the “Lat s reached, espectively, econd criter ulated 170 60 en the limit nd gap betw rage on 2 m tion coefficse, the Y/Q investigate mm of gap, the dotted ave a gap of e less than eral the , 55 rion t of een m, as ient Q2m the the line f 40 150
kN exp this the val the con buf rep dra buf gap alre Fig The app It i sig Fy fric N, the gap r plained by c s Figure 7, e draw gear lues of gap. ere are ten
nsecutive w ffers arise. T ported force aw gear tens ffers compr p disappear eady shown gure 7: Max e effect of plied, can b s clear that nificant inc 2m y force c ction coeffic reduces the considering the maxim s are shown When ther nsile forces wagons, imp
The gap red es are highly sion is redu ression beco rs (see the n in Figure 6 ximum buff the imp gap and fri be investigat an increme crement of an be redu cient. Y/Q2m par the Figure mum forces ( n, as functio re is no LCF s at draw posed by th duces such y affected b uced, due to ome simila behaviour 6. fer compres posed LCF a iction coeff ted by mean ent of the fr the lateral uced by usi rameter. Su 7, showing (averaged o on of the ex F, due to the gears, cau he curve, a forces, as s by vehicle d o the track ar to the app of the cur sion forces and gap bet ficient betw ns of the pa riction coeff force appli ing a gap b uch value o g the effect o on 2 m) act xternally im e “bending” used by th and therefo shown by F dynamic. B curve, henc plied LCF rves above and draw g tween buffe ween buffer arameter Fy fficient betw ed to the tr between bu of 150 kN of gap betw ting on the mposed LCF ” of the train he relative ore compres igure 7; in y increasin ce the maxi and the ad 150 kN), a gear traction r heads. heads, whe 2m y , as show ween buffer rack; also in uffers espec can be furt ween buffers buffers and F, for differ n on the cur angle am ssive forces both cases, g the LCF, mum forces dvantage of as it has b n in function en no LCF wn in Figur heads bring n this case cially for h ther s; in d on rent rve, ong s at the the s of the been n of are e 8. gs a the high
w the lon inc dyn hig
4
Thi con sim wh is m rep ana bet Sim ext cur imp hea Figure 8: M without LCF The benefic e same test ngitudinal co creases the L namics. In ghly excitedConcl
is paper sh nsecutive ve mulations ar here each bo managed thr Experiment produced in alyses on th tween the bu mulation re ternally imp rve. These posing a ga ads consider Maximum la F imposed, a cial effect o t condition ompressive LCF during the test ca d due to thelusions
hows the e ehicles by m re carried o ody is chara ree dimensi tal pushing n order to he effects of uffer heads. esults show posed LCF forces inc ap between rably increa ateral force as function b of the gap, d n of the te e force on a g a typical b ases reporte constant LC effects on v means of bu out by using acterized by ionally by m tests on an verify the f buffers op . w that buf due to the crease the n the bufferase the max
exchanged of the gap a buffer heads described ab est propose a curve. As braking man ed here, the CF imposed vehicle dyn uffers and d g a multibo y 6 degree o means of the n “S” curve model pro perational pa ffers comp draw gears Y/Q2m or F r heads. Mo imum latera
with the tra and friction s. bove can be d, i.e. veh a matter of noeuvre, du e train long d. namics of t draw gears, ody code d of freedom e contact mo e, concernin oposed and arameters, a ression for s tension, w 2m Fy and oreover, th al forces ap ack (averag n coefficient e considered hicle pushe f fact, the p ue to the tra gitudinal dy the forces on a S shap eveloped b and the wh odel TOAM ng two axl d to perform as the gap a rces occur when the wa they can b e friction b plied to the ed on 2 m), t between th d valid only d by cons presence of ain longitud ynamics is exchanged ped curve. T y the Auth eel rail con M.
e vehicles, m prelimin and the frict also with agons are o be reduced between bu e track. , he y for tant gap dinal not by The hors, ntact are nary tion hout on a by uffer
References
[1] D. Negretti, “A third order approximation method for three-dimensional wheel rail contact”, Vehicle System Dynamics, 2011. (accepted)
[2] L. Cantone, D. Negretti, V. Vullo “Sviluppo e validazione di un modello semi-analitico del terz’ordine per l’analisi del contatto ruota rotaia”, SEF 2011, Roma, Italy, 18 February, 2011.
[3] L. Cantone, D. Negretti, V. Vullo “Analisi del contatto ruota rotaia mediante un’approssimazione del terzo ordine”, AIAS 2010, Maratea, Italy, 7-10 September, 2010.
[4] ORE Question B 12, Report No. 40, “Propelling tests with long two-axle wagons”, UTRECHT, April 1984.
[5] S. Iwnick, “Manchester Benchmarks for Rail Vehicle Simulation”, Vehicle System Dynamics, 30/3-4, 295 - 313, 1998.
[6] S. Iwnick, “The Manchester Benchmarks for Rail Vehicle Simulation”, Taylor & Francis, ISSN 0042-4114
[7] J. Auciello, S. Falomi, M. Malvezzi, E. Meli, and P. Toni, Determination of wheel/rail contact points in the simulation of a railway vehicle dynamics. Springer Science+Business Media B.V., 2008.
[8] S. Falomi, M. Malvezzi, E. Meli, and M. Rinchi, Multibody modeling of railway vehicles: innovative algorithms for the detection of wheel-rail contact points. 2009, 8th International Conference on Contact Mechanics and Wear of Rail/Wheel Systems (CM2009), Firenze, Italy.
[9] A. A. Shabana, K. E. Zaazaa, and H. Suguyama, Railroad Vehicle Dynamics A computational approach. CRC Press, Taylor & Francis Group, New York, 2007.
[10] S. Timoshenko and J. N. Goodier, Theory of Elasticity. McGraw-Hill Book Company, New York, 1951.
[11] O. Polach, A fast wheel-rail forces calculation computer code. Vehicle System Dynamic Supplement, 33, 1999, 728-739.
[12] O. Polach, Influence of Locomotive Tractive Effort on the Forces Between Wheel and Rail. Vehicle System Dynamic Supplement, 35, 2001, 7-22.
[13] L. Cantone, D. Negretti, “Modellazione dinamica disaccoppiata dei respingenti ferroviari”, AIAS 2009 9-11 Settembre Torino, 2009.
[14] L. Cantone, “TrainDy: the new Union Internationale des Chemins de Fer software for freight train interoperability”, Proc. IMechE, Part F: J. Rail and Rapid Transit, 2011, 225 (F1), 57-70. DOI 10.1243/09544097JRRT347.