ANALYSING THE IMPACT OF RENEWABLE ENERGY REGULATION ON RETAIL
ELECTRICITY PRICES
Pablo del Rio, Pere Mir-Artigues, Elisa Trujillo-Baute
IEB Working Paper 2016/19
IEB Working Paper 2016/19
ANALYSING THE IMPACT OF RENEWABLE ENERGY REGULATION ON RETAIL ELECTRICITY PRICES
Pablo del Rio, Pere Mir-Artigues, Elisa Trujillo-Baute
The Barcelona Institute of Economics (IEB) is a research centre at the University of Barcelona (UB) which specializes in the field of applied economics. The IEB is a foundation funded by the following institutions: Applus, Abertis, Ajuntament de Barcelona, Diputació de Barcelona, Gas Natural, La Caixa and Universitat de Barcelona.
Within the IEB framework, the Chair of Energy Sustainability promotes research into the production, supply and use of the energy needed to maintain social welfare and development, placing special emphasis on economic, environmental and social aspects. There are three main research areas of interest within the program: energy sustainability, competition and consumers, and energy firms. The energy sustainability research area covers topics as energy efficiency, CO2 capture and storage, R+D in energy, green certificate markets, smart grids and meters, green energy and biofuels. The competition and consumers area is oriented to research on wholesale markets, retail markets, regulation, competition and consumers. The research area on energy firms is devoted to the analysis of business strategies, social and corporative responsibility, and industrial organization. Disseminating research outputs to a broad audience is an important objective of the program, whose results must be relevant both at national and international level.
The Chair of Energy Sustainability of the University of Barcelona-IEB is funded by the following enterprises ACS, CEPSA, CLH, Enagas, Endesa, FCC Energia, HC Energia, Gas Natural Fenosa, and Repsol) through FUNSEAM (Foundation for Energy and Environmental Sustainability).
Postal Address:
Chair in Energy Sustainability Institut d’Economia de Barcelona Facultat d’Economia i Empresa Universitat de Barcelona C/John M Keynes, 1-11 (08034) Barcelona, Spain Tel.: + 34 93 403 46 46 [email protected] http://www.ieb.ub.edu
The IEB working papers represent ongoing research that is circulated to encourage discussion and has not undergone a peer review process. Any opinions expressed here are those of the author(s) and not those of IEB.
IEB Working Paper 2016/19
ANALYSING THE IMPACT OF RENEWABLE ENERGY REGULATION ON RETAIL ELECTRICITY PRICES
Pablo del Rio, Pere Mir-Artigues, Elisa Trujillo-Baute
ABSTRACT: Retail electricity prices have substantially increased in the last decade in the European Union (EU) as a result of different regulations, raising the concern of policy makers. The growth in the support costs for electricity from renewable energy sources (RES-E) has often been singled out as a main driver of these prices. The aim of this paper is to analyse the degree of influence of RES-E promotion costs on the evolution of the retail price of electricity in the EU Member States. The analysis is carried out for households as well as for industry, with the help of a panel data econometric model. Our results show that the impact of renewable energy promotion costs on the retail electricity prices is positive and statistically significant, although relatively small. Differences across consumer types can be observed. An increase of 1% in those costs induces an average increase of only 0.023% in industrial retail prices and 0.008% in the residential retail prices. This impact on retail prices is mediated by the type of support scheme being adopted, with price-based support instruments showing a greater effect than quantity-based ones.
JEL Codes: L11, Q41, C24
Keywords: Electricity prices, renewable energy, public support.
Pablo del Rio, IPP-CSIC
Pere Mir-Artigues,
UdL & Energy Sustainability Research Group (UB)
Elisa Trujillo-Baute,
University of Warwick & Barcelona Institute of Economics, Chair of Energy Sustainability
1. Introduction.
A combination of targets and policies in the climate and energy policy realm has been adopted in the European Union (EU) for both 2020 and 2030. The 2020 package sets three key targets: a 20% cut in greenhouse gas emissions (GHG) (from 1990 levels), 20% of EU energy from renewable energy sources (RES) and a 20% improvement in energy efficiency. For 2030, these targets include a 40% cut in greenhouse gas emissions compared to 1990 levels, a 27% share of renewable energy consumption and 27% energy savings compared to the business-as-usual scenario. In this context, the EU and its Member States (MS) have been and are committed to the deployment of electricity from renewable energy sources (RES-E). In recent years, the share of electricity generation from renewables in the EU has quickly grown from around 14.8% in 2005 to 25.4% in 2013 (Eurostat 2015), largely due to rapid increases in wind and solar investments. Arguably, the targets in the RES-E Directive for 2010 and the RES Directive for 2020 as well as MS promotion schemes for RES-E deployment have leveraged significant growth in renewables.
On the other hand, the large and recent increase of RES-E penetration in the EU has raised the concern of EU and MS policy makers about the costs of RES-E promotion, which has increased considerably in the last years, particularly for wind energy and solar PV. Total wind energy support costs increased almost three-fold between 2009 and 2013 (from 4883 M€ to 12447M€) and solar PV increased almost four-fold (from 5855 M€ to 23128 M€) (Ortega and del Río 2016, based on data from the Council of European Energy Regulators, CEER). The costs of RES-E support are passed to electricity consumers in their bills and they are often regarded as a main driver of the increase of retail electricity prices, triggering an EU-wide discussion on the need to limit those costs. On the one hand, governments in EU MS have implemented cost-containment measures, i.e., design elements which have reduced the overall costs of support in existing RES-E support schemes (Mir-Artigues and del Río 2014, del Río and Mir-Artigues 2014). On the other hand, the European Commission has stressed the need to have cost-effective and market-based instruments, suggesting that the predominant RES-E support instrument (feed-in tariffs (FITs)) have been too expensive and not suitable to integrate an increasing volume of RES-E in electricity markets (European Commission 2013, 2014a, 2014b).
The concern about higher retail electricity prices which have been triggered by RES-E support costs is related to the relevance of electricity as an input factor in the production and consumption decisions of households and firms in all production sectors. The impact of energy regulations on the electricity prices may result in less money being available in the pockets of households’ breadwinners for other consumption alternatives. This consumer surplus loss is obviously negative for the welfare of households. On the other hand, the negative impact of higher electricity prices on the competitiveness of firms is currently a major source of concern in the EU Member States, where the importance of a strong economy and industry is often stressed (European Commission 2015).
Despite the relevance of the issue, research on the relative impact of the different components of the retail electricity prices (whether regulatory or non-regulatory ones) and, particularly, on the comparative effect of RES-E support with respect to other components, has been rather scarce (see next section for a literature review). To the best of our knowledge, the few contributions have generally focused on a single country and some of them are rather descriptive. Furthermore, the use of econometric models as a methodological tool to identify the relation between the relevant variables has been virtually absent. The aim of this paper is to cover this gap in the literature. An empirical analysis of the degree of influence of RES-E support costs on the retail price of electricity (for households as well as for industry) in 22 EU countries is provided. Accordingly, this paper is structured as follows. The next section provides the analytical framework as well as the links to the existing literature. Section 3 discusses the methodology. The results of the empirical analysis are provided in section 4. Section 5 concludes.
2. Analytical framework and links to the existing literature.
The analysis of the impact of RES-E support on retail electricity prices can be placed in the context of the regulatory analysis of the electricity sector. Among the various economic activities, electricity is characterised for being one of the most highly regulated sectors. Indeed, the regulatory changes affecting the electricity sector have been especially intense in the EU in the last two decades and have had an enormous impact on the structure of the sector and its business agents, as well as on the
functioning of the electricity market itself.
Evaluating the economic impact of the regulations of the electricity sector and the changes in these regulations is a complex task. The assessment and measurement of the impact of the reform processes and regulatory changes have been analysed in the relevant literature with different approaches, including a macroeconomic approach focusing on the analysis of regulatory policies and their impact within the framework of general equilibrium theory (Chisari et al., 1999) and a quantitative evaluation of a country’s regulatory framework. We follow the so-called performance-metrics approach in this paper, which has been widely used in academic studies for evaluating the impact of regulatory changes based on the results obtained in terms of pricing, investment, accessibility, service quality or the evolution in greenhouse gases emissions, among others (Cubbin and Stern, 2006; Pollitt, 2009).
Several regulatory variables can be considered as key drivers of retail electricity prices, including the promotion costs related to RES-E support, network costs, taxes and levies. Therefore, although the focus of this paper is on the first one, the others are taken into account in the econometric analysis as control variables.
There is an abundant literature on the analysis of the impact of higher levels of RES-E generation (usually triggered by RES-E support schemes) on electricity prices. The literature on the so-called merit-order effect has focused on the impact of such generation on wholesale electricity prices, leading to the general conclusion that it results in a reduction on those prices (see Sáenz de Miera et al 2008, Gelabert et al 2015, Wurzburg et al 2013, Senssus et al 2008, Fischer 2009, among many others). Since RES-E generation is generally supported with an add-on on the wholesale price paid by electricity consumers in their bills, the issue is whether the lower wholesale price is partially or totally offset by the RES-E support, leading to an increase or reduction in the retail prices. The literature has been inconclusive in this regard, with some contributions showing an increase in retail prices (EIA 2003, Traber and Kemfert 2009) and others a reduction (Tellus Institute 2002, UCS 2004, Sáenz de Miera et al 2008, Rathmann 2007). Assumptions about the slopes of the supply of renewable and non-renewable energy play a crucial role in explaining the different results across studies (Fischer 2009).
However, this paper adopts a different approach. The analysis focuses on the relative influence of RES-E support on retail prices with respect to other components of those prices. Therefore, the literature reviewed has focused on the impact of the costs of RES-E promotion, taxes, levies and network costs on retail electricity prices. Several sources of information have been consulted, including the most relevant energy journals (Energy Economics, Electricity Journal, Energy Policy, Energy Journal, Energy, Applied Energy and Environmental Economics and Energy Policy), and publications from relevant institutions (the European Commission, CEER, ACER). Furthermore, a general google search has been carried out. Key words have been introduced in the internal search engine for the journals and in google (retail prices, regulated costs, network costs, distribution costs, transmission costs, RES policy support costs). Detailed results of the review are provided in Annex I.
The review leads to the general conclusion that the comparative influence of the different components of the retail price and, in particular, RES-E support, has received scant attention in the literature. The paper contributes to the existing literature on several fronts. Our analysis considers several relevant regulatory and non-regulatory drivers of retail electricity prices. The time and geographical coverage is relatively wide (22 of the 28 EU Member States over the 2007-2013 period). The empirical application is based on the estimation of an econometric model with panel data, in contrast to the descriptive approaches and the approach based on electricity market models used in part of the literature. Finally, the impact of different types of RES-E support schemes on those prices is analysed.
The focus on RES-E support in this paper is justified given the relevance attached in policy and academic circles to this component as a main driver of retail prices (see, e.g., CEER 2011, 2013, 2015, European Commission 2013, 2014a, 2014b, 2015, Frondel et al 2010).
In the EU, RES-E support has been provided with several primary instruments. The term “primary” refers to instruments which are the basis (the main economic incentive) for RES-E support in a specific country (del Río and Mir-Artigues 2014). In general, four main categories of primary support schemes have been applied in the EU MS (see del Río and Mir-Artigues 2014, Held et al 2014). They can be broadly classified into price-based and quantity-based instruments:
Price-based support schemes:
Feed-in tariffs (FITs) guarantee a fixed price per kWh of electricity. Feed-in premiums (FIPs) are paid on top of the market price of
electricity.
Quantity-based support schemes:
Quotas with tradable green certificates (TGCs). Under this scheme, certificates are issued for every MWh of RES-E, allowing generators to obtain additional revenue to the sale of electricity. Demand for TGCs originates from an obligation on electricity distributors to surrender a number of TGCs as a share of their annual consumption (quota).
In auctions, developers compete for supply contracts to build RES-E capacity. They have recently been combined with FITs and FIPs in the EU, being used to set the remuneration level under these instruments (AURES project 2016).
Those primary instruments have been complemented with other “secondary instruments”, which include tax exemptions (TE), investment incentives (II), financial incentives (FI) and net metering (NM). In contrast to the primary instruments, which generally cover all RES-E installations and are set at the national level, secondary instruments are usually limited in scope and circumscribed to specific types of projects (e.g., small ones) and technologies (e.g., solar PV). Secondary ones are applied at both the national and lower government levels, that is, regional/provincial/municipal (del Río and Mir-Artigues 2014).
Regarding the primary instruments, RES support in the EU has mostly been based on FITs (table 1). FIPs and quotas with TGCs have been used to a much lesser extent and auctions have virtually been non-existent until very recently. It should be mentioned that those support schemes have experienced small changes in the first part of the period (2007-2010), mostly related to adaptations in existing schemes, e.g., modifications of design elements (see Held et al 2014). However, significant changes can be observed in more recent times (i.e., since 2011), mostly away from FITs and towards FIPSs and auctioning schemes (AURES project 2016). This is probably related to the concern of MS governments on the low “market compatibility” and the relatively high total support costs of FITs and the fact that after the EU Commission Guidelines on Energy and Environmental Protection Aid 2014-2020, as auctions for RES will be implemented in
the EU from 2017 onwards. Several countries have recently implemented cost-containment mechanisms in price-based support schemes (FITs and FIPs), such as flexible degression and capacity and generation caps.
Table 1. Instruments for RES-E deployment support in the EU (2013).
Primary instruments Secondary instruments
MS Hydro Wind Bio PV Geo Hydro Wind Bio PV Geo
AT FIT FIT FIT(1); II(2) FIT
BE QO QO QO QO QO TE; II(3) TE; II (3) TE; II(3) TE;II(4) TE
BG FIT FIT FIT FIT; TN(5) FIT FI(6) FI(6) FI(6) FI(6) FI(6)
CY FIT FIT FIT II II II
CZ FIT/FIP FIT/FIP(7) FIT/FIP FIT/FIP(8) II, FI
DE FIT/FIP FIT/FIP FIT/FIP FIT/FIP FIT/FIP FI FI FI FI FI
DK FIP FIP(9); TN(10) FIP FIP FIP II(11) II(11); FI II(11) II(11);
NM; TE II(11)
EE FIP FIP FIP FIP FIP TE II; TE TE TE TE
EL FIT FIT FIT FIT FIT II; TE II; TE II; TE II; TE II; TE
ES FIT/FIP(12) FIT/FIP(12) FIT/FIP(12) FIT/FIP(12) FIT/FIP(12) TE TE TE TE TE
FI FIP FIP II II II II II
FR FIT FITTN(14)(13); FIT FIT
(15);
TN(16) FIT II II II II II
HR
HU FIT FIT FIT FIT FIT II II II II II
IE FIT FIT FIT FIT FIT TE TE TE TE TE
IT FIT(17); FIP(18); QO; TN(20) FIT(17); FIP(18); QO; TN(20) FIT(17); FIP(18); QO; TN(20) FIT(17); NM(19); QO; TN(20) FIT(17); FIP(18); QO; TN(20) TE TE TE TE TE
LT FITFIT/TN(21); (22) FIT
(21);
FIT/TN(22) FIT
(21);
FIT/TN(22) FIT
(21);
FIT/TN(22) II, FI II, FI II, FI II, FI II, FI
LU FIT FIT FIT FIT FIT II II II II II
LV FIT FIT FIT FIT FIT II; TE II; TE II; TE II; TE II; TE
MT FIT II(23); FI II(23);
FI; TE
NL FIP FIP FIP FIPNM(24)(25); FIP FI FI(26) FI FI;II FI
PL QO QO QO QO QO FI; II; TE FI; II; TE FI; II; TE FI; II; TE FI; II; TE
PT FIT; TN FIT; TN FIT; TN FIT; TN FIT; TN TE TE TE TE TE
RO QO QO QO QO QO II II II II II
SE QO QO QO QO QO TE; II(27) TE II
SI FIT; FIP FIT; FIP FIT; FIP FIT; FIP FIT; FIP II; FI II; FI II; FI II; FI II; FI
SK FIP FIP FIP FIP FIP II, TE II, TE II, TE II, TE II, TE
UK QO; FIT(28) QO; FIT(28) QO; FIT(28) QO; FIT(28) QO; FIT(28) TE TE TE TE TE
(1): Solar PV >5kW; (2): Solar PV ≤5kW; (3): Only in Brussels; (4): Only in Flanders; (5): Solar PV>100kW; (6): Only small scale projects; (7): Wind >20MW excluded; (8): Solar PV >30kW; (9): Wind Onshore; (10): Wind Offshore; (11): Small scale installations; (12): Existing plants before January, 2012; (13): Wind Onshore; (14): Wind Offshore; (15): Solar PV <100kW; (16): Solar PV >100kW;(17): Existing plants <1MW; (18): Existing plants >1MW and <1MW which do not choose the FIT; (19): Solar PV <20kW. It is alternative to FIT; (20): New plants – large projects; (21): <10kW; (22): >10kW; (23): Small scale projects <3.7kW; (24): Solar PV >15kW; (25): Solar PV <15kW; (26): Wind Offshore excluded; (27): Wind Offshore; (28): <5MW.
FIT: Feed-in Tariff; FIP: Feed-in Premium; QO: Quota Obligations; TN: Tenders; II: Investment Incentive; FI: Financial
Incentive; TE: Tax Exemption; NM: Net Metering.
Source: CEER (2015), Mir-Artigues and del Río (2014) and European Commission (2015).
Although the functioning of support schemes has been the focus of much research (see Mitchell et al 2011, Held et al 2014 for reviews), mostly taking into account the effectiveness and efficiency criteria, as well as their effects on the wholesale electricity price (the so-called merit order effect, see e.g. Sáenz de Miera et al 2008, Cludius et al
2014), the impact of those schemes on the retail electricity prices has not received a comparable attention.
3. Methods. 3.1. The model
This section discusses the econometric method which is used to assess the impact of RES-E regulation on the retail price of electricity for both industrial consumers and households. Eq. (1) represents the reduced form of the price econometric model:
𝑃𝐸𝑖𝑡 = 𝛼0+ 𝛼1𝑃𝐸𝑖𝑡−1+ 𝛼2𝑅𝑒𝑔𝑖𝑡 + 𝛼3′𝑋𝑖𝑡′ + 𝜀1𝑖𝑡 (1)
Where the different variables refer to:
PEit Retail electricity price (dependent variable).
PEit-1: Lagged retail electricity price
Regit: Electricity regulation
X’it: Set of variables which allow us to control for all other observable factors that affect the price
𝜀1𝑖𝑡: Random error
The sub-indices i and t refer to countries and years, respectively.
The electricity prices are affected by several regulations, not only RPCs, and by other factors. All these variables are included as control variables since they are all expected to influence the evolution of retail prices.
Regarding the regulatory variables, network costs and taxes and levies are included in our model. Network costs are defined as the ratio between the revenue related to transmission and distribution tariffs and the corresponding volume per consumption band. If complementary services like transmission and distribution losses, after-sale services, system service costs and meter rental are identified separately, then they are allocated to the network costs as an aggregated measure. Finally, taxes and levies are an additional, well-known component of electricity retail prices. They include the value added tax, excise taxes, nuclear decommissioning, support for vulnerable consumers, energy efficiency support, island system compensation, tariff deficit annuities, stranded costs and compensation fees, research funding, security of supply surcharges,
concession fees, offshore grid connection surcharges, coal decommissioning and pension funds, among others (Eurelectric, 2014). Therefore, it is crucial to include this component as an additional control variable, which is expected to positively affect retail prices.
In addition, the following non-regulatory variables are included in the specification and estimation of the model:
- Energy-only costs. A main component of final electricity prices, in addition to regulated costs, is the cost of electricity as such, i.e., the wholesale price of electricity in the intraday market plus adjustments. This variable, as calculated by Eurostat, also includes the retail margin. We can expect that, the higher the energy-only costs, the higher the prices of electricity will be.
- Electricity consumption. The evolution of electricity prices depends on the interaction between supply and demand in each country. Following a hedonic specification of prices to analyse the influencing factors, the different country characteristics are collected in the parameters of the estimated coefficient in this model. Given that the quantity captures the size of the market, the sign of the estimated coefficient should be negative.
-Lagged electricity prices. This has been included as an additional variable in the model in order to capture and control for the dynamic component of the behaviour of prices.
Thus, the econometric specification of the equation (1), which will be estimated for both household and industrial consumers, can be expressed as follows:
𝑙𝑜𝑔𝑃𝐸𝑖𝑡 = 𝛼0+ 𝛼1𝑙𝑜𝑔𝑃𝐸𝑖𝑡−1+ 𝛼2𝑙𝑜𝑔𝑅𝑃𝐶𝑖𝑡+ 𝛼3𝑙𝑜𝑔𝑁𝐶𝑖𝑡+ 𝛼4𝑙𝑜𝑔𝐸𝐶𝑖𝑡 (2)
+𝛼5𝑙𝑜𝑔𝑇𝐿𝑖𝑡 + 𝛼6𝑙𝑜𝑔𝐸𝑐𝑜𝑛𝑠𝑖𝑡+ 𝛼7𝑇𝑡+ 𝜀1𝑖𝑡
Where:
𝑃𝐸𝑖𝑡−1: lagged dependent variable
𝑅𝑃𝐶𝑖𝑡: renewable energy promotion costs
𝑁𝐶𝑖𝑡: network costs
𝐸𝐶𝑖𝑡: energy-only costs,
𝑇𝐿𝑖𝑡: taxes and levies,
𝐸𝑐𝑜𝑛𝑠𝑖𝑡: electricity consumption 𝑇𝑡: linear trend
The analysis is performed by discriminating according to the typology of consumers, given their different nature and power demand profile. Special attention is given to prices for households and industrial electricity consumers (DC and IC bands according to Eurostat classification, respectively), which are the most representative consumer bands. Thus, the above equation is estimated for, both, household and industrial electricity consumers in order to grasp the possible differential relevance of the determinants on those two types of consumers.
The estimation method has taken the dynamic panel nature of the model into account (22 countries over the period 2007-2013). This is the period when RPCs experienced the greatest increase in several MS. The Ordinary Least Square (OLS) method would lead to biased coefficients due to the underlying endogeneity of the lagged dependent variable. In contrast, the GMM Arellano-Bond method for dynamic panel data is able to generate consistent estimators and has good small-sample properties which are quite convenient in our case. Therefore, this GMM method has been used in our estimation.
3.2. The data
The price data from Eurostat used in this work cover the years between 2007 and 2013, the first and the last full years with complete retail price data for all Member States. The new Eurostat methodology provides comparable data for all EU States and is published every six months (on a yearly basis by components). Separate component price data for energy, network and taxes are not available before 2007. Although final price data are available since 1990, the main advantage of this new methodology is that the real average prices that customers pay for their consumption are provided and a comparison of prices at national level as well as a comparison of the components of the prices can be undertaken. This is due to the fact that the new methodology provides disaggregated data for the energy-only costs, network costs and taxes and levies.
Unlike the other variables used in this analysis, the information on renewable electricity support costs is not directly available in a standardized public or private database. In order to overcome this data limitation, we have built the Renewable Promotion Cost (RPC) variable based on the information provided by the Council of European Energy Regulators (CEER 2011, 2013, 2015). First, the total expenditures on RES-E promotion were calculated as the product of the RES-E weighted average support level by
technology (from CEER reports) multiplied by the overall RES-E production for that
technology. Then, the promotion costs for all the technologies were added and the Renewable Promotion Cost (RPC) was calculated as the ratio between the total expenditure on RES-E promotion and the total electricity consumption. Therefore, the resulting variable is measured in €/MWh. This variable allows capturing the degree of RPCs, taking into account the size of the electricity system (in terms of MWh of electricity generation), which facilitates cross-country comparisons.
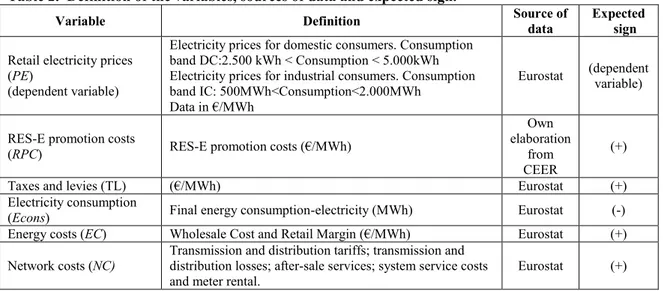
Table 2 summarises the variables selected for this study, the data sources that have been used and the sign that can be expected for these variables in the econometric estimation.
Table 2. Definition of the variables, sources of data and expected sign.
Variable Definition Source of data Expected sign
Retail electricity prices (PE)
(dependent variable)
Electricity prices for domestic consumers. Consumption band DC:2.500 kWh < Consumption < 5.000kWh Electricity prices for industrial consumers. Consumption band IC: 500MWh<Consumption<2.000MWh
Data in €/MWh
Eurostat (dependent variable)
RES-E promotion costs
(RPC) RES-E promotion costs (€/MWh)
Own elaboration
from CEER
(+)
Taxes and levies (TL) (€/MWh) Eurostat (+)
Electricity consumption
(Econs) Final energy consumption-electricity (MWh) Eurostat (-)
Energy costs (EC) Wholesale Cost and Retail Margin (€/MWh) Eurostat (+)
Network costs (NC) Transmission and distribution tariffs; transmission and distribution losses; after-sale services; system service costs and meter rental.
Eurostat (+)
The empirical analysis is performed with data for 22 countries, as data on RPCs are not available for six EU countries (Bulgaria, Cyprus, Ireland, Latvia, Malta and Slovakia). Table 3 provides the summary of the descriptive statistics for the variables used in this study.
Table 3: Summary of descriptive statistics
Variable Observations Mean Standard Deviation Min Max
PEh 195 161.6179 48.7811 72.1 297.5 Pei 195 128.0292 38.5337 62.6 273.2 RPC 154 14.3552 10.6299 0.49 55.2 NCh 174 51.3189 15.7600 21.8 96.6 NCi 180 28.9511 10.8257 3.5 72.4 TLh 174 41.1925 32.8072 3.4 168.6 TLi 176 7.8340 10.1725 0 59.9 ECh 174 70.3523 29.6837 25.9 204 ECi 180 68.575 27.8792 26.9 201.2 Econs 196 100,200,081 134,925,959 1,608,000 532,424,000
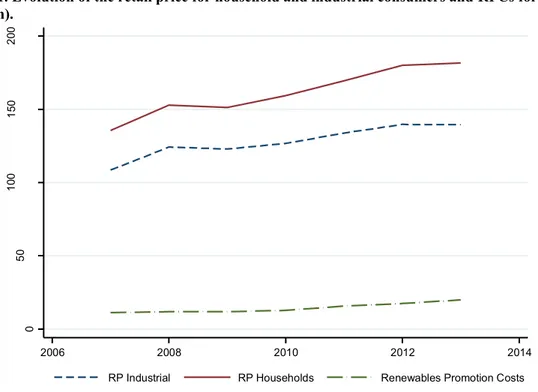
The evolution of the dependent variable (retail electricity prices for both residential and industrial consumers) and the promotion costs (in €/MWh) are shown in Figure 1. Retail electricity prices for households have been well above those for industry, and diverged during the period. This figure helps us to understand the evolution of the dependent variable, which is useful for econometric purposes. A lineal trend is identified for both the residential and industrial prices and, thus, this trend is included in our model as an additional regressor (Tt) to capture this effect. Besides, the figure shows that the retail prices are orders of magnitude higher the RPCs.
Figure 1. Evolution of the retail price for household and industrial consumers and RPCs for the EU (€/MWh). 0 50 1 00 1 50 2 00 € /M W h 2006 2008 2010 2012 2014
The correlation matrix provides relevant information on the relation between the variables included in our model (Table 4). This correlation matrix suggests that we can reject the presence of multicollinearity which could arise if there was a high correlation between the explanatory variables. The variance inflation factors in OLS (without fixed effects) have been calculated and the results confirm that a problem of extreme correlation between the explanatory variables does not exist.
Table 4: Correlation Matrix
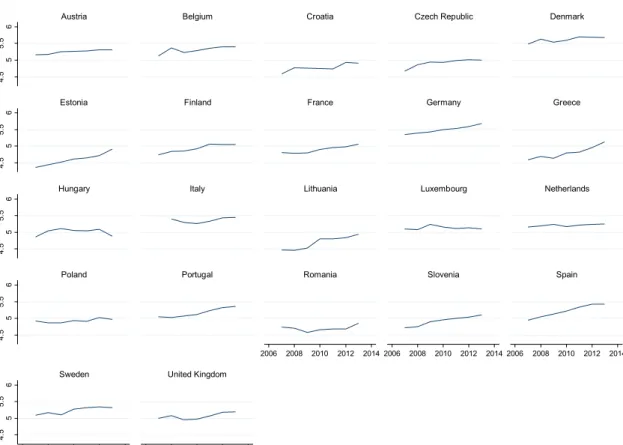
Finally, in order to improve our knowledge on the dependent variable, we plotted both domestic and industrial retail prices in a time-series graph for each of the countries (see Figures 2and 3). A potential lineal trend on both prices can be identified for most countries. Therefore, we include a lineal trend in our model as an additional regressor (Tt) to capture this effect.
PEh PEi ECh NCh TLh ECi NCi TLi Econs RPC
PEh 1.0000 PEi 0.7719 1.0000 ECh 0.5371 0.3869 1.0000 NCh 0.5371 0.2735 0.0341 1.0000 TLh 0.8544 0.7342 0.1169 0.3278 1.0000 ECi 0.3128 0.3745 0.7839 0.0562 -0.0741 1.0000 NCi -0.0792 0.2138 -0.3492 0.2518 0.0036 -0.3289 1.0000 TLi 0.5413 0.5348 0.4526 0.0082 0.4769 0.3606 -0.2632 1.0000 Econs 0.4317 0.2514 0.5349 0.0319 0.2605 0.3371 -0.2347 0.4938 1.0000 RPC 0.3098 0.2859 0.2356 0.1545 0.2275 0.3245 -0.0767 0.5263 0.2671 1.0000
Figure 2: Retail price for household consumers (in logs)
Figure 3: Retail price for industrial consumers (in logs)
4. 5 5 5. 5 6 4. 5 5 5. 5 6 4. 5 5 5. 5 6 4. 5 5 5. 5 6 4. 5 5 5. 5 6 2006 2008 2010 2012 2014 2006 2008 2010 2012 2014 2006 2008 2010 2012 2014 2006 2008 2010 2012 2014 2006 2008 2010 2012 2014
Austria Belgium Croatia Czech Republic Denmark
Estonia Finland France Germany Greece
Hungary Italy Lithuania Luxembourg Netherlands
Poland Portugal Romania Slovenia Spain
Sweden United Kingdom
4 4 .5 5 5 .5 4 4 .5 5 5 .5 4 4 .5 5 5 .5 4 4 .5 5 5 .5 4 4 .5 5 5 .5 2006 2008 2010 2012 2014 2006 2008 2010 2012 2014 2006 2008 2010 2012 2014 2006 2008 2010 2012 2014 2006 2008 2010 2012 2014
Austria Belgium Croatia Czech Republic Denmark
Estonia Finland France Germany Greece
Hungary Italy Lithuania Luxembourg Netherlands
Poland Portugal Romania Slovenia Spain
4. Results of the estimations.
Table 5 provides the results of the panel GMM estimations of equation 2. The results for the average effects of the regulatory and control variables for the household- column (1) - and industrial - column (2) - retail prices are statistically significant and in line with expectations.
Our attention will be focused on the results of the influence of RPCs on the retail electricity prices. Since we are using panel data, there is causality going from RPCs and the rest of explanatory variables to retail prices (dependent variable).
Table 5. Results of model estimations.
(1) (2) (3) (4) EC 0.404*** 0.589*** 0.400*** 0.587*** (0.0133) (0.0108) (0.0116) (0.0104) NC 0.287*** 0.267*** 0.300*** 0.261*** (0.0128) (0.0203) (0.0169) (0.0201) TL 0.245*** 0.0549*** 0.243*** 0.0510*** (0.00955) (0.00370) (0.0117) (0.00649) RPC 0.00878*** 0.0239*** 0.0281*** 0.115*** (0.00170) (0.00433) (0.00641) (0.00973) Econs -0.121*** -0.0934** -0.101** -0.137** (0.0366) (0.0444) (0.0362) (0.0619) Trend 0.0101*** 0.0116*** 0.00813*** 0.0115*** (0.00103) (0.00347) (0.00114) (0.00340) RP (lag) -0.0837*** -0.0347 -0.0614*** -0.00694 (0.0138) (0.0281) (0.0120) (0.0283) RPC*Q -0.0244** -0.104*** (0.00888) (0.0114) Pseudo R2 0.7347 0.8298 0.8171 0.8827 Observations 100 95 100 95 Number of id 22 21 22 21
Note: Standard errors in parentheses*** p<0.01, ** p<0.05, * p<0.1. Pseudo R2 calculated as [∑(𝑌𝑖𝑡− 𝑌̅)2− ∑(𝑌̂𝑖𝑡− 𝑌𝑖𝑡)
2
First, on average, the influence of the RPCs on the retail electricity prices faced by both industrial and residential consumers is positive and relatively small. The influence found is related to the increase in the support costs over time. This is mostly related to the two most relevant technologies in this context (wind on-shore and solar PV). An increase of 1% in RPCs induces an increase of 0.023% in the industrial retail prices and of 0.008% in the residential retail prices. One possible explanation for this different influence on the two categories of consumers is that electricity prices are significantly higher for households (161€/MWh on average) than for industry (128€/MWh on average). Indeed, the weight of the RPCs in the retail electricity prices is lower for households (9%) than for industry (11%). The influence of 1€/MWh of increase in RPCs would then be lower in the case of households, i.e. a given increase in the RPCs would induce a lower (relative) increase in retail prices for households compared to industrial consumers.
Regarding the absolute influence of RPCs on the retail prices, our results show that this is non-negligible, although small compared to other regulations and energy-only costs (table 6)1. One €/MWh of increase in promotion costs induces an increase of 0.213 €/MWh (short-term) in the retail price for industrial consumers. This increase is much lower for household electricity prices (0.10€/MWh), which. is in line with the statement above about the different weight of RPCs in the industrial and residential prices.
Table 6. Short-run effects of an increase of 1€/MWh in the control variables on the retail price (in €/MWh). 1 €/MWh in Households Industrial RPC 0.10 0.21 NC 0.90 1.18 EC 0.93 1.11 TL 0.97 0.91
The estimated coefficients for the control variables are statistically significant, have the expected sign, and their magnitudes seem reasonable. Compared to RPCs, network costs have a greater relative impact on retail prices, probably because network costs represent a much higher share of the electricity bill than RPCs (on average, the weight of the
1It is possible to compute the change of the retail price in terms of €/MWh from an increase of 1 €/MWh
in the RPCs using the results on elasticities (% change of the retail price from a 1 % increase of the RPCs) and the average values of both variables.
network costs in the retail electricity prices is 27% and the weight of the RPCs is 10%)2. However, in contrast to the case of the RPCs, the elasticities are higher for households (0.29%) than for industry (0.26%), which could be related to industries being charged less for those network costs than households, as suggested by Grave et al (2015). Industrial consumers may face lower network costs than residential consumers for several reasons. First, industrial sectors often use connections with higher voltage (i.e., with lower charges). Second, the weight of those costs in the retail electricity prices is higher for households (32%) than for industrial consumers (23%). Third, according to Ramsey's principle of optimal taxation, the optimal tax rate on an activity should be inversely proportional to the price-elasticity of that activity. In order to reduce the influence on the regulated revenues, energy suppliers possibly charge relatively more network costs (NCs) to domestic than to industrial consumers, i.e. costs are charged proportionally more to the more price-inelastic consumers. There might also be country-specific reasons underlying this result. The influence of taxes and levies is also considerable (see table 5) and larger than the RPCs.
Electricity consumption negatively affects those prices. This may seem counterintuitive and at odds with economic theory, since a greater demand should induce a higher level of prices, ceteris paribus. However, as mentioned in section 3, it should be taken into account that this variable captures the size of the market and, thus, the negative sign may suggest the existence of a scale effect, i.e., the greater the amount being consumed in the economy, the lower the price. Finally, the influence of energy-only costs on the retail prices is positive. Obviously, a higher price of fossil fuels or, in general, a higher price for the technology which sets the price in the wholesale electricity market would lead to higher wholesale prices and, thus, higher retail prices. It should be taken into account, however, that this is partially offset by the so-called merit-order effect, which is likely to be more relevant with increasing RES-E penetrations.
An interesting result is that, if the magnitude of the respective elasticities is considered, the influence of changes in energy-only costs clearly outweighs the impact of changes in taxes and electricity consumption. This can be explained by the key role played by those energy-only costs in the retail prices, which is related to their substantial share as
2 A priori, it could be expected that both components of the electricity bill were interrelated, since a
greater RES penetration would involve considerable grid reinforcements and extensions. However, the correlation between the variables capturing these components is very low.
a component of those prices. It is also relevant to acknowledge that the elasticities for the energy-only costs are higher for industrial consumers than for households, which could be related to the fact that such a share is higher for the former consumers than for the later. In contrast, the influence of taxes is higher for households than for industrial consumers, since households pay proportionally more taxes than industrial consumers. In this context, the impact of RPCs on electricity retail prices is likely to be mediated by the type of instrument being implemented and, within the instruments, by the choice of design elements. The literature on RES-E support schemes has consistently shown that the success of RES-E promotion critically depends on the choice of instruments and design elements.
A particularly relevant distinction is between price-based (FITs and FIPs) and quantity based support instruments (quotas with TGC schemes). The latter have been applied in six EU countries during the whole period considered in this article (Belgium, Italy, Sweden, Poland, Romania and the U.K.), although, in two cases, combined with FITs in the last years of the period for some technologies3, In the other 16 countries, price-based support schemes have been applied, either in isolation or combined with secondary instruments. This distinction is relevant in so far as both types of instruments seem to have had quite a different impact on the effectiveness and efficiency of RES support schemes (Held et al 2014, Ragwitz et al 2007, IEA 2011). The literature shows that, at least for wind on-shore and solar PV, FITs have generally been more effective than quotas with TGCs4. The level of support being provided with FITs has usually been
closer to the generation costs of the respective technologies, whereas excessive unitary remuneration (€/MWh) has often been the case under TGCs. However, the great solar PV deployment under FITs has led to very large total support costs (unitary support times the amount of RES-E being generated) in several countries (e.g., Spain and Germany). This has also been due to the lack of implementation of cost-containment mechanisms under FITs (such as budget generation or capacity caps) in the past.
3 FITs for solar PV have been adopted since 2010 in Italy and since 2009 for small-scale RES (<5 MW) in
the U.K.
4 However, the evidence at the world level is not so conclusive. While Dong (2012) find that FITs are
more effective than quotas (Carley et al 2016) find that the opposite is true. FITs are found to be an effective way to increase RES-E specifically for the case of the USA in Smith and Urpelainen (2014).
Therefore, in order to test the influence of support instruments on the relationship between support costs and retail prices, another set of regressions on both industrial and household retail prices was performed including, in addition, an interaction term (RPC*Q) between the RPC variable and a dummy variable (Q) which takes the value 1 for those countries with a quantity-based scheme in the whole period being considered (2007-2013) and 0 otherwise (i.e., implicitly the base level corresponds to countries with price-based schemes)5. The results in Table 5 –columns (3) and (4) for households and industrial consumers, respectively- show that the impact on retail prices has been greater in countries with price-based schemes than in countries with quantity-based schemes. The reason for this novel result is probably related to the higher total (although not necessarily unitary) costs of RES-E promotion under FITs and other price-based promotion mechanisms.
To sum up, although RPCs have a non-negligible impact on retail prices, this impact is relatively small when compared to other factors and is mediated by the type of instrument being chosen.
5. Conclusions
Final consumers’ prices have substantially increased in the EU. From 2007 to 2013 by 34% for domestic customers and 29% for industrial customers between 2007 and 2013. Despite efficiency gains and the progressive opening of energy markets to competition, that have reduced wholesale electricity prices, retail prices have increased, and the price increase during this period has been strongly influenced by the regulated component. This has triggered the concern of policy-makers around Europe. RPCs have been singled out as a main driver of such increase. This paper aims to analyse the impact of RPCs on the evolution of retail prices in the EU.
Our results show that renewable energy promotion costs have a non-negligible, positive and statistically significant impact on the retail prices faced by both industrial and residential consumers. However, such impact is relatively small when compared to other variables. Differences between the two types of consumers exist. An increase of
5In order to identify the instruments implemented between 2007 and 2013 in the 22 Member States, we
have used several sources: CEER (2008, 2011, 2013, 2015), Held et al (2014), del Río and Mir-Artigues (2014) and Mir-Artigues and del Río (2016).
1% in RPCs induces an increase of only 0.023% in the industrial retail prices and of 0.008% in the residential retail price. Furthermore, differences between instruments exist, with price-based RES support schemes having a greater impact on retail prices than quantity-based ones, which is related to the absence of cost-containment mechanisms in the former (i.e., budget, generation or capacity caps), despite the generally higher unitary support costs for quantity-based schemes.
These results have clear public policy implications. First, they suggest that the focus on RPCs as a main driver of retail prices should be put into context and that measures to control the increase in those prices should take into account those other drivers. The fact that the impact is small in the period considered in this paper does not imply that the increase in RPCs and their impact on electricity prices should not be a concern for policy-makers. In fact, although this impact has been small in the period considered, it is likely to be much higher with growing RES shares. Measures should be adopted in order to limit the increase in retail prices which negatively affects household consumers (aggravating the energy poverty problem) and the competitiveness of industries.
Second, our findings suggest that the choice of design elements and particularly cost-containment instruments are a must in order to limit the costs of the RPCs in price-based schemes. Quantity-price-based support schemes (quotas with TGCs) have an in-built mechanism to contain those costs by capping the amount of generation which can be remunerated (given by the quota), although TGCs have other problems (including high remuneration levels for the most mature technologies and best sites, relatively high revenue risks negatively affecting capital costs and ineffectiveness in promoting still maturing technologies, see Mir-Artigues and del Río 2016, Noothout et al 2016). Price caps (in the form of penalties) represent an effective way to mitigate the risks of very high TGC prices. In price-based support schemes, such as administratively set feed-in tariffs and feed-in premiums, which do not have such in-built cost-containment mechanism, there are several alternatives to limit the costs, including budget, generation or capacity caps, traditional degression and growth corridors. These cost-containment measures have recently been adopted (del Río and Mir-Artigues 2014). Auctions are increasingly being used for RES-E support, taking into account the D.G. COMP Guidelines on State aid for environmental protection and energy for 2014-2020 (which strongly encourage the use of this mechanism EU-wide from January 1st 2017) and the concern of governments on the cost-effectiveness of support (AURES project 2016).
Avoiding the sky-rocketing of those costs is required for the social acceptability and, thus, political feasibility of RES-E support schemes in the future.
Third, the fact that the burden falls to a greater extent on the industrial sectors suggests that limiting the cost pass-through into retail prices for these consumers could be justifiable, i.e., the increase in RPCs should not be passed completely to the retail electricity prices paid by industrial firms. However, this is a difficult decision with negative implications for other actors6
Several limitations of the study suggest fruitful avenues for future research:
First, the temporal and geographical scope of the analysis could be widened to non-EU countries and a more recent period. Broadening the period of the analysis could show whether the aforementioned cost-containment measures, recently implemented EU-wide, have had a mitigating impact of RPCs on retail electricity prices and the degree of such effects. Data are not yet available to perform such analysis, however.
Second, the analysis in this paper has not distinguished between different types of technologies. The impact of the deploymet of different renewable energy technologies (solar PV, wind, biomass and hydro) on the RPCs should be further analysed.
Third, the interrelation between RPCs and other drivers should also be considered. This paper has implicitly assumed that they are separated from each other. Indeed, from the statistical point of view, at a country aggregated level, the data do not reflect this interaction. However, they may increasingly be related with a growing RES penetration. For example, RPCs and NCs may be increasingly interrelated with a growing penetration of RES, since much higher RES deployment rates entail considerable grid reinforcements and extensions7. Further research could be devoted to the analysis of these interrelationships.
Finally, this paper has analysed the influence of two broad categories of RES-E support instruments (price-based vs. quantity-based) on the retail prices. Further research could
6
Obviously, someone would have to pay for those added costs. Two alternatives exist in this regard: households or the public budget. Adding this to the retail electricity price paid by households would be particularly detrimental for the most vulnerable consumers. Of course, the public deficit would be increased in the other option.
7Indeed, the market integration of an increasing amount of RES is becoming a growing source of concern
be dedicated to the analysis of the impact of a more disaggregated set of instruments as well as different design elements for those instruments.
Acknowledgements
We are grateful for the generous support of the Chair of Energy Sustainability (Barcelona Institute of Economics, University of Barcelona), and the Generalitat de Catalunya SGR project 2015-SGR-531. Financial support from the Spanish Ministry of Economics and Competitiveness project ECO2015-69107-R and FUNSEAM (Energy and Environment Sustainability Foundation) is gratefully acknowledged.
References
AURES project. 2016. Instruments and lessons learned from around the world. http://auresproject.eu/
Bloomenergy (2010). Understanding California’s Electricity Prices
Carley, S., Baldwin, E., McLean, L., Brass, J. 2016. Global Expansion of Renewable Energy Generation. An Analysis of Policy Instruments. Environmental and Resource Economics. doi:10.1007/s10640-016-0025-3
CEER (2011). Report on Renewable Energy Support in Europe. Consejo Europeo de Reguladores Energéticos. Ref: C10-SDE-19-04a. Bruselas, Bélgica. 22pp. Disponible en:
http://www.ceer.eu/portal/page/portal/EER_HOME/EER_PUBLICATIONS/CEER_PA PERS/Electricity
CEER (2013). Status Review of Renewable and Energy Efficiency Support Schemes in Europe. Consejo Europeo de Reguladores Energéticos. Ref: C12-SDE-33-03. Bruselas, Bélgica. 53pp. Disponible en:
http://www.ceer.eu/portal/page/portal/EER_HOME/EER_PUBLICATIONS/CEER_PA PERS/Electricity
CEER (2015). Status Review of Renewable and Energy Efficiency Support Schemes in Europe in 2012 and 2013. Consejo Europeo de Reguladores Energéticos. Ref: C14-SDE-44-03. Bruselas, Bélgica. 67pp. Disponible en:
http://www.ceer.eu/portal/page/portal/EER_HOME/EER_PUBLICATIONS/CEER_PA PERS/Electricity
Cludius et al 2014. Distributional effects of the Australian Renewable Energy Target (RET) through wholesale and retail electricity price impacts. Energy Policy, Volume 71, August 2014, Pages 40-51. Johanna Cludius, Sam Forrest, Iain MacGill
Chisari et al. Winners and losers from the privatization and regulation of utilities: Lessons from a general equilibrium model of Argentina. The World Bank Economic Review 1999.
John Cubbin & Jon Stern, 2006. "The Impact of Regulatory Governance and Privatization on Electricity Industry Generation Capacity in Developing
Economies," World Bank Economic Review, World Bank Group, vol. 20(1), pages 115-141.
Paul Deane, John FitzGerald, Laura Malaguzzi Valeri, Aidan Tuohy, Darragh Walsh, Irish and British electricity prices: what recent history implies for future prices, Economics of Energy & Environmental Policy, 3, 2, 2014
DECC (2013). Estimated impacts of energy and climate change policies on energy prices and bills 2012.
Del Río P., Mir-Artigues P. (2014). Combinations of support instruments for renewable electricity in Europe: A review. Renewable and Sustainable Energy Reviews; 40: 287-295.
Dong C (2012) Feed-in tariff vs. renewable portfolio standard: an empirical test of their relative effectiveness
in promoting wind capacity development. Energy Policy 42:476–485
EIA (2003). Analysis of a 10-Percent Renewable Portfolio Standard. SR/OIAF/2003-01. Washington: EIA.
Eurelectric 2014. Analysis of European power price increase. Eurelectric studies. Eurostat. Renewable energy statistics. 2015. http://ec.europa.eu/eurostat/statistics-explained/index.php/Renewable_energy_statistics
Flaherty et al 2014. A quantitative analysis of the impact of wind energy penetration on electricity prices in Ireland
Micheál O’Flahertya,*, Niall Riordanb, Noel O’Neilla, Ciara Aherna Energy Procedia 58 ( 2014 ) 103 – 110
Fischer, C. 2009. Renewable Portfolio Standards: When Do They Lower Energy Prices? The Energy Journal Economics, Volume 31, Number 1. Carolyn Fischer Education Foundation
Frondel M., Ritter N., Schmidt C.M., Vance C. (2010). Economic impacts from the promotion of renewable energy technologies: The German experience. Energy Policy; 38 (8): 4048-56.
Gelabert L, Labandeira X, Linares P (2011) An ex-post analysis of the effect or
renewables and cogeneration on Spanish electricity prices. Energy Economics, 33: 559-565.
Held A., Ragwitz M., Boie I., Wigand F., Janeiro L., Klessmann C., Nabe C., Hussy C., Neuhoff K., Grau T., Schwenen S. (2014). Assessing the performance of renewable energy support policies with quantitative indicators – Update 2014. Proyecto Europeo DIA-CORE (Energía Inteligente para Europa). Contrato N°: IEE/12/833/SI2.645735. 95pp. Disponible en:
http://diacore.eu/images/files2/MyFolder/D2.1_Assessing_the_performance_of_renewa ble_energy_support_policies_with_quantitative_indicators__Update_2014.pdf
International Energy Agency 2011. Deploying renewable. Paris.
IPART 2012. Independent Pricing and Regulatory Tribunal of New South Wales 2012. Changes in regulated electricity retail prices from 1 July 2012.
London Economics 2012. Energy Retail Markets Comparability Study. Prepared for DECC.
Mir-Artigues P., del Río P. (2014). Combining tariffs, investment subsidies and soft loans in a renewable electricity deployment policy. Energy Policy; 69: 430-42. Mitchell C., Sawin J.L., Pokharel G.R., Kammen D., Wang Z., Fifita S. et al. (2011). Policy, Financing and Implementation. IPCC Special Report on Renewable Energy Sources and Climate Change Mitigation. In: Edenhofer O., Pichs-Madruga R., Sokona Y., Farahani E., Kadner S., Seyboth K. et al. (eds.). Cambridge, Cambridge University Press.
Moreno et al 2012. The electricity prices in the European Union. The role of renewable energies and regulatory electric market reforms. Energy, Volume 48, Issue 1, December 2012, Pages 307-313. Blanca Moreno, Ana J. López, María Teresa García-Álvarez Morey, Kirsch Germany’s Renewable Energy Experiment: A Made-to-Order Catastrophe. The Electricity Journal, Volume 27, Issue 5, June 2014, Pages 6-20. Mathew Morey, Laurence Kirsch
Noothout, P., de Jager, D., Tesnière, L., van Rooijen, S., Karypidis, N., Brückmann, R., Jirouš, F., Breitschopf, B., Angelopoulos, D., Doukas, H., Konstantinavičiūtė, I., Resch, G. (2016). The impact of risks in renewable energy investments and the role of smart policies. Final Report of the DIA-CORE. Contract N°: IEE/12/833/SI2.645735. Ortega, M., del Río, P. 2016. Benefits and costs of renewable electricity in Europe. Renewable and Sustainable Energy Reviews, Volume 61, August 2016, Pages 372-383
Pollitt. Electricity liberalization in the European Union: A progress report, Cambridge working papers in Economics 0953, Faculty of Economics, University of Cambridge. Ragwitz M., Held A., Resch G., Faber T., Haas R., Huber C., Coenraads R., Voogt M., Reece G., Morthorst P.E., Jensen S.G., Konstantinaviciute I., Heyder B. (2007).
Assessment and optimisation of renewable energy support schemes in the European electricity market. Informe final del proyecto europeo OPTRES (Energía Inteligente
para Europa). Contrato Nº: EIE/04/073/S07.38567. Disponible en: https://ec.europa.eu/energy/intelligent/projects/en/projects/optres
Rathmann M. Do support systems for RES-E reduce EU-ETS-driven electricity prices? Energy Policy, 2007; 35: 342–349.
REN21 (2015). Global Status Report. Renewable Energy Policy Network for the 21st century.
Sáenz de Miera G., del Río P., Vizcaíno I. (2008). Analysing the impact of renewable electricity support schemes on power prices: The case of wind electricity in Spain. Energy Policy; 36 (9): 3345-59.
Sensfuß F., Ragwitz M., Genoese M. (2008). The merit-order effect: A detailed analysis of the price effect of renewable electricity generation on spot market prices in Germany. Energy Policy; 36 (8): 3086-94.
Simhauser, P., Nelson, T. 2013. The Outlook for Residential Electricity Prices in Australia's National Electricity Market in 2020. The Electricity Journal, Volume 26, Issue 4, May 2013, Pages 66-83. Paul Simshauser, Tim Nelson
Würburg K, Labandeira X, Linares P (2013) Renewable generation and electricity prices: Taking stock and new evidence for Germany and Austria. Energy Economics, 40: 5159-5171.
Smith, M., Urpelainen, J. 2014. The Effect of Feed-in Tariffs on Renewable Electricity Generation: An instrumental Variables Approach. Environ Resource Econ 57: 367-392. Tellus Institute (2002). Modeling Analysis: Renewable Portfolio Standards for the Rhode Island GHG Action Plan. Boston: Tellus Institute.
Traber, T., Kemfert, C. 2009. Impacts of the German Support for Renewable Energy on Electricity Prices, Emissions, and Firms. The Energy Journal, Vol. 30, No. 3.
UCS (2004). Renewable Energy Can Help Ease the Natural Gas Crunch. Cambridge: UCS
Annex I. Review of the literature on the influence of different components of retail electricity prices. Reference Scope (geography –time) Method
Relevant details and results
Morey and Kirsch (2014)
Germany, 1998-2013
Decriptive methodology
The authors suggest that Germany’s enthusiastic embrace of RES may be adding 10 times as much to the German residential rates as experienced in the United States. The impact of RES-E support (EEG) has been increasing in both absolute and relative terms. It will cost electricity consumers about $38.5 billion, compared to projected revenues from the sale of RES-E in the wholesale spot market of about $3.4 billion. The subsidy flowing from consumers to RES-E in 2013 is thus about $35 billion.
Cludius et al (2014) Australia, 2011-2012 and 2012-2013 Time-series analysis of historical price and load data (Tobit model).
Besides a wholesale component and renewable energy scheme charges, residential retail prices also include charges for transmission and distribution networks. These network costs are, indeed, the major cost component. In 2012-13 residential retail prices in the Australian National Electricity Market comprised estimated cost components for transmission networks of 8% and distribution networks of 37%, a wholesale component including carbon costs of 37% and a retail component of 17% that included an allowance for LRET and SRES costs of 3–4%.
Some energy-intensive industries are benefiting from lower wholesale electricity prices (due to increasing wind generation) whilst being largely exempted from contributing to the costs of the wind support scheme. By contrast, many households are paying significant renewable energy pass-through costs whilst not necessarily benefiting from lower wholesale prices. Simshauser, P.,
Nelson, T. (2013). Australia, 2009-2013 Descriptive methodology and simulation models (NEMESYS, partial-equilibrium electricity model)
The paper analyses the factors behind the increase in retail prices in the 2009-2013 period and possible scenarios for 2020. It is based on a descriptive methodology for the past and simulation models for the future. The authors simulate an increase in the Mandated Renewable Energy Target (MRET) policy by a factor of four, thus taking renewable from 4 percent to 16 percent in the fuel mix by 2015. Increased use of renewables leads to unit prices rising to US$61.20/MWh, about US$3.20/MWh higher than in a reference scenario.
Flaherty et al (2014)
Ireland,
2007-2013 Description of historical data
from the market and grid operators.
The aim of this study is to examine the effect of wind energy penetration on both the wholesale and retail prices of electricity in Ireland. An analysis of the data reveals that increasing wind penetration is having little impact on average prices. In contrast, gas prices gas are the main determinant of SMP. Moreno et al (2012). EU, 1998-2009 Econometric panel data model (fixed effects).
This paper provides an empirical investigation of the electricity prices determinants. It develops econometric panel models to explore the relationship between the household electricity prices and variables related to RES and the competition in generation electricity market. The results suggest that electricity prices increase with the deployment of RES (wind). Regarding electricity generated from wind, the estimated coefficient suggests that a 1% increase in this variable leads to an increase of 0.031% in household electricity prices.Results also reveal that the country's characteristics can affect household electricity prices. Dependent variable: Electricity prices for household consumers. Explanatory variables: Market share of the largest generator in the electricity market, RES-E penetration, GDP per capita, GHG emissions by energy industries as a total of GHG emissions and energy dependency (ED). All variables are statistically significant. DECC (2013). U.K. 2012. Forecasts to 2020 and 2030 Descriptive
statistics Wholesale energy costs are estimated to currently make up around 37% of an average household electricity bill (excluding the cost of carbon). In 2013, energy and climate change policies are estimated to represent 14% of an average household electricity bill. Transmission, distribution and metering costs (20%), other supplier costs and margins (19%) and VAT (5%) are the other main components of the average household energy bill. Policies are estimated to currently be adding around 17% to the average electricity price paid by UK households. In addition to the cost of the ECO and Warm Home Discount, this also reflects the cost of the RO and small-scale Feed-in-Tariffs (FITs) obligation on retail prices.
IPART (2012) New South
Wales (NSW)
Descriptve sttistics
Over the past years 2010-2011 years, the main reasons for the increases in average regulated electricity prices were rising network costs and rising green scheme costs (the
(Australia) 2012-2013
costs of complying with Commonwealth and State Government schemes aimed at mitigating growth in carbon emissions, including the Renewable Energy Target scheme). In 2012,, the increases are primarily driven by the continuing rise in network costs, which is responsible for nearly half of the average 18% price increase. The introduction of a carbon pricing mechanism, which is responsible for the other half. Increase in RES-E support only accounts for a 0.3% price increase. RPCs represent between 5 and a 7% of a household electricity bill (vs. 43%-56% for network costs and 21%-29% for energy-only costs). London Economics (2012). The EU-15 and Selected OECD jurisdictions. 1984-2010 Econometric model
This study assesses the trends and position of the UK electricity and gas retail markets relative to comparable jurisdictions in terms of prices, competition and profitability.
The econometric analysis suggests that commodity input prices, fuel mix (electricity), the need to import (gas) and wages explain a large amount of the variation in retail prices for both residential and industrial customers across jurisdictions and over time.
Impact of each explanatory variable across the regressions (for electricity prices): commodity input prices (+), energy usage per capita (-), wage levels as proxy for input costs (+), proportion of hydro (-), proportion of nuclear (-), proportion of renewable (+).
Fischer (2010) U.S. 2008 General model
of energy supply and demand
The authors analyse the impact of renewable portfolio standards (RPS) on retail electricity prices. Over an initial range—from the current 3 percent to about 7.5 percent— the RPS does slightly lower the retail price relative to the baseline. However, more ambitious standards raise retail prices, and increasingly so as we enter the 10 to 20 percent range of many policy targets. The two driving factors are the elasticity of electricity supply from renewable energy sources relative to nonrenewable ones and the effective stringency of the target. The availability of other baseload generation helps to determine that stringency, and demand elasticity influences only the magnitude of the price effects, not the direction of those effects. Sensitivity analysis indicates that assumptions about renewable energy supply slopes are more important than those about nonrenewable supplies in predicting the retail price impacts of renewable portfolio standards.
Deane et al (2014). U.K. and Ireland 2008-2011
Electricity market model
This paper investigates the price of electricity in Ireland and Great Britain. Both wholesale and retail prices during the 2008-2011 period are compared and structural, technological and regulatory characteristics are suggested which explain the price differences. In Great Britain, a TGC scheme has been adopted, whereas FITs are applied in Ireland. The authors argue that RES-E support in Great Britain appears very expensive when compared to Ireland (even though the penetration of RES-E is about half that of Ireland). Traber, T. And Kemfert (2009). Germany 2006 Electricity market model with oligopolistic behaviour (EMELIEEEUR-25)
It investigates the effects of the German FIT, analysing the impacts on producer and consumer prices, electricity sector emissions, price-cost margins and on the firm’s profits from plant operation. To highlight the transmission channels, they decompose the effects of the FIT into a substitution effect, triggered by the replacement of conventional by renewable sources, and a permit price effect induced via the ETS. They find that the total effect of the policy increases the German consumer price slightly by 3%, while the producer price decreases by 8%. The FIT increases, the
price-cost margins of almost all dominant firms, indicating a market power enhancing effect under their baseline assumption of oligopolistic competition. They do not find evidence of the theoretically possible decrease in consumer prices due to RES support. Rather, they show that a pronounced increase of consumer prices by the FIT can be expected since it induces an increase in price-cost margins of suppliers of conventional electricity.
Bloomenergy (2010). California 2009-2020 Description of possible trends and drivers based on multiple information sources.
In this paper recent trends and forecasts for average retail and commercial electricity prices in California are explored. More importantly, they discuss the main drivers for future increases including:
• Infrastructure investment • Fuel costs
• Climate change legislation (mainly RES-E support costs).