R E S E A R C H A R T I C L E
Open Access
A cross-sectional study investigating
lifestyle and weight perception of
undergraduate students in southern Italy
Francesca Gallè
1*, Elita Anna Sabella
2, Giovanna Da Molin
2, Giorgio Liguori
1, Maria Teresa Montagna
3,
Giovanni Battista Orsi
4, Giuliana Valerio
1and Christian Napoli
5Abstract
Background: The aim of the study was to explore lifestyle of undergraduate students in southern Italy and to investigate their determinants.
Methods: An anonymous, web-based questionnaire investigating weight and its perception, smoking and alcohol use, achievement of recommended levels of physical activity and time spent daily in screen-based sedentary behaviors was administered to students attending two universities in southern Italy. Age, gender, city, type of degree course attended, occupational status and residential status were considered as possible demographic determinants.
Results: The majority of the participants reported a normal weight (71.2%), were non-smokers (66.6%), occasional alcohol consumers (60.5%) and insufficiently active (62.6%), with a reported mean screen time exceeding 2 h per day. Gender, city, type of degree course and occupational status were found to be associated with lifestyle by regression analysis. Normal weight, overweight and obese students were generally properly aware of their weight condition; however, weight misperceptions were registered among normal and underweight undergraduates. Conclusions: This study highlighted some critical issues regarding lifestyles of university students that suggest the need for health promotion interventions targeted mainly on physical activity.
Keywords: Lifestyle, Undergraduate students, Smoking, Alcohol consumption, Physical activity, Nutritional status Background
In the last decades, non-communicable chronic diseases such as obesity, cardiovascular diseases, cancer and type 2 diabetes became the most important causes of death globally. The role of lifestyle in the development of these diseases has been widely recognized; in particular, inad-equate diet, inactivity, smoke and alcohol consumption represent the main behavioral risk factors [1].
In Italy, the epidemiological systems activated to
monitor inhabitants’ health conditions and habits
(“OKkio alla salute” for children, www.epicentro.iss.
it/okkioallasalute/; “Health Behaviour in School-aged
Children” for adolescents,http://www.hbsc.unito.it/it/;“Passi”
for adults, http://www.epicentro.iss.it/passi/en/english.asp) show that both unhealthy behaviors (smoke, alcohol con-sumption, inactivity) and related health conditions and diseases (overweight/obesity, cardiovascular diseases, type 2 diabetes) are more common in Sothern regions. In addition, it is reported a low adherence of the Italian population to the Mediterranean dietary pattern, which is known to decrease morbidity and mortality related to chronic diseases [2–5]. The low adherence to the Mediterranean diet in the Italian population is also associated to overweight/obesity or to other unhealthy habits, such as insufficient levels of physical activity (PA).
In young people, the transition from adolescence to adulthood corresponds to the achievement of independ-ence and this may lead to the development or the con-solidation of unhealthy habits [6]. University students, in particular, seem to be exposed to unhealthy sedentary
© The Author(s). 2019 Open Access This article is distributed under the terms of the Creative Commons Attribution 4.0 International License (http://creativecommons.org/licenses/by/4.0/), which permits unrestricted use, distribution, and reproduction in any medium, provided you give appropriate credit to the original author(s) and the source, provide a link to the Creative Commons license, and indicate if changes were made. The Creative Commons Public Domain Dedication waiver (http://creativecommons.org/publicdomain/zero/1.0/) applies to the data made available in this article, unless otherwise stated. * Correspondence:[email protected]
1Department of Movement Sciences and Wellbeing, University of Naples
“Parthenope”, Via Medina n. 40, 80133 Naples, Italy
and dietary habits, especially if living away from home [7–9]: a previous survey carried out in northern Italy highlighted some clear differences in food consumption, sport practice and body weight perception between un-dergraduates living with families and those living alone [10]. Due to the typical sedentary lifestyle of the students and their difficulties in finding free time, the amount of PA they reach during the week is frequently lower than the World Health Organization (WHO) recommenda-tions [11–13]. In addition, they spent also a lot of time in screen-based sedentary behaviors such as watching television, playing videogames, studying/playing com-puter [14].
Some experiences reported also gender differences regarding undergraduates’ lifestyle and weight status, with females showing more frequently a normal weight and lower PA levels than males [13,15].
Therefore, the promotion of healthy habits in this population group should be considered in a public health prospective. In Italy, many dietary guidelines have been produced, and several educational pro-grams regarding nutrition, smoking and alcohol con-sumption are used to be implemented in the schools, while no similar interventions are targeted to univer-sity students.
In light of this scientific background, the aim of this study was to evaluate nutritional status and weight perception, together with healthrelated behaviors -tobacco smoking, alcohol use, PA level, and screen time - in a sample of undergraduate students attend-ing two universities in southern Italy. In order to identify possible lifestyle determinants to take into consideration for future promotion interventions, the declared weight condition and behaviors were ana-lyzed with regard to demographic variables.
Methods
This cross-sectional study was carried out across the academic years 2015–2016 and 2016–2017 in the Uni-versity of Naples Parthenope and in the UniUni-versity of Bari Aldo Moro by collecting undergraduates’ informa-tion through a web-based quesinforma-tionnaire.
The investigation was performed in accordance with the World Medical Association Declaration of Helsinki. It did not include any experiment on hu-man or biological huhu-man samples, nor research on identifiable human data. The research was conducted anonymously (according to the Italian Legislative De-cree no. 196/2003 concerning the protection of per-sonal data).
Therefore, no identifiable personal data are reported. While accepting to respond to the questionnaire, stu-dents expressed their informed consent to participate to the investigation.
Participants and settings
All the students attending the degree courses in the two universities were invited to take part to the investigation through an e-mail containing a brief description of the aim of the study and the guarantee about the anonymity of data collection and treatment, and a link to the web-based questionnaire created through the online survey tool SurveyMonkey.
The minimum sample size calculation was performed considering the estimated prevalence of smoke, alcohol use, insufficient PI and overweight/obesity in the Italian general population as reference. A sample of at least 217–375 individuals would be required to investigate the above mentioned variables in the students’ population examined, assuming a 5% alpha error and with 80% power.
Questionnaire
In order to encourage the students’ participation, the web-based questionnaire was designed to be brief and user friendly. It included a first part regarding demo-graphic characteristics such as gender, age, degree course, occupational (jobbing/employed or not) and liv-ing (residliv-ing in the area/not residliv-ing but livliv-ing in the area/commuter) condition; students were also asked to self-report their height and weight values in order to cal-culate their Body Mass Index and related weight status (underweight/normal weight/overweight/obese) accord-ing to the WHO classification (http://www.euro.who.int/ en/health-topics/disease-prevention/nutrition/a-healthy-lifestyle/body-mass-index-bmi), together with a personal judgement regarding their weight (“my weight is right”/I should gain weight/I should lose weight). The second part of the questionnaire was aimed to collect informa-tion regarding the lifestyles of participants: quesinforma-tions concerned tobacco (non-smoker/quitter/smoker) and al-cohol use (never/occasionally/1–2 times per week/about every day), weekly PA level (practicing at least 150 min of sport/PA per week or not) and sedentary behavior (minutes of screen time per day).
Statistical analysis
A descriptive analysis was carried out to highlight demo-graphic characteristics of the whole sample and possible differences between the subgroups from the two cities. In addition to the classification resulting from the ques-tionnaire structure, participants were also classified for age (18–21, 22–24, ≥ 25 years) and type of degree course (life science/others). This last classification was made as-suming that life sciences students were more acquainted with healthy lifestyle recommendations, being that in-cluded in their curricula.
Continuous outcomes were reported as mean ± SD; data regarding conditions, behaviors and opinions were
expressed as percentage values related to the answers proposed, calculated on the total of respondents.
The Student’s t test was used to compare mean age and BMI values between the two subgroups; the other variables were grouped in categories and compared through the chi-squared test. In order to explore pos-sible differences between genders regarding BMI and weight perception, number and percentages of males/fe-males belonging to the different BMI categories and those considering their weight normal, insufficient or ex-cessive were compared through the chi-squared test.
Multinomial logistic regression analyses were per-formed to evaluate the possible association between demographic variables and lifestyle behaviors.
The outcome binary variables were built as follows: – BMI, attributing the value 0 to the students who
were underweight/normal weight and 1 to those who were overweight/obese
– Smoke, attributing the value 0 if the student was not a smoker, and the value 1 otherwise;
– Alcohol, considering the value 0 if the student did not consume alcohol and 1 otherwise;
– PA, with the value 0 if the student declared to reach at least 150 min per week and 1 otherwise;
– Screen time, with the value 0 attributed to the participants who declared a daily screen time≤ 120 min and 1 to those who exceeded this value.
All the outcomes were investigated separately through a backward selection of the independent demographic vari-ables (age class, gender, city, type of degree course, occu-pational status, residential status). Odds Ratios (ORs) and 95% Confidence Interval (CI) of differences between cat-egories were considered.
A value of p < 0.05 was assumed as significance level. Data were analyzed with IBM SPSS version 23 for Win-dows (SPSS, Chicago, IL, USA).
Results
The whole student population of both the University Parthenope and the University Aldo Moro (n = 59,779) were invited to participate to the study. A total of 1760 students (710 from Naples, 1050 from Bari; response rate 2.9%) fulfilled the questionnaire. A total of 448 stu-dents (25.5%) attended a degree course in the area of life science, while the remaining 1311 (74.5%) attended a de-gree course in other areas.
The general characteristics of the total sample and those of participants from the two samples are reported in Table1. As shown, the two subgroups differed signifi-cantly for all the demographic variables considered, but the area of course degree: students attending life science
degree courses represented about a quarter of both samples.
Mean BMI did not differ significantly between the two groups, while the analysis of weight category showed a significantly higher proportion of overweight/obese indi-viduals among Neapolitan students.
As for lifestyle, the largest percentage of the partici-pants declared to be non-smoker and occasional alcohol consumer; the majority of the total sample was also in-sufficiently active and reported screen time over 120 min per day. The same findings were shown in the two sub-groups, however a slightly lower percentage of inactive
students (57.9 vs 65.7%, p = 0.001) and a longer screen
time (168 vs 129 min, p = < 0.001) were registered in Naples vs Bari.
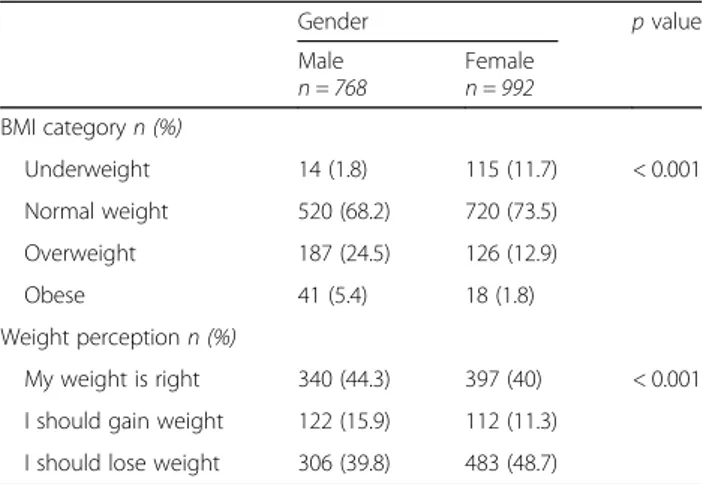
Significant differences were found between genders re-garding BMI classes and weight perception (Table2): al-though higher percentages of overweight/obese subjects were found among males (29.9%), the highest number of participants who considered their weight excessive was registered among females (48.7%).
Figure 1 shows the participants’ opinions regarding
their own weight, grouped for BMI category of respon-dents. It is possible to notice that the majority of the normal weight, overweight and obese students was prop-erly aware of their own condition; however, there was a great part of normal-weight participants who considered their weight excessive, while the majority of underweight participants considered their nutritional status right.
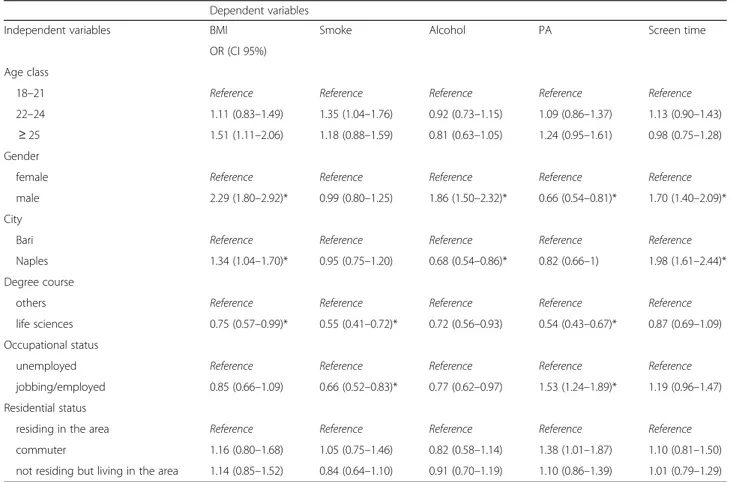
The results of the logistic regression analyses per-formed on the 5 lifestyle variables are shown in Table3. Age and residential status do not seem to influence un-healthy behaviors. On the contrary, attending life science courses and being employed seems to hinder smoking habit, while being male and coming from Bari may favor alcohol consumption.
Male gender seems to be also a determinant for higher BMI and screen time, as well as living in Naples, but not for insufficient PA. Attending life science courses looks like a positive factor also for PA and BMI. The condition of student worker was associated with PA levels lower than those recommended.
Discussion
The information collected in this study underline some critical issues regarding undergraduates’ lifestyle, espe-cially if compared with data from the Italian general population. The percentage of non-smoker students was higher than that reported by the Italian Institute of Sta-tistics for individuals aged 20–24 years in 2016 (66.6 vs
63.5%) [16]. Instead, the percentage of those who did
not report any alcohol consumption in our investigation was lower than that reported for consumption between meals by the Italian population of the same age class
(13.1 vs 26.8%) [16]. However, these values are consist-ent with the low percconsist-entage of smokers and with the high percentage of alcohol users registered among the Italian graduates [16], which suggests the association be-tween these lifestyles and the educational level.
Regarding to the other lifestyles analyzed, although a normal weight was reported by the majority of the sample, it should be noted that the percentage of over-weight/obese students was greater than that of the gen-eral population (21.4 vs 17.4%) and almost double than Table 1 General characteristics of the cohort pooled in the total sample and separated by origin with correspondentp values
Total
(n = 1760) Naples(n = 710) Bari(n = 1050) p value
Mean age ± SDyears 23.4 ± 4.09 24 ± 4.67 22.9 ± 3.58 < 0.001a
(range) (18–60) (18–60) (19–57) Age classn (%) 18–21 617 (35) 215 (30.3) 402 (38.3) < 0.001b 22–24 661 (37.6) 255 (35.9) 406 (38.7) ≥ 25 482 (27.4) 240 (33.8) 242 (23) Gendern (%) male 768 (43.6) 75 (52.8) 393 (37.4) < 0.001b female 992 (56.4) 335 (47.2) 657 (62.6) Degree course Life sciences 448 (25.5) 173 (24.4) 275 (26.2) 0.41b Others 1311 (74.5) 537 (75.6) 774 (73.8) Occupational status jobbing/employed 663 (37.7) 343 (48.3) 320 (30.5) < 0.001b unemployed 1097 (62.3) 367 (51.7) 730 (69.5) Residential status
residing in the area 411 (23.4) 204 (28.8) 207 (19.7) < 0.001b
commuter 345 (19.6) 94 (13.2) 251 (23.9)
not residing but living in the area 1004 (57) 412 (58) 592 (56.4) Smoke non-smoker 1173 (66.6) 469 (66.1) 704 (67) 0.90b quitters 154 (8.8) 64 (9) 90 (8.6) smoker 433 (24.6) 177 (24.9) 256 (24.4) Alcohol use never 231 (13.1) 102 (14.4) 129 (12.3) 0.20b occasionally 1064 (60.5) 437 (61.6) 627 (59.7) 1–2 times/week 409 (23.2) 148 (20.8) 261 (24.9)
vabout every day 56 (3.2) 23 (3.2) 33 (3.1)
Physical activity inactive 1101 (62.6) 411 (57.9) 690 (65.7) 0.001b active 659 (37.4) 299 (42.1) 360 (34.3) Mean BMI ± SD (kg/m2) 22.8 (3.4) 23.5 (3.4) 22.3 (3.4) 1.95a BMI category 129 (7.4) 16 (2.3) 113 (10.8) < 0.001b underweight 1240 (71.2) 494 (71.5) 746 (71) normal weight 313 (18) 148 (21.4) 165 (15.7) overweight 59 (3.4) 33 (4.8) 26 (2.5) obese
Mean daily screen time (min) ± SD 143 ± 140 168 ± 137.4 128 ± 139.5 < 0.001b
aStudent’s t test;bχ2 test
that recently reported by Teleman et al. in a sample of students from universities of Center and North Italy (11.2%) [15,16]. In general, the largest proportion of the students reported a weight perception which matches to their declared weight condition, even if misperceptions were registered in part of normal and underweight stu-dents. Considering that females showed lower propor-tions of overweight/obese respect to males, and that they expressed an higher desire to lose weight, it is possible that most of these misperceptions were sustained by female students. This is in line with other investigations, which reported gender discrepancies in self-reported and desired weight [17–19].
More than 62% of participants were insufficiently ac-tive. This value is consistent with the levels of insuffi-cient PA registered in the Italian population, which increases from 57 to 61.7 to 68.1% among individuals aged 18–19, 20–24 and 25–34 years respectively, con-firming the reduction of PA/sport practice experienced since the beginning of the adult age and highlighting the necessity of promoting PA in this period of life [16]. In
addition, in our study undergraduates reported more than 2 h per day spent in screen-based sedentary activ-ities. Insufficient PA levels and high levels of inactivity among undergraduates, even in coexistence with normal weight, are in line with other surveys [12–14]. The re-gression analysis showed that male gender was associ-ated to unhealthy nutritional status and inactive lifestyle, while attending the Neapolitan university seems to be associated with higher BMI and screen time but not with insufficient PA. However, it should be considered that being employed resulted positively associated to low levels of PA, which suggests that working students encounter greater difficulties in finding free time for rec-reational or structured activities to meet WHO recom-mendations: the reason why Neapolitan students, who were largely workers, showed good levels of PA is prob-ably related with the fact that a great amount of them studied and were employed in the field of PA and sport (data not reported) [20,21].
The regression analysis confirmed also the gender dif-ferences regarding BMI and PA levels reported in previ-ous studies [13, 15], while no significant associations were found between age and lifestyles, probably due to the narrow age range considered.
In 2015, Lupi et al. published the results of a survey aimed to assess dietary habits, sport practice and body weight perception in a sample of undergraduates attend-ing medical and scientific courses at a university in northern Italy [10]. Their findings testified the difficul-ties that students, especially those living away from home, encounter in adopting healthy lifestyles. In our investigation, the condition of student living alone in the city of the university did not result determinant for un-healthy behaviors adoption, and belonging to life science degree courses appeared protective towards unhealthy behaviors. However, it should be considered that our sample was wider, had a different geographical origin and included also students attending other degree courses than those regarding life sciences. It is possible Table 2 Gender differences in BMI category and weight
perception of participants with correspondentp values from chi square test Gender p value Male n = 768 Femalen = 992 BMI categoryn (%) Underweight 14 (1.8) 115 (11.7) < 0.001 Normal weight 520 (68.2) 720 (73.5) Overweight 187 (24.5) 126 (12.9) Obese 41 (5.4) 18 (1.8) Weight perceptionn (%) My weight is right 340 (44.3) 397 (40) < 0.001 I should gain weight 122 (15.9) 112 (11.3)
I should lose weight 306 (39.8) 483 (48.7)
that these differences played a role in determining these different findings.
This study has some limitations. First of all, in order to increase the number of participants, we chose to sub-mit a questionnaire short and quick to fill in; however, this implied the exclusion of some questions regarding, for example, the socio-economic status or the parents’ educational level.
In addition, information regarding weight and height, so as weekly PA levels, were referred by participants and not objectively measured by the investigators. Therefore, it is possible that self-reported measurements were not always accurate and this might have affected the com-parison between perceived and actual weight.
At last, the study may have been affected by selection biases. It was aimed at exploring lifestyles of the univer-sity students, who represent a specific population group and are not representative of the whole population of young adults in southern Italy. Moreover, the response rate was very low; this is probably due to the scarce stu-dents’ compliance to accept an online invitation. How-ever, it should be noted that the minimum sample size needed to investigate the selected variables was achieved and the proportions of students from life science and
other degree courses reflected the one of the whole undergraduate populations of the two enrolled Univer-sities (about 25 and 75% respectively).
Further investigations based on different collecting methods and including people not only attending Universities are needed to complete the lifestyle pic-ture of young adults in this geographical area.
Conclusions
This study represents a contribute to fill the gap in charac-terizing the lifestyle of undergraduates in southern Italy. The main findings highlight the need of health promotion interventions targeted to this specific population group and focused on specific issues. Interventions aimed at improv-ing undergraduates’ knowledge towards unhealthy lifestyle consequences and motivational programs enhancing the adoption of healthy behaviors should be implemented. In particular, the low levels of PA underline that interventions focused on PA promotion and the reduction of inactivity may be useful for the studied population group as well as for the Italian general young adult population to reduce overweight/obesity and maintain health.
The weight misperception registered in the study re-quires further specific investigations.
Table 3 Results of logistic regression analyses carried out on the lifestyles assumed as dependent variables
Dependent variables
Independent variables BMI Smoke Alcohol PA Screen time
OR (CI 95%) Age class
18–21 Reference Reference Reference Reference Reference
22–24 1.11 (0.83–1.49) 1.35 (1.04–1.76) 0.92 (0.73–1.15) 1.09 (0.86–1.37) 1.13 (0.90–1.43) ≥ 25 1.51 (1.11–2.06) 1.18 (0.88–1.59) 0.81 (0.63–1.05) 1.24 (0.95–1.61) 0.98 (0.75–1.28) Gender
female Reference Reference Reference Reference Reference
male 2.29 (1.80–2.92)* 0.99 (0.80–1.25) 1.86 (1.50–2.32)* 0.66 (0.54–0.81)* 1.70 (1.40–2.09)* City
Bari Reference Reference Reference Reference Reference
Naples 1.34 (1.04–1.70)* 0.95 (0.75–1.20) 0.68 (0.54–0.86)* 0.82 (0.66–1) 1.98 (1.61–2.44)* Degree course
others Reference Reference Reference Reference Reference
life sciences 0.75 (0.57–0.99)* 0.55 (0.41–0.72)* 0.72 (0.56–0.93) 0.54 (0.43–0.67)* 0.87 (0.69–1.09) Occupational status
unemployed Reference Reference Reference Reference Reference
jobbing/employed 0.85 (0.66–1.09) 0.66 (0.52–0.83)* 0.77 (0.62–0.97) 1.53 (1.24–1.89)* 1.19 (0.96–1.47) Residential status
residing in the area Reference Reference Reference Reference Reference
commuter 1.16 (0.80–1.68) 1.05 (0.75–1.46) 0.82 (0.58–1.14) 1.38 (1.01–1.87) 1.10 (0.81–1.50) not residing but living in the area 1.14 (0.85–1.52) 0.84 (0.64–1.10) 0.91 (0.70–1.19) 1.10 (0.86–1.39) 1.01 (0.79–1.29)
Abbreviations
BMI:Body Mass Index; PA: Physical Activity; WHO: World Health Organization
Acknowledgements
The authors thank all the students who participated to the study.
Authors’ contributions
FG and CN conceived and designed the study. GDM, GL, MTM, GBO and GV participated to the organization of the activities. FG, CN and EAS managed the activities and collected the data. FG and EAS analyzed and interpreted the data. FG drafted the article. CN, GDM, GL, MTM, GBO and GV revised the manuscript critically for important intellectual content. All authors read and approved the final article.
Funding
The study was supported by the Competitive Research Fund of the University of Naples Parthenope, year 2016. The funder did not have a role in the design, collection, analysis, interpretation of data, and/or writing of this manuscript.
Availability of data and materials
The datasets generated during the current study are available from the corresponding author on reasonable request.
Ethics approval and consent to participate
All procedures performed were in accordance with the ethical standards of the University of Naples Parthenope and University of Bari Aldo Moro and with the 1964 Helsinki declaration and its later amendments or comparable ethical standards. The study was approved by the Ethical Committee of the University of Campania“Luigi Vanvitelli” with the protocol number 478/2019. Students were informed about the aim of the study and about treatment and publication of their information through the invitation e-mail; partici-pants expressed their informed consent before to access to the question-naire. Anonymity of personal data was guaranteed.
Consent for publication Not applicable.
Competing interests
Francesca Gallè is a member of the editorial board of the journal (associate editor).
Author details
1Department of Movement Sciences and Wellbeing, University of Naples
“Parthenope”, Via Medina n. 40, 80133 Naples, Italy.2
Inter-University Research Centre“Population, Environment and Health”, University of Bari Aldo Moro, Piazza Umberto I, 1, 70121 Bari, Italy.3Department of Biomedical Science and Human Oncology, University of Bari Aldo Moro, Piazza G. Cesare 11, 70124 Bari, Italy.4Department of Public Health and Infectious Diseases,“Sapienza” University of Rome, Piazzale Aldo Moro 5, 00185 Rome, Italy.5Department of
Medical Surgical Sciences and Translational Medicine,“Sapienza” University of Rome, Via di Grottarossa 1035/1039, 00189 Rome, Italy.
Received: 27 December 2018 Accepted: 26 September 2019
References
1. World Health Organization. World Health Report 2002: Reducing Risks, Promoting Healthy Life. Geneva: WHO; 2002.
2. Grosso G, Marventano S, Buscemi S, Scuderi A, Matalone M, Platania A, Giorgianni G, Rametta S, Nolfo F, Galvano F, Mistretta A. Factors associated with adherence to the mediterranean diet among adolescents living in Sicily, Southern Italy. Nutrients. 2013;5(12):4908–23.
3. Grosso G, Galvano F. Mediterranean diet adherence in children and adolescents in southern European countries. NSF J. 2016;3:13–9.
4. Iaccarino Idelson P, Scalfi L, Valerio G. Adherence to the Mediterranean diet in children and adolescents: a systematic review. Nutr Metab Cardiovasc Dis. 2017;27(4):283–99.
5. Archero F, Ricotti R, Solito A, Carrera D, Civello F, Di Bella R, Bellone S, Prodam F. Adherence to the Mediterranean Diet among School. Children
and Adolescents Living in Northern Italy and Unhealthy Food Behaviors Associated to Overweight. Nutrients. 2018;10(9):1322.
6. Johansen A, Rasmussen S, Madsen M. Health behavior among adolescents in Denmark: influence of school class and individual risk factors. Scand J Publ Health. 2006;34(2):32–40.
7. El Ansari W, Stock C, Mikolajczyk RT. Relationships between food consumption and living arrangements among university students in four European countries - a cross-sectional study. Nutr J. 2012;11:28. 8. Moreno-Gómez C, Romaguera-Bosch D, Tauler-Riera P, Bennasar-Veny M,
Pericas-Beltran J, Martinez-Andreu S, Aguilo-Pons A. Clustering of lifestyle factors in Spanish university students: the relationship between smoking, alcohol consumption, physical activity and diet quality. Public Health Nutr. 2012;15(11):2131–9.
9. Sánchez-Ojeda MA, De Luna-Bertos E. Healthy lifestyles of the university population. Nutr Hosp. 2015;31(5):1910–9.
10. Lupi S, Bagordo F, Stefanati A, Grassi T, Piccinni L, Bergamini M, De Donno A. Assessment of lifestyle and eating habits among undergraduate students in northern Italy. Ann Ist Super Sanita. 2015;51(2):154–61.
11. World Health Organization. Global recommendations on physical activity for health. Geneva: WHO; 2010.
12. Simchon Y, Turetsky O, Carmeli E. Characterization of physical activity in undergraduate students in Israel. Int J Adolesc Med Health. 2016;29(6):1–6. 13. Yahia N, Wang D, Rapley M, Dey R. Assessment of weight status, dietary
habits and beliefs, physical activity, and nutritional knowledge among university students. Perspect Public Health. 2016;136(4):231–44. 14. Moulin MS, Irwin JD. An assessment of sedentary time among
undergraduate students at a Canadian University. Int J Exer Sci. 2017; 10(8):1116–29.
15. Teleman AA, de Waure C, Soffiani V, Poscia A, Di Pietro ML. Physical activity and health promotion in Italian university students. Ann Ist Super Sanita. 2015;51(2):106–10.
16. Italian Institute of Statistics. Indagine Multiscopo“Aspetti della vita quotidiana”, http://dati.istat.it/Index.aspx? DataSetCode=DCCV_INTRAT_ MUSEI; 2016 [accessed 12.12.18].
17. Maruf FA, Akinpelu AO, Nwankwo MJ. Perceived body image and weight: discrepancies and gender differences among university undergraduates. Afr Health Sci. 2012;12(4):464–72.
18. Laus MF, Costa TM, Almeida SS. Gender differences in body image and preferences for an ideal silhouette among Brazilian undergraduates. Eat Behav. 2015;19:159–62.
19. Vijayalakshmi P, Thimmaiah R, Nikhil Reddy SS, K BV, Gandhi S, BadaMath S. Gender differences in body mass index, body weight perception, weight satisfaction, disordered eating and weight control strategies among Indian medical and nursing undergraduates. Invest Educ Enferm. 2017;35(3):276–68. 20. Gallè F, Di Onofrio V, Arpesella M, Bacci S, Bianco A, Brandi G, Bruno S,
Anastasi D, Carraro E, Flacco ME, Giampaoli S, Izzotti A, Leoni E, Bertoncello C, Minelli L, Napoli C, Nobile C, Pasquarella C, Liguori G. Romano Spica V; SItI working group on movement sciences for health (GMSH). The role and working conditions of movement science students employed in sport and recreational facilities: an Italian multicenter study. Work. 2015;52(2):385–92. 21. Gallè F, Di Onofrio V, Barbone F, Brandi G, Calimeri S, Carraro E, Carraturo F,
Dallolio L, De Meo C, De Santi M, Fantuzzi G, Fortunato F, Gorrasi I, Guida M, La Milia DI, Leoni E, Lo Giudice D, Minelli L, Napoli C, Parpinel M, Pasquarella C, Prato R, Spica VR, Signorelli C, Tafuri S, Valeriani F, Liguori G. Investigating the role of physical education in physical activity promotion: an Italian multicenter study. J Phys Act Health. 2016;13(8):854–60.
Publisher’s Note
Springer Nature remains neutral with regard to jurisdictional claims in published maps and institutional affiliations.