Università degli Studi di Ferrara
DOTTORATO DI RICERCA IN
BIOCHIMICA, BIOLOGIA MOLECOLARE E
BIOTECNOLOGIE
CICLO XVII
COORDINATORE Prof. FRANCESCO BERNARDI
Ivabradine induces an atheroprotective gene
expression profile in the endothelium of ApoE
deficient mice before plaque formation
Settore Scientifico Disciplinare BIO-11
Dottorando Tutore
Dott. Aquila Giorgio Prof. Rizzo Paola
_________________________ _______________________
CONTENTS Pag.
INTRODUCTION
1. Overview on atherosclerosis 2. The structure the arterial blood vessels
3. Atherosclerotic plaque development 3.1 Initial steps of atherosclerosis 3.2 Progression of atherosclerotic lesion and advanced lesions ………
3.3 Complications of atherosclerotic lesions 4. Shear Stress: hemodynamic forces and molecular pathways ………
5. Ivabradine: a pure heart rate-reducing molecule ……… AIM OF THE STUDY
MATERIALS AND METHODS ……
1. Mice and ivabradine treatment 2. Heart rate measurement 3. Anesthesia 4. Cell culture 5. In vitro flow experiments
6. Immunofluorescence on HUVEC cells 7. RNA extraction from cells
8. Endothelial enriched-RNA extraction 9. Reverse Transcription and Real Time PCR 10. Microarray Analysis
11. En-face Analysis
12. Immunofluorescence on frozen section of aorta
RESULTS AND DISCUSSION
1. Validation of endothelial cells enriched-RNA extraction
2. PRELIMINARY EXPERIMENTS: Time course experiment and ivabradine treatment
2.1 Time course experiment: microarray analysis in endothelial cell transcripts-enriched RNA purified from aortas of 6, 7, 8 and 10 weeks old ApoE-/- mice
2.2 Heart rate reduction induced by ivabradine treatment 3. MAIN EXPERIMENT: Ivabradine treatment in ApoE -/- mice
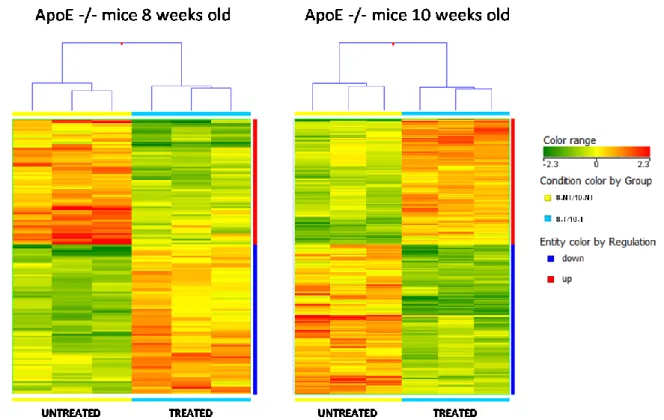
3.1 Microarray analysis in endothelial cell transcripts-enriched RNA purified from aortas of 8 and 10 weeks old ApoE-/- mice following treatment with ivabradine
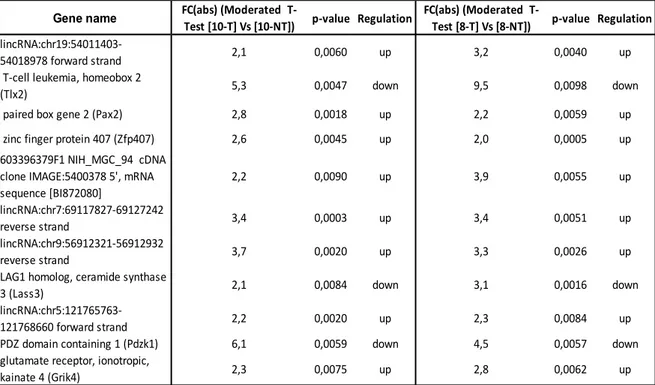
3.2 Identification of differentially expressed genes 3.3 Analyses of individual genes
3.4 Pathways classification and enrichment analysis
3.5 Ivabradine antagonizes NF-κB activation of target genes and Angiotensin II activation 3.6 qRT-PCR validation of microarray analysis results
3.7 En face analysis of endothelium: endothelial dysfunction and Hes5
4. The role of shear stress in ivabradine-mediated protective gene expression profile. Does ivabradine alter the shear stress forces on the endothelium?
4.1 Notch signalling modulation by in vitro shear stress system
4.2 Effect of shear stress on gene expression in endothelium of C57BL6/J mice aortic arch and thoracic aorta CONCLUSIONS Reference List 1 2 3 5 5 7 8 10 13 16 17 18 19 19 19 20 21 21 22 24 26 27 28 30 31 32 32 37 39 40 41 46 51 54 57 58 62 64 67 70 73
1. Overview on atherosclerosis
Atherosclerosis is one of the leading causes of death in the developed world and consists in a chain of chronic multistep inflammatory events that lead to formation of a hard structure called “plaque”. Atherosclerotic plaques could represent a risk factor in the development of thrombotic events that can cause heart attack and stroke [1].
The first description of atherosclerosis dates back to 1755, when the Swiss anatomist Albrecht von Haller proposed the term “atheroma”, from Greek “athere”, in describing any kind of gruel materials which composed the plaques that he had analyzed [Haller, Albrecht von. Observatio XXXXVII: materia ossium morbosorum. In: Opuscula pathologica. Lausanne: Bousquet; 1755. p. 124–8.]. Thus, he used the term “atheroma” to describe mellow plaques and he studied them in various stages, from the softer and yellowish plaques to the harsher and calcified ones.
The German-French surgeon Johann F. Lobstein coined the term “arteriosclerosis” in 1833 to describe the stiffening (hence “scleros” i.e. hardening) of the arterial wall due to atherosclerosis. He noticed that only some area of arterial tree was affected by this particular disease, in particular the aortic arch and its branches [Lobstein JGCFM. Traités d’anatomie pathologique. Paris: Chez F.G. Levrault; 1833. p. 550–3].
In 1904, the German pathologist Felix Jacob Marchand, by combining the terms “atheroma” of von Haller and “arteriosclerosis” of Lobstein, minted the term “atherosclerosis” which represents a subtype of “arteriosclerosis” that involves primarily the intima and innermost part of the media of medium-sized and large arteries [Marchand JF. Über arteriosklerose (athero-sklerose). Verh Kongresses Innere Medizin. 1904;21:23– 59].
The first pathological theory regarding the atherosclerosis was described in the mid-19th century by Karl von Rokitansky, who thought that atherosclerosis began with deposition of fibrin and other blood elements in the intima layer, which resulting degeneration, along with cholesterol crystals and fatty globules depositions, led to atheroma formation. In the same years, Rudolf Virchow proposed another theory, whereby the inflammation in the intima of arterial wall would be the major mechanism of plaque development and that the fibrous thickening evolves as a consequence of a reactive fibrosis induced by proliferating connective tissue cells [2].
The number of proposed theories on the pathogenesis, after these first descriptions, has gradually grown. Another theory proposed in the first decades of 1900 was the “lipid
hypothesis” which suggested that some diet constituents were involved in plaque formation, pointing out the importance of cholesterol as the major atherosclerotic risk factor. This theory led to “response-to-retention hypothesis” proposed by Williams and Tabas, which suggested that the augmentation of plasmatic LDL(s) was responsible of their retention in the inner arterial wall, where they are more susceptible to oxidation, triggering the inflammatory processes responsible for the development of atherosclerotic lesions [3]. In the last decades of 20th century, molecular biology studies furnished a new pathological theory, called “hypothesis of lesion reaction” which was proposed for the first time by Ross and Glomsett in 1976 [4]. They proposed that the atherosclerotic lesions were the result of focal injury to arterial endothelium, followed by adherence, aggregation and release of platelets. Since then, numerous studies have followed to define the causes and the molecular details of endothelial dysfunction.
To date, all of these main theories (inflammatory-, lipid- and lesion reaction-hypothesis i.e.) are closely linked to each other and not mutually exclusive in explaining the pathogenetic events which lead to atherosclerotic plaques formation.
2. The structure the arterial blood vessels
Arteries of medium and large caliber, responsible for blood transport from the heart to all body compartments, consist of three layers [5] (Figure 1). From vessel lumen to the outside we found:
- Tunica intima: the thinnest layer which consists a monolayer of endothelial cells
(ECs), the endothelium, above the basal lamina, a thin layer of loose connective tissue, and a sub-endothelial elastic lamina. The ECs play a pivotal role in integrity and function maintenance of vessel wall: they exert a barrier function, by producing a wide range of factors that regulate cellular adhesion, thromboresistance and vessel wall inflammation [6]. Moreover they control blood pressure by releasing vasoconstrictors or vasodilators and the trafficking of different kinds of agents which could participate in preliminar phases of atherosclerotic plaque formation. Internal elastic lamina, which is fenestrated to ensure nutritive substances from blood to reach the tunica media, and collagen fibers (and fibroblasts) of the basal lamina participate to vessel elasticity. - Tunica media: the thickest layer made of a connective stroma of collagen fibers which
synthesize elastic fibers and collagen. SMCs, which contain contractile actin fibers, tend to be longitudinally aligned and are strictly associated with collagen fibers. The elastic fibers, interposed between the SMC, are relatively extensible and responsible of blood pressure maintenance, by allowing contraction (during diastole) and distension (during systole) of the artery wall during a cardiac cycle.
- Tunica adventitia: the outermost layer made of a fibrous connective tissue, which
mostly contains SMCs, fibroblasts and, in larger vessels, nervous plexuses and lymphatic vessels. It is necessary for protecting the other layers below and allows them to be fixed to the surrounding tissues. In the largest arteries, such as aorta, this tunica is perfused by a system of small blood vessels, called vasa vasorum, that provide nutriments to the adventitia itself.
3. Atherosclerotic plaque development
In the development of atherosclerotic lesions, we can distinguish several stages: the initial processes that generate lesions clinically silent; the stages of the progression leading to the formation of a stenosis not necessarily symptomatic; the complicating events, at last, that are the basis of the clinical chronic or acute manifestations.
It is noteworthy that clinical onset of atherosclerotic lesions could have large variability due to the prevalence of one of these three main processes,which will be discussed below: 1) the accumulation of lipids in the sub-endothelium of the arteries 2) the establishment of an inflammatory status by infiltration of lymphocytes and macrophages which, engulfing lipids accumulated, become foam cells 3) migration and proliferation of smooth muscle cells (SMCs) with production of extracellular matrix [7]. Consequently, some atherosclerotic lesions appear predominantly dense and fibrous, whilst others can contain large amounts of lipid and necrotic debris, while most of them are the result of combinations of both characteristics.
3.1 Initial steps of atherosclerosis
The earliest events of atherosclerosis take place in the endothelium, the intima layer of artery walls. Normally an healthy endothelium exerts its antiatherogenic duty through the regulation of vascular tone and homeostasis, smooth muscle cells proliferation, platelet aggregation and adhesion, leukocyte migration, thrombosis and thrombolytic events [8]. Particularly, endothelial cells synthesize a wide range of autocrine and paracrine substances: for example, nitric oxide (NO), prostacyclin and histamin are involved into vasodilation while angiotensin, endothelin and serotonin are vasoconstrictors. The antithrombotic activity of endothelium is exerted through the secretion of antiaggregatory molecules, such as NO and prostacyclin, anticoagulatory molecules, (heparin and heparan sulfate), and through activation of fibrinolysis, by secretion of tissue plasminogen activator (t-PA) and plasminogen activator inhibitor-1 (PAI-I) [9].
It is evident that numerous biological pathways cooperate in ensuring vascular homeostasis and even a partial loss of their functionality can lead to endothelial dysfunction. The risk factors that contribute to the initial dysfunctions of atherosclerosis can be divided into two categories: systemic and hemodynamic. Among systemic factors, we find unchangeable
hemodynamic factors which contribute to endothelial dysfunction will be further discussed.
These pathological states are associated to pro-inflammatory stimuli and to the increase in oxidative stress, in particular, through the production of reactive oxygen species (ROS) [10]. High ROS levels cause a decrease in NO availability, which leads to vasoconstriction, smooth muscle cells proliferation and migration, platelet aggregation and leukocyte adhesion, all events that underlie plaque formation. Moreover low NO levels may induce caveolin 1-dependent oxidation of LDL cholesterol, which in turn inhibits endothelial NO syntase (eNOS) activity, causing a further reduction of NO synthesis [8]. LDL modification not only involves ROS but also other enzymes, such as myeloperoxidase which generates, from hydrogen peroxide and chloride, high levels of hypochlorous acid, that causes a further oxidation of lipoproteins [11]. Oxidation of LDL is known to be, along with endothelial dysfunction, one of the pivotal mechanisms of atherosclerotic plaque formation. Particularly, changes in the endothelial cells permeability cause a subendothelial retention of atherogenic cholesterol-containing LDL (Figure 2A) and numerous evidences suggest a tight link between high levels of circulating LDL and their accumulation, by a passive diffusion through EC tight junctions, in the subendothelial matrix [12]. LDL retention, mediated by interaction between LDL apoliprotein b (Apo B100) and matrix proteoglycans, predispose them to oxidative modification [13]; Oxidized LDL (oxLDL) in turn stimulate endothelial cells to produce adhesion molecules, such as Vascular Cell Adhesion Molecule 1 (VCAM-1) and Intercellular Adhesion Molecule 1 (ICAM-1), chemotactic molecules, such as Monocyte Chemoattractant Protein-1 (MCP-1), and growth factors, such as Macrophage Colony-Stimulating Factor (M-CSF)[14,15]. This “activated” status of endothelial cells mediate transmigration of T lymphocytes and monocytes through luminal endothelium in the intima. Here, monocytes proliferate and differentiate into macrophages (Figure 2B). The latter adopt a pro-inflammatory phenotype and encode a wide range scavenger receptors (LOX-1 and CD36 needed for oxLDL uptake) which in turn are stimulated by macrophages-produced cytokines, such as tumor necrosis factor α (TNFα) and interleukin-1β (IL-1β) [16]. This pro-inflammatory condition induces macrophages to constantly adsorb oxLDLs until they become like “foam cells” and their accumulation in the intima layer lead to fatty streaks formation (Figure 2B).
Figure 2: Atherosclerotic plaque formation. Alteration of endothelial cells permeability promotes lipids infiltration and
accumulation (A). Monocytes from blood flow penetrate into the intima, differentiate in macrophages and internalize lipids, forming foam cells (B). In response to pro-inflammatory cytokines and MMPs secretion, VSMCs proliferate and migrate (C), secrete extracellular matrix which form the fibrous cap of atheroma (D) [17].
3.2 Progression of atherosclerotic lesion and advanced lesions
Recruitment of smooth muscle cells (SMCs) from tunica media is involved in plaque formation, too (Figure 2C). Numerous growth factors (EGF, PDGF, TGF, VEGF) and hormones, such as Angiotensin II, activate uncontrollably the SMCs and they switch from a quiescent phenotype to a migratory and synthetic one. These “active” SMCs secrete high levels of metalloproteinases (MMPs), which promote SMCs migration from the media into the intima via degradation of SMCs’ membrane degradation [11]. Moreover, under the influence of cytokines and growth factors secreted by foam cells and T cells, SMCs synthesize extracellular matrix (ECM) proteins, resulting in pathogenic vascular remodeling and intimal stiffening [18,19].
These ECM molecules, including interstitial collagen and elastin, form a fibrous cap that covers the plaque and overlies macrophage-derived foam cells, some of which die by apoptosis and release lipids that accumulate in extracellular space. In the early stages of atherosclerosis the removal of apoptotic macrophages (efferocytosis), is efficient and stimulates production of anti-inflammatory cytokines, such as interleukin-10 (IL-10) and transforming growth factor-β (TGF-β). Vice versa in advanced lesions efferocytosis is compromised and necrotic macrophages, cellular debris and extracellular lipids form a lipid-rich pool called necrotic core (Figure 2D) [20]. The balance between fibrous cap and
plaques have high density of macrophages and a large lipid core topped by a thin fibrous cap [21]. Moreover, in lipid-rich plaque an important role is assumed by T lymphocytes, which elaborate high levels of interferon γ (IFN-γ). INF-γ inhibits SMCs proliferation and collagen synthesis, making plaques more prone to rupture. Conversely, stable plaques have a thick fibrous cap over a small fatty core and are rich in collagen. Thus, it is clear that two remodeling factors may operate during lesion formation: on one hand, SMCs stabilize the plaque by producing connective tissue preventing plaque rupture and, on the other hand, macrophages and T cells elaborate enzymes and cytokines respectively that weaken the plaque framework [22,23].
Plaque staibility may be influenced by calcification and neovascularization, processes which characterize advanced lesions.
Calcification, which reflects more stable lesions [24], consists in a gradual accumulation of mineral deposits, expecially hydroxyapatite, on death cells and extracellular lipids [25]. Moreover, in these plaques cell attachment proteins (osteopontin), proteins associated with calcium (osteonectin), and γ-carboxylated proteins that regulates mineralization (osteocalcin) were identified. Watson KE et al. demonstrated that TGF-β and 25-hydroxycholesterol stimulate bone morphogenetic protein-2, a powerful factor for osteoblastic differentiation, suggesting that calcification is a regulated process similar to bone formation [26].
Neovascularization consists in the growth of small vessels inside the plaque itself, mechanism highly influenced by inflammatory mediators and hypoxic signals. Monocytes and T-cells secrete factors such as fibroblast growth factor (FGF) and vascular endothelial growth factor (VEGF) that actively contribute to angiogenesis and, in turn, along with other cytokines (IL-6, MCP-1, TNF-alpha i.e.) and angiogenic factors (angiopoietin-2), stimulate inflammation and intraplaque hemorrhages, causing plaque instability and rupture [27,28].
3.3 Complications of atherosclerotic lesions
The evolution of the atherosclerotic lesions is extremely variable, so all the phenomena described for initial and late stages of atherosclerosis development may be more or less constant. Atherosclerosis’ last event is plaque rupture: the exposure of tissue factor (TF) to blood flow leads to coagulation cascade activation with recruitment of platelets and inflammatory cells. The interaction between exposed atheroma tissue debris, platelet receptors and coagulation factors leads to the formation of a thrombus which may
compromise the arterial lumen, hindering blood flow in situ [29]. Some of these thrombi can detach from lesion site and, following the blood flow, can reach a branching site of a small vessels, blocking the blood flow.
Atherosclerosis does not have any clinical onset until an internal lamina is 40% clogged with plaque and symptoms depend on which arteries are affected.
The occluding stenosis are usually characteristic of the late stage of the plaque evolution. The effects of the reduction of blood inflow to the tissues, are more or less serious depending on whether the supply of oxygen is absent or reduced.
The most common complications of atherosclerosis are:
1. Coronary artery disease: it consists in an ischemic process involving the arteries that supply blood to the heart, resulting in i) angina pectoris, chest pain due to insufficient oxygenation of myocardium ii) myocardial infarction, an injury due to blood flow impairment in an area of the heart iii) heart failure, when heart is unable to pump blood to all body districts.
2. Carotid artery disease: carotid arteries supply blood to the brain and their narrowing can cause i) stroke, a sudden loss of brain function due to ischemia and symptoms may include speech and breath impairment, loss of vision and coordination, severe headache and paralysis ii) transient ischemic attack (TIA), due to a temporary blood supply deficit in a small area of brain causing a momentary loss of neurological skills.
3. Peripheral artery disease: it involves narrowing of major arteries that supply blood to the arms, legs and pelvis. Usually the main clinical events are pain and numbness but if artery occlusion is extreme, it leads to tissue death (gangrene).
Along with these complications, there are other minor atherosclerotic events that may involve kidneys (renal artery stenosis), sex organs (erectile dysfunction), eyes (eye stroke) and abdomen (mesenteric ischemia).
Lastly, another complication is the aortic aneurysm, due to the collapse of vessel wall resulting in an abnormal dilatation of aorta, especially in the abdominal region. Aneurysm rupture is the most dangerous event that could happen with consequent internal bleeding, eventually resulting in death [30].
4. Shear Stress: hemodynamic forces and molecular pathways
As previously described, the endothelium can be considered as a thin barrier between blood flow and vessel wall and, therefore, it is exposed to different hemodynamic forces. Particularly it is exposed to three different forces: i) shear stress, which is the tangential frictional force of the flowing blood on the endothelium, and his magnitude is expressed in units of force per unit area (Newtons per square metre or Pascals or dynes per square centimetre; 1 N/m2 = 1 Pa = 10 dyn/cm2), ii) cyclic strain, the transumural force acting on the vessel wall, due to the pulsatile nature of blood flow and iii) hydrostatic pressure, the force that blood exerts on the vessel walls (Figure 3) [31].
Figure 3: Hemodynamic forces. Scheme of principal forces acting inside the blood vessels (adapted from Chatzizisis et
al. [32])
It has been well studied that endothelial cells are sensitive to those hemodynamic forces and, through mechanotrasduction, they convert a mechanic stress into a biological pathways, responsible for maintenance of vascular homeostasis. This process involves a wide range of mechanosensors (ion channels, receptors for tyrosine kinase, G protin-coupled receptors, junction proteins, integrins and membrane lipids i.e.) so that they under intensive study to understand the normal and pathological biochemical signals that they could generate [33].
Contextually to atherosclerosis, the geometric structure of the arterial tree has a pivotal role in regulating the hemodynamic forces which in turn modulate activation of
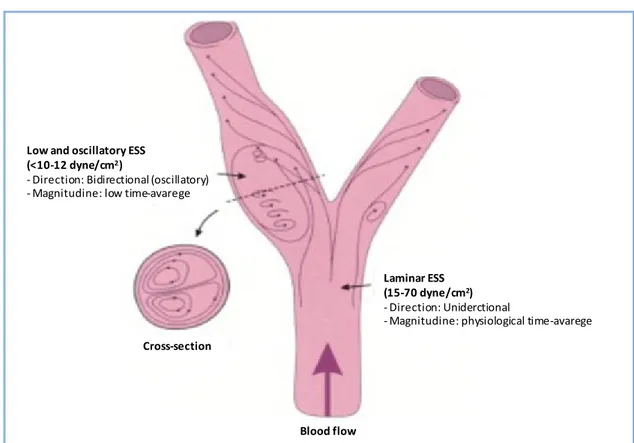
mechanosensors. In particular, shear stress has a critical role in determining where atherosclerotic plaques could form [34–36]. Endothelial SS (ESS) patterns are determined both by the pulsatile nature of blood flow in arteries and by the geometric structure of the vessels. Principally, in straight areas of vascular tree, the blood flow is laminar and the ESS is pulsatile and unidirectional (magnitude: 15-70 dyne/cm2), whereas in geometrically irregular regions, such as curves and branches, the blood flow becomes disturbed and underlies Low and Oscillatory ESS (LO ESS). Low ESS, which occurs at the inner areas of curvatures, as well as upstream of stenoses, is unidirectional and with a fluctuating magnitude, resulting in a low time average (magnitude <10 to 12 dyne/cm2) [32]. Oscillatory ESS, which occurs primarily at the lateral walls of bifurcations, in the vicinity of branch points and downstream of stenose, is bidirectional with a very low magnitude between systole and diastole (close to 0 dynes/cm2) (Figure 4).
Figure 4: Definition and example of laminar (pulsatile) and low and oscillatory shear stress (Image from Chatzizisis et
al. [32])
The link between ESS patterns and localization of atherosclerotic plaques was demonstrated for the first time in 1969 by Caro et al. [37] and, since then, numerous ex
vivo/in vivo investigations and computational fluid dynamic simulations were carried on in
the last years, showing that some areas of arterial tree subjected to LO ESS were more prone to plaques development [38–43]. These findings are supported by in vitro data
Low and oscillatory ESS (<10-12 dyne/cm2)
- Direction: Bidirectional (oscillatory) - Magnitudine: low time-avarege
Cross-section
Laminar ESS (15-70 dyne/cm2)
- Direction: Uniderctional
- Magnitudine: physiological time-avarege
showing that endothelial cells cultured under low shear stress show high ROS levels, whereas high, laminar shear stress is protective, inhibiting apoptosis. [44,45].
Moreover, still today, numerous studies are conducted with the aim to define the shear stress patterns during systolic and diastolic phase of a cardiac cycle: in “linear” areas of the vasculature, where laminar shear stress occurs, during systole, the highest values of shear stress magnitude are reached, whereas during diastole the magnitude values are lower but still positive, indicating that in these districts blood flow is always arranged in ordered laminar patterns and his pulsatile nature causes only a variation of shear stress magnitude into a high-protective range. At the areas with a complex vascular geometry, such as the aortic arch, blood flow is organized in separated flow patterns and, as previously mentioned, LO ESS occur. Here, the shear stress exhibited remarkably lower and oscillatory values in systole as compared with that in diastole, favoring atherosclerosis onset and progression.Since the early studies correlating the position of the human carotid plaque and LO ESS [46], the relevance of these studies lies in the fact that elevated heart rate, increasing the relative time spent in systole, as compared to diastole, would increase the exposure of areas prone to plaque development to the most atherogenic shear stress patterns [47,48].
Numerous studies seem to indicate that LO ESS has a cardinal role in all the steps towards atherosclerotic plaques formation:
- LO ESS stimulates LDL retention within the subendothelial area, by enhancing endothelial cells turnover and altering tight junctions between cells, resulting in more LDL infiltration [33]. Moreover, low ESS enhances the espression of LDL receptor by activating sterol regulatory elements binding pronteins (SREBPs), a process mediated by integrins [49]
- Unidirectional ESS stimulate NO production, through eNOS gene expression and protein activation, leading endothelial cells to a more physiological condition. Conversely LO ESS inhibits NO production and stimulates other vasoconstrictors, such as endothelin-1 [50,51]. Moreover, NO bioavailability is decreased by high ROS levels (as a result of an increased NADPH oxidase gene expression), which augments oxidative stress and LDL oxidation [52]. This inflammatory status leads to the activation of adhesion molecules (VCAM-1, ICAM-1) chemotactic molecules (MCP-1) and cytokines (TNF-α, IL-1 and IFN-γ) which sustain atherosclerosis progression. - LO ESS promotes SMCs migration from media to intima via ECMs degradation
through upregulation of pro-inflammatory stimuli, which stimulate MMPs synthesis by macrophages.
- LO ESS-mediated IFN-γ inhibits ECMs synthesis by SMCs and contemporarily induces SMCs apoptosis, sustained by TNF-α, IL-1β, affecting plaque stability [53]. - Downregulation of eNOS e t-PA genes mediated by LO ESS increases plaque
instability which, along with a simultaneous accumulation of platelets near the region of vascular wall subjected to low ESS, enhances thrombi formation [54].
- LO ESS promotes neovascularization by upregulating VEGF expression [55] and other angiogenic factors (angiopoietin-2 [56]). Along with increased inflammation, oxidative stress and MMPs synthesis, it enhances plaque instability.
- Bone morphogenic protein 2 and 4 (BMP2/4), which participate in plaque calcification, are upregulated in atherosclerotic lesions, and their inhibition reduces vascular calcification and atherosclerosis [57]. It has been seen that LO ESS stimulates BMP4 in ECs, inducing NADPH-mediated ROS production which, as previously described, enhances atherosclerotic lesion progression [58].
The evaluation of these pathway, along with the hemodynamic studies of the forces acting inside the artery vessels, could be a new diagnostic approach in identifying risk factors involved in development of atherosclerotic events [59].
5. Ivabradine: a pure heart rate-reducing molecule
Resting heart rate (HR) is regulated by spontaneous depolarization of sinoatrial node myocytes. These cells don’t have a true resting potential, but they generate spontaneous action potential. The depolarization is sustained by voltage-sensitive membrane mixed Na+-K+ inward current, namely the current funny (If), which was first described in the late
1970s and has been widely characterized in the last decades [60,61].
Pacemaker activity makes funny channels an obvious target for new drugs aiming at regulation of heart rate. The research on these drugs has become of great interest in light of the fact that the link between elevated heart rate and cardiovascular events is well established in patients with cardiovascular disease [62,63].
The amplitude of If current determines the slope of the diastolic depolarization phase and
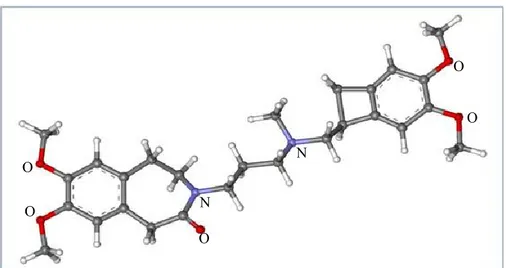
thereby the HR. Ivabradine ({7,8-dimethoxy 3-propyl}1,3,4,5-tetrahydro-2H-3-benzazepin-2-one) (Figure 5) decreases HR by specific and selective binding of hyperpolarization-activated cyclic nucleotide-gated (HCN) channels, particularly HCN4 isoform, which generate the If current in the sinus node, slowing the diastolic
Ivabradine blocks If channels by interacting with them from the intracellular side, when
they are in open state, indicating that it acts in current-dependent manner, since when the channels are closed it cannot reach its binding site [67].
Figure 5: Ball-and-stick model of ivabradine molecule. N: Nitrogen; O: Oxygen. The structure is taken from
ChemSpider.
Recent studies have demonstrated a protective effect of ivabradine on the vasculature (reviewed in [68]). In mouse models of mild (hApoB+/+ [69]), or severe (LDLr-/- hApoB+/+ [70]; ApoE-/- [71;,72;,73;,74]) dyslipidemia, ivabradine prevented endothelial dysfunction in several vascular beds (aorta, coronary, renal and cerebral arteries). Furthermore, ivabradine was able to reduce aortic plaque area in ApoE-/- [71;,73] and LDLr-/- hApoB+/+ [70] mice models of atherosclerosis fed a western diet.
The vascular effects of ivabradine were associated with a reduction of vascular oxidative stress (decrease of NADPH oxidase activity [71;,74] and eNOS uncoupling [74]), decrease of pro-inflammatory chemokine MCP-1 [71] and of AT1-R expression [74]. Ivabradine’s vascular effects are not the consequence of a lipid-lowering activity, since the drug did not alter cholesterol and triglyceride levels [69;,71;,74]. Additionally, at therapeutic relevant concentrations, ivabradine ex vivo (i.e. directly incubated with isolated arteries) had no effects on normal vascular physiology [69]. Interestingly, the in vivo beneficial effects of ivabradine on endothelial dysfunction could not be reproduced ex vivo [69;,71]. Taken together, these results indicate that a direct effect of ivabradine on vessels is unlikely, and suggest that the reduction of heart rate could be the primary mechanism of action of the drug.
In cynomolgus monkeys with elevated heart rate, coronary artery atherosclerotic lesions were more than twice as extensive as their lower heart rate littermate [75]. In young
post-O O O O O N N
myocardial infarction patients, a significant correlation was found between heart rate and severity and progression or coronary atherosclerosis [76]. In accordance with these observations, the reduction in resting heart rate by metoprolol, a beta-blocker, slows endothelial cell replication (a marker of dysfunction/activation) in psychologically stressed cynomolgus monkeys [77], while the reduction in resting heart rate by surgical ablation of the sinoatrial node slows the atherosclerotic process in the cynomolgus monkeys fed a high fat diet [78;,79].
AIM OF THE STUDY
Data from the literature support the detrimental effect of elevated heart rate in the pathogenesis of atherosclerotic plaques which are prone to develop in the arterial regions characterized by disturbed flow.
Numerous studies demonstrated that ivabradine limits atherosclerotic plaques formation in animal models. The mechanism of this protection is still unknown. It has been hypothesized that as heart rate decreases, following ivabradine treatment, the diastolic phase increases, thereby decreasing the exposure time of aortic arch endothelium to systolic flow, which is characterized by a more atherogenic low and oscillatory shear stress (Figure 6).
Figure 6: Schematic representation of systolic and diastolic phase during a cardiac cycle. Ivabradine
treatment (orange arrow) does not alter the systole (red bars) but prolongs the diastole (green bar).
The aim of this study was to determine the molecular effect of a short-term treatment with ivabradine in the initial steps of atherosclerosis development in an in vivo model of severe dyslipidemia (ApoE deficient-mouse) fed a standard diet.
1. Mice and ivabradine treatment
C57BL6/J and ApoE deficient mice were purchased from Charles River Laboratories (Wilmington, MA, US). In our animal facility, all animals were exposed to a semi-natural light cycle of 12:12 and were caged at room temperature (21-23 °C) with 55-60% of humidity. During the 6 days of acclimatation, all animals received water at libitum. At day 7 water was changed to ivabradine solution (15 or 30 mg/kg/day – Servier, France) for treating ApoE-/- mice. All animal studies were carried out according to the guidelines of the European (86/609/EEC) and the Italian (D.L.116/92) laws and after approval by the local ethical review panel of University Animal House and by the Italian Ministry of University and Research.
- Endothelial enriched-RNA extraction studies: preliminary experiments to determine the yield and the quality of RNA extraction from endothelium of mice aortic arches were conducted on ten 10-weeks old C57BL6J mice. Five 10-weeks old C57BL6/J mice were sacrificed to extract RNA from the whole aorta. Seven 10-weeks old C57BL6/J mice were sacrificed for qRT-PCR analysis of Notch components
- Time course experiment: sixteen 5-weeks old ApoE -/- mice were sacrificed when they reached the age of 6 (n=4), 7 (n=4) , 8 (n=4) and 10 (n=4) weeks.
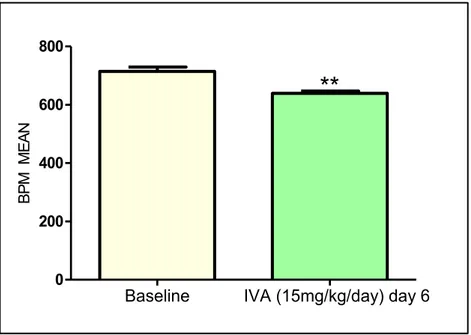
- Test ivabradine dose: to establish the exact dose of ivabradine treatment, ten 5-weeks old ApoE-/- mice, after one week acclimatation, were treated for one week with 15 mg/kg/day (n=5) or with 30 mg/kg/day (n=5) of ivabradine.
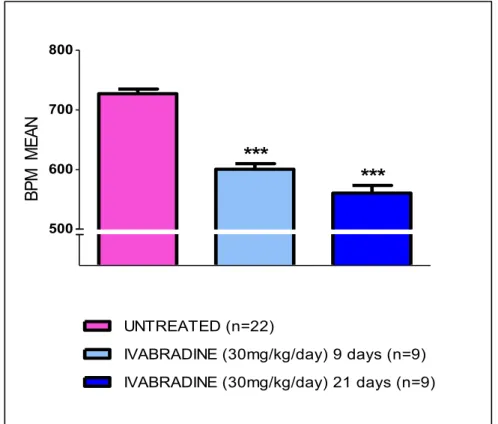
- Main experiment: twenty two 5-weeks old ApoE -/- mice, after one week acclimation, were randomly assigned them to four treatment groups receiving 1) 30 mg/kg/day of ivabradine for two weeks (n=9), 2) 30 mg/kg/day of ivabradine for four weeks (n=9), 3) and 4) no treatment for two (n=2) and four weeks (n=2).
- En-face studies: for endothelial dysfunction studies thirteen 5-weeks old ApoE -/- mice were sacrificed when they reached the age of 10 (n=4), 18 (n=4) and 25 (n=5) weeks (no ivabradine treatment). Five 5-weeks old ApoE-/- mice, after one week acclimation, were treated for nineteen weeks with ivabradine (30 mg/kg/day) and then sacrificed when they reached the age of 25 weeks. For en-face analysis of Hes5 protein levels ten 5-weeks old ApoE-/- mice, after one week acclimation, were randomly assigned them to 2 treatment groups receiving 1) 30 mg/kg/day of ivabradine for four weeks (n=5) and 2) no treatment for 4 weeks. Eight 10 weeks old C57BL6/J mice were sacrificed for en-face analysis of Notch components.
2. Heart rate measurement
Animals were not anesthetized during this procedure to avoid interferences with ivabradine treatment. To avoid stress which could affect heart rate, at least 2 days before heart rate measurement, mice chest was shaved at third and fourth intercostal space, next to the sternum. Mice were handled carefully, taking them from the neck and placed with head up. Heart rate was monitored by Doppler echocardiography (Vivid ECG, GE Healthcare Worldwide) and using a pediatric probe (Vivid cardiovascular ultrasound 12S R-S, GE Healthcare Wordlwide), by counting the number of waveforms registered per minute. During each procedure, 20 measurements (30 seconds each) were obtained and averaged for each individual animal. In treated mice of main experiment, heart rate was measured before the beginning of treatment (baseline) and one week before sacrifice (9 and 21 days for the 2 weeks and 4 weeks treatment groups, respectively). Results were expressed as mean ± SEM. Differences between groups were analyzed by unpaired t-test and p<0.05 was considered significant.
3. Anesthesia
All procedures that implied the sacrifice of mice were carried out by inducing a pharmacological coma with an overdose of Zoletil (100 mg/kg; Parnell Laboratories, Alexandria, NSW, Australia) and Dexdomitor (25 mg/kg; Zoetis, Florham Park, NJ, US). 4. Cell culture
Human umbilical vein endothelial cells (HUVECs) pools (Life Technologies, CA, US), were plated in gelatin-coated tissue culture dishes and maintained in phenol red-free basal medium M200 (Life Technologies, CA, US) containing 5% FBS and growth factors (LSGS, Life Technologies, CA, US) at 37°C with 5% CO2. Cells from passages 4 to 5
were actively proliferating (70–90% confluent) when subjected to cone and plate system studies for 24 hours.
5. In vitro flow experiments
To perform in vitro flow studies, a cone-and-plate flow apparatus was used. The cone is designed to fit into a 100-mm cell culture dish. The cone includes an upper lid that rests on the top of the dish to minimize the evaporation of the cell culture media. The lid also supports the free rotation of the cone on an axle secured by ball bearings and a setscrew, which controls the height of the cone from the cells plated in the cell culture dish. The cone is machined from a Teflon block to contain a 2.5-degree angle from its peak to its edge. Teflon does not typically bind proteins and additives from the media, and it does not interfere with cell viability. The cone can be smooth or grooved to mimic laminar or disturbed flows respectively. To rotate the cone, a magnetic stir bar is inserted into the cone that can be turned with a laboratory magnetic stirrer. The entire system (cone-and-plate and magnetic stirrer) is assembled in an incubator at 37 °C with 5% CO2 (Figure 7).
Figure 7: (A) Schematic representation of the cone and plate flow system. (B) Schematic representation of
the contact surface area of a smooth cone. (C) Schematic representation of the contact surface area of a grooved cone. Image adapted from [80].
HUVECs cultured in 100-mm dishes were exposed to S-flow at 50 dyn/cm2 (200 rpm) by using smooth cones or exposed to D-flow at 12.5 dyn/cm2 (50 rpm) by using grooved cones for 24 hours. The shear stress imposed on the surface of cells was calculated by the formula ωμ/θ where ω is the rotation speed, μ is the fluid viscosity, and θ is the angle of
the cone. After 24 hours, at least five random images were taken for each 100-mm dish using a phase contrast microscope with a 4X objective to monitor the cells status.
6. Immunofluorescence on HUVEC cells
HUVECs grown on 100-mm dishes were rinsed in ice cold PBS 1X, fixed in 4% PFA for 15 min and rinsed twice in PBS 1X. HUVECs were permeabilized in PBS 1X + 0.2% Triton X-100 for 20 minutes and, after washing three times with PBS 1X, blocked in blocking buffer (10% NGS/PBS + 2.5% Tween-20) for 1 hour at room temperature. Cells were then incubated with the relative antibodies overnight at 4°C, previously prepared in the same blocking buffer. The primary antibodies used were Ve-Cadherin (1:250; BD Pharmingen), Notch1 (1:250; Millipore, MA, USA) and Notch4 (1:250; Millipore, MA, USA).
After washing cells three times in PBS 1X, secondary antibodies, previously prepared in blocking buffer, were added and incubated for 1.5 hours rocking at dark and at 4°C.
The secondary antibodies used were Alexa Flour 546 donkey Anti-Rabbit IgG (1:2000; Life Technologies, CA, US) and Alexa Flour 488 Goat Anti-Mouse IgG (1:500; Life Technologies, CA, US). After washing three times in PBS, ProLong Gold antifade (Life Technologies, CA, US) mounting medium was added and cells were covered with a coversplip. At least 5 images for a single staining were acquired on Zeiss LSM 510 confocal microscope with 40x magnification. Results were expressed as mean ± SEM. Differences between groups were analyzed by unpaired t-test and p<0.05 was considered significant.
7. RNA extraction from cells
Total RNA was extracted using a commercially available kit (Qiagen, CA, USA). RNA concentration and purity were determined by Agilent 2100 Bioanalyzer (Agilent Technologies, CA, US). Protocol for RNA extraction is summarized below:
1. Completely aspirate the cell-culture medium and disrupt the cells by adding 700µl of Buffer RLT to the cell-culture dish. Collect the lysate using a scraper. Pipet the lysate into a 2ml tube. Vortex or pipet to mix, and ensure that no cell clumps are visible before proceeding to step 2.
2. Pipet the lysate directly into a QIAshredder spin column placed in a 2ml collection tube, and centrifuge for 2 min at full speed.
3. Add 1 volume (700µl) of 70% ethanol to the homogenized lysate, and mix well by pipetting.
4. Transfer up to 700µl of the sample, including any precipitate that may have formed, to an RNeasy spin column placed in a 2 ml collection tube. Close the lid gently, and centrifuge for 15 s at 8000 x g (10,000 rpm). Discard the flow-through and reuse the collection tube in step 5.
5. Add 700 μl Buffer RW1 to the RNeasy spin column. Close the lid gently, and centrifuge for 15 s at 8000 x g (10,000 rpm) to wash the spin column membrane. Discard the flow-through and reuse the collection tube in step 6.
6. Add 500 μl Buffer RPE to the RNeasy spin column. Close the lid gently, and centrifuge for 15 s at 8000 x g (10,000 rpm) to wash the spin column membrane. Discard the flow-through and reuse the collection tube in step 7.
7. Add 500 μl Buffer RPE to the RNeasy spin column. Close the lid gently, and centrifuge for 2 min at 8000 x g (10,000 rpm) to wash the spin column membrane.
8. Place the RNeasy spin column in a new 2 ml collection tube (supplied), and discard the old collection tube with the flow-through. Close the lid gently, and centrifuge at full speed for 1 min.
9. Place the RNeasy spin column in a new 1.5 ml collection tube. Leave the tube open under chemical hood for 5 min to remove all traces of ethanol.
10. Add 30–50 μl RNase-free water directly to the spin column membrane. Close the lid gently, wait 3-5 min and centrifuge for 1 min at full speed to elute the RNA and the place the samples on ice.
8. Endothelial enriched-RNA extraction
After anesthesia, mice were placed in supine position and locked with needles. The peritoneum was opened and the thoracic cavity was completely cut, exposing heart and lungs. Then the left common iliac artery was cut to drain blood. To facilitate this procedure, a 26g needle was inserted into left ventricle and the heart was perfused, by gravity, with ice cold saline. When the effluent was completely clear, aorta was quickly and carefully isolated and placed into a Petri dish containing a RNAlater solution (RNA stabilization solution, Ambion). Under stereomicroscope (SMZ745T 6x-50x, Nikon, Chiyoda, Japan) the adventitial layer and fat portion of the aorta was cleaned off by
straining the aorta oppositely with angled forceps. Aortic arch was isolated cutting the aorta at the border of the thoracic portion. A microloader tip (Eppendorf - Germany) was adapted to an insulin syringe and filled with 300ul of Qiazol lysis solution (Qiagen, USA).
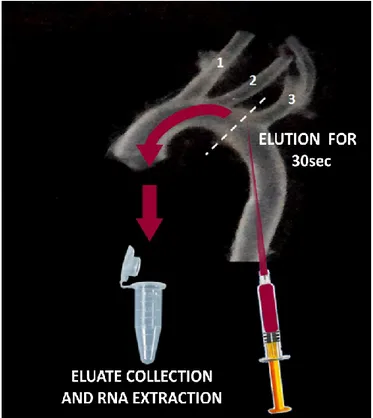
Figure 8: Scheme of technique utilized for flushing mice aorta. (1) Brachiocephalic trunk (2) Left common
carotid artery (3) Left subclavian artery.
As shown in Figure 8, the microloader tip was carefully inserted in the aortic arch until it reached the left common artery, entering from the previously removed portion of thoracic aorta. Aortic arch was flushed with Qiazol lysis solution for 30 seconds and the eluate was collected into a RNase-free microfuge tube. As a control, RNA was isolated from other whole arch after mechanical disruption of the tissue using a Dounce homogenizer. In both cases, RNA was extracted using a commercially available kit (miRNeasy mini kit - Qiagen, CA, USA). RNA concentration and purity were determined by Agilent 2100 Bioanalyzer (Agilent Technologies). Protocol for RNA extraction is summarized below:
1. Add other 400ul of Qiazol lyisis buffer to the eluate
2. Add 140 µl chloroform to the tube containing the homogenate and cap it securely. Shake the tube vigorously for 15 s.
4. Centrifuge for 15 min at 12,000 x g at 4°C. After centrifugation, heat the centrifuge up to room temperature (15–25°C) if the same centrifuge will be used for the next centrifugation steps. After centrifugation, the sample separates into 3 phases: an upper, colorless ,aqueous phase containing RNA; a white interphase; and a lower, red, organic phase. The volume of the aqueous phase should be approximately 350µl.
5. Transfer the upper aqueous phase to a new collection tube (supplied). Add 1.5 volumes (usually 525 µl) of 100% ethanol and mix thoroughly by pipetting up and down several times. Do not centrifuge.
6. Pipet up to 700 µl of the sample, including any precipitate that may have formed, into an RNeasy Mini spin column in a 2 ml collection tube. Close the lid gently and centrifuge at ≥8000 x g (10,000 rpm) for 15 s at room temperature (15–25°C). Discard the flow-through.
7. Repeat step 6 using the remainder of the sample. Discard the flow-through.* 8. Pipet 500 µl Buffer RPE onto the RNeasy Mini spin column. Close the lid gently
and centrifuge for 15 s at 8000 x g (10,000 rpm) to wash the column. Discard the flow-through.
9. Add another 500 µl Buffer RPE to the RNeasy Mini spin column. Close the lid gently and centrifuge for 2 min at 8000 x g (10,000 rpm) to dry the RNeasy Mini spin column membrane.
10. Transfer the RNeasy Mini spin column to a new 1.5 ml collection tube (supplied). Pipet 30–50 µl RNase-free water directly onto the RNeasy Mini spin column membrane. Close the lid gently and centrifuge for 1 min at 8000 x g (10,000 rpm) to elute the RNA.
9. Reverse Transcription and Real Time PCR
500 ng of total RNA (from cells) or 140ng of total RNA (pool from 2 aortas) were reverse transcribed in a volume of 25 ml using 250 units of SuperScript III reverse transcriptase and 50 ng of random hexamers. Here briefly report the protocol:
1. Mix and briefly centrifuge each component before use.
Random Primer (50ng/ul) RNA (500ng) dNTPs DEPC- water TOTAL
2,5 μl 4 μl 1,25 μl 8,5 μl 16,25 μl
3. Incubate at 65°C for 5 min, then place on ice for at least 1 min. 4. Prepare the following cDNA Synthesis Mix:
5x First Strand Buffer 0,1M DTT Rnase OUT SuperScript III RT TOTAL
5 μl 1,25 μl 1,25 μl 1,25 μl 8,75 μl
5. Add 8.75 μl of cDNA Synthesis Mix to each RNA/primer mixture, mix gently, and collect by brief centrifugation. Incubate as follows.
10 min at 25°C 50 min at 55°C
15 min at 85°C chill on ice.
2 µl of the cDNA mixture were used for realtime PCR experiments. Real-time PCR reactions were conducted on an Applied Biosystems 7500 Fast Real-Time PCR System using PerfeCta SYBR Green SuperMix with ROX kit (Quanta Biosciences, MD, US) according to the manufacturer’s protocol in a final volume of 25 µl. Primers concentration was 500 nM. The following primers were used:
Changes in gene expression were calculated by the 2−ΔΔCt formula using RPL13A as reference gene. Results were expressed as mean ± SEM. Differences between groups were analyzed by unpaired t-test and p<0.05 was considered significant.
10. Microarray Analysis
Time course experiment: Sixteen ApoE -/- mice (5 weeks old) were received and let acclimate for one week in our animal facility before extracting RNA from the first group (6 weeks old). RNA from 6-, 7-, 8- and 10-weeks old ApoE -/- mice was isolated by flushing the aortic arch and was purified using the miRNeasy mini kit, as previously described. 70ng of RNA from 2 mice in each age group of age, analyzed in duplicate, were pooled to obtain a final amount of 140ng. RNA from 8 samples was hybridized on a slide containing 8 slots as described in the following table:
ApoE-/- mice (n=4/group) Microarray Chip
6 weeks old ApoE 1 + ApoE 2 ApoE 3 + ApoE 4
7 weeks old ApoE 5 + ApoE 6 ApoE 7 + ApoE 8
8 weeks old ApoE 9 + ApoE 10 ApoE 11 + ApoE 12
10 weeks old ApoE 13 + ApoE 14 ApoE 15 + ApoE 16
Main experiment: Eighteen 5 weeks old ApoE -/- mice were received and let acclimate for a week in our animal facility before beginning treatment (30 mg/kg/day in drinking water ad libitum – 2 o 4 weeks treatment). At the end of the treatment, a microarrays analysis was conducted to characterize changes in the gene expression profile in endothelial cell-enriched RNA purified from aortas of 8 and 10 weeks old ApoE-/- mice, following 2 weeks and 4 weeks ivabradine treatment respectively. RNA quality and yield was determined by Agilent 2100 Bioanalyzer (Agilent Technologies).
70ng of RNA from 2 mice in each treated group were pooled to obtain a final amount of 140 ng (each treated age group was analyzed in triplicate – n=6 per group). The remain RNAs (3 samples at 8 weeks and 3 samples at 10 weeks) were kept aside for qRT-PCR analysis. Moreover we analyzed gene expression in RNA from 8 weeks (n=2) and 10 weeks old (n=2) ApoE-/- mice, which did not received treatment, to obtained a triplicate analysis for untreated mice by including data from the time course experiment.
Microarray Chip
ApoE 1 + ApoE 2 (8 weeks untreated) ApoE 3 + ApoE 4 (10 weeks untreated)
ApoE 5 + ApoE 6 (8 weeks treated) ApoE 11 + ApoE 12 (10 weeks treated)
ApoE 7 + ApoE 8 (8 weeks treated) ApoE 13 + ApoE 14 (10 weeks treated)
ApoE 9 + ApoE 10 (8 weeks treated) ApoE 15 + ApoE 16 (10 weeks treated)
For both experiments, all samples were hybridized on Agilent Whole Mouse Gene Expression Microarray (#G4122F, Agilent Technologies, Palo Alto, CA) and one-color gene expression was performed according to the manufacturer’s procedure. Labeled cRNA was synthesized from total RNA using the Low RNA Input Linear Amplification Kit (Agilent Technologies) in the presence of cyanine 3-CTP (Perkin-Elmer Life Sciences, Boston, MA). Hybridizations were performed at 65°C for 17 hours in a rotating oven. Images at 5μm resolution were generated by Agilent scanner and the Feature Extraction 10.5 software (Agilent Technologies) was used to obtain the microarray raw data. Microarray results were analyzed by using the GeneSpring GX 11 software (Agilent Technologies). Data transformation was applied to set all the negative raw values at 1.0, followed by a quantile normalization. A filter on low gene expression was used to keep only the probes expressed in at least one sample (flagged as Marginal or Present). Differentially expressed genes were selected as having a ≥ 1.5-fold or ≥ 2-fold expression difference between the groups of interest and a p-value ≤ 0.05 or 0.01 at unpaired t test. Hierarchical clustering was performed using Manhattan correlation as a measure of similarity. To identify underlying biological pathways the differentially expressed genes were then analyzed using MetaCore™ (GeneGo, Inc., St. Joseph, MI, USA) or DAVID Bioinformatics Resources 6.7 (National Institute of Allergy and Infectious Diseases NIAID, NIH), web-based computational platforms designed for systems biology.
11. En-face Analysis
Mice were euthanized and orta was perfused with saline solution and fixed for 10 minutes with 4% paraformaldehyde. Aorta was excised, cleaned of fat and fibrous material in a Petri dish containing ice cold saline solution.
(described in [81]). Staining procedure was performed in 2 ml tube filled with enough buffers to cover the tissue. Aorta segments were blocked with 1 ml of blocking buffer (PBS 1X + 0.1% Triton X-100 +2% BSA) rocking at room temperature for 1.5 hours. Primary antibody incubations were performed overnight at 4°C. The primary antibodies used were Ve-Cadherin (1:100; BD Pharmingen), Hey2 (1:100; Millipore), Hes5 (1:100; Santa Cruz Biotechnology, Germany), Notch1 (1:100; Santa Cruz Biotechnology, Germany) and Notch4 (1:100; Santa Cruz Biotechnology, Germany). After washing the aortic segments three times in washing buffer (PBS 1X + 0.1% Triton X-100), secondary antibodies, previously prepared in blocking buffer, were added and incubated for 1.5 hours rocking at dark and at 4°C. The secondary antibodies used were Alexa Flour 546 Goat Anti-Rat IgG (1:500; Life Technologies, CA, US), Alexa Flour 633 Goat Anti-Rabbit IgG (1:500; Life Technologies, CA, US). After washing three times, aortic specimens were placed on a glass slide with the intima side up and, before covering samples with a coverslip, a drop of a liquid mountant was applied directly to fluorescently labeled tissue samples (ProLong Antifade Reagents – Life Technologies, CA, US). At least 5 images of the endothelial monolayer were obtained using a Zeiss LSM 510 confocal microscope with 40x magnification. Results were expressed as mean ± SEM. Differences between groups were analyzed by unpaired t-test and p<0.05 was considered significant.
12. Immunofluorescence on frozen section of aorta
Mice were euthanized and aorta was perfused with saline solution to flush blood inside the aorta itself. The portion of aorta corresponding to the aortic arch was isolated and snap-frozen in blocks of OCT gel. Longitudinal sections (10 µm thick) were placed on Superfrost Ultra Plus adhesion slides (Thermo Scientific- Waltham, MA, US) (3 sections per slide) and left dry for 2 hours at room temperature. Slides were fixed in ice-cold acetone for 15 min and left dry under chemical wood for 30 minutes. The surplus of OCT was discarded, using a scalpel, and a circle was drawn around every section, using a PAPpen (Ab2601 - Abcam - UK), to perform staining procedure. Slides were submerged in blocking buffer (PBS 1X + 0.1% Triton X-100 +2% BSA) for 1.5 hours.
Primary antibody incubations were performed overnight at 4°C. The primary antibodies (prepared in blocking buffer) used were Ve-Cadherin (1:100; BD Pharmingen) and Hes5 (1:100; Santa Cruz Biotechnology). After washing the aortic segments three times in PBS 1X, secondary antibodies, previously prepared in blocking buffer, were added and incubated for 1.5 hours rocking in the dark, at 4°C.
The secondary antibodies used were Alexa Flour 546 Goat Anti-Rat IgG (1:500; Life Technologies, CA, US) and Alexa Flour 633 Goat Anti-Rabbit IgG (1:500; Life Technologies, CA, US). After washing three times in PBS 1X, a drop of a liquid mountant (ProLong Antifade Reagents - Life Technologies, CA, US) was applied directly to fluorescently labeled tissue samples and covered with a coverslip. Images of the endothelial monolayer were obtained using a Zeiss LSM 510 confocal microscope with 40x magnification. At least 10 images were acquired for a single staining.
Image analysis was performed using ImageJ, an open source bioimaging software. Red signal, corresponding to VE-cadherin staining, was binarized and used as a mask image to select positive signal in correspondence of endothelium. Such a mask image was used to filter the raw signals for Hes5 (green channel) and to select the region of interest (ROI) where it co-localized with red signals. The average fluorescence intensities were calculated for each sample as described in [82]. The data obtained with this approach were compared with data obtained by manually conducted analyses. Specifically, a ROI corresponding to the endothelium (VE-cadherin staining), was manually selected within a box. The ROIs selected for each VE-cadherin staining were placed into the same images for HES5 staining (green channel) and the ratio pixel signal intensity levels for each ROI were recorded (described in [83]). Results were expressed as mean ± SEM. Differences between groups were analyzed by unpaired t-test and p<0.05 was considered significant.
1. Validation of endothelial cells enriched-RNA extraction
In order to increase the specificity of microarrays we attempted to isolate RNA from endothelium only, using the method described by Krenek P et al., [84]. Aortic arch of five 10 weeks old C57BL6/J mice were flushed with different volumes of a phenol containing solution to achieve efficient lysis of endothelial cells only: more than 350 µlof Qiazol lysis buffer caused a disgregation of the whole arch, conversely smaller volume of lysis buffer resulted in insufficient RNA yield (data not shown). Noteworthy, to obtain an efficient RNA extraction and to avoid aorta dissolution, it was needed to constantly perfuse the aorta for not more than thirty seconds. As expected, this method gave a low yield of RNA (150-600ng from one arch, n=5 10 weeks old C57BL6/J ) nevertheless every target gene was successfully amplified by qRT-PCR (Figure 9A). RNA was also isolated from the whole arch after mechanical disruption of the tissue using a Dounce homogenizer and the same lysis buffer used for flushing the aorta. This method gave good yield and good quality RNA (1.5 ug total RNA from one arch). Successful endothelial enriched-RNA extraction was confirmed by measuring mRNA levels of endothelial and smooth muscle specific genes (eNOS and SM22 respectively). As shown in Figure 9B, RNA extracted from endothelium only was enriched with eNOS and depleted of SM22 compared to RNA purified from whole aorta.
Figure 9: (A) Fluorescence amplification curves of tested genes; (B) Enrichment of endothelial specific
markers in RNA extracted by the flushing technique: difference in eNOS and SM22 mRNA levels is shown by difference of relative Ct numbers (W-AORTA= RNA from whole aortic arch, E-AORTA:RNA from endothelium only).
2. PRELIMINARY EXPERIMENTS: Time course experiment and ivabradine treatment dose
The aim of these experiments was to establish i) the age to start the ivabradine treatment and the duration of treatment ii) the dose of ivabradine.
2.1 Time course experiment: microarray analysis in endothelial cell transcripts-enriched RNA purified from aortas of 6, 7, 8 and 10 weeks old ApoE-/- mice To assess the age of the onset of changes in gene expression in the endothelium of ascending aorta and, thus, to determine the beginning and duration of ivabradine treatment, we compared the gene expression profile in 6, 7, 8 and 10 weeks old ApoE-/- mice. The time point of 6 weeks-old was chosen for ivabradine treatment start because it corresponds to the early stage of atherosclerosis development in chow-fed ApoE-/- mice (i.e. before start of monocyte adhesion) [85]. Whereas it has been reported that in ApoE-/- mice fed a normal diet, signs of atherosclerosis progression (monocyte adhesion, foam cell lesion) are present at 10 weeks of age [85], there are not many data available on changes in gene expression in the endothelium of aortic arch of younger mice fed the same diet. Therefore, we included in our analyses a group of mice to be sacrificed at 10 weeks of age as positive control for atherosclerosis progression and as validation of methodologies utilized for our study.
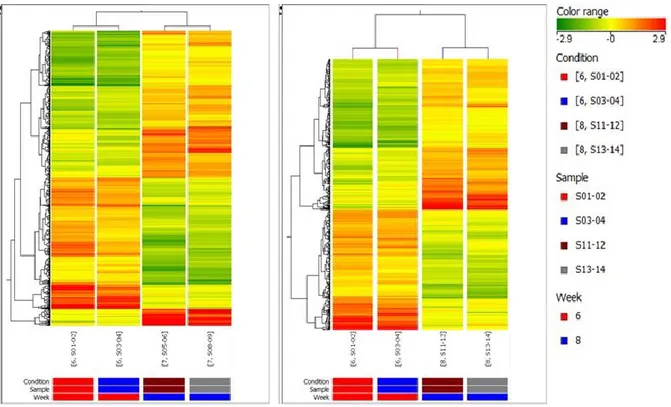
The overall quality of the expression chip was examined and all quality assessment variables were within the acceptance limits suggested by the manufacturer. In order to verify , in agreement with the literature, if we could detect under our experimental conditions changes in expression of atherosclerosis-associated genes at 10 weeks, we analyzed differences in gene expression between 6 weeks and 10 weeks (Figure 10 – left panel). The total number of genes significantly modulated between these two time points was 1080 (fold change cut-off: 2.0). Among these genes, 308 were down-regulated and 92 were up-regulated more than 4-fold. These same genes showed instead variable expression in 7 and 8 weeks old mice (Figure 10 – right panel ). We detected changes in 137 uncharacterized expressed sequence tags (ESTs), 102 Riken cDNA sequences (sequences with open reading frames coding for unknown proteins) and 202 long intergenic non-coding RNAs (lincRNA)
Figure 10: Left: Heatmap of gene expression hierarchical clustering comparing samples at 6 weeks versus
10 weeks. The represented genes were sorted out filtering values that were significantly differentially expressed between 6 and 10 weeks. Each column of data represents 1 of the 2 replicate experiments (pool of 2 aortas). Right: Heatmap of gene expression hierarchical clustering comparing samples at 6 weeks versus 10 weeks including expression levels of the same genes at 7 and 8 weeks.
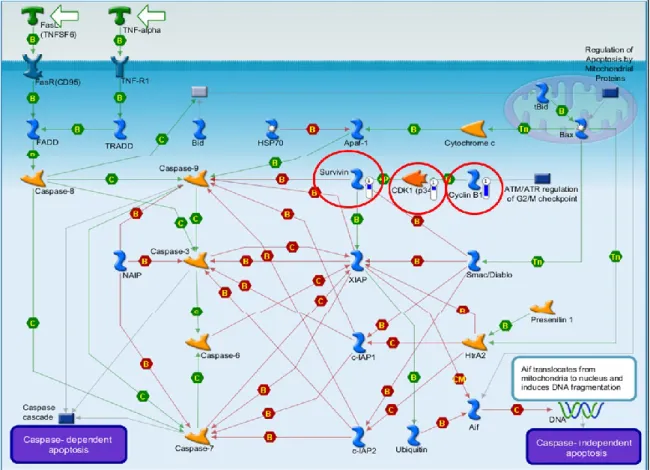
The analysis of the affected pathways (MetaCore analysis) identified pathways involved in modulation of cell cycle, cell adhesion, immune response, atherosclerosis and apoptosis. We found downregulation of cyclin B1, cdk1, and survivin (an inhibitor of caspase 9) (Figure 11), which suggests apoptosis following G2/M cell cycle arrest [86,87]. Increased apoptosis was suggested also by up-regulation of Phap1, a stimulator of mitochondrial apoptotic pathway. We found significant differences in the expression of genes for chemokine receptors and their ligands (Ccl3, Ccr7, Ccr9, Ccrl1), for interleukins and their receptors (Il10ra, Il17rb, Il18bp, Il5ra, Il7r) and for the matrix metallopeptidase 9 (Mmp9).
Figure 11: GeneGo pathway analysis. Down-regulation of cyclin B1, cdk1, and survivin (highlighted by red
circles) is indicated by blue thermometer.
Since microarray data showing significant changes (above 2-fold) derived from low signal intensities maybe biased or masked by noise whereas a 1.4-fold change derived from strong signal intensities may reflect actual changes in mRNA concentration within a biological sample [88], we also checked genes giving a strong hybridization signal that showed changes progressing with time even if they not always reached statistical significance. Using this approach we identified additional chemokine receptors and their ligands (Ccl17, Ccl4, Cxcl17, Ccr6, Ccr9, Cxcr2, Cxcr5), interleukins and their receptors (Il1b, Il10ra, Il17rb, Il18bp, Il20rb, Il25) and cadherins 16 and 18. Of interest, since calcium signalling pathway is known to be involved in the inflammatory process of atheroscleros [89] and Clca1 has been shown to regulate endothelial cell permeability [90], we found a strong down-regulation of Clca3 (chloride channel calcium activated 3 gene, down-regulated 29-fold). Rag1 and Rag2 (recombination activating gene 1 and 2), involved in modulation of inflammation by controlling maturation of T and B cells [91] were downregulated 19.1- and 10.5-fold respectively and Mmp12 (matrix metalloproteases 12), associated to initiation of atherosclerosis [92], was up-regulated 3-fold.
We found upregulation of SerpinA3i (serine (or cysteine) peptidase inhibitor, clade A,member 3I) which belongs to family of protease inhibitors and is highly expressed in
ApoE-/- mice lesions compared with lesion-free vessels [93]. Moroever, Serpina3k (serine (or cysteine) peptidase inhibitor, clade A, member 3K), which protects retinal cells from oxidative stress-induced cell death [94], was downregulated 16-fold. We didn’t detect changes in expression of ICAMs, VCAMs and MCP-1 at 10 weeks. Among the other modulated genes we identified: ATP-binding cassette, sub-family B (MDR/TAP), member 1A (Abcb1a), synaptogyrin 1 (syngr1) , complement component 1- q subcomponent- alpha polypeptide (C1qa), ring finger protein 149 (rnf149) , lipocalin 2 (Lcn2), interleukin 7 and 10 receptors (Il7r e Il10ra), RIKEN cDNA 5430435G22 gene (5430435G22Rik), Harvey rat sarcoma virus oncogene (Hras1), hepatocyte growth factor (Hgf), extra cellular proteinase inhibitor (Expi), ATP-binding cassette, sub-family C, member 3 (Abcc3). All these genes were previously identified by Tabibiazar and colleagues as associated to progression of atherosclerosis in ApoE-/- mice [95]. Interleukin 1 b (Il1b) was up-regulated (2.27-fold) as observed in endothelial cells Weibel-Palade bodies following an inflammatory stimulus [96]. This overlapping with published data is a validation of our methodology and analysis algorithm.
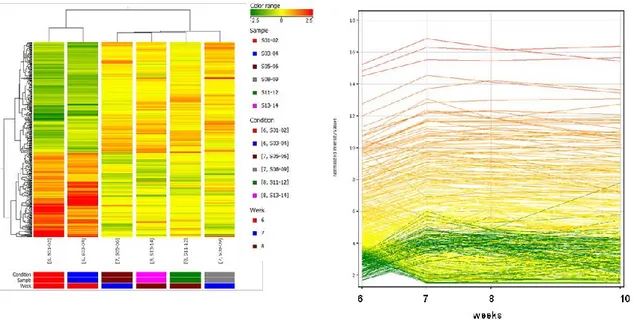
A statistical analysis of changes of gene expression at 7 weeks compared to 6 weeks (Figure 12, left) identified 603 genes (fold change cut-off: 2). Among these genes, 105 were up- or down-regulated more than 4-fold. We indentified changes in 34 uncharacterized ESTs, 50 Riken cDNA sequences and 169 lincRNA. Among the affected pathways we identified pathways related to immune response (including 2 pathways associated to oncostatin M involved in atherosclerosis progression [95]), atherosclerosis and cell adhesion. Of interest among these genes, we identified up-regulation of a chemokine receptor (Ccrl1) and ligands (Ccl11, Ccl12) and down-regulation of cadherin 1 (cdh1). Ccl2 (MCP-1) was up-regulated but not ICAM and VCAM. Svep1 (coding for a protein that includes complement binding motifs, von Willebrand factor (vWF-A) type A domain, Epidermal Growth Factor (EGF) and EGF-like calcium binding and pentraxin domains) involved in the regulation of expression of ICAM1 and E-selectin [97] was up-regulated 2.2-fold.
A statistical analysis of changes in gene expression at 8 weeks compared to 6 weeks (Figure 12, right) showed 538 genes affected (fold change cut-off: 2). 84 genes were up- or down-regulated more than 4-fold. We found changes in 118 lincRNA, 20 uncharacterized ESTs and 64 Riken cDNA sequences. Among the pathways identified there were some
among the modulated genes we identified up-regulation (Ccl8, Ccrl1) and down-regulation (Ccr7) of chemokine receptors and ligands. We found upregulation of Ccl2 (MCP-1) but we didn’t detect changes in ICAMs and VCAMs genes at 8 weeks.
Figure 12: Heatmap of gene expression hierarchical clustering comparing samples at 6 versus 7 weeks (left
panel) and 6 versus 8 weeks (right panel). The represented genes were sorted out filtering values that were significantly differentially expressed at 6 weeks versus 7 and 8 weeks.
As shown in Figure 13, many of the genes affected at 7 weeks followed a similar trend at 8 weeks (398 genes) (Figure 13, left) and maintained the same expression level at 10 weeks (Figure 13, right). 40 genes in this group were up- or down-regulated more than 4-fold. Among them there were chemokine receptors and ligands (Ccl8, Ccrl1, Ccr10, Ccr7). Of interest, a transcript containing sequences for von Willebrand factor A domain containing 3B (Vwa3b-003) was regulated at 7, 8 and 10 weeks. We also found up-regulation of platelet-activating factor receptor (Ptafr) , which has been shown to dissociate endothelial cells adherens junctions [98].