COMPOSITES OF POLYMER BLEND MATRICES WITH
CELLULOSE FIBRES
3.1 Introduction
Ethylene vinyl acetate (EVA) copolymers, due to their important rubber and resin properties are used for various applications in the field of packaging, adhesives/paper coatings, cable insulation, etc. [116]. EVA can also be modified by insertion of functional groups along the chain, i.e. by grafting with maleic anhydride [115], or by copolymerization with unsaturated monomers, such as GMA. Composites of (recycled) PP/EVA blends with cellulose fibres have been studied by Espert et al [118], who reported that EVA improved the resistance of the composites to water absorption.
In our previous studies we demonstrated that mixing of EVA-GMA copolymer with CFs gave rise to interfacial reactions between the components, resulting in good fibre dispersion and significant changes of the polymer matrix properties [144]. The epoxy groups of EVA-GMA chains can react both with COOH and OH end groups of polyester chains [145], and with OH groups of cellulose [144]. Moreover, due to its rubber-like behaviour EVA-GMA is expected to improve the tensile and impact behaviour of the materials. It is worth noting that super-tough poly(lactic acid) material was obtained by reactive blending of poly(lactic acid) (PLA) with a poly(ethylene-co-glycidyl methacrylate) copolymer [146]. Furthermore, poly(vinyl-acetate) was reported to be fully miscible with PLA in the melt [147].
Poly(lactic acid) is well known as a biocompatible, bioresorbable and biodegradable polymer superior to petrochemical polymers from the viewpoint of energy consumption and life-cycle (CO2 emission), since it can be obtained from
natural resources. However, the cost of production and some low mechanical performances of PLA still constitute limiting factors for its applications. As a consequence, several investigations have been focused on the production of mixtures of biodegradable natural and synthetic polymers. The addition of polyolefin components with biodegradable polymers has also been examined for obtaining improved properties and reduced cost [148-150]. The addition of natural fibres to polymers markedly increased the stiffness of the resulting material and also the strength, especially for low fibre content [151-154]. Some research papers deal with different fibre modification methods to optimize the composite’s mechanical characteristics. Cho et al. [155] prepared jute, kenaf and henequen fibre-reinforced PLA composites by compression moulding. The fibres surface was treated with tap water by static soaking and dynamic ultrasound, then interfacial shear strength, flexural properties, and dynamic mechanical properties were investigated. The characteristics of the polymeric resins were improved by incorporating the natural fibres into the resin matrix. Hu and Lim [85] studied the mechanical properties of compression moulded composites with different volume fractions and the effects of alkali treatment on the fibre surface morphology of hemp. Best results were found with 40% volume fraction of alkali-treated fibre bundles. Huda et al. [156] examined compression- moulded PLA laminated
composites reinforced with kenaf produced by film stacking method and studied the effect of fibre treatment by alkali and silane on the composite’s mechanical and thermal properties. Both treatments improved the mechanical properties. Scanning electron microscopy (SEM) showed better adhesion between treated fibres and matrix and an improvement of notched impact strength for a bast fibre PLA composite. Tokoro et al. [157] examined three kinds of injection moulded bamboo fibre (short fibre bundles, alkali-treated fibre bundles and steam-exploded fibre bundles) reinforced PLA. The highest bending strength was obtained with steam-exploded fibres. To improve clearly notched impact strength, samples were alternatively fabricated by hot pressing using medium length bamboo fibre bundles to counter the decrease in length at fabrication. Masirek et al. [130] prepared PLA composites with hemp fibres, and low molecular weight poly(ethylene glycol) (PEG) and PP6 by compression-moulding. Mechanical tests showed that the composite’s Young’s modulus markedly increased with the hemp content, in the case of crystallized PLA reinforced with 20 wt.% of hemp, whereas the elongation and stress at break decreased with increasing the amount of fibres. Serizawa et al. [158] examined PLA/kenaf composites and the effects of adding a flexibilizer (copolymer of lactic acid and aliphatic polyester). The results showed that the flexibilizer improved the strength of the composites. Avella et al. [87] studied the mechanical properties of neat PLA, compatibilized and uncompatibilized PLA/kenaf composites. They found significant improvement of flexural modulus as a function of kenaf fibre content. Higher modulus values were obtained in presence of the reactive coupling agent PLA-g-MA. Wong et al. [159] added hyperbranched polyesters (HBP) to flax/PLA composites. They hypothesized that HBP would reduce the brittleness of PLA by altering the morphology of the matrix. This could result in improved fracture toughness caused by better wetting of the fibres with the matrix when the HBP was present. With improved ductility of the matrix, it caused ductile tearing along the fibre–matrix interface during crack propagation.
The use of polymer blends as matrices in composite systems offers several advantages, such as the possibility to control the compatibility and the dispersion of the components - depending on their composition ratio and interfacial interactions - widening the spectrum of properties as well as the scope of applications. The combination of different polymers in the matrix can be also used to reduce the costs of raw materials. In the present system, we investigated the processability and properties of PLA/EVA-GMA blends and their composites (PLA/EVA-GMA/CF) with cellulose fibres of different type, obtained by melt mixing. The main aim of the work was that of improving the filler dispersion into the polymer matrix, the mixing processes and the main properties of PLA based composites by exploiting both the reactivity of EVA-GMA (toward cellulose) and the favourable interactions of PLA with vinyl acetate units. The morphology, the phase interactions, the crystallization processes as well as the thermal and mechanical properties of ternary PLA composites with cellulose fibres were thus examined as a function of composition.
3.2 Experimental
3.2.1. Materials
Poly(lactic acid) (PLA), trade name Hycail HM 1011, (density = 1.24 g/cm3, MFR = 2-4 g/10 min (190 °C/2.16 Kg) and melting point (MP) = 142 °C) was supplied from
Hycail. Ethylene-vinyl acetate-co-glycidylmethacrylate (EVA-GMA), trade name Elvaloy AS, was an epoxy modified ethylene terpolymer obtained from DuPont. Cellulose micofibres (CF1), trade name Technocel 165 (cellulose content: 75%;
bulk density> 70 g/l; sieving: 125 m (< 20%), 32 m (< 80%)) and cellulose microfibres (CF5), trade name Technocel 500-1, bulk density 60 g/l; sieving: 200
m (< 10%), 90 m (< 50%), 32 m (> 60%).- were kindly supplied by NEUCHEM (Milan, Italy). These fibres were used as reinforcement for composites with polymer matrices. In this thesis, Technocel 165 and Technocel 500-1 have been referred as CF1 and CF5 respectively. List of the employed polymers with their
molecular structure are reported in Table 3.1.
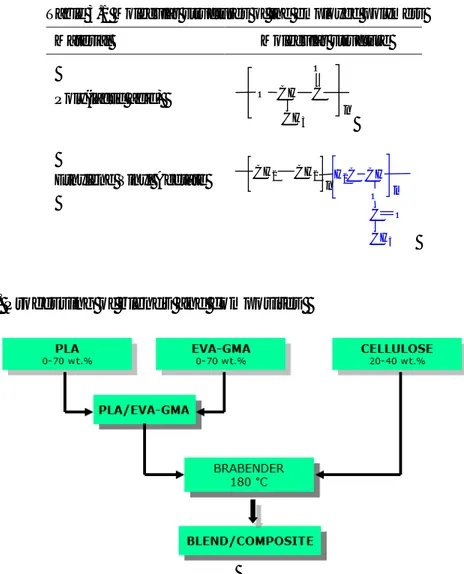
Table 3.1 Molecular structures of the employed polymers
Material Molecular structure
Poly(lactic acid) O CH
CH3
C O
n
Ethylene Vinyl Acetate CH2 CH2 H2C CH O
n m
C O CH3
3.2.2. Processing of blends and composites
Fig. 3.1 - Flow diagram for processing of PLA/EVA-GMA blends and PLA/EVA-GMA/CF composites.
Fig. 3.1 shows a flow diagram for the processing of PLA/EVA-GMA blends and PLA/EVA-GMA/CF composites. Blends of PLA and EVA-GMA were obtained by melt mixing the components. Binary PLA/CF and ternary PLA/EVA-GMA/CF composites (total amount: 40 g) were prepared in a Brabender Plasti-corder internal mixer at 180 °C, using a mixing speed of 60 rpm for 10 minutes: firstly, PLA was melt and then EVA-GMA was added; after 5 min mixing the fibres were added into the molten blend. For all samples torque moment was recorded during the mixing process as a function of time. Before mixing PLA and CF were dried under vacuum for 6 hours at 90 °C and EVA-GMA, at 60 °C. The prepared samples are enlisted in Table 3.2. The blends and composites were injection moulded in oar shape test specimen by using a Proma WL-5 micro-injector (Torun, Poland) operating at 170/40 °C.
Table 3.2 List of samples
Samples Sample code Compositions (wt.%) PLA/EVA-GMA/CF PLA/EVA-GMA 93/7 B7 93/7/00 PLA/EVA-GMA 85/15 B15 85/15/00 PLA/EVA-GMA 80/20 B20 80/20/00 PLA/EVA-GMA 70/30 B30 70/30/00 PLA/EVA-GMA 50/50 B50 50/50/00 PLA/EVA-GMA 30/70 B70 30/70/00 PLA/CF1 70/30 C00 70/00/30 PLA/EVA-GMA/CF1 65/5/30 C5 65/5/30 PLA/EVA-GMA/CF1 60/10/30 C10 60/10/30 PLA/EVA-GMA/CF5 60/10/30 C*10 60/10/30 PLA/EVA-GMA/CF1 50/20/30 C20 50/20/30 PLA/EVA-GMA/CF1 35/35/30 C35 35/35/30 PLA/EVA-GMA/CF1 20/50/30 C50 20/50/30 EVA-GMA/CF1 70/30 C100 00/70/30 PLA/EVA-GMA/CF1 75/5/20 C5F20 75/5/20 PLA/EVA-GMA/CF1 55/5/40 C5F40 55/5/40
3.3 Results and discussion
3.3.1. PLA/EVA-GMA blends
3.3.1.1 Morphology of blends
In order to analyse the phase continuity of PLA/EVA-GMA blends, films (thickness: 40-50 µm) of PLA and blends with 15, 20, 30, 50 and 70 wt.% of EVA-GMA were
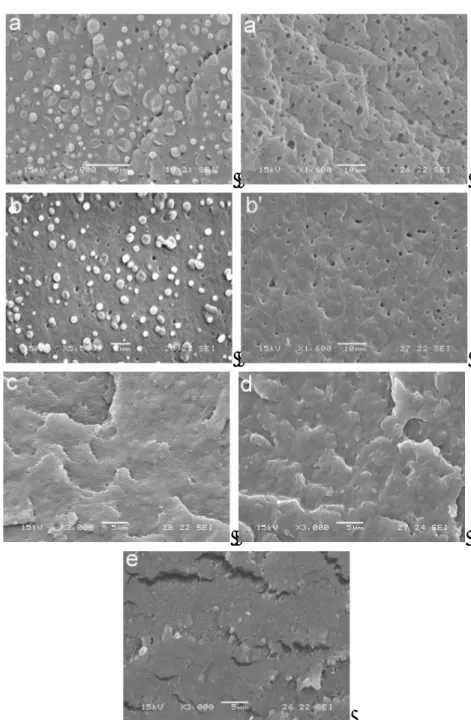
Fig. 3.2 - SEM micrographs of (a) B50, (a’) B50 (after extraction of PLA), (b) B70, (b’) B70 (after extraction of PLA), (c) B7, (d) B15 and (e) B30
prepared by hot pressing and extracted with acetone: the PLA sample used in the present study is soluble in acetone, whereas EVA-GMA is insoluble. The films were
soaked in acetone for three days. It was found that films of plain PLA and blends with EVA-GMA content 30 wt.% were completely destroyed, indicating that for these compositions PLA was the continuous phase. Films of blends with EVA-GMA content ≥ 50 wt.% were not destroyed, as PLA was the dispersed phase. These films were washed with fresh acetone and kept again in fresh acetone for more three days, then dried and analyzed by SEM. Micrographs of films of B50 and B70 before and after extraction of PLA are shown in Fig. 3.2. The occurrence of a droplet-like morphology (average size of about 2 m) for the dispersed PLA phase was clearly evidenced (Fig. 3.2a and b). The phase continuity of these blends was also confirmed by the weight loss measurement after solubilization in acetone. For different compositions of components different morphology were found. In all blends, -either PLA is continuous phase (B7, B15 and B30) or dispersed phase (B50 and B70) - the size of dispersed particle is 2 micron.
3.3.1.2 Crystallization behaviour of PLA matrix
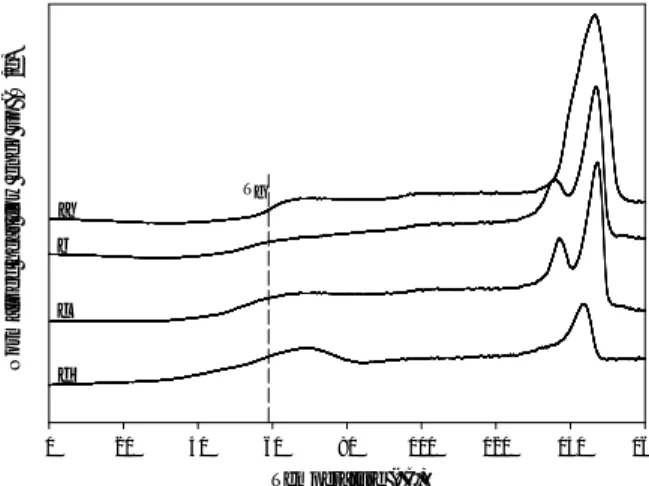
X-ray diffraction patterns of PLA and its blends with EVA-GMA (PLA and blends were annealed at 90 °C) in the 2θ range 0-50° are shown in Fig. 3.3. The patterns of PLA, B15 and B30 displayed characteristic crystalline peaks at about 3.8, 14.9, 16.8 and 19.1 of 2θ corresponding to the (001), (010), (200) and (203) planes respectively and other secondary peaks at higher 2θ values, which were all characteristic of the orthorhombic crystal structure of semicrystalline PLA [160]. On the other hand, the pattern of B50 showed an additional peak at 21.8°, which is related to the (110) plane of EVA [161]. The pattern of B70 did not display any crystalline peak related to PLA. The crystallinity of PLA and blends was calculated from the ratio of the areas of the main crystalline peaks to the overall diffraction area. It was found that the crystallinity of PLA was increaed from 47 % to 54 % in blends (except B70). 2-Theta 0 10 20 30 40 50 In te n s it y ( a rb it ra ry u n it ) B15 B30 B50 B70 PLA EVA-GMA
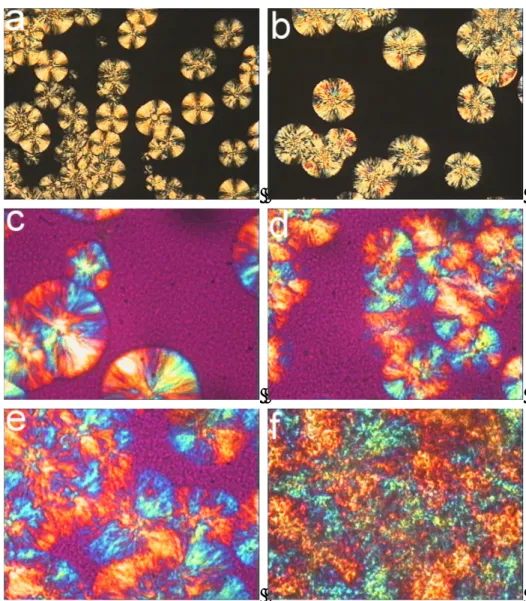
Fig. 3.4 – Polarized optical micrographs of (a) PLA (Tc = 110 °C, from melt), (b) PLA (Tc = 120 °C, from melt), (c) B15 (Tc = 120 °C, from melt), (d) B15 (Tc = 120 °C, from solid state), (e) B30 (Tc = 120 °C, from melt), (f) B30 (Tc = 120 °C, from solid state) during isothermal crystallization.
Polarized optical microscopy (POM) observation of neat PLA and PLA/EVA-GMA blends was carried out with a range (95-120 °C) of isothermal Tc. Fig. 3.4 represents polarized optical micrographs of plain PLA and PLA/EVA-GMA blends at various compositions during isothermal crystallization from melt and in the solid state at Tc = 120 °C. The spherulites were formed for neat PLA, B7, B15, B20 and B30 after isothermal crystallization, and spherulite sizes of PLA were systematically increased with increasing Tc (see Fig. 3.4a and b). In the case of neat PLA,
spherulites exhibited high ordered spherulitic texture. It should be mentioned here that PLA sherulites were not formed in POM observation for the B50 and B70 blends. Time (min) 20 40 60 80 100 120 140 160 S p h e ru lit e r a d iu s ( m ic ro n ) 0 10 20 30 40 50 PLA B7 B20 B30
Fig. 3.5 - Spherulite radius vs. crystallization time lines for PLA and PLA/EVA-GMA blends isothermally crystallized at Tc= 120°C.
EVA-GMA content (wt.%) 0 10 20 30 G ro w th r a te ( m icr o n /m in ) 0,0 0,2 0,4 0,6
Growth rate (from melt) Growth rate (from solid)
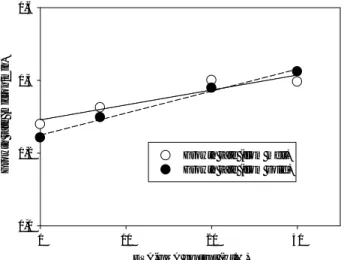
Fig. 3.6 - Isothermal growth rate of PLA spherulites in PLA/EVAGMA blends as a function of EVA-GMA content.
The diameter of the developed spherulites was measured with time during isothermal crystallization of PLA and blends using video recording system. It was
found (Fig. 3.5) that the size of PLA spherulites was larger in blends than in pure PLA, and the spherulites size increased with increasing EVA-GMA content. Fig. 3.6 shows the isothermal growth rate of PLA spherulites both from the melt and in the solid state as function of EVA-GMA content. The spherulites growth rate increased with increasing EVA-GMA content.
3.3.1.3 Tensile mechanical behaviour of blends
PLA content (vol.%)
0 20 40 60 80 100 E la s ti c m o d u lu s ( M P a ) 1 10 100 1000 10000 Experimental curve Theoretical line (upper bound)
Theoretical line (lower bound)
Theoretic
al line (C
oran and
Patel)
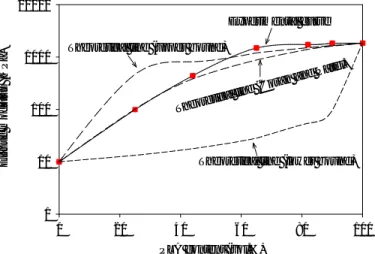
Fig. 3.7 - Theoretical and experimental curves of elastic modulus of PLA/EVA-GMA blends against PLA content.
Fig. 3.7 represents the theoretical and experimental volume dependence of elastic modulus for PLA/EVA-GMA blends. Experimental and theoretical modulus values of blends are reported in Table 3.3. The moduli of polymer blends generally range between an upper bound, EU, given by the parallel model [162]
EU= V1E1+ V2E2 (3.1)
and a lower bound, EL, given by the series model [162]
1/EL= V1/E1+ V2/E2 (3.2)
in which Ei and Vi are the modulus and volume fraction of phase i. Although the
parallel and series models are, strictly speaking, valid only for simple and idealised structures, they are frequently used as limiting models regardless of morphology. The phase morphology of the polymer blends frequently varies with compositions. For variable morphology, Coran and Patel [163] proposed an equation, which is intended to account for phase inversion at a certain composition of the blend. The modulus is expressed as a function of the upper and lower bounds using a fit
parameter n, which is supposed to depend on wetting and compatibility and to give a point of phase inversion as V= (n-1)/n.
E= Vn2(nV1+1)(EU-EL) + EL (3.3)
In this case, V= 0.44 (volume fraction of PLA in B50) and n = 1.8. The experimental moduli of the blends are more or less fitted with equation 3.3 given by Coran and Patel. When PLA is continuous phase then the moduli of the blends are higher than the ones calculated by equation 3.1-3.3. On the other hand when PLA is dispersed phase then the moduli of the blends follow the Coran and Patel equation perfectly.
Table 3.3 Experimental and theoretical elastic modulus of PLA/EVA-GMA blends
Elastic modulus (MPa)
Samples PLA (Vol.%)
Experimental EU EL ECP EVA-GMA 00 10,0 10,0 10,0 10,0 B70 25 99,0 467,0 13,3 101,2 B50 44 439,0 814,0 17,8 382,0 B30 65 1490,0 1198,0 28,2 878,5 B15 82 1728,0 1509,0 54,1 1401,8 B7 90 1833,0 1656,0 95,2 1618,0 PLA 100 1839,0 1839,0 1839,0 1839,0
EU, EL, and ECP are theoretical elastic modulus of PLA/EVA-GMA blends calculated by upper
bound, lower bound and Coran and Patel models respectively.
EVA-GMA content (vol.%)
0 20 40 60 80 100 T e n s ile s tr e n g th ( MP a ) 0 10 20 30 40 50 60 E lo n g a ti o n a t b re a k ( % ) 0 50 100 150 200 250 Tensile strength Elongation at break
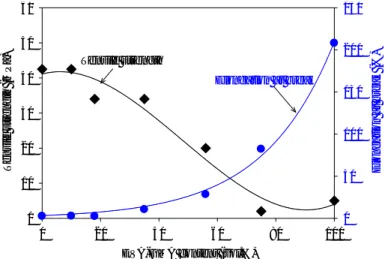
Fig. 3.8 - Tensile strength and elongation at break of PLA/EVA-GMA blends vs EVA-PLA/EVA-GMA content.
Fig. 3.8 represents tensile strength and the elongation at break values against EVA-GMA content in PLA/EVA-GMA blends. The strength of blends decreased gradually with increasing GMA content due to the lower strength of EVA-GMA. Whereas a perfect exponential growth correlation was found for elongation at break values of blends. The curves can be fitted with exponential regression equation y = aebx, where y is elongation at break, x is EVA-GMA volume fraction and a, b are constant (a = 3.277, b = 0.016).
3.3.2. PLA/EVA-GMA/CF composites
3.3.2.1 Morphology
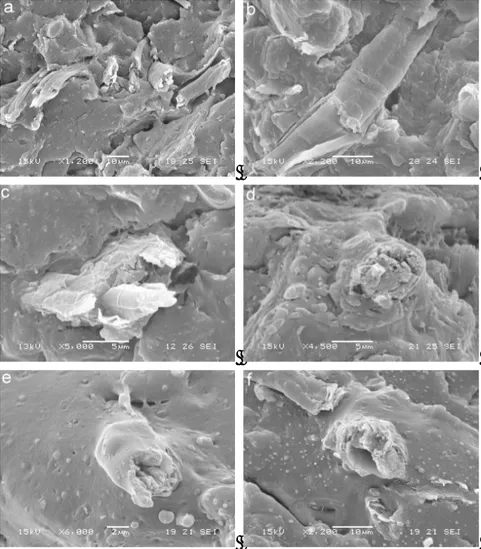
Fig. 3.9 - SEM micrographs of (a) C00, (b) C5, (c) C10, (d) C20, (e) C35 and (f) C50.
Fig. 3.9 shows the scanning electron micrographs of PLA/CF and PLA/EVA-GMA/CF blend composites. In the SEM micrographs of blend composites, it is seen that the cellulose fibres are completely wetted by PLA/EVA-GMA blends (particularly in Fig. 3.9d-f). Upto 20 wt.% of EVA-GMA in composites (30 wt.% in blend) PLA is the continuous phase and EVA-GMA is the dispersed phase (as discussed earlier). On the other hand, above 35 wt.% of EVA-GMA in composites (50 wt.% in blend) the dispersed phase is PLA. The interfacial adhesion between CF and plain PLA is poor due to the hydrophilic nature of cellulose (Fig. 3.9a). However, the occurrence of partial interfacial adhesion between PLA and CFs has been reported in some case [84]. On the other side, microscope observations showed a very good dispersion of celluose fibres in EVA-GMA matrix, suggesting a high interfacial adhesion in their composites. The reason of excellent wetting of cellulose in PLA/EVA-GMA blends is to be ascribed to the presence of epoxy groups in EVA-GMA chains, which can react with both hydroxyl groups of cellulose [144] and carboxyl/hydroxyl groups of PLA [146].
3.3.2.2 DSC and TGA analyses
Temperature (°C) 0 20 40 60 80 100 120 140 160 N o rm a liz e d h e a t fl o w e n d o u p ( W /g ) a b c d Tg
Fig. 3.10 - DSC first heating curves of (a) PLA, (b) C00, (c) C10 and (d) C35.
Fig. 3.10 represents the DSC first heating thermograms of PLA, PLA/CF and PLA/EVA-GMA/CF composites (all samples were annealed at 90 °C). From the DSC thermograms, glass transition temperature and melting peak temperature of all samples were calculated. C00 and C10 displayed lower Tg (about 48 °C) as
compared to PLA (58 °C) and two melting peaks. In addition, C35 shows the lowest Tg (47 °C) value and single melting peak of PLA. In the case of composite
C35, the continuous phase is GMA: since the cellulose is fully wetted by EVA-GMA, the fibre surface did not nucleate the growth of PLA crystals. That is why, C35 exhibits single melting peak as like as plain PLA and also display a melting peak at 69 °C for EVA-GMA. Fig. 3.11(I) shows DSC second heating curves of PLA and PLA/EVA-GMA blend composites with different cellulose content. It is
evident in Fig. 3.11 that the cellulose has a large effect on the cold crystallization peak temperature of PLA and it is also obvious in Fig. 3.11(II) that cold crystallization temperature decreased linearly with increasing the CF content.
Temperature (°C) 20 40 60 80 100 120 140 160 N o rm a liz e d h e a t fl o w e n d o u p ( W /g ) a b c d Tc (I) Cellulose content (wt.%) 20 25 30 35 40 45 50 C o ld c ry s tal liz at ion tem pe rat ur e (T c c ) (° C ) 110 115 120 125 130 (II)
Fig. 3.11 - DSC second heating curves of (a) PLA, (b) C5F20, (c) C5 and (d) C5F40.
Fig. 3.12 represents a POM photomicrograph of cellulose fibres (CF1) in PLA
matrix. To be confirmed about the effect of cellulose on the crystallization behaviour of PLA, a film of PLA/CF1 95/5 was prepared and analysed by POM. The
film was melted and held at 170°C for 5 min to eliminate thermal history and then cooled down and isothermally crystallized at 110 °C recording the growth of PLA spherulites. It was found that the rate of growth of PLA spherulite on the fibre surface was much higher than that of in plain PLA phase. The nucleating effect of CF on PLA has been reported by Lisman [35]. Similar effects have been observed
and described for several thermoplastic composites with natural fibres, such as composites of isotactic polypropylene with hemp [73].
Fig.3.12 - Nucleating effect of CF on the crystallisation of PLA (after 50 min from melt)
Temperature (°C) 100 200 300 400 500 600 D e ri v . w e ig h t (% /° C ) 0 1 2 3 353 426 471 334 345 PLA EVA-GMA C35 C20 C00 Cellulose
Fig. 3.13 - DTG curves of plain components and their composites
Fig. 3.13 shows the derivative thermogravimetric curves of cellulose, PLA, C00, C20 and C35 obtained by heating in air. From the DTG curve of C00, it is seen that the maximum degradation rate (345 °C) is between the maximum degradation rate of cellulose (334 °C) and PLA (352 °C). PLA undergoes thermal degradation above 200 °C by hydrolysis, lactide reformation, oxidative main chain scission, and inter or intramolecular transesterfication reactions [164]. In the curve of ternary blend
composites (C20 and C35) there are two peaks, the first peak at about 341 °C, which corresponds to the thermal degradation of cellulose and PLA and the second peak at about 471 °C, which corresponds to the thermal degradation of EVA-GMA (426 °C) and cellulose (444°C). Considering cellulose and EVA-GMA, the maxima of these peaks are shifted to higher temperature with respect to cellulose and polymers respectively. This result indicates that the ternary blend composites are thermally more stable than the PLA/CF binary composites. According to these data, in our previous studies we found that EVA-GMA/CF composites exhibit higher thermal stability than plain components [144].
3.3.2.3 Tensile mechanical properties
Table 3.4 Mechanical properties of blends and composites.
Samples (MPa) E (MPa) (%)
PLA 42.66 0.99 1839.52 120.07 2.48 0.27 B7 42.71 7.79 1833.52 255.91 2.69 0.07 B15 34.18 6.66 1728.82 60.27 2.35 0.55 B30 34.34 1.70 1490.09 109.60 10.52 1.94 B50 20.11 0.59 439.59 5.61 28.28 0.73 B70 1.93 0.35 99.61 21.07 82.22 3.50 EVA-GMA 5.11 0.13 9.98 0.24 208.75 46.21 C00 38.06 13.44 2588.63 221.28 4.11 0.55 C5 19.75 4.61 2748.81 104.33 0.87 0.23 C10 42.99 3.51 2419.57 18.14 2.68 0.09 C*10 51.36 0.80 2876.26 94.67 3.84 0.87 C20 34.47 1.45 2338.20 480.81 4.12 1.05 C35 12.69 0.08 351.47 5.34 13.74 1.12 C50 12.84 0.02 311.21 57.18 18.00 0.00 C100 7.93 0.14 88.18 1.82 33.64 1.48 C5F20 38.69 0.20 2648.70 115.20 1.68 0.01 C5F40 38.85 7.22 2901.53 335.13 1.69 0.02
Oar-shaped specimens of all samples were annealed at 90 °C for five hours in an oven before tensile mechanical tests. It was observed that the length of the specimens of pure PLA and some blends (up to 30 wt.% of EVA-GMA content) was reduced (about 12%) due to crystallization of PLA. In presence of cellulose the prepared specimens did not shrink. Cellulose prevents the shrinkage of PLA during crystallization. Therefore, incorporation of cellulose into PLA matrices is another advantage.
EVA-GMA content in composite (wt.%) 0 20 40 60 80 100 T e n s ile s tr e n g th ( M P a ) 0 20 40 60
Fig 3.14 - Effect of EVA-GMA content on the tensile strength of PLA/EVA-GMA/CF composites
EVA-GMA content in composite (wt.%)
0 20 40 60 80 100 E la s tic m o d u lu s ( M P a ) 0 1000 2000 3000 4000
Fig 3.15 - Effect of EVA-GMA content on the elastic modulus of PLA/EVA-GMA/CF composites
Fig 3.14 and 3.15 show the effect of EVA-GMA content on the tensile strength and elastic modulus of PLA/EVA-GMA/CF blend composites. In Fig 3.14, it is seen that upto 15 wt.% of EVA-GMA, the composite shows higher strength and then decreased with further increased of EVA-GMA. When EVA-GMA content increased from 20 to 35 wt.% in composites then the strength of composites decreased dramatically. This rapid drop of strength is owing to the phase inversion and lower strength of EVA-GMA. The similar trends were also observed for elastic modulus (Fig. 3.15).
Celllulose content in composite (wt.%) 0 10 20 30 40 50 E la s ti c m o d u lu s ( M P a ) 1000 1500 2000 2500 3000 T e n s ile s tr e n g th ( M P a ) 10 20 30 40 50 Tensile strength Elastic modulus
Fig. 3.16 - Effect of cellulose content (0 - 40%) on the tensile strength and elastic modulus of PLA/EVA-GMA/CF composites
EVA-GMA content in composite (wt.%)
0 20 40 60 80 100 E lo n g a ti o n a t b re a k ( % ) 0 10 20 30 40
Fig. 3.17 - Effect of EVA-GMA content on the elongation at break of composites
Fig. 3.16 shows the effect of cellulose content on the elastic modulus and strength of PLA/EVA-GMA/CF blend composites (5 wt.% of EVA-GMA in composites). Elastic modulus is increased with increasing cellulose content due to the higher modulus of cellulose. In the Table 3.4, it is also seen that composite of blend with CF5 exhibited higher strength and elastic modulus as compared to composite of
Fig. 3.17 shows the EVA-GMA content on the elongation at break of PLA/GMA/CF blend composites. It is obvious in the figure that upto 20 wt.% of EVA-GMA in composites, elongation at break is not increased significantly due to lower elongation at break of PLA. On the other hand above 20 wt.% of EVA-GMA content elongation at break is increased linearly due to the phase inversion and higher elongation at break of EVA-GMA.
3.4 Conclusion
The properties of PLA/EVA-GMA blends and their composites with cellulose fibres (PLA/EVA-GMA/CF) were examined as a function of phase compositions. It was found that crystallinity and mechanical properties of blends are affected by the presence of EVA-GMA. Excellent wetting of fibre by the PLA/EVA-GMA blends was found in all range of components compositions. The blends showed better wetting of fibres as compared to plain PLA and EVA-GMA alone. DSC and POM analysis proved that cellulose accelerate the rate of crystal growth of PLA. Although the composites did not perform significant improvement in thermal stability, however, incorporation of cellulose into matrices prevent the shrinkage of PLA, which is an important aspect for the application of PLA at higher temperature. A large effect of EVA-GMA content on the mechanical properties of blend composites was obvious by tensile mechanical tests. Upto 30 wt. % of EVA-GMA the blend composites displayed higher tensile strength and elastic modulus, on the other hand above 30 wt.% of EVA-GMA the composites exhibited lower tensile strength and elastic modulus due to the phase inversion and lower tensile strength and modulus of EVA-GMA.