To my family and to Andrea
…“If you can't be the sun, be a star; It isn't the size that you win or you fail
Be the best of whatever you are”.
Martin Luther King
…“Se non puoi essere il sole, sii una stella; Non è la grandezza che ti fa vincere o fallire,
Sii sempre il meglio di ciò che sei”.
TABLE OF CONTENTS
LIST OF PUBLICATIONS 1 LIST OF ABBREVIATIONS 2 ABSTRACT 4 1. BACKGROUND 51.1 Mevalonate pathway in cancer cell metabolism 5
1.2 p53 13
1.3 p53 and metabolism 21
1.3.1 p53 and glucidic metabolism 21
1.3.2 p53 and protein metabolism 22
1.3.3 p53 and lipid metabolism 23
1.4 Brain metabolic behavior 25
1.4.1 Brain cholesterol metabolism 27
1.4.2 Glioma cancer cells and metabolic dysregulation 29
2. AIM OF THE STUDY 33
3. MATERIALS AND METHODS 34
3.1 Cell cultures 34
3.2 Reagents 34
3.3 Transfection procedures 35
3.4 quantitative RealTime-PCR (qRT-PCR) 35
3.5 SDS-PAGE and Immunoblot analysis 36
3.6 Chromatin Immunoprecipitation assays (ChIP) 37
3.8 Luciferase Reporter assays 42
3.9 [14C]-Acetate uptake 43
3.10 Patients 43
3.11 p53 mutations detection 44
3.12 Densitometric and statistical analysis 45
4. RESULTS 47
4.1 p53 induces expression of the Mevalonate metabolic pathway enzymes
expression in human Glioblastoma cells 47
4.2 p53 directly binds specific p53 Responsive Elements in MVA enzymes
gene-sequences 55
4.3 p53 modulates cholesterol biosynthesis in glioblastoma cells 61
5. DISCUSSION 64
6. CONCLUSION 69
7. TABLES 71
8. REFERENCES 75
1
LIST OF PUBLICATIONS
Bifulco M, D'Alessandro A, Paladino S, Malfitano AM, Notarnicola M, Caruso MG, Laezza C. N6-isopentenyladenosine improves nuclear shape in fibroblasts from humans with progeroid syndromes by inhibiting the farnesylation of prelamin A. FEBS J. 2013;280(23):6223-32
Ciaglia E, Pisanti S, Picardi P, Laezza C, Malfitano AM, D'Alessandro A, Gazzerro P, Vitale M, Carbone E, Bifulco M. N6-isopentenyladenosine, an endogenous isoprenoid end product, directly affects cytotoxic and regulatory functions of human NK cells through FDPS modulation. J Leukoc Biol. 2013;94(6):1207-19
Malfitano AM, Laezza C, D'Alessandro A, Procaccini C, Saccomanni G, Tuccinardi T, Manera C, Macchia M, Matarese G, Gazzerro P, Bifulco M. Effects on immune cells of a new 1,8-naphthyridin-2-one derivative and its analogues as selective CB2 agonists: implications in multiple sclerosis. PLoS One. 2013;8(5):e62511
Pisanti S, Picardi P, D'Alessandro A, Laezza C, Bifulco M. The endocannabinoid signaling system in cancer. Trends Pharmacol Sci. 2013 May;34(5):273-82
Laezza C, D'Alessandro A, Malfitano AM, Bifulco M. Anandamide inhibits the Wnt/β-catenin signalling pathway in human breast cancer MDA MB 231 cells. Eur J Cancer. 2013;49(8):2066-7
Laezza C, D'Alessandro A, Paladino S, Maria Malfitano A, Chiara Proto M, Gazzerro P, Pisanti S, Santoro A, Ciaglia E, Bifulco M; Endocannabinoid Research Group. Anandamide inhibits the Wnt/β-catenin signalling pathway in human breast cancer MDA MB 231 cells. Eur J Cancer. 2012;48(16):3112-22 Malfitano AM, Laezza C, Galgani M, Matarese G, D'Alessandro A, Gazzerro P, Bifulco M. The CB1 receptor antagonist rimonabant controls cell viability and ascitic tumour growth in mice. Pharmacol Res. 2012;65(3):365-71
Di Nicuolo G, D'Alessandro A, Andria B, Scuderi V, Scognamiglio M, Tammaro A,Mancini A, Cozzolino S, Di Florio E, Bracco A, Calise F, Chamuleau RA. Long-term absence of porcine endogenous retrovirus infection in chronically immunosuppressed patients after treatment with the porcine cell-based Academic Medical Center bioartificial liver. Xenotransplantation. 2010;17(6):431-9
2
LIST OF ABBREVIATIONS
Akt/PKB: Protein Kinase B
AMPK: AMP-activated protein Kinase ApoE: Apolipoprotein E
ARF: Alternate Reading Frame ATM: Ataxia Teleangiactasia Mutated ATP: Adenine Triphosphate
ATR: Serine/Threonine-protein kinase BBB: Blood Brain Barrier
CaMKKβ: Calmodulin-dependent protein
kinase-kinase β
CDKN1A: Cyclin Dependent Kinase
inhibitor 1A (p21)
ChIP: Chromatin Immunoprecipitation Chk2: Checkpoint homolog kinase 2 DBD: DNA Binding Domain EtOH: Etanol
FDFT1: Farnesyl diphosphate Farnesyl
Transferase1
FDPS: Farnesyl Diphosphate Synthetase FPP: Farnesyl pyrophosphate
FTI: Farnesyl Transferase Inhibitor GBM: Glioblastoma Multiforme GLUT: Glucose Transporter GOF: Gain of Function
HEK293: Human Embryonal Kidney 293 HMC-CoA:
3’-hydroxy-3’-methylglutaryl-CoA
HMGCR:
3’-hydroxy-3’-methylglutaryl-CoA Reductase
IGF: Insulin Like Growth Factor Insig: Insulin-induced gene JNK: Janus Kinase
LDLR: Low Density Lipoprotein Receptor LKB1: Liver Kinase B
LRP1: LDLR Related Protein 1 LXR: Liver X Receptor Mdm2: Mouse-double minute 2
mTOR: mammalian Target of Rapamicin mutR273H-p53: plasmid containing
mutation R273H in p53 sequence
MVA: Mevalonate
NES: Nuclear Export Signal NHA: Normal Human Astrocytes NLS: Nuclear Localization Sequence p53RE: p53 Responsive Element pCMV-p53: wild type p53 containing
plasmid
Pgp: P-glicoprotein
PMG: Phosphoglicerate Mutase PPP: Pentose Phosphate Pathway PT-α: Pifithrin-α
qRT-PCR: quantitative
RealTime-Polymerase Chain Reaction
RabGGTA: Rab-Geranyl-geranyl
Transferase 1α
ROS: Reactive Oxygen Species
SCAP: SREBP-cleavage activated protein shRNA: short hairpin RNA
SIN: SXL-interactor (SXL: Sex-Lethal) SRE: Sterol Responsive Element SREBP: Sterol Responsive Element
Binding Protein
SSD: Sterol Sensing Domain TCA: Tricarboxylicyclic acid
3
TIGAR: TP53-Induced Glycolysis and
Apoptosis Regulator
TSS: Transcription Start Site
4
ABSTRACT
The mevalonate pathway is an important metabolic pathway implicated in multiple aspects of tumorigenesis. In this study, I provided evidences about genetic and pharmacologic perturbation of p53, which directly influenced expression of mevalonate pathway enzymes, including 3’-Hydroxy-3’-Methylglutaryl - CoenzymeA Reductase, Mevalonate Kinase, Farnesyl Diphosphate Synthase, Farnesyl Diphosphate Farnesyl Transferase 1.
Three different cell lines have been considered, U343 MG (U343) and U251 MG (U251) glioma cells, both classified as IV grade glioblastoma cell lines, with two different malignancy grade, and Normal Human Astrocytes (NHA), their normal counterpart.
In particular, NHA and U343 cells have wild type p53 (wtp53) while U251 bearing mutation (R273H)p53. This mutation affects p53 DNA binding site, preventing transcriptional function of the protein.
Different basal expression level of the mevalonate pathway’s genes have found among the different cell lines considered and I hypothesized that this could be ascribable to p53 mutation status and function
Indeed, I observed that functional and active p53 recognized specific p53 Responsive Elements (p53REs) present in MVA enzymes gene-sequences. p53 bound to these regions correlated with increased transcription levels of mentioned genes and such effect has abolished in cells bearing mut(R273H)p53 or by site-directed mutagenesis of p53REs.
These new findings expose another facet of p53 functions, unrelated to tumor suppression, and render it a novel regulator of mevalonate pathway providing insight into the role of this pathway in cancer progression.
5
1. BACKGROUND
1.1 Mevalonate pathway in cancer cells metabolism
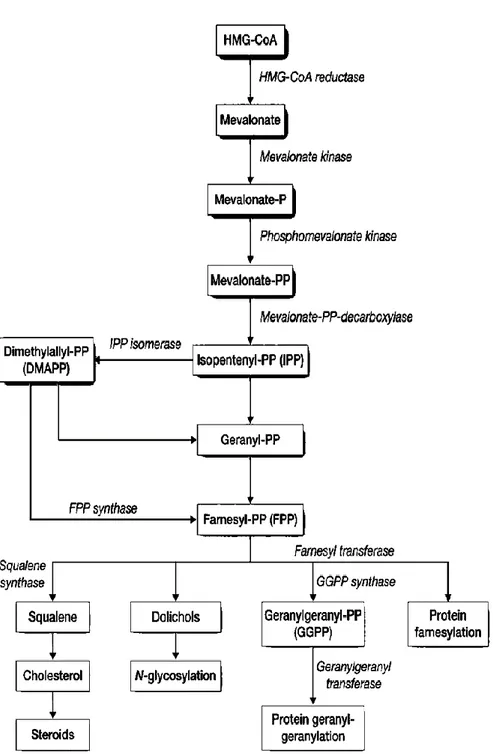
Mevalonate (MVA) pathway initiates with the enzymatic conversion of
acetoacetyl-CoA into 3’-hydroxy-3’-methylglutaryl-CoA (HMG-CoA)
catalyzed by the HMG-CoA synthase, the HMG-CoA Reductase (HMGCR), the rate-limiting enzyme of this metabolic pathway, conducts next step. Following a series of twenty-seven biochemical reactions, enzymes lead to cholesterol synthesis (Bloch K., 1965). Moreover, the cholesterol biosynthesis pathway generates a series of intermediates required to isoprenylation of small GTPase, such as Ras and Rho. This post-translational modification mainly affects proteins containing CAAX motif at their C-terminus, isoprenylation is important for protein function and promotes activation and translocation of modified proteins to plasma membrane (Konstantinopoulos PA et al. 2007).
6
Figure 1. Schematic representation of Mevalonate Pathway enzymes and reactions
7
Generally, final product of MVA pathway, cholesterol, is necessary for membranes assembly, for steroid hormones’ synthesis and bile acids formation. Endogenous synthesis maintained the steady levels by three main mechanisms: 1) Regulation of HMGCR levels and activity, 2) Control of excess intracellular cholesterol rate by regulation of Acyl-CoA cholesterol acyltransferase (also called Sterol O-acyltransferase), 3) Regulation of plasma cholesterol levels by LDL receptor (LDLR) endocytic activity, able to capture circulating Low-density Lipoproteins (LDL) and High-Low-density Lipoproteins (HDL).
The primary mechanism in cholesterol synthesis controlling is HMGCR regulation, this happens through several mechanisms: feedback inhibition, rate of enzyme degradation, control of gene expression and post-translational phosphorylation/de-phosphorylation balance and cholesterol manages by itself these mechanisms.
When cholesterol levels increase, it binds the sterol-sensing domain (SSD) on HMGCR regulation domain, acting as a feedback inhibitor of pre-existing enzymes. It is able to induce rapid degradation of enzymes through the cholesterol-induced poly-ubiquitination of HMGCR and consequent proteasome degradation. When cholesterol and its intermediate mevalonate are in excess, they reduce the amount of mRNA of HMGCR and its gene expression (Nakanishi M. et al 1988).
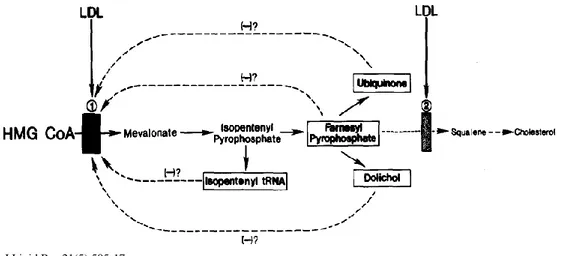
Like cholesterol, non-sterol compounds, derived from mevalonate downstream reactions are essential for cell growth and participate with cholesterol in a type of multivalent feedback regulation of HMGCR (Brown MS and Goldstein JL, 1980) (Figure 2).
Post-translational modification such as phosphorylation and dephosphorylation could regulate HMGCR enzyme. Phosphorylations induced by AMP-activated protein kinase (AMPK) decrease HMGCR activity. AMPK is activated itself by
two phosphorylation made by Liver Kinase B (LKB1),a serine-threonine kinase
8
RJ, 2009) and Calmodulin-dependent protein kinase-kinase β (CaMKKβ), that
phosphorylate AMPK in response to intracellular Ca++ increase.
Such hormones participate to control of AMPK/HMGCR regulation.
Insulin stimulates the removal of phosphates and, thereby, activates HMGR activity, while glucagon and epinephrine negatively affect cholesterol biosynthesis (Ness GC and Chambers CM, 2000)
The well-known transcriptional regulator of lipid pathways’ enzymes is SREBP, the Sterol Responsive Elements Binding Protein. Transcriptional regulator SREBP includes a family of nuclear factors that bind to the sterol regulatory element (SRE) present in promoter regions of enzymes in charge of lipid synthesis, such as LDLR and HMGCR (Briggs MR et al, 1993; Vallett SM et al 1996). There are two distinct SREBP genes, SREBP-1 and SREBP-2. In
Figure 2. Model for multivalent feedback regulation of HMG CoA reductase. N° 1 and n° 2 boxes indicate sites of action of LDL-derived cholesterol, able to reduce HMGCR activity (1) and squalene synthase (2). The dashed lines designate other HMGCR regulators non-sterol compunds.
9
addition, the SREBP-1 gene codes for two different isoforms because of alternative splicing: SREBP-1a and SREBP-1c/ADD1.
SREBP-1a regulates all SREBP-responsive genes in both the cholesterol and fatty acid biosynthetic pathways. SREBP-1c controls the expression of genes involved in fatty acid synthesis and is involved in the differentiation of adipocytes and its homologous in rat is also called Adipocyte Determination and Differentiation factor 1 (ADD1). SREBP-1c is also an essential transcription factor downstream of the actions of insulin at the level of carbohydrate and lipid metabolism.
SREBP-2 is the predominant form in liver tissue and it exhibits preference at controlling the expression of genes involved in cholesterol homeostasis, including all of the genes encoding the sterol biosynthetic enzymes. In addition, SREBP-2 controls expression of the LDLR gene.
High sterols activate expression of the SREBP-1 gene but do not exert this effect on the SREBP-2 gene. The sterol-mediated activation of the SREBP-1 gene occurs via the action of the liver X receptors (LXRs). The LXRs are members of the steroid/thyroid hormone superfamily of cytosolic ligand binding receptors that migrate to the nucleus, upon ligand binding, and regulate gene expression binding specific target sequences.
All three isoforms of SREBPs have to be proteolytically activated and their cleavage is regulated by sterol intracellular levels. A protein called SREBP cleavage-activating protein (SCAP) binds the C-terminus of SREBP and is crucial for its activation.
Insig protein, the Insulin-induced gene, also participates in this process. When cells have sufficient sterol content, SREBP and SCAP are retained in the endoplasmic reticulum via the SCAP-Insig interaction. Both SCAP and Insig create a network able to regulate SREBP transcriptional activity organizing a kind of “sterol-sensor” in the cell.
10
Insig participates also in HMGCR sterol-induced degradation. When sterols are scarce in cells Insig-SCAP-SREBP inhibiting-interaction doesn’t work and there is no-binding between Insig and SCAP, in this way SCAP drives SREBP
to Golgi where it will activated by cleavage
(http://themedicalbiochemistrypage.org;Shimano H, 2001).
All these evidence demonstrated that HMGCR, the rate-limiting enzymes of MVA pathway, has a very fine regulation.
During tumorigenesis, there are significant changes in energy metabolism, the Warburg effect is the well-known metabolic adaptation of cancer cells and it is a consequence of cell’s increased energetic requirements and metabolic pathways activation (Warburg O, 1956). Recent data reported elevated mevalonate synthesis in transformed malignant cells (Ginestier C et al 2012; Duncan RE, 2004; Clendening JW et al, 2010). The possible mechanisms that lead to increased lipid synthesis could be: 1) the abundance of precursor derived from hyper-activation of glycolysis (such as acetyl-CoA) (Clendening JW et al, 2008), 2) the HMGCR loss of feedback control or 3) its increase in function and expression (Larsson O, 1996; Mo H and Elson CE, 2004).
Clendening et al. demonstrated, in 2010, that HMGCR ectopic expression contributes to cancer progression in hepatic and breast cancer cooperating with Ras oncogene (Clendening JW et al, 2010).
Furthermore, exogenous administration of mevalonate, in xenograft-bearing mice, was also shown to promote tumor growth (Duncan RE, 2004).
Other mevalonate enzymes are involved in cancer progression and resistance to chemotherapy that is the case of Farnesyl Diphosphate Synthetase (FDPS), able to catalyze the formation of the farnesyl pyrophosphate (FPP).
Isoprenylated proteins are involved in the pathogenesis and progression of some cancer (McTaggart SJ, 2006), specifically, in U87 glioma cell lines, FDPS is overexpressed and significantly attenuates apoptosis induced by paclitaxel, a mitotic inhibitor drug (Woo IS et al, 2010). Previous reports showed that
11
inhibition of FDPS in colorectal cancer play an important pro-apoptotic role (Notarnicola M et al, 2004) and use of specific inhibitors of this enzyme induce cell death in human cancer cells. (Senaratne SG et al, 2000; Riebeling C et al, 2002).
New therapeutic strategies aimed to use inhibitors of MVA enzymes to interfere with cancer progression and are supported by growing clinical and experimental evidences (Silvente-Poirot S and Poirot M, 2012).
Statins, a well-known drugs’ family, reduce endogenous synthesis of cholesterol because they are specific inhibitors of HMGCR enzyme. This group of drugs includes: lovastatin, simvastatin, atorvastatin, fluvastatin and pravastatin and are used by millions of people to improve hypercholesterolemia and reduce cardiovascular risks.
Recent reports also investigated statins as candidate drug in cancer treatment protocols and many retrospective studies evidentiated a weak effect in reducing cell cycle activation and tumor growth in melanoma, colon, lung, breast, thyroid in vitro and in vivo (Wang Y et al, 2013; Zanfardino M et al,2013; Agarwal B et al, 2002; Yu X et al, 2013; Seeger H et al, 2003; Laezza C et al, 2008). Statins inhibit Ras prenylation and reduce cholesterol biosynthesis, promote cell cycle arrest and proteasome activity (Bjarnadottir O et al, 2013; Singh PP et al, 2013; Corcos L et al, 2013). More, combined administration of statins with conventional and cytotoxic chemotherapy showed increase of apoptotic rate and differentiation state (Drucker L et al, 2004) and recent studies evidentiated that depletion of MVA intermediates, such as geranylgeranyl and farnesyl, by the use of statins, allows a reduction of the multidrug resistance (MDR) mechanism in cancer (Mehta NG and Mehta M, 2010).
Other molecules able to reduce MVA pathway enzymes activity had tested in recent years in cancer cells. Riganti and collegues showed a correlation between the rate of the cholesterol synthesis and the MDR using Zoledronic acid, a potent
12
aminobiphosphonate targeting the downstream enzyme of MVA pathway, the FDPS (Riganti C et al, 2013).
They showed that Zoledronic acid interrupted Ras- and RhoA-dependent downstream signaling pathways indicating that MVA pathway activity can directly regulate Pgp, P-glicoprotein, expression (Riganti C et al, 2013).
More, in recent clinical trials, different research groups, tested the Farnesyltransferase inhibitors (FTIs) as anti-cancer agents, with the purpose of farnesyl-transferase inhibition to disrupt oncogenic Ras farnesylation (Garcia AM et al, 1993; Sebti SM and Hamilton AD, 2000; Holstein SA and Hohl RJ, 2012).
These reports highlighted the importance of metabolic perturbation and adaptation in cancer biology. In particular, MVA pathway seems to contribute to tumor progression and support a strong proliferation rate of transforming cells; at the same time, these evidences disclosed new understandings about cancer metabolism and propose new intriguing target in cancer therapy.
13
1.2 p53
The p53 is the most well studied tumor suppressor protein in cell biology and often it is referred to as the “Guardian of the Genome”.
The list of known functions of p53 includes a pivotal role in apoptosis induction, DNA repair and cell senescence, regulatory roles in cell cycle arrest and angiogenesis. p53 binds to many regulatory sites in the genome and allow production of proteins that induce cell cycle arrest until the damage is repaired, or, if the challenge is too severe, p53 initiates the process of programmed cell death, or apoptosis, which directs the cell to commit suicide and permanently removing the damage.
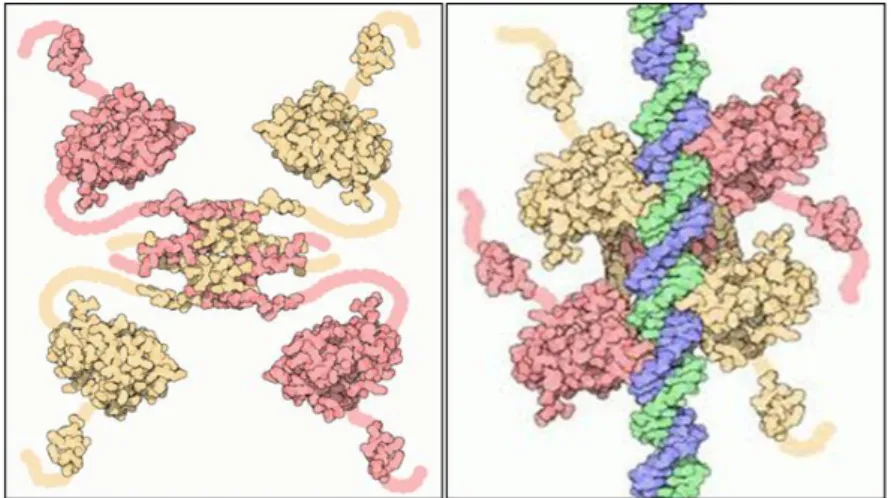
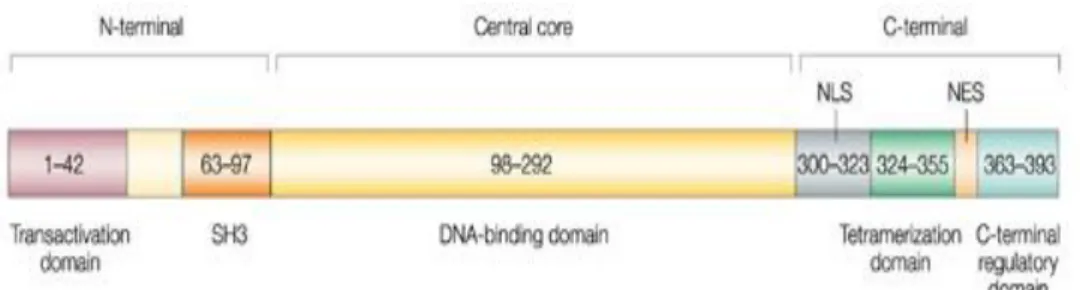
Functional p53 arranged by four subunits (Figure 3), each subunit could be divided in three main domains (Figure 4): 1) the N-terminal domain containing the Transactivation domain and the Src homology 3-like (SH3) portion, 2) the central core with the DNA binding domain and 3) the C-terminal domain, containing the Tetramerization and Regulatory domains.
Figure 3. p53’s tetramer structure. p53 is active only as tetramer structure. Four subunits of p53 bind through their transactivation domains and compone the tetramer-active p53. In this conformation, p53 is able to bind and interact with specific DNA regions and activate transcription of target genes or recruit other transcription factors or co-factors and initiates genes’ transcription.
14
p53 tumor suppressor is normally found at extremely low levels because of its rapid degradation after synthesis. Stabilization of p53 is a common response to many different and diverse forms of stress, including DNA damage, oncogene activation, metabolic changes, hypoxia and alteration in pH or temperature, in this condition p53 levels rise and initiate protective measures (Ashcroft M and Vousden KH, 1999). The level of p53 mRNA and the rate of p53 protein synthesis remain low during G phase and increase markedly, reaching a peak near the G1/S transition just prior to initiation of DNA replication (Gudas JM et al, 1994).
1. MDM2, Mouse double minute 2 homolog, is an E3 ubiquitin-protein ligase it interacts with the N-terminal transactivation domain of p53 to inhibit p53 transcriptional activity.
2. SIN3/HDAC corepressor complex functions in transcriptional regulation of several genes and is therefore implicated in the regulation of key biological processes. Knockdown studies have confirmed the role of SIN3 in cellular proliferation, differentiation, apoptosis and cell cycle regulation, emphasizing Sin3 as an essential regulator of critical cellular events in normal and pathological processes (Kadamb R et al, 2013)
Nature Reviews Cancer 4, 793-805 (2004)
Figure 4. p53’s domains: 1) The N-terminal domain containing the transactivation domain, it is required for transactivation activity and interacts with other transcription factors and with Mdm2 1 and with acetiltransferases; the SH3 domain is a proline-rich
domain required for interaction of p53 with SIN32, which protects p53 from
degradation. 2) The central core is made up primarily of the DNA-binding domain that allow p53 to bind specific DNA responsive elements. 3) The C-end contains nuclear localization and export signals (NLS and NES, respectively), a regulatory domain and the tetramerization domain.
15
Regulation of p53 protein occurs by binding of proteins that promote its degradation via the ubiquitin/proteasome pathway thanks a “vital negative” feedback.
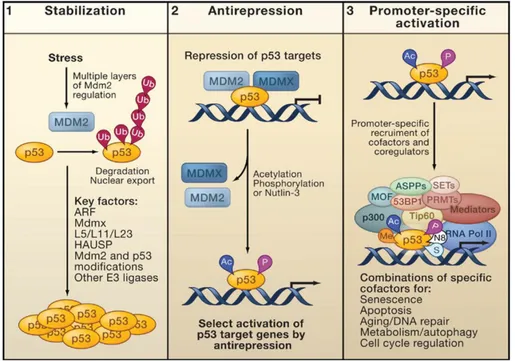
p53 activation is a three steps process. First, p53 protein stabilized and level increased via the inhibition of its interaction with Mdm2, its pivotal negative
regulator, and the other regulators. Over translation of p53 mRNA is a
complementary that will also ensure p53 accumulation.
Figure 5. Model of p53 activation. 1) p53 stabilization: with reduction of Mdm2 binding; 2) Antirepression: this step requires acetylation of p53 to bind a specific subset of p53 target promoters. 3) Promoter activation: To complete activation of transcription machinery, p53 recruits co-factors and also induces histone modification of surrounding chromatin.
16
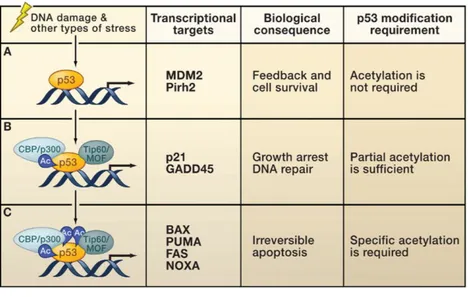
Second, p53 is “anti-repressed”, this step is mediated by post-translational modification of the protein mediated by acetylation and phosphorylation, and, finally, a series of modulators (kinases and acetylases again) activate p53 transcriptional activity. During third phase, promoter specific activation of p53 target genes allows to cofactor recruitments for target-genes transcription (Kruse JP and Gu W, 2009) (Figure 5 and Figure 6).
Mdm2 is one of the most important components of the p53 degradation pathway and is the product of a gene regulated by p53 itself in normal cells (Kubbutat MH and Vousden KH, 1998).
Expression of Mdm2 enhances by activated p53 and its principal role is to interact directly with p53 protein to inhibit its activity. Mdm2 binds to the N-terminus of p53 within the trans-activation domain, competing with components of the basal transcriptional machinery recruited by p53 as transcription factor. The binding of Mdm2 alone could inhibit normal function of this region of p53 (Figure 5), reducing the ability of p53 to activate genes’ expression and,
Cell 137(4):609-22 (2009)
Figure 6. p53 acetylation and target genes regulation. After stress-induced p53 activation, different subsets of target genes have different requirements for p53 posttranslational modifications.
17
moreover, induce poly-ubiquitination of p53 through its E3 ubiquitin-protein ligase activity (Momand J et al 1992; Oliner JD et al, 1993). Other ubiquitin ligases, such E6AP, and interaction with Janus Kinase (JNK) participates to p53 ubiquitin-dependent down – regulation (Talis AL et al, 1998; Fuchs SY et al 1998).
Stabilization of p53 is a common response to different and diverse forms of cellular stresses and arrest cell cycle at checkpoints until damage resolution. The ability of Mdm2 to associate and target p53 outside nucleus to degradation highly depends on p53 phosphorylation status. Many kinases phosphorylate p53 on N-terminus residues with the aim to interfere in Mdm2/p53 binding. Ataxia telangiectasia mutated (ATM) and Serine/threonine-protein kinase (ATR) phosphorylate p53 on Serine 15 (Appella E and Anderson CW, 2001) while Chk2 phosphorylates it on Serine 20 (Hirao A et al, 2000).
p53, affected by these post-translational modifications, obtains stability and activates its transcriptional activity, in particular, ATM is able to phosphorylate both p53 and Mdm2. Phosphorylation of p53 causes its stability and activation, meanwhile ATM phosphorylation of Mdm2 on Serine 395 reduces nucleo-cytoplasm shuttling of p53 by its inhibitor and allows p53 nucleus accumulation (Maya R et al, 2001).
Among survival pathway, Akt targeting of Mdm2 was demonstrated to be required for its nuclear import, and allows the access to the cellular compartment in which it affects p53 (Mayo LD and Donner DB, 2001).
The p53-Mdm2 relationship is crucial not only for cellular surviving functions but also because it is integrated in a complex signalling network.
Important component that affect auto-regulatory feedback by p53 includes the
tumor suppressive protein p14 ARF. Binding Mdm2 proteins, p14ARF interferes
with E3 ubiquitin ligase function of Mdm2 and disrupt the negative feedback inhibition of p53 (Alarcon-Vargas D and Ronai Z, 2002).
18
Other regulatory mechanisms for p53 (such as phosphorylation, ubiquitination, methylation, sumoylation, neddylation, and acetylation) modify C-terminal region of p53 affecting the ability of p53 to bind DNA.
During malignant progression, cancer cells often accumulates mutant p53 isoforms. Mutations could affect different protein regions, determining loss of regulation and activity of p53. Mutated p53 participates to cancer progression in different ways:
1) mut p53 sequesters wt p53 and arranges a tetramer made up by wt p53/mut p53 subunits. Mutation determines the loss of function of p53 and abrogates the tumor suppressive function of p53. This effect is also known as
“dominant-negative effect”;
2) mut p53 may exhibit also a “gain of function”, it may acquire an “original” activity, not present in wtp53, which can contributes at various levels to tumorigenesis (Oren M and Rotter V, 2010).
Dittmer and colleagues introduced the concept of Gain of function (GOF) in 1993 (Dittmer D, 1993), they described the ability of mut p53 isoforms to transform and increase growth rate in p53 null-cells in human and mouse cells. Tumors with mut p53 present a great genomic instability and, in addition, mut p53 can interfere with DNA damage repair (Offer H et al, 1999) and influence cancer progression with the increase of DNA mutations accumulations.
Many factors influences the role of p53 mutation during cancer progression, including the stage during which p53 mutation and accumulation occur. In some types of cancer, p53 mutation is frequently a late events and correlate with a poor prognosis and with an enhancement in tumor aggressiveness (Vogelstein B and Kinzler KW, 1993).
Mutations on TP53 gene affected all exons despite the “hot-spot” mutation region consists of exon 4 to 9, this includes the central core of the protein containing the DNA binding domain (DBD) assigned to recognition of specific DNA sequences on promoters of target genes (Olivier M et al, 2010). Frequent
19
mutated residues are R175, G245, R248, R249,R273, and R282 and the most
common are missense mutations (Cho Y et al, 1994).
Furthermore, mut p53 could protect cells against apoptosis induced by growth factor deprivation conferring to a selective advantage in proliferation (Peled A et al, 1996).
Even wtp53 has been involved in cellular protection against chemotherapy-induced apoptosis and emerging results presented new activities in survival promotion by wtp53 in cancer cells (Kim E et al. 2009).
As guardian of the genome, p53 is involved in cell damages control and in maintaining genomic integrity, wtp53 deals with control of cell cycle progression, DNA repair, centrosome duplication; it recognizes DNA lesions and activates repair mechanisms, as well as the transcriptional activation of DNA repair factors and of cell cycle regulators. The multitude of factors influencing p53 conformation, its subcellular distribution, and its DNA binding and transcriptional activity contribute to the dynamic balance between survival-promoting and death-inducing activities of wtp53.
Furthermore, TP53 mutations are rare in certain human cancer entities, or is a tardive occurring mutation during cancer progression as a paper by Kim E and colleagues described in 2009.
In particular, they highlighted as glioma cells with wtp53 exhibited a higher resistance to cytotoxic treatments used in clinical practice compared to glioma cells with transcriptionally inactive mutp53, moreover, inhibition of wtp53 exerts augmented apoptosis rate after chemotherapeutics treatments (Batista LF et al. 2009).
Surprisingly, induction of apoptosis by exogenously introduced wtp53 is more efficient in glioma cells expressing mutp53 than in glioma cells expressing wtp53 (Cerrato JA et al. 2001).
Functional duality seems to be an essential feature of the p53 functions, during development and in tissues homeostasis p53 undergoes to a fine-tuned balance
20
between survival and death induction and loss of death-inducing wtp53 functions, without loss of p53 activities, could provide a survival advantage in cell sub-population within tumor tissue (Kim E et al. 2009).
However, the diversity of cellular processes influenced by p53 is becoming more evident and the traditional view of p53 as simply a tumour suppressor is challenging, in fact, new emerging evidences ascribe to p53 an important role
21
1.3 p53 and metabolism
Cancer cells are able to initiate replication without any extracellular stimulation, maintaining their own metabolic autonomy (de Berardinis RJ, 2008), in addition to the Warburg effect, tumors show alterations in many other aspects of metabolism, including altered metabolism of amino acids and lipid.
Ability of p53 in metabolic genes regulation is a new emerging topic in cancer cells biology knowledge in fact, several groups focused their attention about this subject showing that p53 is not only a “simple” oncosuppressor but it is able to deeply influence cell life in energetic management.
1.3.1 p53 and glucidic metabolism
“Metabolic obstacles” usually affect cancer cells during their development. First, they increase requirements of energy and reducing agents (ATP, Gluthatione and NADPH), second they need a huge amount of energetic substrates to sustain a rapid proliferation rate and finally they have to survive to metabolic stress, maintain an appropriate redox balance, face low oxygen rate and, at the same time, have to prevent cell death (Puzio-Kuter AM, 2011). In cancer cells, glycolysis is the preferential way to obtain ATP in hypoxic condition or when cells rapidly need energy (Pfeiffer T, 2001). The product Pyruvate could be used for amino acids and fatty acids synthesis and utilize to maintain mitochondrial membrane potential supporting the energetic request of anabolic metabolism and cell growth.
A transforming cell regulates levels of genes involved in metabolic fate and increased activity of p53, during a chronic stress status, might allow synthesis of specific genes’ sets.
For example, p53 is able to influence expression of glucose transporters (GLUT1 and GLUT4) through a direct transcriptional repression (Schwartzenberg-Bar-Yoseph F et al, 2004), moreover, p53 increases the
22
ubiquitin-dependent degradation of the glycolytic enzyme Phosphoglicerate mutase (PGM) and reduces the glycolytic rate (Kondoh H et al, 2005).
It is also able to reduce glycolytic rate by increased expression of TP53-induced glycolysis and apoptosis regulator (TIGAR) (Bensaad K et al, 2006) which lowers intracellular concentration of fructose 2,6 bisphosphate. All these metabolic changes address cells to hyperactivate the pentose phosphate pathway (PPP), the alternative way for glucose-6 phosphate use and a hallmark of proliferating cells because it is essential for the production of lipids and nucleotides required for cells to divide.
Furthermore, a current model suggested by Vousden assays that this process helps cell to survive to a moderate cellular damage in normal cells or in cells under mild level of stress (Vousden KH, 2009), because, at the same time, p53 directly interacts with and inhibits activity of glucose-6-phosphate dehydrogenase, the first rate limiting step enzyme of the PPP (Jiang P et al, 2011).
As the PPP is the major source of NADPH, which is needed for the scavenging of ROS by reduced glutathione (GSH), induction of this pathway by TIGAR can result in decrease of ROS levels and lowered cellular sensitivity to ROS-associated apoptosis (Bensaad K and Vousden KH, 2007).
p53 is involved also in ROS managing and it has, in this occasion also, both pro-oxidant and anti-pro-oxidant functions. (Chen W et al, 2009; Faraonio R et al, 2006)
1.3.2 p53 and protein metabolism
Like glucose deprivation, even reduction of amino acids availability could activate p53 in a pro-survival manner.
Many tumors required glutamine, a non-essential amino acid, used for high-rate proteins and nucleotides synthesis, and ATP generation to sustain a rapid growth of cancer cells (Dang CV, 2010; Wise DR et al, 2008). At the same time, glutamine, converted first in glutamate and later in α-ketoglutarate, participated
23
among tricarboxyciclic acid (TCA) cycle in glutaminolysis, producing ATP in cells. Cells deficient of p53 were less viable under glutamine deprivation compared with those harboring functional p53 (Reid MA et al, 2013). Another amino acid, serine, also leads to p53-induced cell survival when its levels are depleted (Maddocks OD et al, 2013), low levels of nutrients are detected by kinases and phosphatases, which modulate downstream effector proteins such as transcription factors to reprogram cellular functions and promote survival (Reid MA and Kong M, 2013).
1.3.3 p53 and lipid metabolism
Cancer cells show an elevated rate of lipids synthesis. Lipids also participates in cancer growth and proliferation and contribute to tumor cells surviving, extensively, alteration in lipid metabolism are evident during tumorigenesis and cancer cells increase lipogenic rate compared to normal cells, that predominantly reach and metabolize diet lipids (Medes G et al, 1953; Kuhajda FP et al, 1994).
Nutrient deprivation contributes to p53 activation, in this circumstance p53 downregulates IGF1/Akt/mTOR pathway that signals for cell growth and proliferation in response to high levels of glucose and amino acids, induces glycolysis and protein synthesis through mTOR activation (DeBerardinis RJ et al, 2008).
There is a well-regulated network between p53/IGF1/Akt/mTOR axis /nutrient
balance that allow cells to respond to cellular stress, under reduced energy
balance, the Akt/mTOR axis and AMPK fail to be activated and p53 is induced. AMPK, the AMP-activated protein kinase, drives the catabolism of cellular fatty acids and participates in p53 activation (Puzio-Kuter AM, 2011)
Buzzai and collegues, showed as treatment of p53+/+ cells with metformin (an
anti-diabetic drug able to induce AMPK), enhances fatty acid β-oxidation in a
24
showed an increased apoptosis rate and a markedly susceptibility to apoptosis in case of in vitro nutrient deprivation. Taken together these evidences highlighted, again, the different behavior of cells in metabolic adaptation according to p53 status.
Even some very interesting evidences, the link between p53 and lipid metabolism is still under investigation.
Recent study by Freed-Pastor et al., suggested an interaction between mutated p53 and SREBP2, a transcription factor controlling mevalonate pathway genes expression.
They focused their attention on breast-cancer cells and demonstrated that mutated p53 is able to induce levels of mevalonate genes, increasing tumorigenic feature of these cells and changing cell morphology. Using a specific small-hairpin RNA (shRNA) molecules targeting mutated p53, they demonstrated an attenuation of malignant phenotype of breast-cancer cells (Freed-Pastor WA et al, 2012).
Other findings, by Ido Goldstein at al., elucidated a new aspect of p53 on genes transcription regulation in different features of lipid metabolism. They observed a transcription induction of three genes: Pltp (Phospholipid transfer protein) and Cel (Carboxyl ester lipase), implicated in lipoprotein metabolism, and Abca12 (ATP-Binding cassette transporter 12), involved in lipids transfer across membranes. Promoters of these genes are activated directly by p53 and this activity suggests and reveals new roles for p53 in regulation of lipid homeostasis (Goldstein I et al, 2012).
25
1.4 Brain metabolic behavior
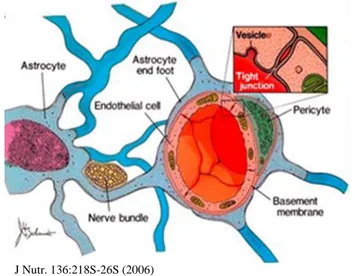
Brain has particular metabolic requirements, all vertebrates have a blood brain barrier (BBB) that allows metabolism inside the brain to operate differently from metabolism in other parts of the body (Figure 7).
Brain tissue consumes a large amount of energy (between 20 and 25% of basal metabolism of vertebrates) in
proportion to its volume and most of energy consumption sustains the
maintenance of
membrane potential of neurons (Nieuwenhuys R et al, 1998; Mink JW et al, 1981)
The brain obtains the most of its energy from oxygen-dependent metabolism of glucose derived from the blood (Nieuwenhuys R et al, 1998) but alternative energetic sources are ketones, lactate, acetate and some amino-acids
(Boumezbeur F et al, 2010; Deelchand DK et al, 2009).
Glucose is the elective molecule for brain metabolic reactions. In the brain, glucose is metabolized through glycolytic pathway, enter in the tricarboxylic acids cycle (TCA) and then into oxidative phosphorylation to produce ATP, it is used also as precursor for production of metabolic intermediates for biosynthetic reactions and to synthetize neurotransmitters.
More, glucose can participates in an alternative pathway: the pentose phosphate pathway (PPP). Glucose oxidation through PPP provides 5-carbon monosaccharides for nucleic acid synthesis and NADPH for reductive biosynthetic processes and for maintenance of the redox balance in the cell.
Figure 7. Schematic representation of BBB J Nutr. 136:218S-26S (2006)
26
Brain glucose is also stored as glycogen but this stock is sufficient to sustain brain only for few minutes. Most of glycogen storage has localized in astrocytes, the metabolic supporter-cells for neurons (Vilchez D et al, 2007).
During special condition of prolonged deficiency of glucose, the brain utilizes protein as alternative source of energy and active neurons preferentially employ aminoacids comparing to resting neurons. The essential aminoacids, from the diet, cannot be synthetized by the brain and are necessary to make neurotransmitters that allow cells to develop networks and communicate each other. Phenylalanine, leucine, tyrosine, isoleucine, valine, tryptophan, methionine and histidine must to be supplied to brain metabolism and are precursor of dopamine, L-DOPA. These essential aminoacids enter the brain as rapidly as glucose and are transported into the brain by the leucine preferring or the L-type transporter-proteins through a competitive active transport. Although the BBB determines the availability and the brain content of essential aminoacids, astrocytes and neurons participate in maintaining the extracellular concentrations and regulate aminoacids concentration in extracellular fluid, that is important to maintain low concentration of neurotransmitter such a glutamate, aspartate, and glycine regulating brain’s stimuli. (Hawkins RA et al, 2006). Differently, lipids are not a major energy source for the brain.
Astrocytes are able to oxidize fatty acids and ketone bodies, while neurons and oligodendrocytes can only use ketone bodies. Ketone bodies are produced from Acetyl-CoA precursor and are synthesized by the liver after depletion of carbohydrates stocks or after a long glucose starvation period.
Moreover, Acetyl-CoA produced by the brain derived from pyruvate, but it can also originate from fatty acids, oxidized inside mitochondria, from ketone bodies, lactate and acetate.
Among brain’s lipids the most abundant is cholesterol, in fact, its metabolism is very different from that in the rest of body’s tissues and it is strictly regulated for optimal brain function. Recent evidences also showed that alteration of
27
cholesterol metabolism can lead to severe neurological disorders (Björkhem I et al, 2001; Wiegand V et al, 2003; Puglielli L et al 2004).
1.4.1 Brain cholesterol metabolism
Cholesterol in the body can derived from the diet uptake and from “de novo” synthesis. It is delivered to other tissue by blood circulation. It is generally assumed that cholesterol carried by plasma lipoprotein not enter the brain because of the Blood-Brain Barrier (BBB), in fact, the brain obtains all its cholesterol from in situ synthesis (Dietschy JM and Turley SD, 2001) and cannot retrieve cholesterol from the circulation (Björkhem I and Meaney S, 2004).
Nevertheless, brain is the most cholesterol-rich organ of the body, it contains about the 25% of the whole body cholesterol content, even its weight represent only the 2% of the body mass.
Brain’s cholesterol lies in three different compartment: 1) the larger pool, about 70-80%, is present in myelin membranes; 2) about the 10% resides in neurons and 3) the remaining 10% is contained in glial cells.
The huge amount of synthetized cholesterol is accompanied by a very slower turnover compared to other body’s tissues, such as liver, for example, and its concentration is kept stable (Spady DK and Dietschy JM, 1983). Among brain cellular compartments, the astrocytes are committed to cholesterol synthesis and they supply this metabolite to neurons. In fact, neurons are not able to produce cholesterol by themselves after birth and required astrocytes complete differentiation and metabolic participation to a normal function. Neurons required cholesterol for membranes integrity and to repair damage after brain injuries, to form synapses and for vesicles formation, for maintaining a proper signal transduction and in neurons communication mechanisms (Göritz C et al, 2002).
28
Astrocytes are intimately associated with neurons as well as with endothelial cells forming the BBB, they provide not only metabolic but also structural and
trophic support to neurons, release growth factors, control extra-cellular K+
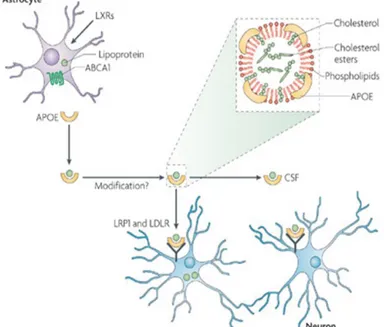
efflux and regulate brain immune response (C.Ehnholm. edition). Astrocytes secrete cholesterol in the form of ApoE-containing HDL-like lipoproteins (Gong JS et al, 2002), these particles are loaded with lipids through the ABCA1 plasma membrane transporter and needs additional ApoE molecules before binding to the neuronal ApoE receptors, the LDL receptor (LDLR) and LDLR-related protein 1 (LRP1) or being transported to the cerebrospinal fluid (CSF) to reach neurons. (Figure 8) (Bu G, 2009)
Figure 8. Delivery of ApoE-containing HDL-like lipoparticles.
Cholesterol and other lipids transported to neurons have important roles in synapse formation and repair. ApoE – lipoprotein particles are composed by: cholesterol, cholesterol esters and phospholipids. These particles are assembled and released by astrocytes and reach neurons through the cerebrospinal fluid (CSF)
29
Within the brain, in a specific population of neurons, cholesterol can be modified by a cytochrome P450 isoform, the CYP46A1, and it is transformed in the 24(S)-hydroxycholesterol. This compound has a very lipophilic character but despite this, it could traverse the BBB (Björkhem I, 2007).
1.4.2 Glioma cancer cells and metabolic dysregulation
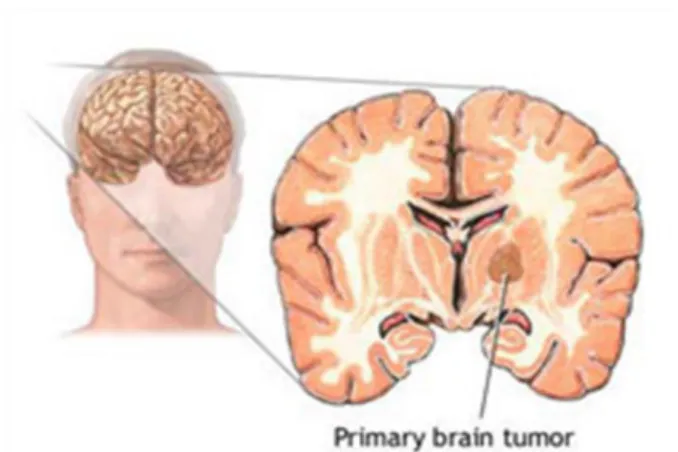
Glioma is a primary brain tumor that originates from the supportive cells of the brain, called glial cells (Figure 9). Glial cells are the most common cellular component of the brain, in fact, there are five to ten times more glial cells than neurons. Unlike neurons, glial cells have the ability to divide and multiply frequently and if this process occurs too rapidly and without control, a glioma forms.
There are three principle types of glial cells: astrocytes, oligodendrocytes and ependymal cells, the different glial cells originate different kind of glioma. The 2000 World Health Organization system divides them in astrocytoma, oligodendroglioma and apendymoma respectively (Kleihues P and Cavenee WK, 2000)
Figure 9. Glioma representation
30
Glioma cells present a strong infiltrative behavior and the majority of them are resistant to standard chemotherapy and radiotherapy treatments, and as tumor became more malignant, cells appear less differentiated. (Louis DN et al, 2001) Clinically, gliomas are divided into four grades and the most aggressive of these is the fourth grade glioma, called also glioblastoma multiforme (GBM). The latter has a really aggressive and poor prognosis, most patients’ life expectancy is less than one year and none has a long term-survival (Holland EC, 2000). New strategies are developing in order to improve patients’ outcome and to interfere with cancer development, some pathways were targeted, such as EGFR (Mellinghoff, I.K et al, 2005), PI3K/Akt (Chakravarti A et al 2004), and VEGF (Ferrara N, 2005).
Recent and accumulating evidences show that cancer cells reprogramme their metabolism to supply high-energy requirements of proliferating cells, for this reason, targeting metabolism has become a new and promising strategy to interfere with tumor growth. GBM presents elevated glycolysis rate, enhanced glutaminolysis and high rate in lipid synthesis (Ru P et al, 2013).
In glioma tissues, aerobic glycolysis is one of the major characteristic and, although under aerobic conditions, this is the preferential pathway to produce ATP and, furthermore, glycolysis is up regulated by PI3K/Akt pathway (Warburg effect).
Several enzymes of glycolytic pathway are involved and de-regulated in GBM. 1) Hexokinase (HK), able to catalyze the formation of Glucose-6-phosphate (G6P). GBM showed enhanced levels of HK2 isoform, which is present at high levels in GBM samples and is associated with tumor proliferation and radio-resistance during treatment (Wolf A et al, 2011).
2) PKM2, an isoform of the Piruvate Kinase (PK), is mainly expressed in proliferating cells (Mazurek S, 2011) and through its nuclear translocation, it is involved in EGFR signaling pathway and correlates with increase of β-catenin levels in GBM tumors (Yang W et al, 2011).
31
3) IDH, the isocitrate dehydrogenase, catalyzes formation of α-ketoglutarate through the oxidative decarboxylation of isocitrate, and generates NADH and NADPH (Reitman ZJ and Yan H, 2010). Mutation of IDH often co-occurs together with mutation of p53 (Watanabe T et al, 2009), mutated enzyme acquired new activity and is able to produce a particular product called 2-hydroxyglutarate (2-HG), presents in a very low level in normal cells but is has elevated level in GBM patients sample (Andronesi OC et al, 2012).
Glutamine metabolism has been reported to be up-regulated in cancer (DeBerardinis RJ et al, 2007) and even if its contribution is much less known than glucose metabolism involvement in cancer metabolic redesign, recent investigations highlighted the roles of strong transforming oncogenes, such as
c-Myc and RhoGTPase in glutamine pathway regulation in cancer cell
metabolism (Dang CV et al, 2009; Rathore MG et al 2012).
Boost in lipid synthesis has been largely found in tumor cells (Santos CR and Schulze A, 2012) and GBM also present higher levels of unsaturated fatty acids compare to normal brain (Gopal K et al, 1963).
Lipid droplets accumulation, detected by Nile red staining, had recognized in glioma samples according to malignancy grade, in a paper by Benedetti and colleagues (Benedetti E et al, 2010) and they also suggested involvement of peroxisomes in malignant progression of GBM. In particular, data by Benedetti et al., showed that peroxisomes number increased as a function of GBM malignant grade together with β-oxydation enzymes. Peroxisomes, participate to acetyl-CoA cellular production by a β-oxydation mechanism that, unlike mitochondria, is not coupled to ATP production for cell’s needs, moreover, peroxisome also influenced lipid synthesis directly on mevalonate pathway, because key enzymes of the pathway (Mevalonate Kinase, Mevalonate Diphosphate Decarboxylase and HMGCR) are located on cellular peroxisomes itself.
32
Other evidences highlighted upregulation of SREBP and downstream genes in GBMs and point out a regulatory role played by EGFR/PI3K/Akt (Guo D et al, 2011).
33
2. AIM OF THE STUDY
For my thesis work, I investigated regulation of Mevalonate pathway (MVA) enzymes in two different Glioblastoma multiforme (GBM) cell lines, to elucidate involvement of this pathway in cancer metabolic alterations.
The study focused on U343 MG and U251 MG glioblastoma multiforme cell lines, both classified as IV grade glioma, and their normal counterpart, the Normal Human Astrocytes (NHA) cells, in order to elucidate involvement of MVA pathway in cancer metabolism.
During the first phase of the study, I monitored the mRNA expression of HMGCR, MVK, FDPS, FDFT1, RabGGTA and LDLR in considered cell lines by quantitative RealTime-Polymerase Chain Reaction (qRT-PCR) and I evaluated the protein level of these enzymes by Immunoblotting assay. Because results revealed an up-regulation of these enzymes in NHA and U343 cell lines, harboring wt-p53, compared to cell lines with mutant p53, the U251 cells, I investigated whether p53 activation participates in transcriptional induction of these enzymes.
To confirm this hypothesis, in the second part of the study, I evaluated the binding of p53 on promoter sequences of the considered genes by Chromatine Immuno-Precipitation assays (ChIP). Results, confirmed by luciferase-reporter assays, showed that p53 directly recognizes specific p53-responsive elements (p53-REs) in HMGCR, MVK, FDPS and FDFT1 sequences.
This study unrevealed a new aspect of p53 features, unrelated to tumor suppression, as metabolic regulator of mevalonate pathway activity.
34
3. MATERIALS AND METHODS
3.1 Cell cultures
Normal Human Astrocytes (NHA) are normal human cells derived from human brain tissue and were cultured in recommended medium AGM™ BulletKit™ (Lonza), these cells were used as normal cell control system. High-grade glioblastoma multiforme (IV grade glioblastoma, according to WHO classification) U343 and U251 cell lines were maintained in EMEM
supplemented with 10% FBS.Human Embryonic Kidney 293 cells (HEK293)
were expanded in DMEM supplemented with 10% FBS.
All cell lines were cultured at 37°C in 5% CO2 controlled atmosphere.
3.2 Reagents
Etoposide (Eto), a p53 inducing drug (Karpinich NO et al 2002), and pifithrin-alpha (PT-α), an inhibitor of p53 transcriptional activity (Sohn D et al, 2009), were purchased from Sigma-Aldrich. To notice p53 and MVA enzymes induction, NHA cells were incubated with Eto 25 µM for 24 hours, I evaluated mRNA expression levels and investigated increase in p53 binding ability on MVA enzymes promoters in ChIP experiments.
PT-α was used in [14C] -Acetate experiment at concentration of 30 µM for 24
hours, it is used to interfere with p53 in cholesterol synthesis regulation. Nutlin-3a was purchased by Sigma-Aldrich, this drug activate p53 through Mdm2 binding (Mouraret N et al 2013), U343 cells were incubated for 24 hours with at a concentration of 10 µM for 24 hours.
Lovastatin (lova), a gift from dr. AW Alberts of the Merk, Sharp and Dohme
institute, was used in 14C acetate experiments to inhibit HMGCR activity, cells
35
3.3 Transfection procedure
Cells, at 80% confluence, were transfected using Lipofectamine®2000 (Life technology). Lipofectamine is cationic-lipid reagent formulated for the transfection of DNA into eukaryotic cells. Lipofectamine was diluted with culture medium EMEM, without FBS, and added to diluted DNA in a final volume of 100 µL, DNA-lipofectamine mixture was incubated for 5 min at room temperature and then added to cell culture. Ratio between DNA and Lipofectamine was 2,5 / 1. I transferred a total amount of 5 µg of plasmids for each well, while for co-transfection the total amount of transfected DNA was of 6 µM. After 6 hours, incubation medium was replaced with fresh and FBS added one. Cells were collected 36 hours later and analyzed for western blot, qRT-PCR and for luciferase assays.
3.4 quantitative Real Time – PCR (qRT-PCR)
Total RNA was isolated from 5 x 10⁶ cells at least, using the NucleoSpin RNA
II kit (Macherey-Nagel) which supplies all buffers for mRNA extraction. Cells were lysed with Lysis buffer, which immediately inactivated RNases and then vortexed vigorously. A first column, holding a violet ring-filter, was used to filtrate lysates by centrifugation for 1 min at 11,000xg. Filtrated lysates, added with 350 µL of 70% EtOH, were vortexed and loaded in a new column with light blue ring-filters to allow RNA binding to membrane. After tubes centrifugation, the Membrane Desalting Buffer (MDB) was added to filters to facilitate the following DNase digestion. 95 µL of DNA digestion mixture was loaded on filters and effected for 15 min at room temperature. Silica membranes were washed three times and finally dried. RNAs were eluted with 20-40 µL of
RNase-free H2O.
RNAs were quantified using UV absorption, the absorbance is measured at 260 and 280 nm, to calculate concentration and purity of samples and the instrument used was Nanoview spectrophotometer (GE Healthcare).
36
cDNA was synthesized with SuperScript II (Invitrogen).
For each RNA sample (1 µg of total RNA) were added 1 µL of dNTP Mix (10 mM each), 300 ng of random primers and sterile RNase-free water up to 12 µL. Reaction tubes were incubated in a termalcycler at 65°C for 5 min, later were added 4 µL of 5X First-Strand Buffer, 2 μL of 0.1 M DTT and 40 units of RNaseOUT™ and then incubated again at 25°C for 2 min. Finally 200U of SuperScript II were added to samples and they were heated at 25°C for 10 min and then at 42°C for 50 min. Enzymes used for retrotranscription procedure were inactivated at 70°C for 15 min.
With quantitative Real-Time and using specific primer sets (Table 1), I investigated the presence of MVA enzymes. SsoFast Eva Green supermix contains Sso7d polymerase and EvaGreen dye, a fluorescent nucleic acid dye, with 7,5 µL of this reagent, 1,5 µL of primers mix and with 4,75 µL of
DEPC-H2O (Sigma - Aldrich) I tested 2 µL of cDNA.
Amplification protocol is the following: 1) Enzyme activation: 95°C x 30 sec for 1 cycle; 2) Denaturation and Annealing/Extention phase, repeated for 40 cycles, respectively at 95°C x 5 sec and 60°C x 5 sec; 3) End-cycle at 70°C x 5 sec.
Cycle Threshold (Ct) obtained by Bio-Rad CFX96TM instrument, were
elaborated with the 2-ΔΔCt method and provided indications about quantity of
mRNA present in samples (Livak KJ and Schmittgen TD, 2001).
3.5 SDS-PAGE and Immunoblot analysis
Control and treated cells were washed twice with Phosphate Buffered Saline
(PBS) (NaCl 137 mM, KCl 2.7 mM, Na2HPO4 10 mM, KH2PO4 1.8 mM at pH
7.4) and resuspended in lysis buffer (Hepes 50 mM, NaCl 150 mM, EDTA 50
mM, NaF 100 mM, Na3VO4 2 mM, 10 % glycerol, Na4P2O7 10 mM, 10% triton
pH 7.5). Lysated were passed through a 23-gauge needle, ten times before centrifugation at 12000×g at 4° C. Aliquots of the cellular lysates,
37
corresponding to 50 µg of proteins, were added with Laemli buffer (4% SDS, 10% 2-mercaptoehtanol, 20% glycerol, 0.004% bromophenol blue, 0.125 M Tris HCl) and boiled for 2 min at 95°C. Sample were loaded in gel’s wells and electrophoresed at 40 mA on SDS-polyacrylamide gel.
Finally, proteins were transferred to nitrocellulose membranes, with a constant voltage of 100 V.
Filters were blocked with a 5% Non fat dry milk in TBS (50 mM Tris and 150 mM NaCl at pH 7.6) and incubated with specific antibodies.
Antibodies p53 (DO-1), p21waf, HMGCR, MVK, anti-FDFT1, anti-RabGGTA and anti-LDLR were from Santa Cruz Biotechnology while anti-FDPS was from Abcam and were used at a concentration of 1:1000.
3.6 Chromatin Immunoprecipitation Assays (ChIP)
Chromatin Immunoprecipitation (ChIP) experiments were carried out with
MAGnifyTM Chromatin Immunoprecipitation System (Invitrogen), using a
minimum of 6x10⁶ cells. The kit supplied all buffers. NHA, NHA incubated
with Eto (25µM for 24 h), U343, U251 and U251 transfected with pCMV-p53 cells were collected and washed with PBS and diluted at a concentration of
38
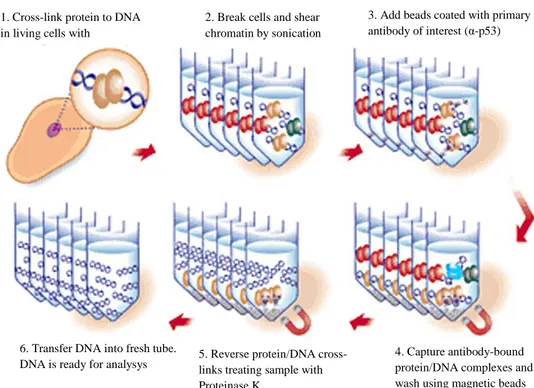
To ensure that protein linking chromatin were fixed on DNA, I cross-linked the cells with 13.3 µL of 37% formaldehyde. 15 minutes later, I added 57 µL of 1.25 M glycine to inactivate reaction. Cells were pelleted and washed with cold PBS and lysed in lysis buffer with protease inhibitors. I sheared chromatin by sonication in 200-500-bp fragments, employing BRANSON digital sonifier 250. An aliquot of sheared chromatin ( ̴ 300 µL) was collected and processed as DNA input control. Remaining chromatin solution was incubated overnight with antibodies-coated magnetic Dynabeads®, respectively with α-p53 (Invitrogen) and with IgG non-specific antibodies, used as negative control for immunoprecipitation procedure.
1. Cross-link protein to DNA in living cells with formaldehyde
2. Break cells and shear chromatin by sonication
3. Add beads coated with primary antibody of interest (α-p53)
4. Capture antibody-bound protein/DNA complexes and wash using magnetic beads 5. Reverse protein/DNA
cross-links treating sample with Proteinase K
6. Transfer DNA into fresh tube. DNA is ready for analysys
Figure 21. Schematic representation of ChIP procedure using magnetic beads
39
Chromatin-Antibody-Dynabeads® complexes were washed to remove any unbound product. With Reverse Crosslinking Buffer added with Proteinase K, I reverse the formaldehyde crosslinking of the chromatin and this phase affected aliquots of input DNA. Immunoprecipitated samples and input control tubes were incubated at 55°C for 15 minutes in a water bath. The last step of ChIP procedure consider purification of the un-crosslinked DNA using the DNA Purification Magnetic Beads and buffers provided in the kit. Samples incubated with DNA Purification Beads were finally incubated at 55°C for 20 minutes in a water bath to divide DNA from the beads.
Collected immunoprecipitated (IP) DNA subdued to qRT-PCR analysis. Obtained results were compared with their own input and adjusted for their respective non-IP.
3.7 Plasmid constructs
Human wild type p53 expression plasmid (pCMV-p53) was kindly provided by Professor Faraonio (Faraonio R et al, 2006), while mut(R273H)p53 plasmid was purchased by Addgene. Human genomic DNA from healthy donor were amplified using specific primer sets (Table 3). Cloning protocol considered the use of AccuPrime™ Pfx DNA Polymerase (Invitrogen) for high-fidelity amplification of DNA fragments for downstream applications such as cloning and mutagenesis. High fidelity is provided by the proofreading 3´→5´ exonuclease activity.
For PCR amplification procedure, I used 5 µL of 10X AccuPrime™ Pfx Reaction mix, 1.5 µL of primer mix (10 μM each), 50 ng of template DNA, 1unit of AccuPrime™ Pfx DNA Polymerase and autoclaved distilled water up to 50 µL.
Template were first denatured at 95°C for 2 min, then, with a three step cycling I performed 35 cycle as following: Denaturation step at 95°C for 15 sec, Annealing step at 60°C for 30 sec and Extending step at 70°C for 1 min long for
40
each template kb. Finally, I tested fragments’ weight on 1 % agarose and purified them for digestion.
Cloning primers possess a 5’ tail recognized by restriction endonucleases KpnI and HindIII (New England BioLabs® inc.) and same enzymes were used to digest pGL3 plasmids and open it in correspondence of the multi-restriction site region (Figure 21).
Fragments were digested at first with KpnI enzyme for 1 hour (1µg of DNA, 5 µL of 10xNEB Buffer, 10 U (= 1 µL) of KpnI restriction endonuclease in a total of 50 µL) and later digested again with HindIII endonuclease (1µg of DNA, 5 µL of 10xNEB Buffer, 10 U (= 1 µL) of HindIII restriction endonuclease in a total of 50 µL).
Accomplished procedure the incubation with T4 DNA ligase (2 µL of 10xT4 DNA ligase Buffer, 50 ng of pGL3 digested vector, 50 ng of digested insert DNA and nuclease-free water up to 20 µL, 400 U of T4 DNA Ligase should be added at last).
Figure 21. pGL3-Basic Vector schematic representation www.promega.com
41
Deleted constructs were obtained with the same procedure, but using specific deletion primer sets (Table 5).
Promoter constructs carrying mutations in the p53 responsive elements were achieved by site-directed mutagenesis employing the QuikChange II- XL Site-Directed Mutagenesis kit (Agilent technology). This kit, containing a particular Taq polymerase, the PfuUltra HF DNA polymerase, is optimized for large constructs amplifications and allows site-specific mutation in double-stranded plasmid using specific mutagenic primers (Figure 22) (Table 6).
Experimental protocol was the following: 5 µL of 10xReaction Buffer, 10 ng of double strand DNA template, 125 ng of each mutagenic primers, 1 µL of dNTPs purchased by the kit, 3 µL of Quik solution and distilled water up to 50 µL. Reaction was drived for 1 cycle at 95°C for 1 min, for 18 cycles repeating 95°C
Figure 22. Overview of the QuikChange II XL site-directed mutagenesis method
42
for 50 sec, 60°C for 50 sec, 68°C for 1 min/kb of plasmid length, for 1 cycle at 68°C for 7 min.
At the end of cycles, 1 µL of DpnI endonuclease was used to digested the parental DNA template and selected, in this way, for mutation-containing synthesized DNA.
3.8 Luciferase Reported Assays
U343, U251 and transfected U251 cells were cultured in 48-wells plates in
triplicates, at an estimated cellular concentration of 5x10⁴ cells/well. 24 hours
later cells were transfected using Lipofectamine (already described in 3.6 Transfection procedure) with 1 µg/well of pGL3 basic vector containing the promoter constructs of considered enzymes.
Transfected U251 cells were co-transfected with the above-mentioned concentration of promoter construct plasmids plus 400 ng/well of pCMV-p53. To normalize transfection efficiency, cells were co-transfected with β-Galactosidase plasmid (500 ng), which contains a functional lacZ cloned downstream of SV40 promoter and enhancer (Promega).
Control cells were transfected with 400 ng/well of a pGL4 Luciferase Reporter Vector plasmid, containing luciferase gene that I considered as control-mock. Luciferase assays were performed with Luciferase System Assay by Promega. 48 hours later transfection, cells were harvested, washed twice with PBS and then lysed to carry out the reporter assay with Reporter Lysis Buffer purchased by the kit, it is a mild lysis agent requiring a freeze-thaw cycle to achieve complete cell lysis. 20 µL of cell lysate was added with 100 µL of Luciferase Assay Reagent and read with Plate-Reading Luminometer (SpectraMax L Luminescence Microplate Reader). Another aliquot of 20 µL of cellular lysate was used to quantify β-Gal concentration using 100 µL of substrate solution. Luciferase’s activity in cell lysates was normalized for protein concentration and to control β-Gal signal.
43
3.9 [14C]-Acetate uptake
Actively growing, subconfluent cells were serum starved for 24 hours prior to incubation with lovastatin (10 µM for 24 hours) and PT-α (30 µM for 24 hours)
and prior to radiolabelling with [14C]-Acetate (American Radiolabelled
Chemicals). After drugs’ administration, cells were incubated with 7 µCi/mL of
[14C]-acetate. Cells were labelled for 14 hours, then washed and harvested with
cold PBS, pelleted at 1300 rpm for 2 minutes, in a Beckman Spinchron DLX, and resuspended in 75% EtOH. Cellular extracts were normalized to protein content, dissolved in 0.5-1 mL of chloroform, and dried. Cellular lipids content were resolved by Thin Layer Chromatography (TLC), aliquots of 10 µL were loaded on TLC-Silica gel-60G (Millipore) in presence of cholesterol standard (NEN products - DuPont) and developed in hexane/diethylether/acetic acid (70:30:1) used as solvent system (Perillo B et al, 1995).
3.10 Patients
This study has the approval of the Hospital Ethics Committee and all patients signed an informed consent before participating in the study. Samples were collected between 2008 and 2013 from patients underwent surgical resection for a diagnosed primary brain glioma, and came from Department of Neurosurgery, “S.Salvatore” Hospital, L’Aquila, Italy and from Department of Neurological Sciences, O.U. Neurosurgery, “G.Rummo” Medical Hospital, Benevento, Italy. All patients were diagnosed according to the World Health Organization (WHO) classification in grade IV glioma (Glioblastoma Muliforme: GBM), grade III glioma (Anaplastic Astrocytoma: AA), grade II glioma (Low grade astrocytoma: LGA). Ages ranged between 26 and 73 years with a mean age of 52 years old. All patients underwent a complete clinical evaluation at the hospital admission in order to evaluate clinical conditions and Karnofsky Performance Status (Mor V et al, 1984).