1
Università degli Studi di Ferrara
NOVEL TECHNIQUES FOR IN VIVO
CHARACTERIZATION OF SHORT
PEPTIDES AND PROTEINS IN
MEMBRANE PERMEABILIZATION AND
SIGNAL TRANSDUCTION
MARCO AQUILA
PhD thesis in “Biomedical Sciences”
2
Università degli Studi di Ferrara
DOTTORATO DI RICERCA IN
"
SCIENZE BIOMEDICHE
"
CICLO XXIVCOORDINATORE Prof. Capitani Silvano
NOVEL TECHNIQUES FOR IN VIVO
CHARACTERIZATION OF SHORT PEPTIDES AND
PROTEINS IN MEMBRANE PERMEABILIZATION
AND SIGNAL TRANSDUCTION
Settore Scientifico Disciplinare BIO/09
Dottorando Tutore
Dott. Aquila Marco Prof. Rispoli Giorgio
3 ABSTRACT
My scientific interest is focused on the field of cellular electrical activity, ranging from the study of intracellular enzymatic processes to the characterization of new generation of drugs. For this purpose I also used the most powerful techniques of investigation, including patch-clamp technique, fluorescence imaging, and surface plasmon resonance (SPR) spectroscopy. Moreover, to shed light on complex molecular mechanisms, unconventional strategies were employed, requiring sometimes the realization of specific devices not commercially available.
In particular my PhD thesis includes two different scientific projects: the biophysical characterization of antimicrobial peptides and the modulation of visual phototransduction in vertebrate cones.
In the first project, the patch-clamp technique was employed to study the pore forming properties of synthetic cecropin-melittin hybrid peptide (CM15), alamethicin F50/5 and its synthetic analog [L-Glu(OMe)7,18,19] under strict physiological conditions. These short peptides selectively permeabilize the bacteria plasma membrane leading to their lyses and death: they are therefore a source of antibacterial molecules, and inspiration for novel and more selective drugs. I pursued this study by recording the ion current through the channels formed by these peptides, once inserted in the membrane of photoreceptor rod outer segment membrane (OS) isolated from frog retinae. The peptides were applied to (and removed from) the extracellular OS side in ~50 ms with a computer-controlled microperfusion system, so that the ion channel characteristics (as its selectivity, blockade and gating) and the dynamics of pore formation could be precisely assessed. On the basis of the electrophysiological recordings obtained, it was demonstrated that, different than alamethicins, CM15 produced voltage-independent membrane permeabilisation, repetitive peptide application caused a progressive permeabilisation increase, and no single-channel events were detected at low peptide concentrations. Collectively, these results indicate that CM15 form pores according to a toroidal model. Moreover, in order to understand the divalent-cation dependency of [L-Glu(OMe)7,18,19] binding to the lipid bilayer at the molecular level, the electrophysiological experiments were paralleled with experiments employing SPR spectroscopy. Results indicate the presence of Ca2+ in the external solution increases the probability of formation of smaller and more stable [L-Glu(OMe)7,18,19] pores.
The second project of this thesis concerns the investigation of the physiological role of the neuronal calcium sensor zGCAP3 in the photrasduction cascade. This study was pursued
4
through the simulation of an over expression and a knock-down of this protein, by delivering it, or its monoclonal antibody, into zebrafish cone cytosol, while recording their photoresponses with the patch-clamp technique. The intracellular protein delivery was attained via the patch pipette, by ejecting the proteins out of a tube inserted into the pipette lumen. A microperfusion system was employed to apply the desired exogenous molecules with a precise timing. However, the long tapered shape of the pipette shank make it very difficult to perfuse efficiently the cell with this strategy. For this reason a pressure polishing setup was assembled to enlarge the patch pipette shank, through the calibrated combination of heat and air pressure. This allowed to insert quartz or plastic tubes in the pipette lumen very close to its tip. In order to obtain a substantial and specific silencing of the zGCAP3s in zebrafish cones, surface plasmon resonance experiments were performed to allow the selection of a monoclonal antibody with strong affinity for zGCAP3 and low cross interaction with other components of the phototransduction cascade. Results showed that the perfusion with GCAP3 did not altered significantly the light response, while he anti-zGCAP3 incorporation in the cytosol caused the progressive photoresponse fall, followed by the progressive fall of saturating flash response amplitude, probably due to the progressive GC inhibition. The unexpected lack of an effect of zGCAP3 incorporation in the cone cytosol, suggests that the endogenous number of zGCAP3 is saturating, i.e. their number is equal or above the number of their target molecules (guanylate cyclase), therefore any further increase of zGAP3 in the cytosol is uneffective.
5
TABLE OF CONTENTS
ABSTRACT
1. INTRODUCTION
1.1 ANTIMICROBIAL PEPTIDES
1.1.1 Methods to study pore formations dynamics of AMPs 1.1.2 Peptaibol alamethicin F50 and analogues
1.1.3 Cecropin-Melittin Hybrid Peptide CM15
1.2VISUAL PHOTRASDUCTION IN VERTEBRATE
1.2.1 Guanylate cyclase-activating proteins (GCAP)
1.2.2 Guanylate cyclase-activating proteins in the Zebrafish retina 1.2.3 A novel strategy to investigate the physiological role of zGCAP3
2. METHODS
2.1 ANTIMICROBIAL PEPTIDES SEQUENCES AND USAGE 2.2 PROTEINS AND ANTIBODIES
2.2.1 zGCAP3, zGCAP4 and IgG1 monoclonal antibodies
2.2.2 Antibodies purification by anion-exchange-chromatography (AEC)
2.3 CELL PREPARATION
2.3.1 Rod and cone outer segments isolation procedure 2.3.2 Cell viewing
2.4 ELECTROPHYSIOLOGY 2.4.1 Patch-clamp technique 2.4.2 Pressure polish setup
2.4.3 Pressure polishing procedure and pipette usage
2.4.4 Sealing virtually on any membrane with just one glass type 2.4.5 Intrapipette perfusion
2.4.6 Fast external perfusion system
6
2.4.8 Zebrafish cones recording, light stimulation, intracellular perfusion and solutions 2.4.9 Fluorescence imaging
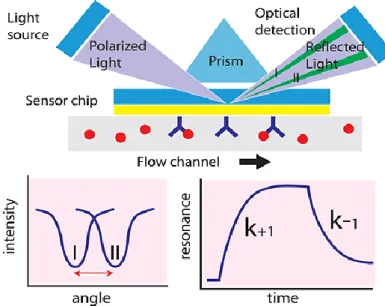
2.5 SURFACE PLASMON RESONANCE (SPR) SPECTROSCOPY
2.5.1 SPR theory
2.5.2 SPR analysis of zGCAP3-antibody interactions
2.5.3 Peptide-membrane interactions monitored by surface plasmon resonance 2.5.4 Liposome preparation for surface plasmon resonance experiments 2.5.5 Fitting of data to interaction models
3. RESULTS AND DISCUSSION
3.1 OS endogenous conductances and antimicrobial peptide characterization
3.1.1 Comparison between CM15 and F50/5 permeabilization properties 3.1.2 F50/5 monomer assembling mechanism
3.1.3 Role of divalent cation in [L-Glu(OMe)7,18,19]-membrane interaction and pore formation
3.1.4 Membrane binding of [L-Glu(OMe)7,18,19] monitored by SPR
3.1.5 Ca2+-sensitivity of Trichogin GA IV and [L-Glu(OMe)7,18,19] binding to membrane
3.1.6 Ca2+ -dependent modulation of antimicrobial peptide activity
3.2 Modulation of zebrafish cone phototransduction by intracellular delivery of zGCAP3 and of its antibody via patch-clamp pipette
3.2.2 Zebrafish cones dialysis with ZGCAP3
3.2.3 Determination of IgG1 monoclonal antibodies- zGCAP3 affinity by SPR 3.2.4 Binding properties of purified IgG1 7E6
3.2.5 Comparison between global and local fitting to the sensorgrams 3.2.6 zGCAP3 dimerization test
3.2.7 Ca2+-independence of the antibody interaction with zGCAP3 3.2.8 Mass transfer limitation in SPR experiments
7
1. INTRODUCTION
1.1 ANTIMICROBIAL PEPTIDES
In the last decades, there is a dramatic increase in the number of common and emerging cases of infection due to antibiotic-resistant bacteria, occurring for instance in hospitals and in high frequented spaces. Antibiotic resistance develops when a microorganism mutates or acquires a resistance gene so that standard treatments become ineffective and infection persists. Therefore, discovery and development of new antibiotics is crucial. Part of the work described in this thesis is focused on the study of antimicrobial peptides (AMPs), which represent a potential class of novel antimicrobial agents. These peptides are an evolutionarily conserved component of the innate immune response, which is the main defence system for the majority of living organisms, and are found among all classes of life ranging from prokaryotes to humans (Ganz, 2003). The broad-spectrum activity, the high efficacy and the low level of induced resistance of AMPs (Gordon et al., 2005) have stimulated the research toward the clinical application of these peptides. Besides the development of anti-bacterial drugs, the pore-forming peptides, being the most ancestral form of membrane pores, provide also a simple model system to understand the structure-function relationships of channels and the molecular basis of peptide/protein oligomerization in lipid membranes. Moreover, these peptides are a powerful molecular model on which to build custom molecules with wide-ranging biotechnological applications, as ion channel modulators (Hille, 1992), anti-tumorigenic agents (Papo & Shai, 2005, Hoskin & Ramamoorthy, 2008) biosensors for many different analytes (Aili & Stevens, 2010), and provide a pharmacological approach to cure channelopaties (Wilde, 2008). In the latter case, a synthetic channel could be inserted in cells expressing an aberrant ion channel (Wallace et al., 2000) to restore the physiological ion flow. AMPs may finally provide insights about the evolution of channel selectivity and gating and, more generally, of ion pumps and exchangers: recent data from many laboratories indicate indeed that secondary transporters are basically pores with an highly specialized gate system (Gadsby, 2009). Antimicrobial peptides are classified on the basis of their amino acid composition (generally between 12 and 50 amino acids), spectrum of activity and mode of action. According to a structural scheme of classification (Fig. 1.1), the two largest groups are the α-helical and β-sheet peptides, but other examples of conformations have also been identified: the β-hairpin conformation, for example, is due to the presence of one or more disulfide bonds. Moreover,
8
many peptides are unstructured in free solution and fold into their final configuration during the interaction with phospholipids of cell membranes.
Fig. 1.1. An overview of the major structural classes of host-defense peptides including a α-helices, b β-sheets, c a mixture of α-helices/β-sheets structures, d cyclic, and e extended structures. Disulfide bonds are represented in ball and stick.
The AMP mode of action can be broadly divided into intracellular and extracellular mechanisms (Brogden, 2005). The former include the inhibition of DNA or RNA synthesis or blocking of other enzymatic processes involved in bacteria metabolism (Fig. 1.2); the latter consist mainly in a peptide-membrane interaction resulting in the membrane permeabilization and the consequent lysis and death of the pathogen.
9
This peptide activity and specificity is modulated by several structural and physicochemical parameters of AMPs such as: aminoacid sequence, charge, amphipathicity and secondary structure. Moreover differences in biomembrane composition create an important first discrimination between prokaryotic and eukaryotic cells during the immunity response mediated by AMPs. Indeed, cell membranes of many pathogens are characterized by an high electronegativity due to a predominant concentration of phosphatidylglycerol (PG), cardiolipin (CL) and phosphatidylserine (PS) and this increases the peptide antimicrobial effect. Mammalian cell membranes are instead generally neutral, due to the presence of zwitterionic phospholipids such as: phosphatidylethanolamine (PE), phosphatidylcholine (PC) and phosphatidylserine (PS). Based on these considerations it is clear that peptides with a net positive charge showed a stronger activity against pathogens, with an optimal range between +2 and +9, as demonstrated in the case of the AMP mellitin and magainin analogs (Dathe et al., 2001).
Fig. 1.3. Mechanisms of cell membrane permeabilisation induced by a peptide. After adhering on the external face of the membrane (a and b), the peptide could insert in the membrane according to a barrel stave (c), toroidal (d and e), or carpet mechanism (f and g).
10
Therefore, the right equilibrium between hydrophobic and hydrophilic aminoacids determinates the extent to which AMPs can partition into the lipid bilayer forming transmembrane pores. However, a strong hydrophobicity is related to an high toxicity and loss of antimicrobial specificity (Yeaman & Yount, 2003).
Regardless their origin and purpose, all the membrane permeabilizing peptides adhere first parallel to the lipid bilayer (Fig. 1.3a and b), they then orient perpendicular to the membrane, and finally they bind together and/or reorganize the lipid bilayer to form transmembrane pores. Because of their amino-acid composition, amphipathicity, and cationic charge, three distinct mechanisms have been proposed to explain membrane permeabilization (Brogden, 2005): “barrel and stave”, “toroidal”, and “carpet” (Fig. 1.3). The first mechanism requires that the peptide monomers, weekly bound to the membrane surface (Fig. 1.3a), orient perpendicularly to the latter and bind together (as staves) around a central pore (the barrel; Fig. 1.3c). The peptide hydrophobic segments face the bilayer core, while their hydrophilic segments face the pore lumen. In the toroidal pore, the polar segments of the peptides interact with the polar head groups of the lipids more strongly than in the case of the barrel and stave pore, so that the lipids are forced to tilt from the lamellar normal up to connect the two leaflets of the membrane, forming a continuous bend from one side to the other of the membrane, in the fashion of a toroidal hole (peptides spanning the entire membrane: Fig. 1.3d; peptide shorter than the membrane thickness: Fig. 1.3e). Differently from the barrel and stave mechanism, the peptides are always associated with the lipid head groups, even when they are perpendicularly inserted in the lipid bilayer. In the carpet mechanism, the strong electrostatic interactions between peptides and the phospholipid head groups result in the peptide carpeting of the membrane (Fig. 1.3b). The peptides then assemble with the lipids to form transiently toroidal pores (Fig. 1.3e), allowing more and more peptides to cross the bilayer and eventually cover the other membrane leaflet. Finally, the peptides may isolate a micelle that detach from the membrane to head to the water phase (Fig. 1.3g), leading to the bilayer disintegration in a detergent-like manner. It is also possible that the contour of a micelle may be delimited by several toroidal pores that happen to group together (Fig. 1.3d), and this micelle may eventually separate from the membrane and solubilize (Fig. 1.3f). Moreover, it is conceivable that the same peptide may permeabilize the membrane with one mechanism or with another (Brogden, 2005), depending upon the surrounding conditions, as the lipid environment, the temperature, the peptide concentration, the presence of some other endogenous or exogenous molecules (Noshiro et al., 2010)., etc.
11
1.1.1 Methods to study pore formations dynamics of AMPs
Several approaches are used to assess the mechanisms of AMPs activity. The first one is to observe the microbial cell integrity following the application of AMPs, by using advanced microscopy techniques, as confocal laser-scanning microscopy or scanning and transmission electron microscopy (Kalfa et al., 2001, Yenugu et al., 2004). The peptide-membrane interactions are studied by employing a large variety of biophysical techniques: differential scanning calorimetry (DSC), circular dichroism (CD) spectroscopy, NMR, surface plasmon resonance (SPR), and scattering techniques (X-ray and neutron scattering). Pore formation is one of the most intensively studied AMPs mechanism of action. Most of the research on these AMPs, has the long-term goal to understand at the molecular level how the peptide-lipid interactions produce structural changes in both, and optimal peptide orientation, to eventually produce a raise in membrane conductance (Chen et al., 2001, Saint et al., 2002). This membrane permeabilization can be followed by measuring, for instance, the release of fluorescent-labelled molecules trapped into phospholipid vescicles, or measuring the ionic current flowing through the AMPs-induced pores. With this aim, a widely used technique consists in recording the ion current flowing through the pore formed by these peptides inserted in an artificial lipid bilayer. To have an acceptable signal-to-noise ratio in these experiments, it is necessary to apply non-physiological voltages and ionic gradients, that however could affect the peptides themselves, or even the membrane in which they were inserted (Bockmann et al., 2003). Moreover no studies addressed directly the kinetics with which peptides assemble and disassemble to form a functioning pore in the plasma membrane of a living cell. In this thesis, the biophysical characteristics and the pore formation dynamics of selected antimicrobial peptides and some of their analogues, were studied under strict physiological conditions. This was accomplished by inserting these (or other) peptide monomers in the plasma membrane of a living cell, and recording the current flowing through the peptide channels at a desired voltage by using the whole-cell, patch-clamp technique (see Methods). To make sure that the entire current was flowing through these channels, it was looked for a particular cell system where all the endogenous conductances could be blocked without using any drug, that could affect the peptide pore as well. The outer segment of the photoreceptor rod (OS) mechanically isolated from low vertebrate retinae (Rispoli et al., 1993) is such a cell system, because the only channel type of this cell fragment is fully closed by bright light. The OS of Rana esculenta have been found particularly suitable to carry on this study, because of their large size and for the
12
commercial availability and low cost of this edible frog species. To have a precise control of pore formation (and disaggregation), a custom-made, computer controlled microperfusion system was employed to rapidly apply (and remove) the peptides under study onto a cell. Peptide formation and disaggregation dynamics were therefore gathered, respectively, from the time course of the development and fall of the exogenous current (at a given potential, Vh),
following peptide application and removal (Vedovato et al., 2007). This system is also capable to apply and remove ions, drugs and peptides on any isolated cell or tissue fragment in ~50 ms with an accurately controlled timing. This thesis focuses on the biophysical characteristics and the pore formation dynamics of the major component of the neutral fraction (F50/5) of the alamethicin, the L-Glu(OMe)7,18,19 alamethicin analog and the Cecropin-Melittin Hybrid
Peptide CM15.
1.1.2 Peptaibol alamethicin F50 and analogues
Peptaibiotics are an important group of antibiotic peptides, which are biosynthesized by fungi, mainly of the Trichoderma genus. They are linear and amphipathic polypeptides,
composed of 5 to 20 amino acids (e.g., peptaibolin, atroviridin, alamethicin, suzukacillin, paracelsin, polysporin), and contain non-proteinogenic amino acid residues such as α-aminoisobutyric acid (Aib).The N-terminal residues of peptaibiotics are usually acetylated, and an amino alcohol (phenylalaninol, valinol, leucinol, isoleucinol, or tryptophanol) is linked by a peptide bond at the C-terminal end. Alamethicins, the longest peptaibiotics, are a group of closely sequence-related peptides composed of 19 amino acid residues and exhibit biological activities including antibacterial and antifungal effects. They form voltage-dependent pores into biological membranes, and are the most extensively investigated among simple model compounds of large pore-forming proteins. The hydrophobic nature of alamethicin allows it to be inserted into biological membrane forming unspecific ion channels (with up to approximately 10 Å pore size) supposedly based on the transmembrane assembly of 6 or 8 helical alamethicin molecules according to the “barrel stave” model (Baumann & Mueller, 1974, Boheim, 1974). This thesis is focused mainly on the biophysical characteristics and the pore formation dynamics on natural membranes of the synthesized F50/5 peptaibol, which is the major component of the neutral fraction of the alamethicin, and its synthetic analog [L-Glu(OMe)7,18,19]. The latter was obtained from F50/5 aminoacid sequence by substitution of glutamine (Gln) residues at positions 7, 18, and 19 with side-chain esterified glutamic acid (Glu) residues, because Gln was believed to be of key relevance for the pore formation (Fox &
13
Richards, 1982, Molle et al., 1996). The three dimensional structure of [L-Glu(OMe)7,18,19] at a resolution of 0.95 Å, resolved from the electron density maps obtained by using the synchrotron radiation, consisted of two crystallographically independent bent α-helices (showed in Fig. 1.4), just long enough to span the membrane, but that cannot conduct ions through the hole produced by their helical arrangement (Crisma et al., 2007).
Fig. 1.4. The α-carbon traces of the two crystallographically independent bent [L-Glu(OMe)7,18,19] α-helices a and b (Crisma et al., 2007).
In order to shed light on the different aspects and phases of the peptide-membrane binding, in this thesis the electrophysiological experiments with [L-Glu(OMe)7,18,19], were
paralleled by SPR investigation. The latter is an optical method to monitor biomolecular interactions (see Methods), and specific SPR-based biosensors have been developed to measure differences in peptides association with different biomimetic membranes (Hall & Aguilar, 2010).
1.1.3 Cecropin-Melittin Hybrid Peptide CM15
The aminoacid sequences of AMPs is strictly correlated to their antibiotic activity: indeed, the creation of antimicrobial peptide chimeras, by the hybridization of specific aminoacid sequences from different AMPS, is one successful approach to improve the antimicrobial effect, reducing toxicity toward eukaryotic cells. In this thesis it was addressed the study of the pore formation properties of CM15, which is an α-helix hybrid, composed of the first seven residues of cecropin A and residues 2–9 of the bee venom peptide mellitin. Cecropin A is a naturally occurring, 37-residue, helical antimicrobial peptide found in the silk moth Hyalophora cecropia, and mellitin is a 26-residue peptide found in the venom of the
14
honey bee Apis mellifera. While mellitin has potent, broad-spectrum antimicrobial activity, it is extremely hemolytic, causing damage to host red blood cells. In contrast, cecropin A shows low cytotoxicity but has lower antimicrobial activity. The CM15 hybrid was first synthesized by Andreu (Andreu et al., 1992) who combined the favorable characteristics of each AMP: the resulting peptide displays potent broad-spectrum antimicrobial activity and low cytotoxicity. However, it is not clear whether CM15 forms discrete membrane pores or disrupts membranes via a detergent-like carpet mechanism. In this thesis, it has been studied the biophysical characterization of the pore formation dynamics of CM15 under physiological conditions. This allowed to study, besides the ion channel characteristics (such as the presence of gating, its voltage dependence, the unitary conductance, and the selectivity and blockade), the dynamics of pore formation as well, that are of key importance to assess the channel performance and its potential biotherapeutic activity
15
1.2 VISUAL PHOTRASDUCTION IN VERTEBRATE
Phototransduction is the process that occurs in vertebrate photoreceptor cells by which the energy of a photon is captured by a visual pigment molecule and is converted into a detectable electrical signal, trough the activation of a cascade of biomolecular events exhibiting an high degree of amplification. There are two classes of photosensitive cells: rods and cones (Fig. 1.5). Cones function in bright light (daylight) and are responsible for colour vision. Rods are sensors of dim light and do not discern colours, but they are able to detect even single photons, due to an extremely high amplification not paralleled by other signal transduction pathways.
Figure 1.5. Structure of the retina and photoreceptor cell types. a Simple diagram of the neuronal organization of the retina, where the photoreceptors are connected to the ganglion cells through several interneurons of three types. b The two types of photoreceptors: rods (left) and cones (right). The outer segment of each cell contains the lamellar membranes in which are embedded most of the proteins of the phototransduction cascade, and where phototransduction occurs. Photoreceptor inner segments contain the nucleus, organelles (mitochondria, ribosomes, endoplasmic reticulum, synaptic vesicles, etc), and the synaptic terminal (where neurotransmitter is released).
In the dark-adapted state the presence of cGMP in a photoreceptor cell keeps the cGMP-gated channels open, allowing a steady inward current, carried by Na+ and Ca2+ called the dark current (Fig. 1.6). The inward current driven by Na+ and Ca2+ is balanced by an outward K+ current through K+ and Ca2+ selective channels. The resulting circulating current keeps the cell depolarized at about -40 mV. The depolarization of the cell membrane opens voltage-gated Ca2+ channels: the consequent increase of intracellular Ca2+ concentration causes the release of glutamate at the synaptic terminal toward the bipolar and the horizontal cells. Light activates an enzymatic cascade which ends with the hydrolysis of cGMP causing the closure of the cGMP gated channels reducing the influx of Na+ and Ca2+. The consequent reduction of cationic influx
16
causes photoreceptor hyperpolarization, the closure of the voltage-gated Ca2+ channels and the reduction of the rate of neurotransmitter release at the synapse (Fig. 1.6, right).
Figure 1.6. Left Ion fluxes across the membrane of a photoreceptor cell (in this case, a rod). Right Electrical response of an isolated rod photoreceptor. Upper right panel the transient suppression of the current entering the outer segment in response to 20 ms flashes of light of progressively increasing intensity, is recorded with a suction pipette; lower right panel simultaneous voltage recording with an intracellular microelectrode impaling the inner segment.
The complex molecular mechanisms underlying the visual cascade allow the effective transduction of light into a photocurrent change, which can be detected by electrophysiological recordings performed either on single isolated cells or, in vivo, on the animal itself. Such mechanisms have been deeply studied in the last four decades, and many of the elements and physiological properties of the signalling cascade are now well established (Rispoli, 1998, Lamb & Pugh, 2006, Dell'Orco et al., 2009). The elements of the phototransduction enzymatic cascade are packed into a stack of flattened, membranous vesicles, called disks, that in rods are enclosed by the membrane of the outer segment, while in cones the disk membranes are invaginations of the plasma membrane (Fig. 1.5b).
The phototransduction cascade is initiated by the absorption of light by 11-cis-retinal, a chromophore bound to rhodopsin (R), a member of seven-transmembrane helix receptor coupled to G-protein (GPCRs). After the photon absorption, 11-cis retinal undergoes photoisomerization to all-trans retinal, a form that causes a conformational change of the visual pigment (R) in its activated form, known as metarhodopsin II (MII or R*).
17
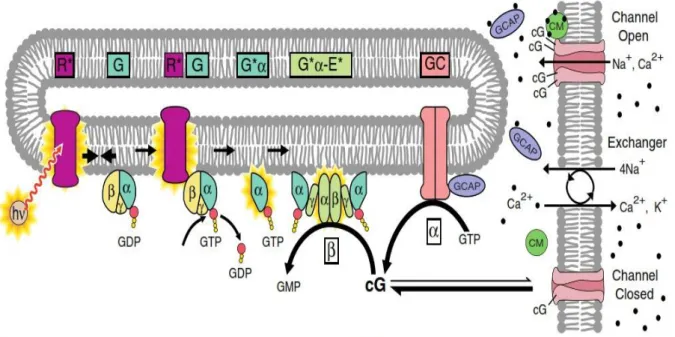
Fig. 1.7. Phototransduction cascade activation by light.
Within a millisecond of photon capture, R* activates heterotrimeric GDP-bound transducin (G) by catalyzing the GDP/GTP exchange on its α subunit (G*α), which is followed by the dissociation of the GαGTP complex from the βγ dimer. GαGTP activates phosphodiesterase (PDE), which is an holo-enzyme composed by two catalytic (α and β) and two regulatory (γ) subunits. The GαGTP removes the γ subunit from the catalytic sites of PDE, which in this active form (E*) hydrolyzes guanosine 3-cyclic monophosphate (cGMP). The consequent reduction of the cGMP concentration leads to the closure of cyclic nucleotide gated channels, which in turn determines a decrease in the circulating ion current due to the reduction of the inward Na+ and Ca2+ current. Consequently, the intracellular Ca2+ concentration drops, due to continuous Ca2+ extrusion from the cell via the Ca2+/K+–Na+ exchanger.
18
The decline of Ca2+ concentration with light, causes the release of Ca2+ from at least three Ca2+ sensor proteins which act through a negative feedback mechanisms on the cGMP channels: calmodulin, GC-activating proteins (GCAPs), and recoverin (Rec). These mechanisms mediate response shut-off and adaptation of the signalling cascade (Fain et al., 2001, Nakatani et al., 2002). In detail, release of Ca2+ from calmodulin causes its dissociation from the cGMP gated channels, thus increasing their affinity for cGMP; GCAPs activate instead guanylate cyclase (GC) following Ca2+ release, thus promoting the cGMP recovery at the shut-off of the light stimulation. (Fig. 1.7). Indeed, the Ca2+/GCAP-dependent regulation of GC activity forms a powerful negative feedback mechanism, in which the rate of cGMP synthesis increases as Ca2+ falls during the photoresponse, thereby setting the photoresponse amplitude, accelerating the recovery phase of the photoresponse, and improving the signal-to-noise characteristics of the rod. Finally, release of Ca2+ from Rec makes the latter to dissociate from Rhodopsin kinase (RK), which becomes free to phosphorylate the C-terminus of R*. This allows the association of R* with Arrestin (Arr), resulting in R* inactivation (Fig. 1.8a). Signalling shut-off also includes the simultaneous deactivation of GαGTP and PDE, which occurs because G*α possesses an intrinsic catalytic activity, which hydrolyses bound GTP in GDP. This hydrolysis is significantly accelerated by a multiprotein complex, called RGS-Gβ5, which is formed by the ninth member of the regulators of G-protein signalling (RGS) family, bound to its obligatory Gβ5 subunit (Fig. 1.8b). As a result of the GAP (GTPase activating protein) action of RGS-Gβ5, the GTP is hydrolyzed in GDP: the GDP bound to the Gα promotes the re-association of GαGDP to the βγ dimer, restoring the GαGDP-βγ heterotrimer (i.e. G). All these negative feedbacks collectively accelerate the recovery of the dark state once the light stimulation has turned off. They also generate the well-known phenomenon of photoreceptor light adaptation in the presence of continuous illumination: indeed, the reduction of intracellular Ca2+ accelerates the re-synthesis of cGMP and increases the sensitivity to cGMP of the cGMP-gated channel. This promotes a partial recovery of the light-suppressible current despite the continuous illumination (see Fig. 3.23a).Moreover, the higher cGMP flux and the higher rate of R phosphorylation, produces responses to light stimuli superimposed on a background of light faster and smaller in respect to the response to the same light stimuli in the dark (see Fig. 3.23b,c).
19
1.2.1 Guanylate cyclase-activating proteins (GCAP)
The neuronal calcium sensor (NCS) protein family consists of a group of Ca2+-binding proteins whose expression is restricted to neuronal systems including retinal photoreceptor cells (Palczewski et al., 2000, Polans et al., 1996). These proteins bind Ca2+ through EF-hand motifs and many of them are fatty acylated at the amino terminus, most frequently with myristic acid (Ames & Ikura, 2002). NCS proteins serve as switches for Ca2+ signalling by assuming different Ca2+-dependent conformational changes. Two members of this family, Rec and GCAP, are expressed only in the retina, where they play an important role in light adaptation and in recovery of the dark current level once the light stimulation is ceased. The intracellular stimulation of GC mediated by GCAP at low Ca2+ concentration, was showed for the first time by Koch and Stryer (Koch & Stryer, 1988). The general structure of GCAP reveals a compact protein made of two domains separated by a flexible linker and each domain contains a pair of EF-hands (Fig. 1.9). A post-translational myristoylation at the N-terminal Gly residue is predicted to be common to all GCAPs (Palczewski et al., 2004). GCAPs regulate their target enzyme, GCs, as a function of Ca2+ which binds to their EF-hands. The conformational change induced by Ca2+ dissociation activates GCAPs, which in turn increase the activity of GCs, and dimerization of GCAP monomers has been proposed as a mechanism of GC regulation (Olshevskaya et al., 1999).
Figure 1.9. Representation of Structure of GCAP1 with three Ca2+ bound. The N-terminal helix is red, N-terminal domain (EF-1 and EF-2) is orange, C-terminal domain (EF-3 and EF-4) is yellow, kinked C-terminal helix is green, and the Ca2+ ions and myristoyl group are shown as dark green and dark blue space-filling spheres, respectively.
20
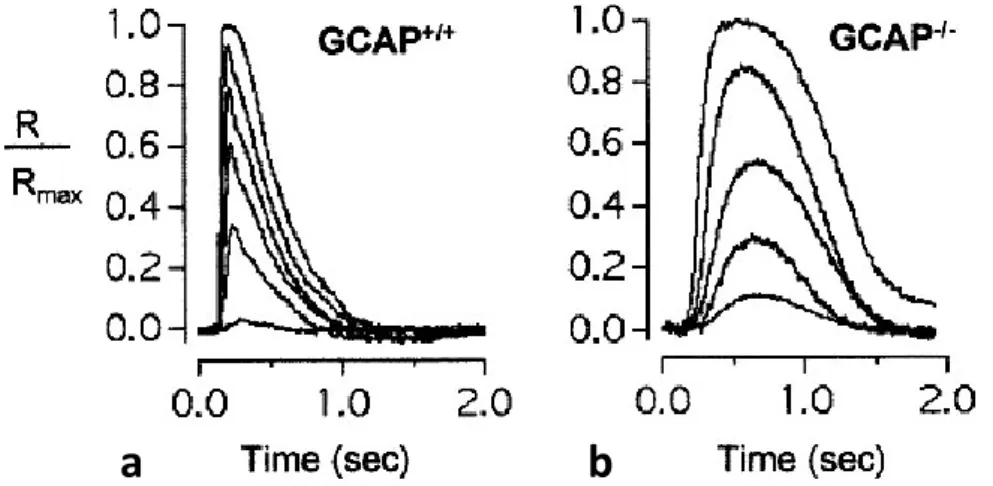
Two GCAPs (GCAP1 and GCAP2) first isolated from bovine retina (Dizhoor et al., 1995, Gorczyca et al., 1995, Palczewski et al., 1994) are present in all mammals. A third isoform, GCAP3, is expressed in human and zebrafish (Danio rerio) retinas (Haeseleer et al., 1999, Imanishi et al., 2004) and it has not been found in mouse retina. At least five additional GCAPs (GCAP4–8) are predicted to be present in pufferfish (Fugu rubripes) and zebrafish genomes (Imanishi et al., 2004). The physiological contribution of GCAPs in the photocurrent modulation has been investigated by Mendez (Mendez & Chen, 2002), through the comparison of the flash response of wild-type rods and rods where GCAP1 and GCAP2 were silenced by knocking out the relative genes in a transgenic mouse (GCAPs−/−). These authors found that flash responses recorded from dark-adapted GCAPs−/− rods were larger (i.e. were more sensitive) and slower than the responses to the same flashes recorded from wild-type rods. This indicates that GCAP1 and GCAP2 play a major role in response recovery (Fig. 1.10).
Figure 1.10. Effect of GCAP knock out on the flash response. Representative families of responses from wild-type a, GCAPs−/− b rods to 10 ms flashes that increase in intensity in ~2-fold steps from starting values (equivalent 500 nm photons/µm2/flash) of: 0.6, 2.0, 8.4, 2.0, 8.4 and 8.4, respectively. Responses were normalized to the rod’s resting dark current (R/Rmax). (Mendez & Chen, 2002)
1.2.2 Guanylate cyclase-activating proteins in the Zebrafish retina
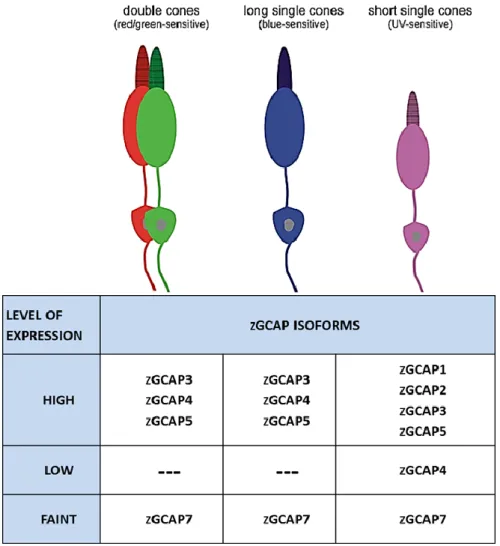
Zebrafish (Danio rerio) is a common and useful animal model for studies of vertebrate development, gene function and biomolecular processes. The similarities of the zebrafish visual system to that of other vertebrates make this animal a valuable model for visual neuroscience (Bilotta & Saszik, 2001). An interesting feature of the zebrafish retina is the presence of six GCAP isoforms (zGCAPs) which show distinct and partial overlapping expression profiles in rods and cones (Fig. 1.11). This determines a more complex Ca2+-sensor system, if compared
21
with mammalians, supporting a Ca2+-relay model of differential zGCAP operation in Zebrafish rods and cones (Scholten & Koch, 2011).
Figure 1.11. Schematic summary of zGCAP expression in different type of cones. Double cones (long-wavelength sensitive), long single cones (short-wavelength sensitive) and short single cones (UV-sensitive) are drawn schematically in the upper part. The lower part compares the expression profiles of zGCAPs among these cones (Modified form: Scholten and Koch, 2011)
1.2.3 A novel strategy to investigate the physiological role of zGCAP3
The expression pattern zGCAP3 and the role of myristoylation in the Ca2+-sensitivity and in the GC regulation, have been well characterized by biochemical approaches (Fries et al., 2011). These authors found out that the protein expression of zGCAP3 was present in the inner plexiform and ganglion cell layer as well as in that of the photoreceptors, suggesting other zGCAP3 regulatory targets. Moreover it has been demonstrated that the myristoyl group is not necessary for the zGCAP3 functionality: however, myristoylated zGCAP3 shows a higher Ca2+-sensitivity and conformational stability compared to the not myristoylated one.
22
In this thesis it is also investigated the physiological role of zGCAP3 through the simulation of an over expression and a knock-down of this protein, by delivering it, and its monoclonal antibody, into zebrafish cones, while recording their photoresponses with the patch-clamp technique. The intracellular protein delivery was attained via the patch pipette, by ejecting the proteins out of a tube inserted in the pipette lumen. A microperfusion system (see Methods) was employed to apply the desired exogenous molecules with a precise timing. However, the long tapered shape of the pipette shank make it very difficult to perfuse efficiently the cell with this strategy. For this reason a pressure polishing setup has been assembled to enlarge the patch pipette shank, through the calibrated combination of heat and air pressure, that allowed to insert quartz or plastic tubes in the pipette lumen very close to its tip. In order to obtain a substantial and specific silencing of the zGCAP3s in zebrafish cones, surface plasmon resonance experiments were performed to allow the selection of a monoclonal antibody with strong affinity for zGCAP3 and low cross interaction with other components of the phototransduction cascade.
23
2. METHODS
2.1 ANTIMICROBIAL PEPTIDES SEQUENCES AND USAGE
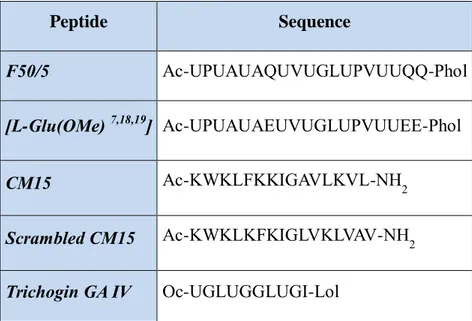
The primary structure of all peptides studied in this thesis is reported in Table 2.1. CM15 and its scrambled version were dissolved in bi-distilled water, F50/5 and its analogs in methanol, to get a 50, 100, 500, and 1000 μM stock solutions; an aliquot of one of these peptide stocks was dissolved in the perfusion solution to get a final peptide concentration of 0.25, 0.33, 0.1, 1, 2.5, 5 and 10 μM, and used within 30 min. Control experiments proved that the methanol and DMSO contamination of the perfusion solution (no larger than 10 nl/ ml and 1 μl/ml, respectively) did not cause any non-specific membrane permeabilization.
Peptide Sequence F50/5 Ac-UPUAUAQUVUGLUPVUUQQ-Phol [L-Glu(OMe) 7,18,19] Ac-UPUAUAEUVUGLUPVUUEE-Phol CM15 Ac-KWKLFKKIGAVLKVL-NH2 Scrambled CM15 Ac-KWKLKFKIGLVKLVAV-NH2 Trichogin GA IV Oc-UGLUGGLUGI-Lol
Table 2.1. Residue sequences of the peptides studied here. Ac, acetyl; Phol, phenylalaninol; Oc, n-octanoyl; Lol, leucinol.
CM15 and its scrambled version were a generous gift of Dr. Feix of Department of Biophysics, Medical College of Wisconsin, Milwaukee, WI, USA; Trichogin GA IV, F50/5 and its analogs were synthesized in the lab of Dr. Toniolo of Department of Chemistry of the University of Padoa, Italy (Peggion et al., 2004).
2.2 PROTEINS AND ANTIBODIES
2.2.1 zGCAP3, zGCAP4 and IgG1 monoclonal antibodies
Recombinant zGCAP3 (and its dansylated version), zGCAP4 and all the IgG1 monoclonal antibodies were a kind gift of prof. Karl-Wilhelm Koch (Biochemistry Faculty V, IBU, Carl von Ossietzky University Oldenburg, D-26111, Oldenburg, Germany). ZGCAPs
24
were purified from BL21 E.coli cells overexpressing the protein, following known protocols (Behnen et al., 2009, Fries et al., 2011, Scholten & Koch, 2011). IgG1 monoclonal antibodies (zG3 7E6-1-1; zG3 6G9-14; zG3 4C12-1-1; zG3 6B9-11) directed against purified recombinant zGCAP3, were produced in the laboratory of Dr. Elisabeth Kremmer (Institute of Molecular Immunology, Helmholtz Zentrum München, Munich,Germany) using rabbits for immunization. IgG1 antibodies were raised against a synthetic peptide corresponding to the last 20 aminoacids (168˗188) of the C-terminus of zGCAP3.
2.2.2 Antibodies purification by anion-exchange-chromatography (AEC)
In order to avoid to detect unspecific events during surface plasmon resonance experiments, IgG1 monoclonal antibodies (clones: 7E6,6G9,6B9 and C12) were purified from rabbit serum using the non-denaturing protocol of ion-exchange chromatography. For this purification phase, an anion-exchange-chromatography (AEC) was performed using an ÄKTAprimeTM-FPLC apparatus (GE Healthcare) and a MonoQ 5/50 GL column (GE Healthcare). The column, containing a polystyrene/divinyl benzene matrix, was cleaned before each use as described in the manual and equilibrated with degassed buffers. A solution containing 10 ml of serum antibodies was mixed with 90 ml AEC-buffer A (20 mM NaPO4, pH
= 6,5) and loaded onto the column via an injection loop at a flow rate of 1 ml/min. During this procedure monoclonal antibodies remain attached to the column matrix, while unbound proteins were washed out. After it the antibodies were eluted by a linear NaCl-gradient from 0% to 30% AEC-buffer B (20 mM NaPO4,1 M NaCl, pH = 6,5 ) in 25 min at a flow rate of 1
ml/min. The fractions were collected in 1 ml per tube using an auto sampler. The purity of various IgG samples was checked using sodium dodecyl sulfate polyacrylamide gel electrophoresis (SDS-PAGE). The final concentration of polyacrylamide solution was 10%. Aliquots of each samples were boiled for 10 min and were loaded on the electrophoresis gel. After separation, the gel was stained with Coomassie Brilliant Blue G 250. The most pure samples were collected together and dialyzed (Spectrapor semi-permeable membranes 6,000 to 8,000 molecular weight cutoff; Spectrum Laboratories, TX) against 50 mM NH4HCO3-buffer
(decalcified by Chelex 100®). After determining the concentration of each sample by UV-absorption spectroscopy, the samples were aliquoted and lyophilized using Vacufuge®-concentrator (Eppendorf, Hamburg, Germany) and stored at 80 °C.
25
2.3 CELL PREPARATION
2.3.1 Rod and cone outer segments isolation procedure
Rod outer segments (OS) were mechanically isolated from the retina of Rana esculenta. The same procedure was adopted to isolate cones from the retina of zebrafish (Danio rerio). Frogs were kept in filtered, running tap water in small tanks at room temperature (20–23 °C).
Adults zebrafish were kept in groups of 8˗10 individuals in 50 l aquaria with dechlorinated, continuously filtered fresh water at constant temperature (28 ˚C) and with a photoperiod of 10h:14h L:D. Animal experiments and care were performed in compliance with the Declaration of Helsinki guidelines and approved by a local ethical committee. Before dissection, the animals were dark adapted (~4 hr), anaesthetised by immersion in a tricaine methane sulphonate solution (1 g/l in water) and then decapitated. Both eyes were removed from the head and hemisected. The back half of the eyeball was cut into four pieces that were stored in oxygenated Ringer solution on ice and used when needed. The retina was "peeled" from an eyecup piece and was gently triturated in ~200 µl of Ringer, using a fire-polished Pasteur pipette or fine forceps to obtain the rod outer segment (OS). All these manipulations were made in the dark using infrared illumination and an infrared viewer (Find-R-Scope, FJW Optical Systems, Palatine, IL, USA).
2.3.2 Cell viewing
An aliquot (~2 ml) of the appropriate Ringer solution containing the isolated cells (rods or cones) was transferred to the recording chamber placed on the microscope (TE 300, Nikon,Tokyo, Japan) stage. The preparation was illuminated with an ultra-bright infrared LED (900 nm) and focused on a fast digital camera (C6790-81, Hamamatsu Photonics, Tokyo, Japan) coupled to the microscope. The preparation was then viewed in the frame grabber window generated by the AquaCosmos software package (version 2.5.3.0; Hamamatsu Photonics), which controlled all the camera parameters (as gain, frame rate, binning, etc.) as well, via a PCI board (PCDIG, Dalsa, Waterloo, ON, Canada).
26
2.4 ELECTROPHYSIOLOGY 2.4.1 Patch-clamp technique
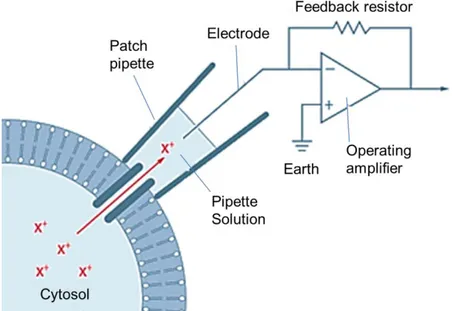
The patch-clamp, voltage-clamp technique consists in the control of the membrane potential across a small area of membrane, or across the entire cell membrane, by measuring the current necessary to maintain the membrane potential equal to that of the command circuit. The main part of the patch clamp amplifier is constituted by a current-voltage converter that makes the membrane potential to follow rapidly the variations of the command potential. The injected current is proportional to the potential drop at the edges of the resistance inserted in the feedback loop of an operational amplifier (Fig. 2.1).
Fig. 2.1. Schematic drawing of the classical cell attached configuration.
The membrane patch is isolated by pressing the clean and smooth tip of a glass pipette on the surface of the cell membrane to obtain a seal between the pipette and the membrane (the adhesion can be so tight that the seal resistance, i.e. the electrical resistance between the pipette lumen and the external solution, can exceed 10 GΩ). Under these conditions (cell-attached configuration), the current flowing through the ion channels enclosed by the pipette tip is almost entirely collected by the patch-clamp amplifier, since the tightness of the gigaseal prevents that a significant portion of this current leaks out the pipette toward the earth electrode (Fig. 2.1). When the cell-attached configuration is obtained (Fig. 2.2A), the pipette can be pulled-away and a patch of membrane can be excised from the cell, forming the inside-out patch-clamp configuration (Fig. 2.2D). In this configuration the internal membrane surface is exposed to the bath solution. Once the cell-attached configuration is obtained, the membrane patch can be perforated through the application of negative pressure to obtain the whole-cell
27
configuration (Fig. 2.2B). Under this condition, the current flowing through the entire cell surface can be recorded, and the intracellular solution is rapidly dialysed by the pipette solution, giving a control of the internal composition of the cell. From the latter configuration, by slowly withdrawing the pipette from the cell, the patch of membrane at the tip reseals with the outer surface exposed to the bath solution, and the internal surface exposed to the pipette solution (outside-out configuration; Fig. 2.2C) (Hamill et al., 1981).
Fig. 2.2. Schematic illustration of the four different methods of patch clamp: A cell-attached recording, B whole cell configuration, C outside-out configuration, and D inside-out configuration. (Hamill et al., 1981)
2.4.2 Pressure polish setup
Patch pipettes were pulled in the conventional manner from 50 or 100 µl borosilicate glass microcaps (Drummond, Broomall, PA, USA), with a vertical puller (model PP-830, Narishige, Tokyo, Japan), and tightened into a pipette holder. The latter was clamped to the microscope stage, and a three-way valve allowed to connect the pipette to a pressurized air line (set to ~4 atm and filtered to 0.2 µm to avoid pipette clogging), or to vent it to air (Fig. 2.3).
28
The pipette holder was moved by means of the XY manipulator of the microscope stage, to center the pipette tip into the central bend of an “omega” shaped, glass-coated platinum filament (50 µm of diameter; Fig. 2.4). This shape ensured the homogeneous softening of the pipette shank, when the filament was heated by passing a constant current through it. To avoid metal evaporation onto the pipette, the filament was uniformly glass-coated by dipping it in borosilicate glass powder when heated to yellow color. The filament was tin soldered to a copper holder (that functioned also as a heat sink, Fig. 2.4) mechanically coupled to a micromanipulator, and electrically connected to a variable current generator via a “push-to-make” switch.
Fig. 2.3. Set-up to fabricate the pressure-polished pipettes. Left View of the microscope, the camera coupled to the objective nosepiece, the microscope stage, the filament holder, the LED illuminator, and the box; right closer view of the microscope stage, the pressurized pipette holder, and the platinum filament.
To produce the adequate heat to soften the pipette tip (i.e. the filament was brought to reddish color), the current was typically set to ~1.2 A for filaments shaped as shown in Fig. 2.4. The pressure polishing set-up was enclosed in a box, to protect the filament from air currents, that could strongly affect the filament temperature as well, and the entire set-up from dust. The optical field containing the filament and the pipette was viewed on an LCD monitor connected to a contrast-intensified CCD camera (VX 44, Till Photonics, Gräfelfing, Germany), that replaced the objective turret of a bright-field stereomicroscope (YS2-T, Nikon). The video signal was also digitized on-line (by Pinnacle Studio MovieBox DV, Avid, Burlington, MA, USA) and stored on a computer, to have a record of the time course of the pipette shaping process.
29
Fig. 2.4. Filament shape and pipette alignment. Top Shape of the glass-coated platinum filament tin-soldered to the holder; scale bar 5 mm. The region within the white box is enlarged at bottom left, where a pipette is shown properly aligned with the filament to ensure uniform pipette heating, at the end of a mild pressure polishing. The ‘‘omega’’-shaped region of the filament is enlarged at bottom right, where a pipette is shown before pressure polishing, correctly aligned with the filament; scale bar 100 µm.
2.4.3 Pressure polishing procedure and pipette usage
Once the pipette was properly aligned with the filament (Fig 2.4), the box was closed and the air pressure and the filament heating were turned on and off for an appropriate time (to attain the desired pipette shape), with the three-way valve and the push-to-make switch, respectively. The shaping process of the pipette shank and the tip was precisely followed using the calibration grating superimposed on the LCD monitor.
The pipette shank geometry and its tip opening diameter could be finely controlled by adjusting: 1) the relative position of the pipette in respect to the filament, 2) the current intensity passing through the filament, 3) the duration of this current flow, 4) the pressure intensity, and 5) the duration of the pressure application while the current was flowing in the filament. In order to standardize the technique, the most efficient strategy found was to optimize the parameters 1), 2), and 4) and to keep them fixed throughout the pressure polishing process, while the third and the fifth parameters were left to be adjusted each time in order to obtain the desired shank profile and tip opening diameter (Fig. 2.5). Long pressure applications (while the current was flowing in the filament), were used to obtain very enlarged shanks (Fig 2.5e). If the pipette opening resulted too large for a given pressure duration, then its tip was heated again in the absence of pressure until the desired size was achieved; if it was instead too
30
small, then that pressure duration was applied to pipettes pulled with larger tips. Therefore, by carefully regulating the duration of pressure and heating application, the pipette shank was widened as desired, while the tip opening diameter could be increased, decreased or left unchanged.
Fig. 2.5. Different pipette shanks obtained with the pressure fire polishing. a Pulled pipette; b the same pipette fire polished without pressure (indistinguishable from the pulled one at this magnification); c–e pulled pipettes similar to a, fire polished with progressively longer pressure durations. Scale bar 20 µm
In order to have a very high rate of sealing on virtually any membrane surface, the pipette must be kept clean: therefore, the microscope stage, the puller and the pipette storage jar were carefully kept dirt free, the pipette holder was often ultrasonicated in distilled water and ethanol (50:50 v/v), and the platinum filament was routinely cleaned with ethanol. Moreover, the microcaps were thoroughly cleaned with ethanol, avoiding to touch them with bare hand especially in their center, i.e. where there will be thinned to form the pipette tips. To keep the pipette in the bath as little as possible, the microscope objective was focused first on the bottom of the chamber while the pipette was in air, i.e. at the “home position” of the step motor micromanipulator (model 5171, Eppendorf, Hamburg, Germany) employed to move the head stage of the patch clamp amplifier (Axopatch 200B, Molecular Devices, Sunnyvale, CA, USA). The chamber was then moved away, the pipette was brought (while still in air) a little above the focus of the chamber bottom, and these coordinates were stored in the micromanipulator memory. The pipette was then returned to the home position, and the chamber was brought back on the objective to search the suitable membrane target. Finally, the pipette was returned to the previously memorized position, that was now just above the membrane target, while holding a strong positive pressure. Once the pipette was close to the target, the strong pressure
31
was released but a positive pressure was kept by mouth to clean from cellular debris the membrane area where it was intended to seal the pipette, but to avoid at the same time to blow away the target, especially if it was a small isolated cell. This “pressure cleaning” was not however sufficient to remove connective tissue or other organic material strongly sticking on the membrane target: if this was the case, it was necessary to use specific proteolytic enzymes, following known protocols described in detail in the literature.
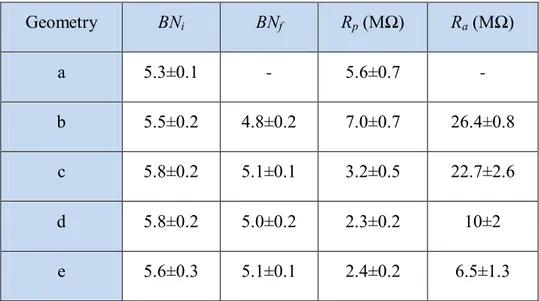
To provide a quantitative measure of the performances of the pressure polished pipettes, it was measured the bubble number of pulled pipettes (Fig. 2.5a) and the bubble number, the ohmic resistance, and the access resistance (measured on frog OS recorded in whole-cell, Fig. 3.12a-d; Fig. 3.1) of the pulled pipettes after polishing them with (Fig. 2.5c, d and e) or without (Fig. 2.5b) the pressure, for four different representative geometries (Fig. 2.5b-e; Table 2.2).
Geometry BNi BNf Rp (MΩ) Ra (MΩ) a 5.3±0.1 - 5.6±0.7 - b 5.5±0.2 4.8±0.2 7.0±0.7 26.4±0.8 c 5.8±0.2 5.1±0.1 3.2±0.5 22.7±2.6 d 5.8±0.2 5.0±0.2 2.3±0.2 10±2 e 5.6±0.3 5.1±0.1 2.4±0.2 6.5±1.3
Table 2.2 Quantitative parameters of the patch pipettes. BNi = initial bubble number after pulling the pipette; BNf = final bubble number of the polished pipette (with or without pressure application); Rp = pipette resistance in the bath; Ra = access resistance; n=15.
The pipettes of Fig. 2.5 were thoughtfully tested on frog OS, because this was the most critical cell system among the ones tested. Indeed, to have reliably recordings from frog OS, it was necessary to use pipettes with a very small tip diameter (yielding therefore high access resistances if fabricated with conventional methods) to avoid to break the OS, because they were very fragile, had a small diameter (Fig. 3.1; Fig 3.12a and c) and they were often soiled with retina debris and vitreous humor. The conventional fire polishing reduced the tip opening diameter of the pulled pipette (see column “BNf” of Table 2.2; n=15 for all pipette geometries),
32
without affecting the shank profile (Fig. 2.5b), resulting therefore in an increased pipette resistance once filled with saline solution (and placed in the bath; see column “Rp” of Table
2.2). The fire polishing increased significantly the probability to gain the seal on all the cells tested, although the access resistance resulted high, especially for the pipette employed for frog OS recordings (Table 2.2). The conventional fire polishing did not improve the sealing capacity of the pipette because it removed any contaminants left on tip, after coating with insulating agent (to reduce the capacitance between the pipette interior and the bath), as proposed by many authors, because no coating was used in these experiments and because the pipette was already perfectly cleaned. The fire polishing rather thickened the wall, and smoothed the surface, of the pipette tip, that is expected to be quite rough (at the molecular level) after it was abruptly separated from its companion following the pulling procedure. It is conceivable that a larger membrane surface sealed on the smoother and thicker glass surface in respect to the rough and thin one of the pipette just pulled, resulting in an increase of the seal resistance. This view is also supported by the following observation: occasionally, when a large bleb was formed once gaining the seal (that was about in the GΩ range) with pipettes or cells not perfectly clean, or with pipettes not fire polished, most of this bleb could be expelled out of the pipette, by applying a positive pressure, without any change in the seal resistance. This indicates that the portion of the glass tip that sealed on the membrane and this membrane itself formed very stable assemblages, around which the lipids that did not sealed on the glass could flow quite freely. If the seal was instead very good (seal resistance >20 GΩ), by using fire polished pipettes unsoiled by bath debris and on clean cell surfaces, i.e. a much larger glass surface have sealed on the membrane, usually it was not possible to eject the bleb, unless the applied pressure inside the pipette was so large to lose the seal.
By carefully regulating the duration of pressure and heating application, the pipette shank was widened as desired, while the tip opening diameter could be increased, decreased or left unchanged, resulting for pipettes as shown in Fig. 2.5e in a 4-fold reduction of access resistance in respect to the conventional ones (Fig. 2.5b and Table 2.2). As expected, for a fixed shank geometry, as the pipette tip opening was made larger, the bubble number increased, while the pipette and access resistance decreased. However, pressure polished pipettes with similar bubble number and resistance (Table 2.2), but with very different shanks and tip openings, gave quite different access resistances. Therefore, to reproduce a desired pipette geometry, it was necessary to rely on the bubble number of the pulled pipette (that was fabricated always with the same shank) and on the pressure polishing parameters (i.e. heating and pressure durations), rather than on the bubble number of the polished pipette only.
33
2.4.4 Sealing virtually on any membrane with just one glass type
Surprisingly, the chosen borosilicate glass was extremely good at attaining tight seals on an extremely wide variety of cells, being isolated or inserted in small tissue fragment or slice, or on giant unilamellar vesicles (GUVs) of many different lipid composition (Benedusi et al., 2011). Therefore, it was not true, as commonly believed, that different type of glass work better on different cell types (Penner, 1995). Moreover, at difference with that reported in the literature (Coronado, 1985), it was possible to routinely gain seals exceeding 10 GΩ with GUVs made up to 90% of phosphatidylcholine. Therefore, when there was a failure at attaining a seal, it was because the patch pipette tip was soiled, and/or because the membrane target was contaminated with cell debris, connective tissue or other organic material, not because the glass type was inappropriate. The day-to-day variability in attaining the seal was therefore entirely due to the cell quality (soiled or too fragile to sustain the sealing process), not to some uncontrollable parameter in the pipette fabrication. Indeed, if the protocol described in paragraph 2.3 was strictly followed, the pressure polishing set-up was maintained dirt-free, the pipette was kept in the bath as little as possible (to avoid that cell debris soiled the tip while approaching the cell), and the membrane target was “pressure cleaned”, the seal was guaranteed. Moreover, it was sometimes possible to gain a seal with the same pipette more than once, especially when the cell extracellular matrix was broken down with enzymatic treatment providing to move as quickly as possible while going from one cell to the other, to avoid to soil the pipette. Although the seal resistance was constantly decreasing from one trial to the other, it was possible to have seal resistances above 1 GΩ up to the fourth consecutive seal with the same pipette. To refrain that the lack of seal was not due to the pipette (if properly fabricated) but to the cell quality, it was observed many times on enzyme-treated or cultured cells that, if the first seal attempt was unsuccessful, it was still possible to attain the seal with the same pipette on another cell. Finally, at difference with what reported by many authors, but in agreement with Priel (Priel et al., 2007), it was found that at physiological pH, the presence or the lack of Ca2+ in the patch pipette was not necessary to promote the seal. Indeed, it was possible to routinely gain the seal with patch pipette filled with solutions containing up to 30 mM BAPTA or 30 mM Ca2+ (Rispoli, 1998) in the latter case, it was obviously not possible to attain the whole-cell recording, because cells underwent immediately in apoptosis but the OS, since they are not endowed with Ca2+-dependent proteases.Given the “sealing power” of the
34
glass pipette mentioned above, the pressure polishing technique was optimized just for this glass type.
2.4.5 Intrapipette perfusion
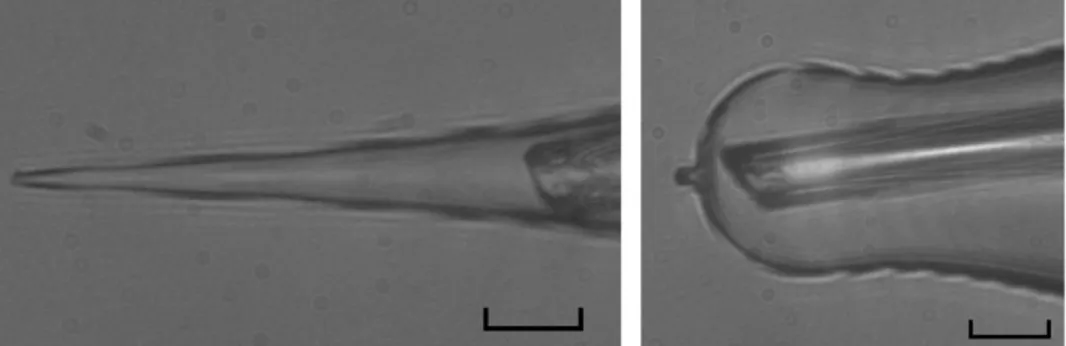
The enhanced cell dialysis obtained with the pressure polished pipettes allows to control the delivery of exogenous molecules in the cytosol with the following intracellular perfusion system. The test solution is applied in the lumen of a pressure polished pipette by ejecting it out of a pulled quartz (or plastic) tube, which can be positioned very closed to the pipette tip, respect to conventional pipette (Fig. 2.6)
Fig. 2.6. A pulled quartz tube is positioned inside the lumen of a conventional pipette as close as possible to its tip (left); the same tube is inserted in a pressure polished pipette (right). Scale bar is 20 µm
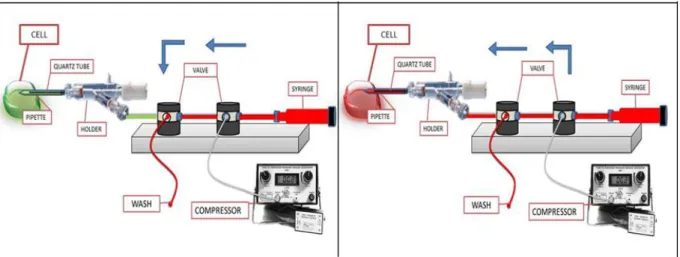
The other end of the quartz tube is tightly inserted into a Teflon tube that comes out of the pipette, and then out of the holder, through a side-port (Fig. 2.7). This Teflon tube is connected to one of the port of a couple of “three-way” valves with low dead volume. These valves are also connected to: a syringe (containing the test solution, in red; Fig. 2.7), a tube ending in a waste container (wash line), and a precision pressure generator. The solution change protocol is as follows: the patch pipette (not yet in the bath) is filled first with the control solution (shown in green, Fig. 2.7), applied manually with a syringe, by using the valve configuration illustrated in Fig. 2.7. The pipette is then moved into the bath to attain the gigaseal on the membrane target and the desired patch clamp configuration (cell attached, whole-cell or excised patch).
35
Fig. 2.7. Intracellular perfusion system. Valve configuration schemes: to wash the perfusion lines with test solution (in red; left) and to substitute the control solution (in green) filling the patch pipette with the test solution (right).
The perfusion lines are then filled with a test solution by injecting it with a syringe toward the waste container by using the valve configuration illustrated in Fig 2.7, left. In this way the perfusion tubes can be flushed several times with the new solution, in order to remove air bubbles or residues left from the previous solution. The test solution is then applied to the membrane surface or to the cytoplasm (depending upon the patch clamp recording configuration) at a desired time, by switching the valve in the configuration shown in Fig 2.7, right. In this configuration, the test solution is expelled out from the quartz capillary by using a precise pressure generator, so to minimize any mechanical stress on the membrane, resulting in a stable seal during the pipette perfusion.
2.4.6 Fast external perfusion system
After obtaining the whole-cell recording, the OS was aligned in front of a multibarreled perfusion pipette of a fast microperfusion system (Fig. 2.8a). The perfusion pipette was moved on a horizontal plane with a precision step motor, controlled by a user-friendly interface (Fig. 2.8c) running in a host computer, connected to the microperfusion system via the serial port. The perfusion pipette was constituted of up to six barrels (500 µm of side; two barrels of a four barrelled pipette are visible in Fig. 2.8a) made with precision, square glass capillaries glued together. Peptides were applied and removed in ~50 ms (see below) by moving the perfusion pipette so that to switch the whole-cell recorded OS back and forth from a stream of control perfusion solution (usually containing 130 mM of a monovalent cation and 1 mM Ca2+; see Results) to a stream containing the peptide (dissolved in the same perfusion solution). This
36
strategy allowed to assess the dynamics of the pore formation and the possible reversibility of the process. The temporal lag between the time in which the command (internal or triggered by an external device) moving the perfusion pipette was imparted, and the time in which the solution change effectively occurred, as well as the speed of the solution change, were occasionally measured (since they were very reproducible) as illustrated in Fig. 2.8b. At the end of experiment, the cell was blown off the patch pipette with a positive pressure pulse, and the odd perfusion lines were filled with a solution having 50% choline chloride and 50% KCl, while the even perfusion lines were filled with the patch pipette solution. The choline chloride had a different refraction index in respect to all the patch pipette solutions used, therefore the boundary separating two adjacent streams was clearly visible (see the three still frames of Fig. 2.8b).
Fig. 2.8. The technique employed to investigate the permeabilization properties of the peptides inserted in a natural membrane. a, isolated rod outer segment (OS) recorded in whole-cell mode (shown enlarged in the inset; scale bar is 20 µm) aligned in front of the multibarreled perfusion pipette (scale bar is 500 µm; horizontal orange arrows denote perfusion flows). b, trace shows the current jump upon switching an open patch pipette filled with 130 mM K++1 mM Ca2+ (9 MΩ, Vh=0 mV) from 65 mM choline+65 mM K++1 mM Ca2+ to 130 mM K++1 mM Ca2+. The two latter solutions had a 0.6 mV junction potential, producing a current jump of 70 pA, lasting ~50 ms, that had the same kinetics of the solution change. This kinetics is also shown by the three still frames (650x494 pixels at 12 bits grey-scale resolution), extracted from a 30 frame/s movie synchronized with the voltage-clamp recording. The boundary separating the two solution streams was clearly visible, allowing a precise electrical and visual correlation of the solution change dynamics. c, user interface of the perfusion apparatus described in Methods. d, scheme of one perfusion line (composed by a syringe, a three-way valve, a cylinder and one perfusion pipette barrel) and perfusion flow (in orange) during syringe refilling (upper panel) and during perfusion of an OS recorded in whole-cell (lower panel); drawing not in scale.
![Fig. 1.4. The α-carbon traces of the two crystallographically independent bent [L-Glu(OMe) 7,18,19 ] α-helices a and b (Crisma et al., 2007)](https://thumb-eu.123doks.com/thumbv2/123dokorg/4738522.46409/13.892.259.698.271.523/fig-carbon-traces-crystallographically-independent-ome-helices-crisma.webp)