Abstract.
Background/Aim: The aim of this study was to
evaluate whether the altered profile of adipocytokine and
genetic fingerprint in NAFLD-associated metabolic
syndrome “cluster” represents synergistic risk factors
predicting onset of liver colorectal cancer metastases.
Materials and Methods: A total of 165 colorectal cancer
patients were enrolled, 56,3% were with metabolic
syndrome/NAFLD. Serum samples were assayed for
ADIPOQ, leptin and TNF-a levels by ELISA. ADIPOQ
rs266729 C/G and TNF-308 A/G genotypes were analyzed
in DNA isolated from whole blood. Results: Reduction in
adiponectin levels and increase in leptin and TNF-α was
shown in patients with liver metastases. This trend was
influenced by BMI, MetS/NAFLD, and insulin resistance.
ADIPOQ G rs266729 and TNF- 308 A allele are associated
with obesity, MetS/NAFLD and insulin resistance. ADIPOQ
CG/GG and GA/AA TNF-alpha genotypes confer
susceptibility to liver metastases. Conclusion: Obesity and
hepatic steatosis significantly favor the development of
colorectal cancer liver metastases and the individual
adipocytokines genetic profile may play an important
predictive role.
Currently, obesity and the related conditions, including
metabolic syndrome (MetS), represent an important risk factor
for colorectal cancer (CRC), which have led to an increased
incidence for this type of cancer. Non-alcoholic fatty liver
disease (NAFLD), the hepatic manifestation of the MetS, is
an additional risk factor for liver metastasis of colorectal
cancer (1-3). Moreover, given its highly favorable
microenvironment for the onset of liver metastases, NAFLD
represents a negative prognostic factor in patients with CRC
(4). Visceral obesity is one of the factors that predispose to
NAFLD and the accumulation of fat both at visceral and
hepatic level leads to a dysfunction of the adipose tissue and
in an imbalance of adipocytokines profile (5). The state of
chronic inflammation caused by fat accumulation induces an
increase in pro-inflammatory cytokines, such as tumor
necrosis factor alfa (TNF-α), and a reduction of the
adiponectin levels (ADIPOQ), an adipocytokine with
anti-inflammatory action (6, 7). An increased Body Mass Index
(BMI), insulin resistance, and the presence of NAFLD, all
features of MetS, sustain the inflammatory state, which is a
fertile soil for the onset of cancer. In fact, MetS induces a state
of insulin resistance and chronic inflammation with a
consequent increase in the expression of the triad of
pro-inflammatory cytokines TNF-α, Interleukin-1 (IL-1) and
interleukin-6 (IL-6), associated with of a significant release of
C-reactive protein (CRP) into the blood circulation (8-10).
However, in obese subjects, adipocyte dysfunction is
associated with a decreased ADIPOQ release into the
circulation, with lack of insulin sensitization, and
anti-inflammatory, anti-steatosic and antitumor actions (11).
Regardless of other concomitant factors, the expansion of the
adipocyte burden deprives patients with NAFLD of the
anti-inflammatory and anti-fibrotic effect exerted by adiponectin
This article is freely accessible online.Correspondence to: Institutional BioBank, Experimental Oncology and Biobank Management Unit, IRCCS Istituto Tumori "Giovanni Paolo II", V.Le Orazio Flacco, 65 -70124, Bari, Italy. Tel: +39 805555259, e-mail: [email protected]
Key Words: Adiponectin, leptin, TNF-α, colorectal cancer, metabolic syndrome, obesity, NAFLD.
Synergism of Adipocytokine Profile and ADIPOQ/TNF-α
Polymorphisms in NAFLD-associated MetS Predict
Colorectal Liver Metastases Outgrowth
ROSA DIVELLA
1, ANTONELLA DANIELE
1, RAFFAELE DE LUCA
2, ANTONIO MAZZOCCA
3,
EUSTACHIO RUGGIERI
2, EUFEMIA SAVINO
4, PORZIA CASAMASSIMA
4,
MICHELE SIMONE
2, CARLO SABBA
3and ANGELO PARADISO
1 1Institutional BioBank, Experimental Oncology and Biobank Management Unit,
IRCCS Istituto Tumori "Giovanni Paolo II", Bari, Italy;
2
Department of Surgery Oncology, IRCCS Istituto Tumori "Giovanni Paolo II", Bari, Italy;
3Interdisciplinary Department of Medicine, University of Bari School of Medicine, Bari, Italy;
whose levels are inversely correlated to the increase in
adiposity (12, 13). Another adipocytokine that is involved in
the pathogenesis of NAFLD is Leptin. Leptin has a dual role
in NAFLD (14). First, it plays a protective role against hepatic
steatosis, especially at the early stages of the disease, and
second, it exerts a non-beneficial effect by acting as a
pro-inflammatory and fibrinogenic adipocytokine. Leptin exerts
antisteatosic effects acting at the hepatocyte level (15, 16). A
state of leptin resistance appears if expansion of the visceral
fat mass occurs (17). Accordingly, leptin no longer
compensates for insulin resistance thus losing its antisteatosic
action (18). Unhealthy eating habits and poor physical activity
represent the two main environmental risk factors that
predispose to obesity and related conditions (i.e. MetS,
NAFLD and insulin resistance). Notably, environmental
factors may act on a genetic predisposition, and interactions
between environmental factors and inter-individual genetic
variations could result in a more aggressive phenotype of the
disease (19, 20). ADIPOQ gene, which encodes for
adiponectin, is located on chromosome 3q27 and is linked to
a susceptibility locus for MetS. Circulating levels of ADIPOQ
are influenced by genetic components (21). Among the
variations of ADIPOQ gene, the SNP rs266729 found within
the promoter region is significantly associated with ADIPOQ
level and linked to susceptibility to cancer (22). ADOPOQ has
been proposed as a determinant factor in the etiology of the
MetS, because of its important regulatory action on insulin
sensitivity and inflammation (23). Thus, the polymorphism in
the ADIPOQ gene is believed to play a role in the
pathogenesis of the MetS. Obesity and insulin resistance may
be influenced by polymorphisms in Tumor necrosis factor α
gene (TNFA) (24). The polymorphism TNFA-308 A/G in the
gene promoter is associated with increased serum TNF-α
levels and predisposes to insulin resistance (25, 26). It has
been shown that individuals who carry the 308A TNFA gene
variant are at higher risk of developing obesity compared to
controls and show significantly higher systolic arterial blood
pressure and plasma insulin levels (27). This supports the
hypothesis that TNFA gene could be involved in the
pathogenesis of the metabolic syndrome (28). Also, genetic
polymorphisms in the promoter region of TNFA gene are
associated with different inflammatory and malignant
conditions (29-31). In this study, we evaluated whether the
altered profile of adipocytokines and the genetic fingerprint of
the NAFLD-associated metabolic syndrome “cluster”
represent synergistic risk factors for predicting the onset of
liver colorectal cancer metastases.
Materials and Methods
Patients. In this study, from June 2014 to December 2017, 165 colorectal cancer patients were enrolled at IRCCS (National Cancer Research Institute) Giovanni Paolo II of Bari –Italy. In addition, a
group of 50 healthy subjects was included. All patients diagnosed with colon cancer had positive colonoscopy, which was confirmed histologically. The clinical characteristics of patients (age, sex, therapeutic interventions, etc.) were obtained from medical records. At the time of enrollment, of the 165 patients, 62 (37.5%) were non-metastatic patients, 69 (41.8%) had liver metastases and 34 (20.6%) had lung metastasis. In all subjects, body mass index (BMI) was calculated as weight in kilograms divided by the square of height in meters (kg/m2). Waist circumference was measured in centimeter
up to the umbilicus in the standing position after normal expiration. Metabolic syndrome (MetS) was also determined for all participants. Patients were considered to have MetS when they presented 3 or more of the joint statement criteria of the American Heart Association/National Heart Lung and Blood Institute (AHA/NHLBI) and the International Diabetes Federation (IDF). The presence of NAFLD in all participants independent from alcohol consumption was determined through radiological evidence of hepatic steatosis. In our series, 93 (56.3%) patients with metabolic syndrome were all associated with the presence of NAFLD. Insulin resistance was calculated according to the homeostasis model assessment-Insulin Resistance (HOMA IR). This score is used to define insulin resistance in research. HOMA-IR=(fasting glucose in mmol/l × fasting insulin)/22.5 OR (fasting glucose in mg/dl × fasting insulin)/405. HOMA-IR ≥2.50 indicates insulin resistance. Blood collections. All blood samples of cancer patients were obtained preoperatively or prior to other therapeutic procedures. For all participants, venous blood samples were collected after an overnight fast, and serum samples were either used immediately for analysis of the biochemical profile (glucose, total cholesterol, low-density lipoprotein (LDL), high-low-density lipoprotein (HDL) cholesterol and triglycerides, ALT, AST, GGT, insulin, CRP), or were stored frozen at –20˚C for subsequent adipocytokine ELISA assay.
ADIPOQ, Leptin and TNF-a enzyme-linked immunoassay (ELISA). Serum samples from 165 CRC patients and 50 healthy donors were assayed for the levels of ADIPOQ, leptin and TNF-α by a sandwich ELISA assay (Quantikine Human ADIPOQ, Leptin and TNF-alfa Immunoassay; R&D Systems, Inc., Minneapolis, MN, USA) according to the manufacturer's recommendations. The absorbance of the solution produced was measured at 490 nm and was directly proportional to the amount of ADIPOQ, Leptin and TNF-alfa present in the sample. A standard curve was constructed by plotting the mean absorbance value measured for each standard versus its corresponding concentration.
Genotyping. Genotyping was performed after extraction of DNA from whole blood in EDTA using a standard QIAmp kit (QIAGEN Inc.) following the manufacturer’s recommendations. DNA was dissolved in (TE) buffer and quantified by measurement of optical density at 260 nm. To improve the genotyping quality and validation, all mutant and heterozygous samples were re-genotyped, and results were noted only for those samples that were reproducible and with no discrepancy.
ADIPOQ rs266729 polymorphism. For detection of the adiponectin rs266729 polymorphism, we performed a Tetra amplification refractory mutation system polymerase chain reaction (T-ARMS-PCR) as previously reported (22). Briefly, two external primers and
two specific internal allele specific primers were used: external primers (Forward outer: 5’-GGA CTG TGG AGA TGA TAT CTG GGG GGC A-3’, Reverse outer: 5’-TGG CCT AGA AGC AGC CTG GAG AAC TGG A-3’), and allele specific internal primers (Forward inner (C allele): 5’-CTT GCA AGA ACC GGC TCA GAT CCT CCC- 3’, Reverse inner (G allele): 5’-GAG CTG TTC TAC TGC TAT TAG CTC TGC-3’). The final PCR mixture (20 μl), contained DNA (2 μl), 10 × PCR buffer (1.5 μl), 2 mM MgCl2 (1.5 μl), 10 mM dNTP (0.3 μl), 0.25 μl of each primer 1 U Taq DNA polymerase and water. The reaction cycle consisted of pre-denaturation at 95˚C for 2 min, pre-denaturation at 95˚C for 20 sec, 35 cycles of annealing at 56˚C for 20 sec, extension at 72˚C for 40 sec and a final extension at 72˚C for 4 min for complete extension of all PCR fragments. The reaction was performed on a Thermal Cycler, BioRAD (Milan, Italy). The amplified DNA fragments were verified on a 2% agarose gel. Each study participant was classified into one of the three possible genotypes: homozygote C/C, heterozygote C/G or homozygote G/G.
Genotyping of TNFA -308A/G gene polymorphism. The genotyping was performed using the polymerase chain reaction–restriction fragment length polymorphism (PCR-RFLP) technique. Amplification of the -308 TNFA gene polymorphic region was performed in a Thermal Cycler, BioRAD, using the following primers (Invitrogen Life Technologies, Carlsbad, CA, USA): 5’-AGG CAA TAG GTT TTG AGG GCC AT-3’ (Forward) and 5’-TCC TCC CTG CTC CGA TTC CG-3’ (Reverse). To introduce a restriction site into the wild-type nucleotide sequence during the amplification reaction, the forward primers for each TNFA gene polymorphism contain a single base-pair mismatch adjacent to the polymorphic site. The PCR was carried out in a final volume of 12.5 μl containing 0.1 μg/μl of DNA, 3 mM of each primer, 0.025 U/μl of Taq DNA polymerase, 1.25 μl of supplied buffer enzyme 1X, 2.5 mM of MgCl2, and 2.5 mM of
each dNTP (Invitrogen Life Technologies, Carlsbad, CA, USA). Amplification conditions were as follows: initial denaturation at 94˚C for 4 min, 33 cycles of 94˚C for 30 sec, 60˚C for 30 sec and 72˚C for 30 sec, followed by 72˚C for 2 min for ending extension; resulting Table I. Association between adipocytokines, insulin and CRP profile with clinical characteristic of CRC patients.
N (%) TNF-α p-Value ADIPOQ p-Value Leptin p-Value Insulin p-Value PCR p-Value pg/ml ng/ml pg/ml pg/ml Control group 50 48.1±2.5 0.000 160±35 0.000 6630±98 0.000 2.5±2.5 0.000 2.5±2.5 0.000 Patients group 165 72.2±40.9 103.0±96.9 28410±17905 22.6±23 9±8 Gender Males 95 (57.5) 58.9±49.9 0.004 111.8±97 0.3 14648±13610 0.001 24±22 0.000 7±6.5 0.000 Females 70 (42.4) 87.5±77 96.6±95.2 23109±19840 18.6±16 11.5±9 Tumor location 0.05 0.000 0.6 0.1 0.1 Colon 60 (41.3) 100±48 77±21 18365±17236 8.5±6.3 8.5±6 Sigma 43 (29.6) 95.8±53.9 84.5±25 15489±+13256 9.1±3.2 9±3 Rectum 62 (42.7) 118±51 58.6±36 17896±15265 10.1±3.5 10±3.5 Grading 0.000 0.8 0.4 0.003 0.003 G1 45 (27.2) 75±55 80±42.4 19228±18850 24±20 11±10 G2 63 (38.1) 119±89 75±69 24112±19759 25±21 11±9 G3 57 (34.5) 60.8±53.5 73.9±44.3 15162±12753 20±20 6.4±5 Stage 0.05 0.8 0.1 0.000 0.000 I-II 37 (22.4) 61.7±52.5 89±88 14637±12469 26±18 9±8 III-IV 128 (77.5) 87±60 86±84 19489±17764 23±10 18±10 Lymph node status 0.7 0.3 0.2 0.1 0.1
N0 54 (32.7) 86±78 100±94.4 17963±17087 26±26 8±8 N1/N2 111 (67.2) 82±75 86±85 21383±17393 26±21 10±8.2 Metastases 0.001 0.000 0.008 0.000 0.000 M0 62 (68.4) 74±72 135±91 17801±17187 22±21 8±7 M1 103 (31.5) 114±85 68±58 25320±18593 23±20 13±8.6 Metastatic sites 0.0001 0.001 0.01 0.01 0.001 Liver 69 (66.9) 185±20 45±25 32000±15000 27±18 15.5±7 Lung 34 (33.1) 110±30 62±20 23520±20000 18±15 10±8 BMI (kg/mq) 0.000 0.000 0.000 0.000 0.000 ≤24.9 45 (27.2) 25±21.9 225.5±70.8 4586±1777 5.3±2.4 3.3±2.4 ≥25≤29.9 75 (45.4) 62.5±59.7 68.6±30.9 12433±7011 14.9±10 6.9±5.5 ≥30 45 (27.2) 151.2±71.2 40.5±24 47252±8341 33.8±14.5 18.8±6.5 MetS/NAFLD 0.000 0.000 0.000 0.000 0.000 Yes 93 (56.3) 107.5±85.2 47.4±40.4 27300±18640 32.5±24 11.6±8.7 No 72 (43.6) 37.6±35.6 169.6±99.7 7441±6251 6.5±4.3 4.7±4.4 HOMA IR 0.004 0.000 0.000 0.000 0.000 ≤2.5 88 (53.3) 58.5±48.7 177.8±67.9 11204±10000 4.4±2.5 6.5±6.4 >2.5 77 (46.6) 87.2±74.7 96.2±81.3 36909±20035 33.1±27 12.2±8.6
fragments of 107 bp was analyzed on a 6% polyacrylamide gel stained with silver nitrate (Invitrogen Life Technologies, Carlsbad, CA, USA). The amplified fragments of the -308 TNFA gene SNPs were incubated with 3 U NcoI restriction enzymes (New England BioLabs, Beverly, MA, USA), for 1 h at 37˚C. Finally, the digested PCR products were electrophoresed on 6% polyacrylamide gels and stained with silver nitrate for genotype identification. For the -308 SNP, fragments of 87 and 20 bp represent the wild-type genotype (G/G), fragments of 107, 87 and 20 bp represent the heterozygote genotype (G/A), and only one fragment of 107 bp represents the homozygote genotype (A/A).
Statistical analysis. For continuous variables, data were analyzed with the Mann-Whitney U-test, the unpaired Student’s t-test, ANOVA and Fischer’s exact test. Spearman’s correlation was used for correlation analysis between serum adipocytokine profiles. The allelic and genotypic frequencies were estimated by the Chi-square test and Fisher’s Exact test. Odds ratios (ORs) and 95% confidence intervals (95%CI) were calculated from the logistic model. p-Values ≤0.05 were considered statistically significant. All statistical analyses were performed by the Number Cruncher Statistical System-Power Analysis and Sample Size Software 2007 (NCSS-PASS, 329 North 1000 East Kaysville, UT, USA).
Results
Association between adipocytokines, Insulin, and CRP profile
with clinical characteristic of CRC patients. Serum levels of
Adiponectin, Leptin, TNF-α, Insulin and CRP showed
statistically significant differences (p<0.00001, t-test) between
the control group and the patients, Table I. This suggests that
these adipocytokines are actively involved in the promotion
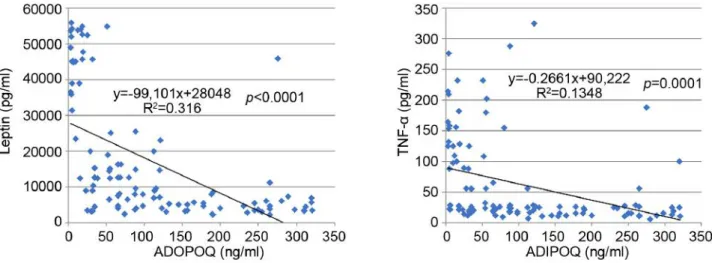
and progression of CRC. Serum levels of adiponectin were
decreased compared to other adipocytokines, which instead
were generally increased. In fact, a statistically significant
inverse correlation was observed between adiponectin and the
other adipocytokines (i.e. leptin and TNF-α) as shown in
Figure 1. Also, in patients with liver metastases, a notable
reduction in adiponectin levels in the circulation with a
consequent increase in the values of leptin, insulin, TNF-α and
CRP was observed. The data suggest that liver is implicated
in the regulation of circulating levels of all these parameters.
It is worth mentioning that BMI, MetS/NAFLD, and insulin
resistance significantly influences serum levels of
adipocytokines. Furthermore, patients with BMI >30, with
MetS/NAFLD and a state of insulin resistance showed a
greater risk of developing liver metastases (Table II). These
findings suggest that the triple condition of BMI,
MetS/NAFLD and HOMA IR may constitute a unique
phenotype that exposes the patient to a favorable
microenvironment for the development of liver metastases.
Moreover, a condition of overweight/obesity is associated with
the development of more advanced tumor stage (p<0.0001,
Fisher’s exact test), poorly differentiated tumors (p=0.01,
Fischer’s exact test), with lymph node involvement
(p<0.0001, Fischer’s exact test), and with the presence of
metastases (p<0.0001, Fischer’s exact test).
Association between Adiponectin and TNF-α genotypes with
BMI, MetS/NAFLD and HOMA Index in CRC patients. To
understand the serum patterns of adipocytokines, in the three
groups of patients grouped by BMI, MetS/NAFLD and
HOMA Index, the distribution of genotypes and alleles
frequency of the ADIPOQ rs266729 C/G and TNFA 308 G/A
polymorphism were investigated. We found that the presence
of the ADIPOQ G allele were significantly higher in
overweight (OR=5, p=0.01) and in obese patients (OR=6.7,
p=0.01) than in normal weight patients suggesting that this
genotype represents a risk factor for the development of
obesity (Table III). Also, the presence of the G allele
represents a significant risk factor for developing MetS
Figure 1. Scatter plot showing an inverse correlation between serum levels of adiponectin with leptin and TNF-alpha.(OR=3.64, p=0.0000001) and insulin resistance (OR=5.7,
p=0.01) (Tables IV and V). Moreover, analyzing the allelic
distribution of TNFA polymorphisms, the presence of TNFA
308A allele was found to be significantly higher in
overweight (OR=6.2, p=0.0001) and obese patients,
(OR=4.2, p<0.00001). Also, the presence of the A allele
represents a significant risk factor that predisposes to
MetS/NAFLD and insulin resistance. Therefore, the genetic
variability, the presence of the ADIPOQ G rs266729 and
TNFA 308 A allele are associated with obesity, metabolic
syndrome/NAFLD and insulin resistance. This genetic
signature significantly influences the biochemical blood
profile as reported below.
Association between ADIPOQ/TNFA polymorphisms with
biochemical and clinical pathological characteristics of CRC
patients. As shown in Table VI, the polymorphism 308 A/G
in TNFA gene promoter is associated with increased serum
TNF-α levels and predisposes to insulin resistance. In fact,
this polymorphism is associated with increased blood levels
of glucose and insulin (p=0.01, p<0.00001 respectively,
ANOVA test). Furthermore, this polymorphism is associated
with both high levels of GGT (p=0.002 and p<0.0001
respectively, ANOVA test) and to low levels of HDL (p=0.01
and 0.009 respectively, ANOVA test) which are two
parameters indicative of metabolic syndrome and NAFLD.
The rs266729 G/C ADIPOQ polymorphism is significantly
associated with lower levels of circulating adiponectin
(p<0.0001, ANOVA Test), and with increased insulin.
Furthermore, these polymorphisms favor the establishment
of an inflammatory microenvironment represented by
elevated circulating levels of CRP, a well-established marker
of inflammation. Moreover, leptin levels are also influenced
by these polymorphisms. In fact, high levels of leptin are
found in obese subjects, with insulin resistance and
metabolic syndrome, suggesting that in these subjects a state
of leptin resistance has been established. The development
of leptin resistance is considered a hallmark of obesity.
Moreover, these polymorphisms predispose to a more
aggressive tumor phenotype with a poorly differentiated
histotype, with involvement of lymph nodes and the presence
of metastases.
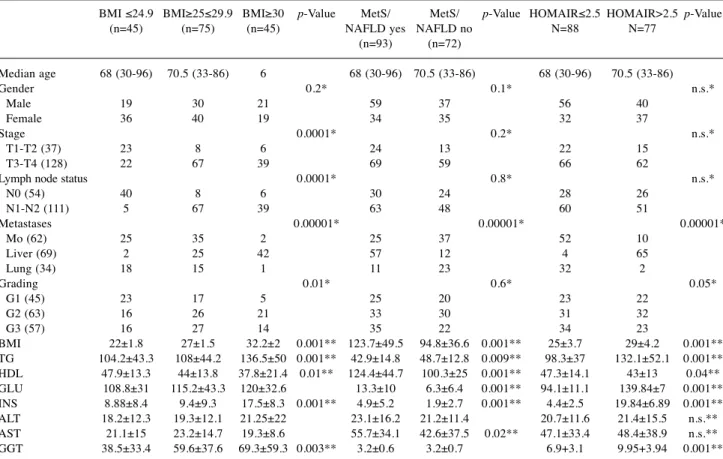
Table II. Association between BMI, MetS/NAFLD and HOMA IR with clinical and biochemical characteristic in CRC patients.
BMI ≤24.9 BMI≥25≤29.9 BMI≥30 p-Value MetS/ MetS/ p-Value HOMAIR≤2.5 HOMAIR>2.5 p-Value (n=45) (n=75) (n=45) NAFLD yes NAFLD no N=88 N=77 (n=93) (n=72) Median age 68 (30-96) 70.5 (33-86) 6 68 (30-96) 70.5 (33-86) 68 (30-96) 70.5 (33-86) Gender 0.2* 0.1* n.s.* Male 19 30 21 59 37 56 40 Female 36 40 19 34 35 32 37 Stage 0.0001* 0.2* n.s.* T1-T2 (37) 23 8 6 24 13 22 15 T3-T4 (128) 22 67 39 69 59 66 62
Lymph node status 0.0001* 0.8* n.s.* N0 (54) 40 8 6 30 24 28 26 N1-N2 (111) 5 67 39 63 48 60 51 Metastases 0.00001* 0.00001* 0.00001* Mo (62) 25 35 2 25 37 52 10 Liver (69) 2 25 42 57 12 4 65 Lung (34) 18 15 1 11 23 32 2 Grading 0.01* 0.6* 0.05* G1 (45) 23 17 5 25 20 23 22 G2 (63) 16 26 21 33 30 31 32 G3 (57) 16 27 14 35 22 34 23 BMI 22±1.8 27±1.5 32.2±2 0.001** 123.7±49.5 94.8±36.6 0.001** 25±3.7 29±4.2 0.001** TG 104.2±43.3 108±44.2 136.5±50 0.001** 42.9±14.8 48.7±12.8 0.009** 98.3±37 132.1±52.1 0.001** HDL 47.9±13.3 44±13.8 37.8±21.4 0.01** 124.4±44.7 100.3±25 0.001** 47.3±14.1 43±13 0.04** GLU 108.8±31 115.2±43.3 120±32.6 13.3±10 6.3±6.4 0.001** 94.1±11.1 139.84±7 0.001** INS 8.88±8.4 9.4±9.3 17.5±8.3 0.001** 4.9±5.2 1.9±2.7 0.001** 4.4±2.5 19.84±6.89 0.001** ALT 18.2±12.3 19.3±12.1 21.25±22 23.1±16.2 21.2±11.4 20.7±11.6 21.4±15.5 n.s.** AST 21.1±15 23.2±14.7 19.3±8.6 55.7±34.1 42.6±37.5 0.02** 47.1±33.4 48.4±38.9 n.s.** GGT 38.5±33.4 59.6±37.6 69.3±59.3 0.003** 3.2±0.6 3.2±0.7 6.9+3.1 9.95+3.94 0.001** *p-values were calculated with Fischer exact test; **p-values were calculated with ANOVA test.
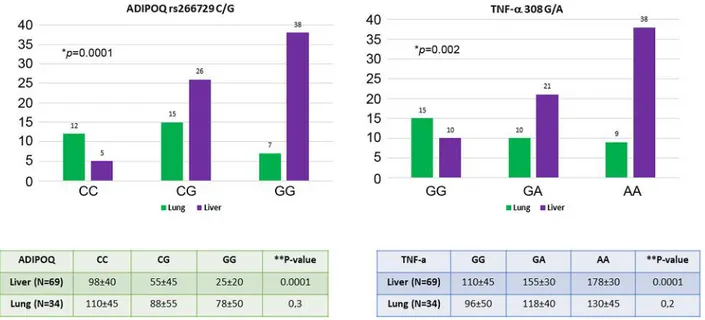
Association between ADIPOQ rs266729 C/G and TNFA 308
A/G polymorphisms with liver and lung metastasis. The
genotypes of these polymorphisms in relation to hepatic and
lung metastases are shown in Figure 2. Results in Figure 2
show that the presence of CG or GG genotype in the
ADIPOQ gene and the presence of GA or AA genotype in
the TNFA gene represent risk factor for the onset of liver
metastases (p=0.0001 for ADIPOQ genotype, p=0.002 for
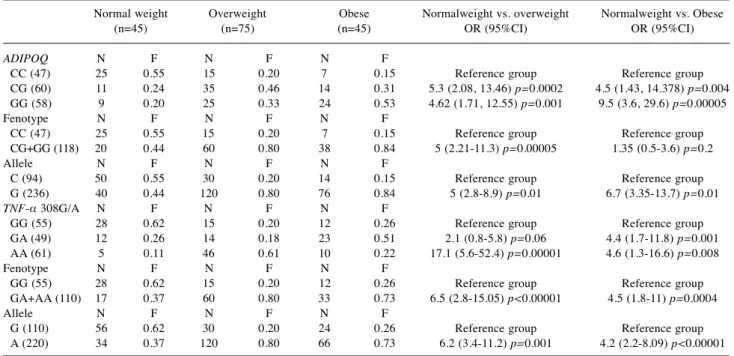
Table III. ADIPOQ C/G rs266729 and TNF-a 308 G/A genotypes and allele frequency in relation to BMI.Normal weight Overweight Obese Normalweight vs. overweight Normalweight vs. Obese (n=45) (n=75) (n=45) OR (95%CI) OR (95%CI) ADIPOQ N F N F N F
CC (47) 25 0.55 15 0.20 7 0.15 Reference group Reference group CG (60) 11 0.24 35 0.46 14 0.31 5.3 (2.08, 13.46) p=0.0002 4.5 (1.43, 14.378) p=0.004 GG (58) 9 0.20 25 0.33 24 0.53 4.62 (1.71, 12.55) p=0.001 9.5 (3.6, 29.6) p=0.00005 Fenotype N F N F N F
CC (47) 25 0.55 15 0.20 7 0.15 Reference group Reference group CG+GG (118) 20 0.44 60 0.80 38 0.84 5 (2.21-11.3) p=0.00005 1.35 (0.5-3.6) p=0.2 Allele N F N F N F
C (94) 50 0.55 30 0.20 14 0.15 Reference group Reference group G (236) 40 0.44 120 0.80 76 0.84 5 (2.8-8.9) p=0.01 6.7 (3.35-13.7) p=0.01 TNF-α 308G/A N F N F N F
GG (55) 28 0.62 15 0.20 12 0.26 Reference group Reference group GA (49) 12 0.26 14 0.18 23 0.51 2.1 (0.8-5.8) p=0.06 4.4 (1.7-11.8) p=0.001 AA (61) 5 0.11 46 0.61 10 0.22 17.1 (5.6-52.4) p=0.00001 4.6 (1.3-16.6) p=0.008 Fenotype N F N F N F
GG (55) 28 0.62 15 0.20 12 0.26 Reference group Reference group GA+AA (110) 17 0.37 60 0.80 33 0.73 6.5 (2.8-15.05) p<0.00001 4.5 (1.8-11) p=0.0004 Allele N F N F N F
G (110) 56 0.62 30 0.20 24 0.26 Reference group Reference group A (220) 34 0.37 120 0.80 66 0.73 6.2 (3.4-11.2) p=0.001 4.2 (2.2-8.09) p<0.00001
Table IV. ADIPOQ C/G rs266729 and TNF-a 308 G/A genotypes and allele frequency in relation to MetS/NAFLD.
MetS/NAFLD no (n=72) MetS/NAFLD yes (n=93) MetS/NAFLD no vs. MetS/NAFLD yes OR (95%CI) ADIPOQ N F N F CC (47) 34 0.47 13 0.13 Reference group CG (60) 27 0.37 33 0.35 3.19 (1.4-7.2) p=0.002 GG (58) 11 0.15 47 0.50 11.1 (4.4-27.9) p=0 Fenotype N F N F CC 34 0.47 13 0.13 Reference group CG+GG 38 0.52 80 0.86 5.5 (2.6-11.6) p<0.000001 Allele N F N F C 68 0.47 26 0.19 Reference group G 76 0.52 106 0.80 3.64 (2.12-6.2) p<0.000001 TNF-α 308G/A N F N F GG (55) 40 0.55 15 0.16 Reference group GA (49) 8 0.11 41 0.44 13.6 (5.2-35.7) p=0.00001 AA (61) 24 0.33 37 0.39 4.1 (1.87-9) p=0.0002 Fenotype N F N F GG (55) 40 0.55 15 0.16 Reference group GA+AA (110) 32 0.44 78 0.83 6.5 (3.15-13.3) p=0.000 Allele N F N F G (110) 80 0.55 30 0.23 Reference group A (160) 64 0.44 96 0.76 4 (2.3-6.7) p=0.000
TNFA genotype; Fischer’s exact test). These polymorphisms
that affect the circulating levels of both adiponectin and
TNF-α in these patients. In fact, there is a considerable
decrease in adiponectin and an increase in TNF-α
(particularly in patients harboring G allele in ADIPOQ gene
and A allele in the TNFA gene) in CRC patients with liver
metastases compared to those with lung metastases. Finally,
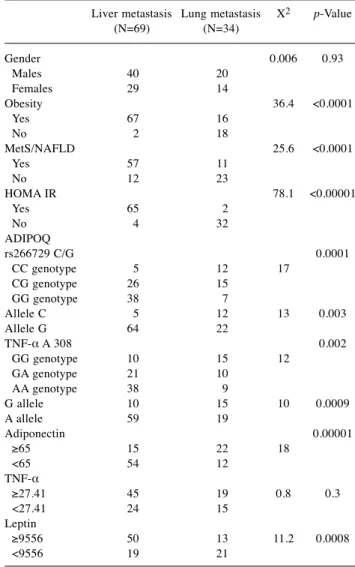
Table VII shows a multiparametric analysis regarding the
risk factors for the onset of liver metastases. Obesity,
MetS/NAFLD, insulin resistance, the presence of the G allele
in the adiponectin gene, low levels of adiponectin and high
circulating levels of leptin and TNF-alpha generate a
favorable microenvironment that predispose to development
of liver metastases.
Discussion
Our study examined a more aggressive tumor phenotype in
CRC patients with a greater risk of developing liver
metastases. This phenotype is characterized by the presence
of the following co-factors: BMI≥30, Homa IR≥2.5 and
MetS/NAFLD. These patients generally show a decrease in
serum levels of adiponectin and an increase in TNF-α and
leptin circulating levels. This profile of circulating levels of
adipocytokines is associated with a higher risk of developing
liver metastases. Our findings corroborate the association of
the adiponectin/leptin balance with the processes of
mitogenesis, tumor growth and cell motility when adipose
tissue dysfunction occurs (32, 33). We additionally
investigated the influence of genetic variability of ADIPOQ
and TNFA gene to understand the serum patterns of
adipocytokines. In this study, we found lower levels of
adiponectin in patients harboring the G allele in ADIPOQ
gene and higher levels of TNF-alfa in patients harboring A
allele in TNFA gene. ADIPOQ G/G rs266729 and TNFA-308
A/A genotype predispose to obesity state, to MetS/NAFLD
and to insulin resistance. Our data are in accordance with a
report by Hsieh CJ and co-workers, who have shown that the
GG rs266729 ADIPOQ genotype predisposes to NAFLD and
that this genotype significantly lowers serum levels of
adiponectin, a condition that may worsen liver steatosis (34).
In addition, another study by Suriyaprom K et al., has shown
that decreased blood concentration of adiponectin is
associated with GG ADIPOQ rs266729 polymorphism and
that this is significantly more frequent in patients with
metabolic syndrome (35). Our study clearly showed that this
genetic susceptibility influences the biochemical blood profile
in our patients. In fact, these polymorphisms are significantly
associated with increased blood levels of glucose, insulin,
HDL and GGT, thus favoring insulin resistance, the onset of
metabolic syndrome and NAFLD. Our data agree with what
has been reported by Nascimento H et al., who demonstrated
Table V. ADIPOQ C/G rs266729 and TNF-a 308 G/A genotypes and allele frequency in relation to HOMA IR.HOMAIR≤2.5 N=88 HOMAIR>2.5 N=77 HOMAIR≤2.5 vs. HOMAIR>2.5 OR (95%CI) ADIPOQ Genotype N F N F CC (47) 38 0.43 9 0.11 Reference group CG (60) 30 0.34 30 0.38 4.2 (1.7-10.2) p=0.0007 GG (58) 20 0.22 38 0.49 2.8 (1.1-7.06) p=0.01 Fenotype N F N F CC 38 0.43 9 0.11 Reference group CG+GG 50 0.56 68 0.88 5.7 (2.5-12.9) p=0.00001 Allele N F N F C 76 0.43 18 0.11 Reference group G 100 0.56 136 0.88 5.7 (3.2-10.2) p=0.01 TNF-α 308G/A Genotype N F N F GG (55) 45 0.51 10 0.12 Reference group GA (49) 25 0.28 24 0.31 4.3 (1.78-10.4) p=0.0005 AA (61) 18 0.20 43 0.55 10.7 (4.4-25.8) p=0.01 Fenotype N F N F GG 45 0.51 10 0.12 Reference group GA+GA 43 0.48 67 0.87 7.01 (3.2-15.3) p=0.000001 Allele N F N F G 90 0.51 20 0.13 Reference group A 86 0.48 131 0.86 6.8 (3.9-11.9) p=0.01
Table VI. Association between ADIPOQ/TNF-α polymorphisms with biochemical and clinical pathological characteristics of colorectal cancer patients. ADIPOQ rs266729 C/G TNF-α 308 G/A CC (47) CG (60) GG (58) p-Value GG (55) GA (49) AA (61) p-Value Gender 0.33 0.2 Male (95) 29 30 36 30 33 32 Female (70) 18 30 22 25 16 29 Stage 0.4 0.5 T1-T2 (37) 12 10 15 15 10 12 T3-T4 (128) 35 50 43 40 39 49 Linph. status 0.4 0.9 N0 (54) 18 16 20 18 16 20 N1/2 (111) 29 44 38 37 33 41 Metastasis <0.00001 0.002 M0 (62) 35 15 12 30 18 14 M1 (103) 12 45 46 25 31 47 Grading 0.0006 0.4 G1 (45) 18 20 7 20 12 13 G2 (63) 15 28 20 19 20 24 G3 (57) 14 12 31 16 17 24 TG 121±13 124±65 141±85 0.2 126±60 132±67 120±35 0.5 HDL 44.1±17.4 37.1±15 35.2±17 0.01 44±14 38±18 47.4±17 0.01 GLU 109±31 109±27 127±60 0.03 110±46 117±25 128±20 0.01 INS 15.5±13 20±12 29±13 <0.00001 13±12.5 18.5±15 27±15 <0.0001 ALT 31.2±12 36.6±28 34±9.6 0.3 32.9±19 36.8±25 38.5±20 0.3 AST 27.6±12 28.8±18 30.5±15 0.6 27.8±20 32.2±18 33.2±12 0.1 GGT 53.4±46 56±49 57±45 0.9 45±7.8 70.2±32 58.3±51 0.002 LEPTIN 4868±2000 16055±7012 46000±9000 <0.00001 5868±3250 17522±12000 48520±8564 0.0001 TNF-A 85.6±50.2 135±34.6 153±19.2 <0.00001 88.5±45 136±30 158±20 0.0001 ADIPOQ 120.2±43.2 57.1±36.6 36±36 0.0001 115.3±40 66.5±30 35.5±30 0.0001 PCR 4.5±2.5 9±5.5 16.5±8 0.0001 3.2±2 7.5±6.5 18.5±8 0.0001 Figure 2. Association between genetic polymorphism and serum profile of adiponectin and TNF-alpha with liver and lung metastasis in colorectal cancer patients. *p-Value calculated with Fisher’s exact test; **p-value calculated with ANOVA test.
that adipokine gene SNPs are correlated with plasma levels
of adipokine and lipid profile in pediatric obese patients (36).
We reported that leptin levels are indeed influenced by
ADIPOQ and TNFA polymorphisms, in fact, high levels of
leptin are found in obese patients, with insulin resistance and
MetS/NAFLD, indicating a consolidated state of leptin
resistance. Leptin resistance is a hallmark of obesity (37). In
obese individuals, elevated leptin acts as a pro-inflammatory
adipokine and elevated circulating levels are associated with
certain types of cancers (38). Leptin also stimulates the
release of pro-inflammatory cytokines such as TNF-alpha,
which in turn promotes inflammation and the overexpression
of pro-angiogenic factors (i.e. VEGF and HIF-1α) with an
increased risk for cancer development (39). Moreover, our
study showed the establishment of a chronic inflammatory
state sustained by high blood levels of CRP in patients with
CRC. The association between central obesity, inflammation
and insulin resistance, the three essential elements promoting
NAFLD, led us to reinforce the hypothesis that NAFLD can
be considered a hepatic manifestation of the metabolic
syndrome, two conditions that share overlapping
pathogenetic mechanisms (40, 41). The primum movens of
pathogenesis is believed to be the relationship between
insulin resistance and obesity. In the early stages,
triglycerides accumulate in the hepatocyte with alterations in
lipid metabolism. A central role is played by visceral adipose
tissue (42, 43). High lipolytic activity of omental fat
determines an increased flow of free fatty acids (FFA) that
induce inflammatory pathways, leading to the development
of both insulin and leptin resistance (44). In this scenario,
adiponectin displays a down-regulatory effect in relation to
weight gain, and it is possible that accumulation of visceral
fat produces factors, such as TNF-α and leptin, that inhibit
synthesis or secretion of adiponectin. The production of
proinflammatory cytokines such as TNF-α at hepatic level
and by macrophages of visceral adipose tissue appears to be
an important mechanism (45, 46). TNF-α represents one of
the earliest events of liver injury in NAFLD. TNF-α may
cause insulin resistance in adipose tissue with an increased
release of FFA in the blood circulation with the creation of a
self-perpetuating vicious circle. In the liver, both
hemodynamic and micro environmental processes are
involved in trapping and killing circulating tumor cells. A
failure at any step of these processes may favor the
colonization of circulating tumor cells in the liver. A growing
body of evidence suggests that adipocytes in the tumor
microenvironment play a crucial role in disease progression
by providing fatty acids, pro-inflammatory cytokines and
proteases (47, 48). Since obesity is a well-recognized
negative prognostic factor for colon cancer, increased
adiposity may also have a negative effect in the treatment and
survival of patients with CRC (49, 50). Therefore, a more
appropriate anticancer therapy should consider treating
concomitant conditions including metabolic syndrome,
dyslipidemia, and insulin resistance. A reduction in body
weight is essential. A 10% reduction in weight in overweight
subjects can normalize transaminases and increase insulin
sensitivity. Aerobic physical exercise and nutritional
modifications can improve metabolic syndrome and NAFLD
(51, 52). It is currently unclear whether obesity directly leads
to metastatic disease via chronic systemic inflammation or
whether obesity induces steatosis, which provides a fertile
microenvironment for metastases. A combination of these
factors is likely to occur. Indeed, our study showed that
obesity and hepatic steatosis significantly favor the
development of CRC liver metastases and that the individual
genetic profile of adipocytokines may play an important
predictive role.
Table VII. Multivariate analysis for prognostic parameter of liver metastasis occurrence.
Liver metastasis Lung metastasis X2 p-Value
(N=69) (N=34) Gender 0.006 0.93 Males 40 20 Females 29 14 Obesity 36.4 <0.0001 Yes 67 16 No 2 18 MetS/NAFLD 25.6 <0.0001 Yes 57 11 No 12 23 HOMA IR 78.1 <0.00001 Yes 65 2 No 4 32 ADIPOQ rs266729 C/G 0.0001 CC genotype 5 12 17 CG genotype 26 15 GG genotype 38 7 Allele C 5 12 13 0.003 Allele G 64 22 TNF-α A 308 0.002 GG genotype 10 15 12 GA genotype 21 10 AA genotype 38 9 G allele 10 15 10 0.0009 A allele 59 19 Adiponectin 0.00001 ≥65 15 22 18 <65 54 12 TNF-α ≥27.41 45 19 0.8 0.3 <27.41 24 15 Leptin ≥9556 50 13 11.2 0.0008 <9556 19 21
Conflicts of Interest
The Authors have no conflicts of interest to declare regarding this study.
Authors’ Contributions
Rosa Divella: Author of Project and Principal Investigator; Antonella Daniele: anthropometric parameters; Raffaele De Luca: Patients recruitment; Antonio Mazzocca: Statistical analysis; Eustachio Ruggieri: Patients recruitment; Eufemia Savino: biochemical blood profile; Porzia Casamassima: biochemical blood profile; Michele Simone: select the patients; Carlo Sabbà: Liver ultrasound for assessment of steatosis; Angelo Paradiso: oncological evaluation of patients.
Acknowledgements
The Authors would like to thank all nursing staff of the abdomen surgery unit for support in recruiting patients enrolled in this study. This study was supported by the research project "Quality control on biological samples stored in Biobank: prospective analysis of genetic variability and identifications of serum biomarkers predisposing to the metabolic syndrome in a series of patients with colon of the colon" financed by the Italian Ministry of Health.
References
1 Kabat GC, Kim MY, Stefanick M, Ho GYF, Lane DS, Odegaard AO, Simon MS, Bea JW, Luo J, Wassertheil-Smoller S and Rohan TE: Metabolic obesity phenotypes and risk of colorectal cancer in postmenopausal women. Int J Cancer 143(3): 543-551, 2018. PMID: 29488210. DOI: 10.1002/ijc.31345
2 Goulart A, Varejão A, Nogueira F, Martins S, Mesquita-Rodrigues A, Sousa N and Leão P: The influence of metabolic syndrome in the outcomes of colorectal cancer patients. Diabetes Metab Syndr 11(S2): S867-S871, 2017. PMID: 28711516. DOI: 10.1016/j.dsx.2017.07.007
3 Ahn JS, Sinn DH, Min YW, Hong SN, Kim HS, Jung SH, Gu S, Rhee PL, Paik SW, Son HJ and Gwak GY: Non-alcoholic fatty liver diseases and risk of colorectal neoplasia. Aliment Pharmacol Ther 45(2): 345-353, 2017. PMID: 27859470. DOI: 10.1111/apt.13866
4 Kondo T, Okabayashi K, Hasegawa H, Tsuruta M, Shigeta K and Kitagawa Y: The impact of hepatic fibrosis on the incidence of liver metastasis from colorectal cancer. Br J Cancer 115(1): 34-39, 2016. PMID: 27280634. DOI: 10.1038/bjc.2016.155 5 Divella R, Mazzocca A, Daniele A, Sabbà C and Paradiso A:
Obesity, Nonalcoholic Fatty Liver Disease and Adipocytokines Network in Promotion of Cancer. Int J Biol Sci 15(3): 610-616, 2019. PMID: 30745847. DOI: 10.7150/ijbs.29599
6 Cao H: Adipocytokines in obesity and metabolic disease. J Endocrinol 220(2): T47-59, 2014. PMID: 24403378. DOI: 10.1530/JOE-13-0339.
7 Jung UJ and Choi MS: Obesity and its metabolic complications: the role of adipokines and the relationship between obesity, inflammation, insulin resistance, dyslipidemia and nonalcoholic fatty liver disease. Int J Mol Sci 15(4): 6184-223, 2014. PMID: 24733068. DOI: 10.3390/ijms15046184
8 Ebert T, Gebhardt C, Scholz M, Wohland T, Schleinitz D, Fasshauer M, Blüher M, Stumvoll M, Kovacs P and Tönjes A: Relationship between 12 adipocytokines and distinct components of the metabolic syndrome. J Clin Endocrinol Metab 103(3): 1015-1023, 2018. PMID: 29325128. DOI: 10.1210/jc.2017-02085
9 Sherling DH, Perumareddi P and Hennekens CH: Metabolic Syndrome. J Cardiovasc Pharmacol Ther 22(4): 365-367, 2017. PMID: 28587579. DOI: 10.1177/1074248416686187
10 Choi J, Joseph L and Pilote L: Obesity and C-reactive protein in various populations: a systematic review and meta-analysis. Obes Rev 14(3): 232-244, 2013. PMID: 23171381. DOI: 10.1111/obr.12003
11 Mather KJ and Goldberg RB: Clinical use of adiponectin as a marker of metabolic dysregulation. Best Pract Res Clin Endocrinol Metab 28(1): 107-117, 2014. PMID: 24417950. DOI: 10.1016/j.beem.2013.06.008
12 Adolph TE, Grander C, Grabherr F and Tilg H: Adipokines and non-alcoholic fatty liver disease: multiple interactions. Int J Mol Sci 18(8) pii: E1649, 2017. PMID: 28758929. DOI: 10.3390/ ijms18081649
13 Polyzos SA, Kountouras J and Mantzoros CS: Adipokines in nonalcoholic fatty liver disease. Metabolism 65(8): 1062-1079, 2016. PMID: 26725002. DOI: 10.1016/j.metabol.2015.11.006 14 Polyzos SA, Aronis KN, Kountouras J, Raptis DD, Vasiloglou
MF and Mantzoros CS: Circulating leptin in non-alcoholic fatty liver disease: A systematic review and meta-analysis. Diabetologia 59: 30-43, 2016. PMID: 26407715. DOI: 10.1007/s00125-015-3769-3
15 Rotundo L, Persaud A, Feurdean M, Ahlawat S and Kim HS: The Association of leptin with severity of non-alcoholic fatty liver disease: A population-based study. Clin Mol Hepatol 24(4): 392-401, 2018. PMID: 30068065. DOI: 10.3350/cmh.2018.0011 16 DI Maira G, Pastore M and Marra F: Liver fibrosis in the context of nonalcoholic steatohepatitis: the role of adipokines. Minerva Gastroenterol Dietol 64(1): 39-50, 2018. PMID: 28875689. DOI: 10.23736/S1121-421X.17.02427-8
17 Cernea S, Roiban AL, Both E and Huţanu A: Serum leptin and leptin resistance correlations with NAFLD in patients with type 2 diabetes. Diabetes Metab Res Rev 34(8): e3050, 2018. PMID: 30052309. DOI: 10.1002/dmrr.3050
18 Yadav A, Kataria MA, Saini V and Yadav A: Role of leptin and adiponectin in insulin resistance. Clin Chim Acta 417: 80-84, 2013. PMID: 23266767. DOI: 10.1016/j.cca.2012.12.007 19 Meldrum DR, Morris MA and Gambone JC: Obesity pandemic:
causes, consequences, and solutions-but do we have the will? Fertil Steril 107(4): 833-839, 2017. PMID: 28292617. DOI: 10.1016/j.fertnstert.2017.02.104
20 Sares-Jäske L, Knekt P, Lundqvist A, Heliövaara M and Männistö S: Dieting attempts modify the association between quality of diet and obesity. Nutr Res 45: 63-72, 2017. PMID: 28967457. DOI: 10.1016/j.nutres.2017.08.001
21 Esfahani M, Movahedian A, Baranchi M and Goodarzi MT: Adiponectin: an adipokine with protective features against metabolic syndrome. Iran J Basic Med Sci 18(5): 430-442, 2015. PMID: 26124928.
22 Divella R, Daniele A, Mazzocca A, Abbate I, Casamassima P, Caliandro C, Ruggeri E, Naglieri E, Sabbà C and De Luca R: ADIPOQ rs266729 G/C gene polymorphism and plasmatic adipocytokines connect metabolic syndrome to colorectal cancer.
J Cancer 8(6): 1000-1008, 2017. PMID: 28529612. DOI: 10.7150/jca.17515
23 Lihn AS, Pedersen SB and Richelsen B: Adiponectin: action, regulation and association to insulin sensitivity. Obes Rev 6(1): 13-21, 2005. PMID: 15655035. DOI: 10.1111/j.1467-789X.2005.00159.x
24 Wen PF, Wang XS, Zhang M, Cen H, Pan HF, Ye QL, Mao C and Ye DQ: Associations between TNF gene polymorphisms (-308 A/G, -238 A/G, -1031 C/T and -857 T/C) and genetic susceptibility to T1D: a meta-analysis. Endocrine 46(3): 435-444, 2014. PMID: 24515539. DOI: 10.1007/s12020-014-0172-7 25 Gerasimova ON, Sigalovich EY, Dankovtseva EN,
Nakonechnikov SN, Nikitin AG, Ivanova ZV, Masenko VP, Nosikov VV and Zateyshchikov DA: Carriage of a allele of polymorphic marker G(-238)A of TNF-alfa gene is associated with unfavorable prognosis in patients with chronic systolic heart failure. Kardiologiia 55(9): 25-30, 2015. PMID: 28294921. 26 Beecham J, Hart A, Alexandre L, Hernon J, Kumar B and Lam S: Single nucleotide polymorphisms and post-operative complications following major gastrointestinal surgery: A systematic review and meta-analysis. J Gastrointest Surg, 2019. PMID: 31270721. DOI: 10.1007/s11605-019-04300-2
27 Wu H, Yu K and Yang Z: Associations between TNF-α and interleukin gene polymorphisms with polycystic ovary syndrome risk: a systematic review and meta-analysis. J Assist Reprod Genet 32(4): 625-634, 2015. PMID: 25690158. DOI: 10.1007/ s10815-015-0449-7
28 Sobti RC, Kler R, Sharma YP, Talwar KK and Singh N: Risk of obesity and type 2 diabetes with tumor necrosis factor-α 308G/A gene polymorphism in metabolic syndrome and coronary artery disease subjects. Mol Cell Biochem 360(1-2): 1-7, 2012. PMID: 22081334. DOI: 10.1007/s11010-011-0917-z
29 Sun Q, Guo X, Wang Q and Zhao F: The association of TNF-308 (G/A) gene polymorphisms and hepatocellular carcinoma risk: a meta-analysis. Chin J Cancer Res 28(5): 536-542, 2016. PMID: 27877013. DOI: 10.21147/j.issn.1000-9604.2016.05.09
30 Hu Q, Lou GG, Liu YC, Qian L and Lv BD: The Tumor Necrosis Factor-α-308 and -238 polymorphisms and risk of hepatocellular carcinoma for Asian populations: A meta-analysis. Curr Ther Res Clin Exp 76: 70-75, 2014. PMID: 25352937. DOI: 10.1016/j.curtheres.2014.04.001
31 Sookoian SC, González C and Pirola CJ: Meta-analysis on the G-308A tumor necrosis factor alpha gene variant and phenotypes associated with the metabolic syndrome. Obes Res Dec 13(12): 2122-2131, 2005. PMID: 16421346. DOI: 10.1038/oby.2005.263
32 Parida S, Siddharth S and Sharma D: Adiponectin, obesity, and cancer: Clash of the Bigwigs in health and disease. Int J Mol Sci 20(10) pii: E2519, 2019. PMID: 31121868. DOI: 10.3390/ijms20102519.
33 Modzelewska P, Chludzińska S, Lewko J and Reszeć J: The influence of leptin on the process of carcinogenesis. Contemp Oncol (Pozn) 23(2): 63-68, 2019. PMID: 31316286. DOI: 10.5114/wo.2019.85877
34 Hsieh CJ, Wang PW and Hu TH: Association of adiponectin gene polymorphism with nonalcoholic fatty liver disease in Taiwanese patients with type 2 diabetes. PLoS One 10(6): e0127521, 2015. PMID: 26042596. DOI: 10.1371/journal. pone.0127521
35 Suriyaprom K, Phonrat B and Tungtrongchitr R: Association of adiponectin gene -11377C>G polymorphism with adiponectin levels and the metabolic syndrome in Thais. Asia Pac J Clin Nutr 23(1): 167-173, 2014. PMID: 24561985. DOI: 10.6133/apjcn.2014.23.1.01
36 Nascimento H, Vieira E, Coimbra S, Catarino C, Costa E, Bronze-da-Rocha E, Rocha-Pereira P, Carvalho M, Ferreira Mansilha H, Rêgo C, Dos Santos R, Santos-Silva A and Belo L: Adipokine gene single-nucleotide polymorphisms in Portuguese obese adolescents: Associations with plasma concentrations of adiponectin, resistin, IL-6, IL-1β, and TNF-α. Child Obes 12(4): 300-313, 2016. PMID: 27159547. DOI: 10.1089/chi.2015.0235
37 Andreoli MF, Donato J, Cakir I and Perello M: Leptin resensitisation: a reversion of leptin-resistant states. J Endocrinol 241(3): R81-R96, 2019. PMID: 30959481. DOI: 10.1530/JOE-18-0606
38 Ghadge AA and Khaire AA: Leptin as a predictive marker for metabolic syndrome. Cytokine 121: 154735. PMID: 31154250. DOI: 10.1016/j.cyto.2019.154735
39 Ghasemi A, Saeidi J, Azimi-Nejad M and Hashemy SI: Leptin-induced signaling pathways in cancer cell migration and invasion. Cell Oncol (Dordr) 42(3): 243-260, 2019. PMID: 30877623. DOI: 10.1007/s13402-019-00428-0
40 Buzzetti E, Pinzani M and Tsochatzis EA: The multiple-hit pathogenesis of non-alcoholic fatty liver disease (NAFLD). Metabolism 65(8): 1038-1048, 2016. PMID: 26823198. DOI: 10.1016/j.metabol.2015.12.012
41 Karim MF, Al-Mahtab M, Rahman S and Debnath CR: Non-alcoholic fatty liver disease (NAFLD)--A Review. Mymensingh Med J 24(4): 873-880, 2015. PMID: 26620035.
42 Dietrich P and Hellerbrand C: Non-alcoholic fatty liver disease, obesity and the metabolic syndrome. Best Pract Res Clin Gastroenterol 28(4): 637-653, 2014. PMID: 25194181. DOI: 10.1016/j.bpg.2014.07.008
43 Lindenmeyer CC and McCullough AJ: The Natural History of Nonalcoholic Fatty Liver Disease-An Evolving View. Clin Liver Dis 22(1): 11-21, 2018. PMID: 29128051. DOI: 10.1016/ j.cld.2017.08.003
44 Berk PD and Verna EC: Nonalcoholic Fatty Liver Disease: Lipids and Insulin Resistance. Clin Liver Dis 20(2): 245-262, 2016. PMID: 27063267. DOI: 10.1016/j.cld.2015.10.007 45 Boutari C, Tziomalos K and Athyros VG: The adipokines in the
pathogenesis and treatment of nonalcoholic fatty liver disease. Hippokratia 20(4): 259-263, 2016. PMID: 29416297.
46 Polyzos SA, Aronis KN, Kountouras J, Raptis DD, Vasiloglou MF and Mantzoros CS: Circulating leptin in non-alcoholic fatty liver disease: a systematic review and meta-analysis. Diabetologia 59(1): 30-43, 2016. PMID: 26407715. DOI: 10.1007/s00125-015-3769-3.
47 Quail DF and Dannenberg AJ: The obese adipose tissue microenvironment in cancer development and progression. Nat Rev Endocrinol 15(3): 139-154, 2019. PMID: 30459447. DOI: 10.1038/s41574-018-0126-x
48 Cozzo AJ, Fuller AM and Makowski L: Contribution of Adipose Tissue to Development of Cancer. Compr Physiol 8(1): 237-282, 2017. PMID: 29357128. DOI: 10.1002/cphy.c170008
49 Shaukat A, Dostal A, Menk J and Church TR: BMI is a risk factor for colorectal cancer mortality. Dig Dis Sci 62(9): 2511-2517, 2017. PMID: 28733869. DOI: 10.1007/s10620-017-4682-z
50 Simkens LH, Koopman M, Mol L, Veldhuis GJ, Ten Bokkel Huinink D, Muller EW, Derleyn VA, Teerenstra S and Punt CJ: Influence of body mass index on outcome in advanced colorectal cancer patients receiving chemotherapy with or without targeted therapy. Eur J Cancer 47(17): 2560-2567, 2011. PMID: 21803570. DOI: 10.1016/j.ejca.2011.06.038
51 George ES, Forsyth A, Itsiopoulos C, Nicoll AJ, Ryan M, Sood S, Roberts SK and Tierney AC: practical dietary recommendations for the prevention and management of nonalcoholic fatty liver disease in adults. Adv Nutr 9(1): 30-40, 2018. PMID: 29438460. DOI: 10.1093/advances/nmx007
52 Romero-Gómez M, Zelber-Sagi S and Trenell M: Treatment of NAFLD with diet, physical activity and exercise. J Hepatol 67(4): 829-846, 2017. PMID: 28545937. DOI: 10.1016 /j.jhep.2017.05.016