International Journal of Engineering Business Management
An Analysis of the Effect of Operations
Management Practices on Performance
Regular Paper
Elisa Battistoni
1,*, Andrea Bonacelli
2,
Andrea Fronzetti Colladon
1and Massimiliano M. Schiraldi
11 “Tor Vergata” University of Rome, Department of Enterprise Engineering, Roma, Italy 2 Enel S.p.a., Market Division, Customer Service Business Unit, Roma, Italy
* Corresponding author E-mail: [email protected]
Received 5 Jul 2013; Accepted 19 Aug 2013
DOI: 10.5772/56919
© 2013 Battistoni et al.; licensee InTech. This is an open access article distributed under the terms of the Creative Commons Attribution License (http://creativecommons.org/licenses/by/3.0), which permits unrestricted use, distribution, and reproduction in any medium, provided the original work is properly cited.
Abstract In this paper we investigate the possible relationships among some optimization techniques used in Operations Management and the performance of SMEs that operate in the manufacturing sector. A model based on the Structural Equation Modelling (SEM) approach is used to analyse a dataset of small and medium-sized Italian enterprises. The model is expressed by a system of simultaneous equations and is solved through regression analysis. Taking advantage of the contributions presented previously, we focus our research on the Italian economy, highlighting the importance of Operations Management practices, which are relevant drivers of these firms’ performances.
Keywords SME performance, Operations Management, Structural Equation Modelling
1. Introduction
Nowadays, companies need to operate in highly dynamic environments where key resources are scarce and where uncertainty in business opportunities is common. The
market imposes high efficiency standards and firms that fail to meet them are quickly marginalized. In such a scenario, a careful optimization of internal resources is a must for every firm which wants to maintain a competitive edge. This has to be accompanied by the continuous improvement of internal processes and routines. To achieve this aim, knowledge management and skills enhancement processes can play a major role, especially for Small and Medium-sized Enterprises (SMEs). This is because SMEs are often missing a corporate function with which to manage these processes directly, and more frequently favour a learning by doing process. The nature of SMEs can push them into being very operative and into taking ideas from practical issues in order to access information and to develop specific skills. This can cause internal knowledge to be very specialized and strongly connected to the real world; such an approach is clearly extremely important because it allows for the quick analysis and solution of operative problems and also an awareness of the knowledge gap that needs to be filled [1] [2]. However, missing expertise cannot always be acquired by bringing in new resources [3]; therefore, employee training can be extremely
important, even if it is often disregarded by many entrepreneurs leading small businesses. The high level of competition in the business environment pushes SMEs towards new learning models [4], also considering the high value of relationship patterns. This is because SMEs frequently interact – for example with supply chain agents or with members of professional organizations and business unions – thus having the possibility to exchange knowledge and to successfully learn from one another [5]. Moreover, SMEs can now benefit from analytical tools that were previously a privilege only for big enterprises – such as benchmarking methodologies or the diffusion of best practices. The value of a scientific approach in measuring performances and managing knowledge is now widely recognized.
Due to their nature, SMEs are primarily concerned with their core business. Accordingly, Operations Management (OM) activities should for the most part engage with firms that are part of the manufacturing sector. Operations Management identifies all the activities necessary to plan, develop and improve the business processes involved in the manufacturing of a product or in the provision of a service [6]. We therefore refer not just to manufacturing processes, but also to all the operations related to logistics and the development of new products [7]. So, even if the importance of OM is sometimes neglected, especially in small-sized enterprises, a new and more careful managerial culture is now starting to come into being [8].
In this paper we investigate the possible relationships among some optimization techniques used in Operations Management and the performance of SMEs that operate in the manufacturing sector. For this reason, we analysed a dataset of 3,500 small and medium-sized Italian enterprises. With the use of a survey [9], we carried out an in-depth study of a subset of the database – consisting of every record which was complete – in depth so as to develop a model based on the Structural Equation Modelling (SEM) approach. This kind of approach is largely used in OM [10], since SEM is considered one of the best methodologies for creating and validating theoretical models in this field. Moreover, we refer to Cronbach’s alpha and to confirmatory factor analysis in order to check the data reliability.
2. Methodology
Survey research is a valuable tool for use in scientific research which aims to develop new theoretical models [11]. Within this approach we can distinguish two main categories of surveys [12]:
• explorative, also known as descriptive: these surveys are meant to study the current state of a phenomenon, in a chosen population. It is the first step in a scientific investigation. This category also includes all the data
collected to describe the results of a certain phenomenon. For instance, one could use an explorative survey to measure the level of the adoption of an MRP system and to develop the performance improvements it generates;
• explicative, also known as relational: these surveys are meant to test a certain hypothesis and the relationships among the variables which are the object of the investigation. Hypotheses may just prove the existence of a specific relationship, or also infer the existence of a positive or a negative influence.
Survey research is therefore an important empirical tool which can be used when studying OM. Here is a short synthesis of the main steps of this approach [13] [11]: • setting of the theoretical background;
• selection of the research methodology; • definition of the data collection approach; • data collection;
• selection of tools for the analysis; • analysis of the collected data.
With regard to the sampling techniques and to data collection, three different kinds of survey are possible [9]: • a new investigation into surveys from prior research;
in this case a new data collection is unnecessary, as an existing set is inspected again, in order to reveal hidden relationships among variables or to explore new research questions;
• probability sampling; a new sample is built using a random selection method, to make sure that different units in the population have equal chances of being chosen;
• surveys administered to the entire population. It is also possible to distinguish between four levels of inspection [13]:
• companies can be studied as systems, in their entirety; • divisions can be inspected separately, for instance
focusing on Production or Sales;
• at an individual level, some employees can be elected as representatives of their division;
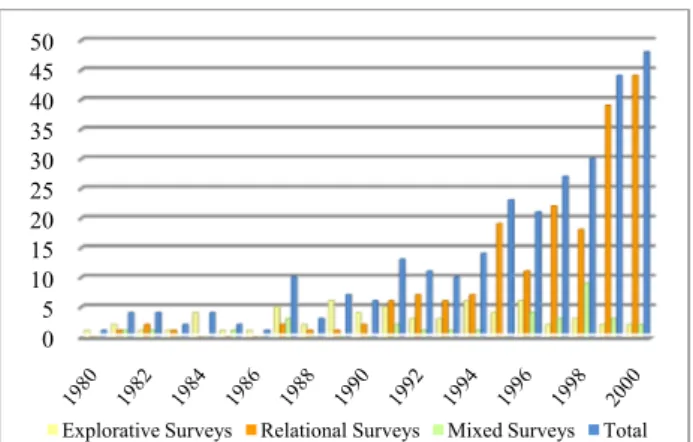
• one or more specific production sites can be investigated. In recent decades, survey research has been used more and more frequently as a valuable empirical tool in OM. It has become an important addition to commonly used approaches based on simulation modelling. Consistently, the high value of Survey Research is widely accepted and recognized and often leads to high quality results. As shown in Figure 1, there were more than 280 scientific publications based on Survey Research – presented in journals such as Journal of Operations Management, Decision
Sciences, Management Science or International Journal of Production Research – from 1980 to 2000.
Figure 1. Number of surveys on OM per year
3. The effectiveness of OM practices: literature review
In this section we briefly analyse the most commonly used OM practices meant to enhance a firm’s performance. As previously described in our introduction, we include Survey Research and also the other main empirical approaches which have been shown to have some relevance in the literature.
By “OM practices” we refer to every procedure or methodological solution which is carried out on the “shop floor” and which is meant to improve the efficiency of production and logistic processes for industrial goods. Therefore, we include general approaches like the “World Class Manufacturing” (WCM) approach [14] – which embraces detailed tools conceived to optimize workplace organization, professional maintenance and so on. More specific methodologies are also considered, such as the “Total Quality Management” (TQM) approach [15] with regard to quality management (this approach also includes specific tools such as Statistical Process Control, Six Sigma, etc.), or the “Total Productive Maintenance” (TPM) approach [16], with regard to maintenance practices, or the “Just-in-Time” (JIT) approach [17], with regard to production operations (also including heijunka and kanban [18]). Other more specific methodologies, meant to address particular problems, can be important as well; among these we recall those conceived to optimize order processing [19], warehouse management [20] [21,22,23], and material management [24] [25] [26] [27] [28], etc.
As an example, we describe the case of Total Quality Management (TQM) [29]. The adoption of this approach has been shown to be positively associated with the improvement of general performance [30], with a higher operation efficiency [31] and with better financial results [32]. Such a positive association increases in the manufacturing sector, when managers use a reward system actually based on OM process outcomes [33]. Moreover, TQM’s results are related in a positive way to a firm’s market share in the manufacturing sector [34], as
it is also a powerful ally for the optimal exploitation of economic assets and of human capital. Yet, the statistical tools offered to control the production processes can bring about a positive effect on the quality level perceived by the final customer (business or consumer) and can dramatically reduce production waste – this altogether leading to better economical results [35]. In order to succeed with TQM it is extremely important to provide employees with a basic training in quality management [36]. Our short introduction to the relationships between performance and TQM is presented in Kaynak [37]: in his model, Kaynak shows a graphical representation of the relationships between performance and the most used practices in TQM – those that have the biggest impact on this method [38]. A positive relationship is represented by arrows linking the elements together. This model was validated by a survey administered to about 210 American companies, of which 55% were classified as SMEs. The results are consistent with previous studies on TQM [39] [40]. It is worth highlighting how some elements, here included in TQM, are taken from other well-known OM techniques: survey items often refer to JIT procedures or to the fundamentals of Supply Chain Management (SCM) [41]. Our aim is not to list all these elements, but to highlight the close connection between the different approaches in OM, including JIT and quality management.
Moreover, JIT was also extensively analysed to empirically test its effect on performance [42]. Benefits in economic performance deriving from improved efficiency in operations, waste reduction and a new shared vision for continuous improvement were observed. In JIT, recommendations for improving production processes are organized into six main areas:
• product quality; • production times;
• flexibility in managing human resources; • simplification of accounting operations; • company profits;
• reduction of stocks and of work-in-progress.
The more efficiently JIT is applied and the more its culture is spread within the firm, the more tangible the results in these six areas will be [42]. Nevertheless, it is also extremely important for JIT to be integrated with all other business functions. Therefore, a systemic point of view helps when reorganizing the infrastructural system of an enterprise. Important research in this field was carried out on a sample of American and Japanese manufacturing firms [43]. Other authors have thoroughly investigated the relationships among the JIT elements and, surprisingly, acknowledged that individual practices did not influence the firms’ performance significantly, except for Kanban [18]. JIT as a whole was also considered, this time being seen to have a positive
0 5 10 15 20 25 30 35 40 45 50
relationship with the operative performances that were analysed in the study. A more general conclusion underlines how JIT must be considered as a general management approach and its culture has to be widely diffused in every area of the firm – not just being relegated to the production departments – to achieve a better general performance and to deal with OM as an integrated approach. On top of this, another important model can be cited [44], with regard to JIT. This model was validated by a survey administered to about 50 Japanese manufacturing companies and presented two main hypotheses:
• a JIT production system is closely connected with other elements of OM, such as quality control, information systems, supply chain control and human resources management;
• a JIT production system positively affects the firm’s performance and in particular that of its production sites. JIT implementation was evaluated on the basis of nine indicators:
• compliance with the daily production as planned; • layout of the production plant;
• JIT deliveries from suppliers; • JIT deliveries to clients; • kanban;
• MRP integration with JIT; • stability of the master schedule; • reductions in setup times; • reductions in production lots.
Compared to the previously mentioned research, we notice a common trend of integrating JIT and TQM with other OM disciplines. In any case, authors studying JIT are more orientated towards a deeper fusion with management practices in general: this is because they analyse the effects on firms’ global performance combining data from JIT Production Systems, Quality Management and Information Systems. This is a first important step towards analysing performance correlations as a whole, instead of focusing on single practices. This is due to the fact that results often emerge from the interactions among elements, rather than just being the sum of isolated procedures or techniques. We can now consider other very important results, described in the research by McKone et al. [45] who analyse the possible relationship between Total Productive Maintenance (TPM) and performance. Here TPM is also analysed in connection to JIT and TQM. Again, survey research was used to investigate 117 production plants, located all over the world. These are the hypotheses of the model that were partially accepted: • TPM has a strong positive impact on about half of the
KPIs used to measure manufacturing performance; • TPM can provide a valuable contribution to
performance because of its indirect implications to JIT.
Once again, evidence of a strong connection among the principal OM practices is found. It is also possible to see how Supply Chain Management (SCM) optimization techniques were analysed in-depth, with statistics confirming their importance for enhancing firms’ performance [46] – regardless of the possible interactions with other practices, such as the supply processes in JIT. To sum up, we may conclude, from the literature, that the main OM practices can generate improvements in the performance of manufacturing companies; positive effects are even increased by the synergies emerging from the combined use of different approaches – such as TQM, JIT, TPM and SCM optimization [35] [47]. Consistently, when we recommend new OM strategies we should not focus on just one single technique, but should approach the firm as a complex system, where the interactions among elements are more important than each single element considered as a separate part of the optimization problem.
In the literature many studies follow a systemic approach. In Robb et al. [48] performance in product markets was linked to the integration of OM and SCM. The authors agree that OM practices deliver a positive impact on performance both directly and indirectly. Survey research carried out on this topic identified 68 crucial items with which to evaluate seven areas that are decisive for the success of OM [49]:
• relationships with customers; • relationships with suppliers; • e-commerce;
• enterprise software;
• Advanced Manufacturing Technologies; • Advanced Manufacturing Systems; • human resources.
In this way, success in OM can be inferred by performance improvements in each of the above-mentioned areas. Nonetheless, specific indicators can be identified to directly map the performance level of companies, of single business departments, or of a product’s success in the market. With regard to operations, four KPIs are commonly used: value, speed, flexibility and innovation [50]. These factors are major elements of good results in:
• improving quality and reliability and reducing costs; • reducing production and delivery times;
• flexibly adapting the productive capacity;
• reducing times for a new product’s development and commercialization.
Robb et al.’s model [48] was partially validated by a survey administered to 72 Chinese enterprises operating in the manufacturing sector. The authors used Structural Equation Modelling (SEM) and path analysis to reveal
that OM practices have a mediating function in improving market performance: therefore, even if they did not find a significant confirmation of a direct impact, they were able to demonstrate that a better implementation of OM practices and a high importance being given to the operations department are positively and indirectly linked to performance. Path analysis also allows for a deeper understanding of the relative influence among each element in the model. In any case, this model has strong limitations due to the nature of the sample and to the peculiarities of the Chinese market. Making the most of the contributions presented so far, we focus our research on the Italian economy, mainly based on small and medium enterprises. In Italy, SMEs account for more than 95% of the total and provide occupation for about 60-70% of workers (OCSE 2000). Furthermore, those operating in the manufacturing sector have a core business which is much more centred on production activities than compared to the large enterprises.
4. Structural Equation Modelling (SEM) approach
When modelling OM practices, it is often necessary to deal with a wide range of variables that cannot be measured directly. If this is the case, we estimate values for these variables by referring to proxy indicators. Structural Equation Modelling (SEM) is an extremely useful methodology in such a context, since it allows a phenomenon to be described by a two-step procedure. In the first step, causal links among variables influencing the modelled phenomenon are graphically illustrated. These variables are called “factors” or “latent variables” – since they cannot be measured directly. Factors can be represented as nodes of a graph and causal links as oriented arcs connecting the nodes. In this graph the same variable could be dependent for some specific causal link and independent for others. In addition, variables are classified as exogenous or endogenous to the causal model: exogenous variables cannot be influenced by internal elements of the modelled system; endogenous variables, on the contrary, are affected by internal causal links. Both are important for analysing the system’s status. As a second step, a measurement model is attained from the graph depicted in step one. In this model, one or more proxy indicators are assigned to the factors. In addition, specific terms are added to represent measurement errors for proxy indicators and for latent variables. The analytic development of the model allows for a weight to be assigned to every arc, so as to give a value to the influence of each variable on the others connected to it.
The model can be expressed mathematically with a system of simultaneous equations to be solved with regression analysis. Every equation in the system
originates from one or more causal links of independent variables with other variables – exogenous or endogenous – and includes measurement errors. Consistently, an endogenous variable can be considered as being dependent in one equation and independent in another one.
൜ݕ ൌ Ȧݔ ൌ Ȧ௬ߟ ߳ ௫ߦ ߜ Here we briefly describe the notation used:
• η is the vector representing endogenous latent variables;
• ξ is the vector representing exogenous latent variables;
• y is the vector of proxy indicators for endogenous factors;
• x is the vector of proxy indicators for exogenous factors;
• Λy is the vector of weights for endogenous factors on
y;
• Λx is the vector of weights for exogenous factors on x;
• ε is the vector of measurement errors for y; • δ is the vector of measurement errors for x.
It is worth noting that the following conditions must be respected:
• E(ε)=0; • E(δ)=0;
• ε, δ, ζ and η must not be correlated.
By solving the system we can determine the weights for each arc in the graph (vectors Λy and Λx) and, therefore,
the influence of each variable on the others. Structural equation models can be projected and solved using software such as IBM AMOS, which also provides statistics on the model’s effectiveness with real data, like χ2 [51].
5. Case study
We carried out a case study to test the possible associations among OM practices and the performance of SMEs. Unlike what can be found in the literature, we focused on SMEs, thus the models were conceived and built for this purpose.
Size is one of the main factors characterizing SMEs and, even if Robb et al. [48] do not find a correlation between this factor and performance, we believe their research should be extended to consider the Italian scenario which is very different from the Chinese one studied by the authors. It is also a common misconception to think that SMEs are not interested in quality management or in the cost reductions which may come from the application of the principles of lean production [15]; the growing
adoption of ISO quality standards is but the first proof of this mistake.
SMEs are heterogeneous and operate in a complex and dynamic system, therefore we recommend the analyst to follow a two-step approach in the analysis:
• first, check the non-correlation between size and perceived importance of OM practices;
• second, test the relationship between the importance accredited to OM practices and the firm’s performance.
This approach will prevent the analyst from making errors in the selection of a suitable scenario. It is impossible to proceed to the second step if the first condition is not respected. The primary focus of our investigation is to test these two relationships. To achieve this, we used Structural Equation Modelling to define two different models, together with their mathematical interpretations.
In these models the importance given to OM practices is not measured directly, but is deduced from general improvements obtained in OM; this is in accordance with prior research [48] [52].
We starting with a dataset of about 3,500 manufacturing firms, but we were only able to work on a smaller sample of 100 SMEs; this is because only 100 companies provided complete data for the indicators we needed to include in our study. Survey Research allowed us to structure the conceptual model described. Results from a first analysis of the surveys led us to distinguish between two branches of OM: the first with a focus on production (OM Production), the second with a focus on supply chain (OM SC). Performance results in OM were also considered. The importance that management accords to OM Production was mapped using the following five items:
• the production planning approach and principles; • the strategies used to introduce new production
technologies;
• organization in facilities management; • percentage of on-time deliveries to customers; • magnitude of the total production lead time
compared with net manufacturing time.
Each item was measured using fixed choice questions, associated with a score ranging from 0 to 5. This is an example of the possible answers which could have been given for the third item:
0. I don’t know;
1. constant burden and disorganization, with a high level of Work-in-Process items (WIP) inappropriately located;
2. frequent burden and disorganization;
3. general tidiness, few inappropriately located WIP;
4. good organization and level of tidiness;
5. clean and ordered production units, always ready for inspection, minimal level of inappropriately located WIP.
Consequently, the OM Production factor was represented through proxy indicators.
Surveys are also important in that they give insight into the OM practices used in a firm. For instance, from the answers used to map the item “production planning approach and principles”, we can easily understand whether or not a company endorses a lean production approach.
Confirmatory factor analysis, carried out using the principal component analysis methodology, was used to test the validity of the construction. Using this methodology we were able to check the construction’s consistency, to identify latent constructions and to remove inconsistent items. Finally, Cronbach’s Alpha [53] was calculated, obtaining a value of 0.728 for five items. This value could be accepted [54]. Consequently, we can accept the construction of OM Production and use it in SEM.
With regard to OM in Supply Chain four items were used:
• the company analyses and actively responds to customers’ needs and systematically makes use of ad-hoc practices;
• the company has stable relationships with its clients and is considered as a reliable partner;
• The Customer Management System is able to collect valuable information and to effectively interface with production processes;
• suppliers’ and customers’ needs are taken into account in the development phase of a new product. Even in this case it is possible to deduct many OM practices from the answers given for each item. This construction was tested in the same way that we tested OM Production with suitable results.
Model I
We constructed the first model in order to look for a causal link between the firms’ size and the importance accorded to OM practices, both for production and supply chain management. We depict Model I in Figure 2. In this model we hypothesize that the firms’ size impacts both OM production and OM SC, whereas H0 is such that
an influence is not statistically significant.
In Figure 3 we illustrate the measurement model associated with the conceptual model. The firm’s size is expressed by the number of employees; other latent variables are measured using the survey items we previously presented. Errors (ER) are also linked to proxy indicators.
Figure 3. Measurement Model I
Model II
In Figure 4, we present a first representation of Model II. In this model we are looking for a relationship between OM Production and OM SC, and performance. We also hypothesize that there will be a causal link from OM SC to OM Production and vice versa. This is due to the fact that different OM practices can be integrated and can influence one another. Our aim in this model is to reject H0 – formulated as the absence of a significant influence
of OM SC and OM Production on the firms’ performance.
Figure 4. Conceptual Model II
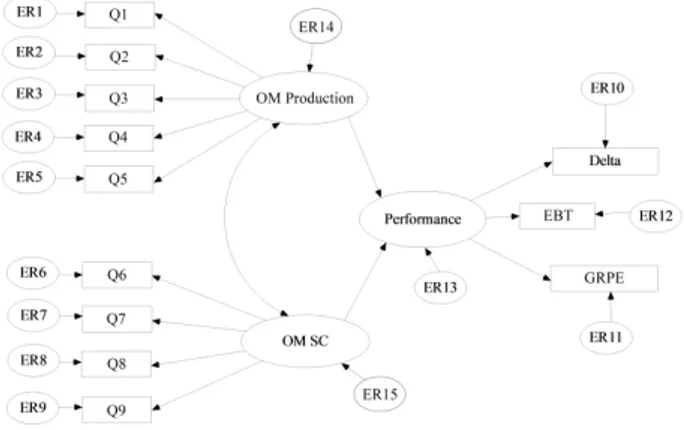
Figure5. Measurement Model II
Measurement Model II is shown in Figure 5, together with the errors associated with each proxy indicator and with latent variables. Once again we used answers to survey items such as proxy indicators for OM factors. Performance, on the other hand, was measured by taking into account the following proxies (each one referring to the year in which the survey was made):
• Earnings before tax (EBT);
• Variance in gross revenue compared with the previous year (Delta);
• Gross revenue per employee (GRPE).
6. Results
Results from Model I
To carry out our analysis we used the maximum likelihood method. This allowed for the calculation of coefficients for causal links. Figure 6 illustrates the results.
Figure 6. Output for Model I
Arcs are valued with standardized weights which are derived from SEM. Statistics for the goodness of fit are as follows: χ2=57.528 (counting 34 degrees of freedom) with
a p-value of 0.007; RMSEA=0.075 and CFI=0.694 [51]. In addition, the Hoelter critical number is also respected [55] – 105 being the maximum size of the sample with a significance level of 0.05. The good fit of our model is then confirmed for every reported statistic.
p OM Production <--- EMPLOYEES .287 OM SC <--- EMPLOYEES .953 Q1 <--- OM Production .008 Q2 <--- OM Production Q3 <--- OM Production .127 Q4 <--- OM Production .131 Q5 <--- OM Production .007 Q6 <--- OM SC .002 Q7 <--- OM SC .001 Q8 <--- OM SC Q9 <--- OM SC .003
Table 1. p-values for coefficients in Model I
In Table 1 we report the significance values for each coefficient.
Missing values are due to the model’s constraints. Results clearly show good values of significance (p<0.01) associated with proxies for latent variables – except for FM403 and FM404 where we still have quite low, but acceptable, values. On the contrary, p values for the first two indicators are relatively high, so we cannot reject H0
and, therefore, have no evidence of whether size affects either OM Production or OM SC. To confirm this result we also carried out a similar analysis where we substituted the proxy indicator for size – instead of the number of employees we considered gross revenues. These two indicators are those used to classify firms as SMEs. Results from this further analysis are fully in accordance with the previous results.
Results from Model II
Following the same procedure we used for Model I we obtained coefficients for Model II – which are shown in Figure 7. The main purpose of this model was to reject H0
to provide evidence of the relationship between performance and OM practices both in production and in the supply chain.
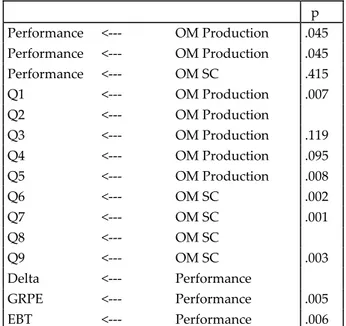
Figure 7. Output for Model II
p Performance <--- OM Production .045 Performance <--- OM Production .045 Performance <--- OM SC .415 Q1 <--- OM Production .007 Q2 <--- OM Production Q3 <--- OM Production .119 Q4 <--- OM Production .095 Q5 <--- OM Production .008 Q6 <--- OM SC .002 Q7 <--- OM SC .001 Q8 <--- OM SC Q9 <--- OM SC .003 Delta <--- Performance GRPE <--- Performance .005 EBT <--- Performance .006
Table 2. p-values for coefficients in Model II
From this point of view, the most important causal links are those among OM Production, OM SC and Performance. Statistics for this second model are as follows: χ2=81.231 (considering 52 degrees of freedom)
with a p-value of 0.006; RMSEA=0.067; CFI=0.743. The Hoelter critical number is once again respected– 107 being the maximum size of the sample with a significance level of 0.05. Consequently, we can state that our second model can be accepted with a good fit proved by the statistics [51]. In Table 2 we report the significance values for each coefficient, where EBT stands for Earnings Before Tax and GRPE stands for Gross Revenue per Employee. The p-values confirm the significance of the model’s coefficients, except in the few cases that we are about to discuss. The relationship between OM SC and Performance is not significant and we believe this could be because of the specific indicators used to measure performance – which are perhaps more appropriate for analysing performance elements directly connected to production and sales. Further research could test other proxy indicators for performance, in order to better decide which aspects of supply chain management to consider. Accordingly, the positive relationship between OM Production and Performance (with a value of 0.48) is significant at a level of 0.05.
7. Discussion and conclusions
Our research highlights the importance of Operations Management for Italian SMEs operating in the manufacturing sector: OM practices are relevant indicators of these firms’ performance. Model II points out the value of this positive association – to be carefully taken into account by management, in order to implement best practices that can affect revenue and
internal efficiency. This offers a clear input for the diffusion of OM culture also in business clusters and every time new policies have to be introduced. Our results are consistent with previous studies even if highly focused on the specific context of Italian SMEs. We suggest further research to further investigate the relationship between OM SC and performance, which is not significant in our case study, probably because of the proxy indicators used to express performance. Furthermore, the absence of a significant relationship between OM practices and the companies’ size – tested using Model I – is useful in showing the importance accorded to these practices regardless of the companies’ dimension. We used Survey Research and Structural Equation Modelling to structure empirical models that could be easily replicated and applied to other settings. Possible extensions may be achieved by considering a larger sample and also by using different proxy indicators for latent variables, or from a deeper analysis of OM practices more specific to the methodologies and techniques adopted by Italian SMEs. In this way, researchers could differentiate and highlight the strongest causal links to performance.
8.References
[1] Kotter JP. (1995) Leading Change: Why Transformation Efforts Fail. Harvard Business Review. : p. n.2.
[2] Grimaldi M, Cricelli L, Rogo F. (2012) A methodology to assess value creation in communities of innovation. Journal of Intellectual Capital. 13(3): 305-330.
[3] Greco M, Cricelli L, Grimaldi M. (2013) A strategic management framework of tangible and intangible assets. European Management Journal. 31(1): 55-56. [4] Cricelli L, Grimaldi M. (2012) Knowledge-based
Inter-Organizational Collaboration. Journal of Knowledge Management. 14(3): 348-358.
[5] Keegan R (2007) ABC. Applied benchmarking for competitiveness Milano: Franco Angeli.
[6] Chase RB, Jacobs FR, Aquilano NJ (2008) Operations Management nella produzione e nei servizi Milano: McGraw-Hill.
[7] Slack N, Lewis M (2002) Operations Strategy Harlow: FT-Prentice Hall.
[8] Greco M, Grimaldi M, Scarabotti L, Schiraldi MM. (2013) The sources of competitive advantage in University Spin-Offs: a case study. Journal of Technology Management & Innovation. 8 (4), in press.
[9] Rungtusanatham MJ, Choi TY, Hollingworth DG, Wu Z, Forza C. (2003) Survey research in operations management: historical analyses. Journal of Operations Management. : n.21, 475-488.
[10] Shah R, Goldstein SM. (2006) Use of Structural Equation Modeling in Operations Management Research: Looking Back and Forward. Journal of Operations Mangement. 24: 148-169.
[11] Malhotra MK, Grover V. (1998) An assessment of survey research in POM: from constructs to theory. Journal of Operations Management. : n.16. 407–425. [12] Kerlinger FN (1986) Foundations of behavioral
research New York: Holt,Rinehart & Winston. [13] Flynn BB, Sakakibara S, Schroeder RG, Bates KA,
Flynn EJ. (1990) Empirical Research Methods in Operations Management. Journal of Operations Management. 9(2): 250-284.
[14] Schonberger RJ (1986) World Class Manufacturing: Free Press.
[15] Ghobadian A, Gallear DA. (1996) Total Quality Management in SMEs. Intenational Jounal of Management Science. : 24, n.1, 83-106.
[16] Nakajima S (1988) Introduction to TPM: Productivity Press.
[17] Taiichi O (1988) Toyota Production System: Beyond Large-Scale Production. In.: Productivity Press. [18] Giordano F, Schiraldi MM (2013) On Just-In-Time
Production Leveling. In Schiraldi MM, editor. Operations Management. Fiume (Croazia): Intech pp. 141-163.
[19] Baciarello L, D’Avino M, Onori R, Schiraldi MM. (2013) Lot Sizing Heuristics Performance. International Journal of Engineering Business Management. 5(6): 1-10.
[20] Fumi A, Scarabotti L, Schiraldi MM. (2013) The Effect of Slot-Code Optimization on Travel Times in Common Unit-Load Warehouses. International Journal of Services and Operations Management. 15(4): 507-527.
[21] Fumi A, Scarabotti L, Schiraldi MM. (2013) Multiproduct slot allocation heuristic to minimize storage space. International Journal of Retail & Distribution Managament. (forthcoming).
[22] Fumi A, Scarabotti L, Schiraldi MM. (2013) The effect of slot-code optimization in warehouse order picking. International Journal of Engineering Business Management. 5(20): 1-10.
[23] Fumi A, Scarabotti L, Schiraldi MM. (2013) Minimizing warehouse space with dedicated storage policy. International Journal of Engineering Business Management. 5(21): 1-10.
[24] D’Avino M, De Simone V, Schiraldi MM. (2013) Revised MRP for reducing inventory level and smoothing order releases: a case in manufacturing industry. Production Planning & Control. available online since 12 Mar 2013.
[25] Bregni A, D'Avino M, De Simone V, Schiraldi MM. (2013) Formulas of Revised MRP. Interational Journal of Engineering Business Management. 5(10): 1-8.
[26] D’Avino M, Bregni A, Schiraldi MM. (2013) A revised and improved version of the MRP algorithm: Rev MRP. Applied Mechanics and Materials. 328: 276-280. [27] Mancini V, Pasquali M, Schiraldi MM. (2012) Opportunities for using RFID in the aircraft production process. International Journal of RF Technologies: Research and Applications. 3(4): 243-255.
[28] Scotti P, M. F, Iannone R, Mancini V, M.M. S. (2013) Economical evaluation of RFID technology in production environment. International Journal of Engineering Business Management. 5(39): 1-13. [29] Deming WE (1993) The New Economics For Industry,
Government & Education Cambridge: Massachusetts Institute of Technology Center for Advanced Engineering Study.
[30] Hendricks KB, Singhal VR. (1996) Quality awards and the market value of the firm: an empirical investigation. Management Science. : n.42, 415–436. [31] Hendricks KB, Singhal VR. (1997) Does implementing
an effective TQM program actually improve operating performance? Empirical evidence from firms that have won quality awards. Management Science. : n.43, 1258–1274.
[32] Easton GS, Jarrell SL. (1998) The effects of total quality management on corporate performance: an empirical investigation. Journal of Business. : n.71 (2), 253–307.
[33] Chenhall RH. (1997) Reliance on manufacturing performance, total quality management and organizational performance. Management Accounting Research. : n.8, 187–206.
[34] Mohrman SA, Tenkasi RV, Lawler III EE, Ledford Jr. GG. (1995) Total quality management: practice and outcomes in the largest US firms. Employee Relations. : n.17 (3), 26–41.
[35] Flynn BB, Sakakibara S¸RG. (1995) Relationship between JIT and TQM: Practices and Performance. The Academy of Management Journal. 38(5): 1325-1360.
[36] Adam Jr. EE, Corbett LM, Flores BE, Harrison NJ, Lee TS, Rho BH, et al. (1997) An international study of quality improvement approach and firm performance. International Journal of Operations and Production Management. : n.17, 842–873.
[37] Kaynak H. (2003) The relationship between total quality management practices and their effects on firm performance. Journal of Operations Management.: n.21, 405–435.
[38] Saraph JV, Benson GP, Schroeder RG. (1989) An instrument for measuring the critical factors of quality management. Decision Sciences. : n.20, 810– 829.
[39] Das A, Handfield RB, Calantone RJ, Ghosh S. (2000) A contingent view of quality management: the impact of international competition on quality. Decision Sciences. : n.31, 649–690.
[40] Flynn BB, Schroeder RG, Sakakibara S. (1995) The impact of quality management practices on performance and competitive advantage. Decision Sciences. 26: 659–691.
[41] Dello Stritto G, Falsini D, Schiraldi MM. (2013) Supply chain network design for the diffusion of a new product. International Journal of Engineering Science and Technology. 5(2): 72-92.
[42] Fullerton RR, McWatters CS. (2001) The production performance benefits from JIT implementation. Journal of Operations Management. : n. 19, 81–96. [43] Sakakibara S, Flynn BB, Schroeder RJ, Morris WT.
(1997) The Impact of Just in Time Manufacturing and Its Infrastructure on Manufacturing Performance. Management Science. : n. 43 (9), 1246-1257.
[44] Matsui Y. (2007) An empirical analysis of just-in-time production in Japanese manufacturing companies. Int. J. Production Economics. : n.108, 153–164. [45] McKone KE, Schroeder RG, Cua KO. (2001) The
impact of total productive maintenance practices on manufacturing performance. Journal of Operations Management. : n.19, 39–58.
[46] Lia S, Ragu-Nathanb B, Ragu-Nathanb TS, Raob SS. (2006) The impact of supplychain management practices on competitive advantage and organizational performance. Omega, The International Journal of Management Science. : n.34, 107-124.
[47] Cua KO, McKone KE, Schroeder RG. (2001) Relationships between implementation of TQM, JIT, and TPM and manufacturing performance. Journal of Operations Management. : n.19, 675–694.
[48] Robb DJ, Xie B, Arthanari T. (2008) Supply chain and operations practice and performance in Chinese furniture manufacturing. Int. Journal of Production Economics. : n.112, 683-689.
[49] Vickery SK, Droge C, Markland RE. (1997) Dimensions of manufacturing strength in the furniture industry. Journal of Operations Management. : n.15, 317–330.
[50] Robb DJ, Xie B. (2003) A survey of manufacturing strategy and technology in the Chinese furniture industry. European Management Journal. : n.21, 484– 496.
[51] Hu L, Bentler PM. (1999) Cutoff criteria for fit indexes in covariance structure analysis: Conventional criteria versus new alternatives. Structural Equation Modeling. : n.6, 1-55.
[52] Zhao X, Sum CC, Qi Y, Zhang H, Lee TS. (2006) A taxonomy of manufacturing strategies in China. Journal of Operations Management. : n.24, 621–636.
[53] Cronbach LJ. (1951) Coefficient alpha and the internal structure of tests. Psychometrika. : n.16 (3), 297-334. [54] Hair JF, Black B, Babin B, Anderson RE, Tatham RL
(2006) Multivariate Data Analysis Upper Saddle River, NJ: Pearson Prentice-Hall.
[55] Hoelter JW. (1983) The Analysis of Covariance Structures. Sociological Methods & Research. : Vol. 11, No. 3, 325-344.
[56] Huin SF. (2004) Managing deployment of ERP systems in SMEs using multi-agents. International Journal of Project Management. : n.22, 511-517. [57] Goldberger A. (1972) Structural equation methods in