U
NIVERSITY OF
G
ENOVA
P
HD P
ROGRAM INB
IOENGINEERING ANDR
OBOTICSMemory for sounds: novel technological
solutions for the evaluation of mnestic skills
by Walter Setti
Thesis submitted for the degree of Doctor of Philosophy (31◦cycle) December 2019
Monica Gori and Giulio Sandini Supervisor Luigi Cuturi Co-Supervisor Giorgio Cannata Head of the PhD program Thesis Jury:
Name, University External examiner Name, University External examiner
I would like to dedicate this thesis to my family which supported, advised and accompained me throughout these years
Declaration
I hereby declare that except where specific reference is made to the work of others, the contents of this dissertation are original and have not been submitted in whole or in part for consideration for any other degree or qualification in this, or any other university. This dissertation is my own work and contains nothing which is the outcome of work done in collaboration with others, except as specified in the text and Acknowledgements. This dissertation contains fewer than 65,000 words including appendices, bibliography, footnotes, tables and equations and has fewer than 150 figures.
Walter Setti March 2020
Acknowledgements
Abstract
Working memory (WM) plays a crucial role in helping individuals to perform everyday activities. The neural structures underlying this system continue to develop during infancy and reach maturity only late in development. Despite useful insights into visual memory mechanisms, audio-spatial memory has not been thoroughly investigated, especially in chil-dren and congenitally blind individuals.
The main scientific objective of this thesis was to increase knowledge of spatial WM and imagery abilities in the auditory modality. We focused on how these skills change during typical development and on the consequences of early visual deprivation. Our first hypothesis was that the changes in WM functionality and spatial skills occurring in the early years of life, influence the ability to remember and associate spatialized sounds or to explore and learn acoustic spatial layouts. Since vision plays a crucial role in spatial cognition (Thinus-Blanc and Gaunet, 1997), we expected blind individuals to encounter specific difficulties when asked to process and manipulate spatial information retained in memory, as already observed in the haptic modality (Cattaneo et al., 2008; Vecchi, 1998). Although some studies demonstrated the superior performance of the blind in various verbal-memory tasks (Amedi et al., 2003; Požár, 1982; Röder et al., 2001), very little is known on how they remember and manipulate acoustic spatial information.
The investigation of auditory cognition often requires specially adapted hardware and soft-ware solutions rarely available on the market. For example, in the case of studying cognitive functions that involve auditory spatial information, multiple acoustic spatial locations are required, such as numerous speakers or dedicated virtual acoustics. Thus, to the aim of this thesis, we took advantage of novel technological solutions developed explicitly for delivering non-visual spatialized stimuli. We worked on the software development of a vertical array of speakers (ARENA2D), an audio-tactile tablet (Audiobrush), and we designed a system based on an acoustic virtual reality (VR) simulation. These novel solutions were used to adapt validated clinical procedures (Corsi-Block test) and games (the card game Memory) to the auditory domain, to be also performed by visually impaired individuals. Thanks to the technologies developed in these years, we could investigate these topics and observed that
v audio-spatial memory abilities are strongly affected by the developmental stage and the lack of visual experience.
Table of contents
List of figures ix List of tables xv 1 Introduction 1 1.1 Spatial Cognition . . . 2 1.2 Working Memory (WM) . . . 3 1.2.1 Multi-Component model . . . 3 1.2.2 Continuum model . . . 4 1.2.3 The development of WM . . . 61.2.4 Effect of blindness on WM abilities and mental imagery . . . 7
1.3 Spatial Processes, Visual Mental Imagery, WM . . . 9
1.4 Technological solutions for visually impaired people . . . 10
1.4.1 Overview of the existing assistive devices . . . 10
1.4.2 Limitations of the solutions to date available . . . 13
1.5 Aims of the thesis . . . 13
2 Technological solutions developed for the evaluation of audio-spatial memory abilities 15 2.1 ARENA 2D . . . 15
2.1.1 Block Diagram . . . 16
2.1.2 Host Control . . . 17
2.1.3 Slave Unit . . . 17
2.1.4 Wiring and Power cables . . . 18
2.1.5 Operating protocol . . . 18
2.1.6 Serial Interface . . . 18
Table of contents vii
2.1.8 Communication Protocol . . . 19
2.2 The audio virtual reality system . . . 20
2.2.1 3D-Tune In application . . . 20
2.2.2 Communication protocol . . . 21
2.2.3 Virtual Environment Design . . . 22
2.2.4 Arduino-Based keyboard . . . 25
2.3 Audiobrush . . . 26
2.3.1 Communication Protocol . . . 27
2.3.2 Audio-Painting . . . 28
2.3.3 Proof of concepts . . . 29
2.4 Experimental use of these solutions . . . 30
3 Investigation of audio-spatial memory abilities in children and blind individu-als 32 3.1 The role of development on audio-spatial memory abilities . . . 33
3.1.1 Material and Methods . . . 34
3.1.2 Statistical analyses . . . 38
3.1.3 Main results . . . 39
3.1.4 Discussion . . . 41
3.2 The effect of blindness on audio-spatial memory abilities . . . 43
3.2.1 Material and Methods . . . 44
3.2.2 Statistical analyses . . . 46
3.2.3 Main Results . . . 47
3.2.4 Discussion . . . 48
3.3 Relationship between audio-spatial memory and spatial imagery . . . 51
3.3.1 Material and Methods . . . 53
3.3.2 Statistical analyses . . . 56
3.3.3 Main results . . . 57
3.3.4 Discussion . . . 59
4 The Audio-Corsi: An acoustic VR adaptation of the Corsi-Block paradigm 63 4.1 Design and development of the Audio-Corsi and validation of the system . . 65
4.1.1 Task and Procedure . . . 66
4.1.2 Data Analysis . . . 68
4.1.3 Statistical analyses . . . 69
Table of contents viii
4.1.5 Discussion . . . 70
4.2 Audio-Corsitest and memory processes: case study with blind and sighted adults . . . 74
4.3 Task and Procedure . . . 75
4.3.1 Data Analysis . . . 78
4.3.2 Statistical analyses . . . 78
4.3.3 Results . . . 78
4.3.4 Discussion . . . 80
5 General Discussion 84 5.0.1 Technological solutions developed during the PhD . . . 84
5.1 Development of audio-spatial memory abilities . . . 86
5.2 Audio-spatial memory abilities in blind individuals . . . 88
5.3 The emergence of new rehabilitative technologies . . . 91
5.4 Final remarks and future goals . . . 91
List of figures
1.1 First Model proposed by Baddeley in 1986 . . . 4 1.2 Continuum WM model . . . 5 2.1 ARENA2D. ARENA2D is shown at a different level of detail. The panel on
the left presents the device. ARENA2D is a vertical surface (50 x 50 cm), composed of 25 haptic blocks, each provided of a loudspeaker in the center, arranged in the form of a matrix. The middle panel shows a detail of a haptic block. The black hole is the speaker from which the sound is emitted. The blocks are covered by 16 (4x4 matrix) tactile sensors (2 x 2 cm) that register the positions of the touches. The green square on the right represents a detail of a tactile sensor) . . . 16 2.2 Block Diagram . . . 17 2.3 Power and Data connections The panel on the left shows the power
con-nection and the panel on the right the data concon-nections. . . 18 2.4 Virtual serial communication. . . 19 2.5 Binaural Test App. The picture, downloaded from the website of the
project, represents the layout of the binaural test app. The app allows the spatialization of sound sources for binaural (headphones) listening. The app is also provided of some algorithms for simulating near-field and far-field auditory sources and reverberation in a 3D binaural context. More-over, it allows the integration of hearing loss and hearing aid simulators. (http://www.3d-tune-in.eu/) . . . 21
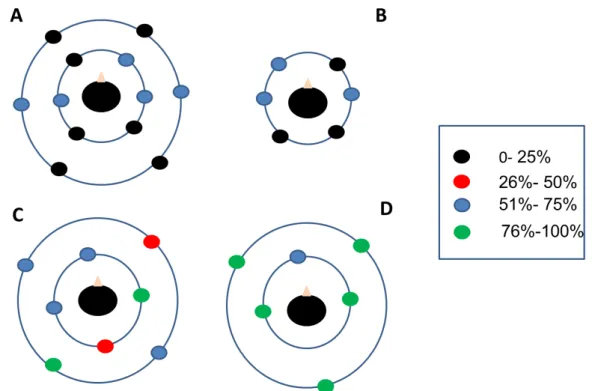
List of figures x 2.6 Results of the pilot tests. The filled circles represent the positions of the
virtual sources. Participants listened to the sounds one by one, in random order, while looking at the configuration printed on a paper placed in front of them. In A C and D, the sounds were displaced on two circles: one closer to participants’ head (perceived at a higher volume), the other further (perceived at a lower volume). Circle’s colors represent the percentage of participants
that correctly indicated the position of the sounds. . . 23
2.7 Sound’s azimuth and elevation. The picture represents the radial variation of the azimuth (red square) and the elevation (green square) of the virtual sources. The 0° value is common to both azimuth and elevation and coincides with user’s nose. The sound positions in the azimuth and elevation vary from 0° to 359.9° anti-clockwise. . . 24
2.8 Sounds’ arrangement in the virtual environment . . . 25
2.9 Keyboard circuit . . . 26
2.10 Assembled keyboard . . . 26
2.11 Audiobrush . . . 27
2.12 TAT boards. The panel on the left is the TAT1, while the panel on the right is the TAT2 . . . 27
2.13 Examples of Armagan’s paintings . . . 29
2.14 Audio-Painting application. The picture shows the application designed to teach how to draw to blind children. Initially, the child chooses the sound by pressing one of the buttons of the keyboard (panel on the left). Afterward, he takes a brush and, by swiping Audiobrush on the chosen position, the selected sound starts to be emitted (panel on the right) . . . 30
3.1 Experimental Conditions. The figure shows the stimuli used in both experi-mental conditions. The images on the figure, downloaded from a royalty-free images web archive (https://publicdomainvectors.org/), refers to the sounds emitted from the blocks once touched by the child. The panel on the left shows the sounds used in the call-call condition. The panel on the right instead, refers to the call-name condition. . . 36
List of figures xi 3.2 Score, example of calculation. The score is an index that decreases when
the children return on the speakers previously touched. When they touch two blocks for the first time, the score equals 0. If they have already touched one or both speakers, the score decreases by one or two, respectively. When a pair is found, the score increases by ten. In the example, if the starting value were equal to zero, the final score would have been: 0 - 1 - 2 + 10 = 7. Depicted animals were downloaded from a royalty-free images web archive (https://publicdomainvectors.org/). . . 38 3.3 Example of audio-anchor calculation. The index equals zero at the
begin-ning of the test. The index increase correlated with more attempts started with the same speaker. In the represented example, the final value would have been: 0+1+1=2. Depicted animals were downloaded from a royalty-free images web archive (https://publicdomainvectors.org/) . . . 39 3.4 Performance results. The panel on the left refers to the score, while the
panel on the right to the number of attempts. In the call-name condition, 6-7 year-olds reach a lower score in a higher number of attempts compared to the other two groups and to the call-call condition. One asterisk (*) represents p<0.5 Two asterisks (**) represent p<0.01 and three asterisks (***) p<0.001. 39 3.5 audio-anchor Data are presented as the mean across participants per each
group; error bars represent the standard error. Regardless of the condition, 6-7 year-olds used this exploration strategy more than the other groups. Significant comparisons between groups are represented. Two asterisks (**) represent p<0.01 and three asterisks (***) p<0.001. . . 41 3.6 Grid Used in the experimental conditions. The two grids differ in the
size of the apertures for each auditory stimulus. The apertures on the grids represented in the left column were 10 cm x 10 cm, equal to the haptic block size. The apertures on the grids represented in the left column were 4 cm x 4 cm. Depicted animals placed inside the squares, refer to the positions of the animal calls in both grids (images downloaded from a royalty-free website, https://publicdomainvectors.org/). The black dot at the center indicates the speaker emitting the feedback sounds. . . 45 3.7 Score. Data are presented as mean and standard error. The panel on the left
refers to the first condition, the panel on the right to the second. Regardless of the experimental condition, the group of blind reached a lower score. In the figure, the two asterisks (**) represent p<0.01. . . 48
List of figures xii 3.8 Number of attempts Data are presented as the mean across participants per
each group and standard error. The sighted needed less attempts to pair the stimuli once their locations have been discovered on ARENA2D. In the figure, the asterisk (*) represents p<0.05. . . 49 3.9 Audio-Anchor. Data are presented as the mean across participants per each
group and standard error. The group of blind relied more on the use of the audio-anchor. In the figure, the asterisk (*) represents p<0.05. . . 49 3.10 Semantic Auditory Scene. The square highlighted in red at the right corner
of the picture represents a haptic block (the red dot in the center is the speaker, see section 2.1 for details). Each square is composed of 16 smaller squares (each representing a tactile sensor). The pictures represented on ARENA2D surface are the sounds used in the semantic condition. Each picture represents the sound emitted by the specific block. The sounds related to the sky (e.g., the plane, the wind) are placed on the top of the device. Sounds related to the ground are at the center, while sounds related to nature (animals and pond) are emitted from the bottom loudspeakers. All the images in the picture have been downloaded by a royalty-free images web archive (https://publicdomainvectors.org/). . . 54 3.11 Improvement of the two groups in both experimental conditions. Data
are presented in terms of mean and standard error. The bars represent the difference between the scores in the post- and pre-test phases for the number of single sounds correctly recalled (upper panel), the number of sequences correctly recalled (middle panel), and the span reached (lower panel). The improvement in the semantic condition was greater for the group of sighted compared to the blind and the non-semantic condition. There was no significant difference in improvement for blind participants between semantic and non-semantic conditions. The asterisks indicate statistical significance (one asterisk (*) represents p<0.05, two asterisks (**) represent p<0.01 and three asterisks (***) represent p<0.001). . . 58 3.12 Mean percentage of audio items recalled out of the total. Data are
pre-sented as mean and standard error. In the figure, the bar plots show the percentage of items correctly recalled after the end of the semantic condition. 59
List of figures xiii 3.13 Comparisons between pre- and post-test phases. Data are presented as
the mean and standard error. The labels BS, BNS, SS, and SNS refer to the experimental conditions and the groups (performance of the blind (B) and sighted (S) participants in the semantic (S) and non-semantic (NS) conditions). In the figure, the upper panel is the percentage of single items, the middle panel the percentage of sequences correctly recalled while the lower panel the memory span. Before the exploration, regardless of the experimental condition, the two groups performed similarly. Only the group of sighted, in the semantic condition, improved after the exploration, as indicated by the asterisks (one asterisk (*) represents p<0.05, two asterisks (**) represent p<0.01 and three asterisks (***) represent p<0.001) . . . 60 4.1 Orginal Corsi-Block apparatus. In the picture, the original illustration
of the Corsi apparatus is shown. The drawing was reprinted from Corsi’s doctoral dissertation in 1972. The blocks are numbered from 1 to 9 on the vertical surface to allow the experimenter to identify the blocks to be tapped 64 4.2 Wooden Board used to accomplish the Corsi-Block paradigm. . . 66 4.3 Performances in both experimental conditions. The panel on the left
refers to the memory span, the middle panel to the number of sequences correctly recalled, the panel on the right to the total score. Three asterisks (***) indicate p <0.001. The label CB indicates the performances in the Corsi-Block, while AC in the Audio-Crsi. As shown in the figure, the subjects outperformed in the Corsi-Block paradigm. . . 70 4.4 Sounds’ disposition in the semantic condition. The picture shows the
sounds used in the semantic condition. In the simulation, the subject is at the center of the virtual environment and listens to spatialized sounds as coming from 6 locations: north-west, north, north-east, east, south, and west. The sounds placed in these positions were, respectively: the car, the bike, the dog, the bells, the water, and the kids while playing. The images used to create this picture were downloaded by a royalty-free images web archive (https://publicdomainvectors.org/) . . . 77
List of figures xiv 4.5 Percentage of sounds recalled after the training. Data are presented as
mean and standard error. The figure shows the percentage of the sounds recalled after the training, by both groups in both experimental condition. we did not find a significant difference between the groups in the number of sounds recalled. . . 79 4.6 Memory Span. Data are presented as the mean and standard error. Results
point out that the span was higher in the semantic condition (panel on the left). The sighted outperformed apart from the experimental condition, and only in the group of the blind, we found a significant difference in the span between the forward and backward processes (panel on the right). The asterisks indicate statistical significance (one asterisk (*) represents p<0.05, two asterisks (**) represent p<001 and three asterisks (***) represent p<0.001). 80 4.7 Sequences correctly recalled. Data are presented as the mean and standard
error. Results point out that, in the semantic condition, the participants recalled more sequences (panel on the left). The panel on the right highlights that the sighted outperformed concerning the other group. Additionally, only the group of blind shows a significant difference in the number of sequences memorized between the forward and backward processes. The asterisks indicate statistical significance (one asterisk (*) represents p<0.05, two asterisks (**) represent p<001 and three asterisks (***) represent p<0.001). 81
List of tables
2.1 Sources in the virtual environment. In the table, the first column refers to the position of the sound for the head of the listener. The other three columns instead refer to the azimuth, the elevation of the sound and the distance of the sound from listeners’ head in the virtual environment. The value of the elevation of the sound positioned behind user’s head is equal to 327.5° in the virtual environment (according to the model used for the Toolkit). The value
here presented corresponds to the model proposed in Figure 2.7 . . . 24
3.1 length of the spoken words used in the call-name condition. . . 35
3.2 Participants’ clinical details . . . 45
3.3 Participants’ clinical details . . . 56
4.1 Performances in both experimental conditions in terms of memory span, mean number of correct sequences and the product between the two. In the Table the means, the standard deviations (SD) and the coefficient of variations (CV) are reported for both experimental conditions. . . 70
Chapter 1
Introduction
In recent years, interest has grown in the investigation of memory and mental imagery skills. The relationship between visuo-spatial cognition in general and other topics belonging to cognitive psychology like visual perception, working memory (WM), and executive/central processes is rather unclear (Denis et al., 2001). WM is a system devoted to the maintenance and sequential manipulation of incoming, task-relevant information involved in everyday tasks such as reasoning, learning, problem-solving, language comprehension, and motor planning (Baddeley, 1992; Baddeley et al., 1986). The brain structures underlying WM functionalities continue to develop during childhood till adolescence, and the maturity is only reached into young adulthood (Steenari et al., 2003). This system is involved in the generation of the mental images, "picture-like" representations that can be built up from multiple sensory inputs (e.g., tactile, visual, and auditory) (Dror and Kosslyn, 1994; Halpern and Zatorre, 1999). The role of vision in the construction of mental images is controversial. Recent studies on the haptic modality demonstrated that the generation of spatial representations is also possible in the absence of visual experience. However, congenitally blind people show limitations when asked to manipulate them actively (Vecchi et al., 2005; Wimmer et al., 2017). The studies in this context have been mostly carried out in the visual and haptic modalities. Due to the lack of proper technological solutions, audio-spatial memory abilities have not been deeply investigated yet. Nevertheless, audition is an important sensory modality, especially when vision is absent since birth. In such a clinical condition, hearing is fundamental to encode the distal environmental cues necessary to develop awareness, orientation, and mobility (Ungar et al., 1995).
In this introductory chapter, I will provide a brief summary of frameworks and definitions used to investigate the relationship between spatial cognition, mental imagery and WM. I will discuss the theoretical basis of these concepts and to which extent they are linked to
1.1 Spatial Cognition 2 each other. The theoretical topics here discussed support the hypothesis that spatial and imagery processes are strictly linked to WM activity. Finally, I will give an overview of the technologies to date available and their limitations for the study of spatial skills in visually impaired individuals.
1.1
Spatial Cognition
Spatial cognition has a key role in everyday life because spatial skills are directly related to the individual’s ability to move and navigate in the external world. When we move into the surrounding environment, we rely upon our motor functions to explore and understand the spatial properties of that environment. While moving, we automatically generate internal representations that are used to monitor and update the position of the body in space (Gilmore and Johnson, 1997; Wann et al., 1988). Regarding the relationship between motor functions and spatial representations, Milner and Goodale (Milner and Goodale, 2006) have assumed the existence of two different systems for the processing of visual and spatial information. A visuo-motor system that encodes and processes visual information for movement’s planning and an alternative structure for the manipulation of the spatial information necessary to generate spatial representations. This hypothesis takes its roots in the pioneering study of Mishkin and colleagues (Mishkin, 1982). They proposed the distinction between a "what" system for the manipulation of visual information, and a "where" system for locating objects in space.
Spatial information can be coded either egocentrically or allocentrically (Foreman and Gillett, 1997). The first refers to a representation of space centered on the observers’ body (e.g., the head or the hand). When instead the spatial representation is based on the mutual spatial relations among the items composing the surrounding environment regardless of their spatial relationship with the observer position, allocentric frames of reference come into play. Both frames of reference are closely linked to motor functions and spatial exploration skills such as grasping and reaching skills (egocentric) or in orienting and navigational abilities (allocentric).
Spatial cognition is especially involved in the ability to manipulate and maintain in memory spatialized items. In the following section, I will then describe the features of WM, focusing especially on the processing of spatial information and the role of development and visual experience.
1.2 Working Memory (WM) 3
1.2
Working Memory (WM)
WM refers to a framework of structures and processes involved in the temporary storage and manipulation of information retained in memory. This system is involved in complex cognitive skills, such as learning, reasoning, and motor planning. The majority of the cognitive tasks we accomplish every day (e.g., reading a newspaper article, comparing the different prices of a given product) usually require multiple steps with intermediate results. They must be kept in mind temporarily to perform successfully the task the individual is carrying out (Miyake, 1999). The WM construct was initially proposed by Baddeley (Baddeley et al., 1986; Baddeley and Hitch, 1974; Baddeley and Logie, 1999) and partly replaced the short-term memory construct. The WM, while maintaining the characteristics of the short-term memory (limited capacity and temporary maintenance of the information), represents a more complex system that allows the processing of information during the execution of cognitive tasks. Over the years, however, the concept of WM has undergone constant evolution, due to the numerous formulations and reformulations of the models (Baddeley, 2000; Baddeley et al., 1986; Cornoldi et al., 2000; Cornoldi and Vecchi, 2003; Engle et al., 1999; Miyake and Shah, 1999). Here, two of the most influencing and widely accepted models are presented:
1. Multi-Component model; 2. Continuum model;
1.2.1
Multi-Component model
This model was proposed for the first time by Baddeley and Hitch (Baddeley and Hitch, 1974). According to the original model (Baddeley et al., 1986), the WM system comprises a number of different subsystems, each processing different information (see Figure 1.1). The central executive component (CE) acts as an attentional control system and monitors two independent subsystems: the visuo-spatial sketchpad (VSSP) for the elaboration of spatial material and the phonological loop, mainly involved in the processing of verbal information (Baddeley, 1992; Baddeley et al., 1986). Two decades ago, a fourth component was added to the original model: the episodic buffer (Baddeley, 2000). This is a limited store of information that integrates phonological, visual and spatial material along with the information maintained in long-term memory. The phonological loop is further divided into a passive phonological store and an active articulatory-loop that refreshes the verbal material maintained in memory through a process known as rehearsal. Logie and Marchetti (Logie and Marchetti, 1991) suggested for
1.2 Working Memory (WM) 4
Figure 1.1 First Model proposed by Baddeley in 1986
the first time that the visual and spatial components of the VSSP are separated. In detail, the visual component (the visual cache) works as a passive storage of visual information. Conversely, the spatial component (the inner scribe) can be considered as a mechanism of active rehearsal that is the equivalent of the phonological-articulatory loop.
1.2.2
Continuum model
Baddeley (Baddeley et al., 1986) considers the subsystems composing the model as separate entities. However, the WM system and its components, rather than discrete entities, can be considered as distributed along a continuum (Conway et al., 2001; Cornoldi et al., 2000). Based on these evidences, Vecchi and Cornoldi developed a continuum model of WM (Cornoldi and Vecchi, 2004), which goes against the assumption of a single comprehensive system (Roncadin et al., 2007) or the multi-component model of Baddely (Baddeley et al., 1986) (see Figure 1.2). The authors proposed a cone-shaped model that develops along two dimensions: horizontal and vertical. The vertical size refers to the level of active control needed to accomplish a specific cognitive task, such as the level of attention. Distributed along the vertical continuum are the more automatic skills, in which the involvement of working memory is low, and the processes that involve the CE, which instead require higher active control. These processes are directly linked to the cognitive load needed to solve the task; the demand for cognitive sources indeed increases with the level of dynamic control required. The horizontal dimension is related to the type of material to be processed (e.g., verbal, visual, spatial), that is the nature of the perceptual input. Vecchi and co-workers argued that memory processes depend on the kind of information to be memorized and their horizontal distance on the continuum; the shorter the range, the stronger the interconnection between stimulus properties. At the basis of the cone-shaped model, the early processing of perceptual inputs is distinctly separated from each other. Although separated, visual
1.2 Working Memory (WM) 5 and spatial material show contiguity going up the vertical dimension of the cone-shaped model, whereas linguistic objects maintain their distinction from the other components. This structure is in line with the division of Baddeley’s model between two separate subsystems for the processing of phonological and visuo-spatial information (Baddeley et al., 1986). However, by focusing on visuo-spatial processing, both the multicomponent and the
cone-Figure 1.2 Continuum WM model
shaped model predict these components to be separated from each other at a lower processing level. At a cortical level, this aspect can be seen in the distinction between two neural pathways for the visual processing of object features and its spatial information: the ventral what paths and the dorsal where pathways (Goodale and Humphrey, 1998). The ventral pathway, from occipital to temporal cortex, is devoted to the processing of visual properties of the stimulus such as color, shape, and texture. The dorsal stream is activated by visuospatial information and goes from the occipital to the inferior parietal cortex (Mishkin, 1982). The same segregation between what and where is valid in the context of auditory perception, with some differences with respect to the visual modality. Firstly, in the visual system, information from one hemifield is sent to the contralateral hemisphere. On the contrary, in the auditory modality, both regions receive information from both ears (Romand and Varela-Nieto, 2014).
1.2 Working Memory (WM) 6 The visual cortex has a topographic organization, with adjacent neurons, responding to nearby stimuli in the retina (Kosslyn et al., 1993). Sound frequency is represented in a tonotopic map, and this representation is maintained across the whole auditory pathway, including the auditory cortex (Middlebrooks, 2002). Previous works on spatial WM pointed out that the dorsal visual pathway (prefrontal and post parietal cortices) is also involved in WM processing of both visual and auditory locations (Arnott et al., 2004; Curtis and D’Esposito, 2003; Martinkauppi et al., 2000). However, it is still an open debate about whether auditory and visual information are processed in separate brain networks or in a common neuronal network that integrates the two information.
1.2.3
The development of WM
During the course of life, the human brain changes. The primary motor and sensory areas are the first to mature. In contrast, the higher-order association areas (e.g., parietal and temporal areas), involved in advanced functions, reach maturity into adolescence and beyond it (Gogtay et al., 2006; Thompson et al., 2004). In parallel to neuroanatomical brain development, also behavioral and cognitive abilities develop during childhood into adolescence. Most of the WM functionalities indeed are ascribed to the prefrontal cortex that is one of the last brain areas to reach maturity. Infants (8 to 12 months old) can localize objects and remember their locations in the surrounding environment (Diamond, 1990). WM functions at that age are mostly ascribed to simple maintenance and retrieval of information. The WM structure is already in place by the age of 4 y.o. and the functionality of each component increases until early adolescence (Cowan and Alloway, 2009). The maturation of WM functionality can indeed be seen by the better performance in WM tasks with varying processing demands, from the age of 6 years-old into middle childhood (Byrnes, 2010; Gathercole et al., 2004). Several studies demonstrated that executive functions are at use, starting from the age of 8 years-old, but lack of functional integrity (Luciana, 2003). Until adolescence, indeed, even though older children exhibit superior performance in visual-spatial WM tasks compared to younger peers, the executive control on WM tasks is not as efficient as that of adults (Conklin et al., 2007); the first years of life mainly serve as tuning of perceptual and sensory-motor functions. Only later in development, complex processes associated with WM functions are integrated. A mature level of storage capacity is reached around the age of 11 y.o.; complex WM functions instead can be accomplished only after the age of 15 y.o. (Huizinga et al., 2006; Luna et al., 2004b). The age-related improvement in memory has to be also ascribed to the maturation of other cognitive abilities such as processing speed, attention, and storage
1.2 Working Memory (WM) 7 capacities (Cowan et al., 1992; Gathercole, 1999; Hulme and Tordoff, 1989).
The development of the phonological loop instead can be observed in the changes relative to the encoding of acoustic or semantic features of the words. Before the age of 8 years-old, the children recall the items in the surrounding environment by focusing on their physical features (e.g., shape, color, texture) (Henry, 2011; Kemps et al., 2000; Pickering, 2001). Thanks to the greater efficiency in the phonological loop, older children can complement visual information with phonological coding. Furthermore, before the 8th year of life, children tend to remember better words that are acoustically rather than semantically related to each other (Hasher and Clifton, 1974). In detail, the acoustic features of the words seem to be essential for the memorization process until the age of 8-9 years-old; afterward, the children better remember the words by considering what they refer to (e.g., the meaning or concept behind). Thus, the improvement in WM task performance has been associated with the development of the ability to re-code visually presented information into verbal form (Pickering, 2001). WM continues to develop from infancy into young adulthood, and the mature level of storage function is reached between 11-13 years of age while complex WM functions can be accomplished only after approximately the age of 15-19 years of age (Luna et al., 2004a).
1.2.4
Effect of blindness on WM abilities and mental imagery
One of the main functions ascribed to the WM system, especially the VSSP, is mental imagery (Cornoldi and Vecchi, 2003). This is a quasi-perceptual experience occurring in the absence of actual stimuli for the relevant perception (Finke and Freyd, 1989; Rinck and Denis, 2004). Mental imagery is directly involved in cognitive skills such as learning, memory (Yates, 1966), problem-solving, reasoning (Féry, 2003), and original and creative thoughts (LeBoutillier and Marks, 2003). The nature of these representations has been long discussed in the imagery debate. To date, the theory most accredited about the nature of the mental images is the one formulated by Kosslyn (Kosslyn, 1980). According to the author, the mental images are "picture-like" representations, as confirmed by paradigms such as mental rotation or mental scanning (Farah et al., 1988; Vingerhoets et al., 2002). In a mental rotation paradigm, the participants are asked to indicate whether two figures (where one is rotated relative to the other) are equal or different (Shepard and Metzler, 1971). Conversely, in a mental scanning task, the participants are asked to memorize spatial layouts and then to mentally scan the pathway from one location to another of the learned structure (Denis et al., 2001). Kosslyn’s initial theory assumed that imagery processes partially overlap with
1.2 Working Memory (WM) 8 perceptual mechanisms.
However imagery should not be identified with visual perception. Visual perception (or representation for just perceived items) is mediated by bottom-up mechanisms that start in the retina. Conversely, imagery is influenced by the activation of spatial subsystems and higher-order visual areas. At least at the functional level, both perception and imagery share the same structure that is the so-called "visual buffer," which corresponds to the early visual areas. Imagery would result from a top-down activation of the cortical regions that had processed the information during perception (regardless of the input modality). Thus, imagery is based on a memory retrieval process by the recalling of the information stored in memory. Visual mental images can, therefore, be seen not as simple copies of perceptual inputs but as the end product of a series of constructive processes (Pietrini et al., 2004). Although most of the available studies have been carried out on visual imagery, partially overlapping networks for perception and imagery have also been found for tactile, olfactory, motor, and auditory imagery (Jeannerod et al., 1995; Kobayashi et al., 2004; Kosslyn et al., 2001). Visuo-spatial mental images can originate from a variety of perceptual inputs (e.g., visual, haptic and verbal). The results of the studies on congenitally blind individuals have been, therefore, fundamental in the context of the imagery debate. Visually impaired and blind individuals can generate and manipulate mental images, mostly thanks to long-term memory information, haptic exploration, or verbal description (Carreiras and Codina, 1992; Kerr, 1983; Lederman and Klatzky, 1990). For instance, blind individuals better remember concrete rather than abstract words (Cornoldi et al., 1979). Also, the representation of colors can be present in case of early visual deprivation (Marmor, 1978); color representation in the blind may indeed be associated with abstract knowledge. Some authors suggested that the images created by congenitally blind people are visual, mostly thank to the activation of the visual buffer by non-visual inputs (Maltini et al., 2003). Visual features, such as dimension, shape, or texture, can indeed be perceived through touch and reproduced in the internal images. Even though the "vividness" of the images generated by the blind is still an open debate, it is clear that blind individuals can represent spatial information. Representations of the blind are similar to those generated by the sighted, as shown by the similar patterns of performance exhibited in different visuo-spatial tasks (Carreiras and Codina, 1992; Kerr, 1983; Klatzky and Lederman, 1995).
However, even though the lack of early visual experience does not affect the ability to generate mental images, blind individuals meet specific difficulties and limitations when asked to accomplish visuo-spatial tasks (Beni and Cornoldi, 1988; Cornoldi et al., 2000, 2009; Cornoldi and Vecchi, 2003, 2004; Vecchi et al., 2005). The processing of visuo-spatial
1.3 Spatial Processes, Visual Mental Imagery, WM 9 information is slower in case of early visual deprivation. Although visually impaired people can represent sensory information in a pictorial format, they need more time to operate on these representations. For instance, the blind show great difficulties in using perspective in mental representations (Arditi and Dacorogna, 1988) or in elaborating the third dimension when it comes to learning a haptic spatial layout (Vecchi, 1998). Many limitations are also encountered by non-sighted people when the task request is to update the mental image continuously or to evaluate distances and inclinations (Juurmaa and Lehtinen-Railo, 1994). However, given that blindness does not influence the ability to generate mental images does this sensory deprivation impact on the actual manipulation of such representations? To answer this question, Cornoldi and colleagues (Cornoldi et al., 2009) asked blind and sighted participants to firstly generate and then to update the mental representation of a haptic pathway. The authors found a significant difference between the groups only when the request was to recall the whole pathway. They addressed this result to the difference between passiveand active memory tasks. The first require only the maintenance of information in memory; the second instead require large sequences of mental manipulation. In other words, the authors concluded that, when the task only requires the maintenance in memory of spatial information, blind individuals perform as the sighted. Conversely, their performances drop when asked to manipulate this information actively.
To summarize, congenitally blind people can generate mental representations of objects or spatial layouts, and their spatial memory abilities are comparable to the ones of the sighted when the task demand is not high. However, due to the limitations imposed by early visual deprivation, they encounter difficulties when asked to process this information (e.g., in active memory tasks or when asked to manipulate several items at the same time). Only vision indeed allows the simultaneous processing of several items at the same time, while the simultaneous maintenance of several stimuli in memory is strongly affected by congenital blindness (Cornoldi and Vecchi, 2003).
1.3
Spatial Processes, Visual Mental Imagery, WM
As stated at the beginning of section 1, there are difficulties in using a common approach to study WM, spatial cognition, and mental imagery. The research on spatial cognition hypothesized a relationship between motor and spatial processes. Conversely, the research on imagery identified a link between perception and mental representations. According to Kosslyn (Kosslyn, 1980), the mental images are internal representations used in high-level perceptual processes such as planning and control of movements. An internal mental
1.4 Technological solutions for visually impaired people 10 representation is needed to orient ourselves in the surrounding environment, coordinate motor activities, visualizing objects and scenes, or when the information about the external world has to be stored in a map-like format (Thinus-Blanc and Gaunet, 1997). Thus the generation of these mental images requires the integration of different sources of information. Imagery is identified as a WM function because the generation, the maintenance, and the processing of these representations are functions ascribed to the VSSP and CE components of the system. Analogously, representations used for motor and orienting activity are an outcome of the VSSP (Cornoldi and Vecchi, 2003). Therefore, the spatial representations used for spatial cognition or for moving in the surrounding environment, are generated in the WM system, by the involvement of perceptual inputs or from the information stored in long-term memory (see section 1.3). In the experiments presented in this thesis, I will describe to which extent the stage of development and the lack of early visual deprivation impact audio-spatial memory abilities and the processing of the mental representations generated after the spatial exploration of acoustic layouts.
1.4
Technological solutions for visually impaired people
Early visual deprivation affects psychomotor and cognitive abilities (Warren, 1994). Congen-itally blindness strongly influences the typical development of important spatial and social skills (Cappagli et al., 2017b; Gori et al., 2013; Morrongiello et al., 1998), and usually, these impairments persist into adulthood. Thus, it is necessary to intervene in the first period of life to foster an increase in independence and quality of life in early visually impaired people.
1.4.1
Overview of the existing assistive devices
The design of novel technological solutions and their inclusion in clinical and eventually re-habilitative contexts is therefore essential to achieve these goals. The technologies developed in the last decades belong to the family of the substitution devices (SSDs). These apparatus convey visual signals through the other sensory modalities. However, there are very few products to date available on the market since many of them are still prototypes not usable by non-sighted individuals. Furthermore, the majority of these devices are very complex and, therefore, not usable by visually impaired individuals.
The SSDs nowadays available for blind individuals, mostly rely on the use of the sense of touch and audition. The latter is the most critical sense for orientation and mobility in the surrounding environment.
1.4 Technological solutions for visually impaired people 11 Conversely, touch is the best modality to explore non-audible items and to read through tactile maps (e.g., the Braille). SSDs devices usually replace the functions of a missing sensory modality with another one. For instance, they convert stimuli conveyed through a specific sensory modality (e.g., a visual stimulus) into a signal or another stimulus that can be accessible by another sensory modality (e.g., a sound or a haptic matrix). The majority of the SSDs to date available on the market include a sensor that permits the switch of a particular type of energy (e.g., light or sound) into an electrical signal. An example of an SSD is the cane. When the rod hits an object, the hand receptors are stimulated and give a clue on the location of the object (Bach-y Rita and Kercel, 2003). Assistive technologies that serve for orientation and mobility are mainly electronic travel aids (ETAs). They help blind people to create a representation of the surrounding environment by hearing or touch. Navigation on the web for non-sighted people instead is made possible mostly with voice synthesizers that read on the computer or braille keyboards. In SSDs based on visual-to-tactile conversion, the optical image is transduced by vibratory or direct electrical stimulation. Bach-y-Rita developed the very first substitution device based on tactile stimulation in the 1960s (Bach-y Rita et al., 1960). This device converts a visual image recorded by a camera into a tactile image with a vibrotactile device, which is a matrix of 40 sensors worn by the user on the back of the chest (Collins and Bach-y Rita, 1973). Bach-y-Rita adopted this device to be placed on the tongue to transmit the visual information to the brain (The Tongue Display Unit (TDU)). The tongue is indeed very sensitive to touch.
Since Bach-y-Rita developed the first version of the visual-to-tactile sensory substitution device, many vibrotactile systems have been designed, ever smaller, and more portable (Lay-Ekuakille and Mukhopadhyay, 2010). After intensive training with these systems, visually impaired people improved in localization tasks (Jansson, 1983) and reported perceiving images in external space, instead of on the skin, suggesting that a process of externalization occurs with the extensive use of these substitution systems. The tactile devices are usually placed on regions of the skin that are rarely used and do not interfere with other sensory modalities. In everyday life, these tactile SSDs, thanks to the recent technological develop-ments, are small energy-saving products. Nevertheless, these systems are costly. They need a sensitive region of the skin with a high density of mechanosensitive peripheral nerves to display complex information (i.e., the tongue). Nevertheless, the use of the sensor matrix on the tongue might cause irritation or even pain. Furthermore, this system is not comfortable and prevents the user from being able to speak.
Due to these limitations, many visual-to-auditory devices have been developed in these years. In this case, the mounted camera converts the visual frame into sounds sent through
1.4 Technological solutions for visually impaired people 12 headphones. Most of these technological solutions rely on the use of echolocation or image-to-sound conversion (Auvray and Myin, 2009). Devices based on echolocation calculate the time taken by an ultrasonic signal to reach an object and return. These systems can give accurate information about the distance and directions of objects in the surrounding environ-ment and might also be helpful for locomotion. One of the most famous devices belonging to this group is the SonicEye (Sohl-Dickstein et al., 2015). This system amplifies the echoes produced by ultrasonic sources to help the identification of objects in space. Another device that belongs to this group is the SonicGuide (Kay, 2000). This system translates ultrasound echoes onto audible sounds in both ears for navigating and scanning objects. In the case of image-to-sound conversion, the images recorded by the camera are transmitted to users via headphones. The pixels of the recorded video image is converted into audio frequencies. The upper locations in these images are converted into high-pitch sounds; conversely, the areas on the bottom to low-pitch sounds. The luminosity of the visual objects instead is strictly related to sound amplitude: bright white pixels corresponding to sounds presented at maximal volume and a dark pixel corresponding to silence. The first visual-to-auditory substitution device was the vOICe system designed by Meijer (Meijer, 1992). The vOICe scans and processes the image frames of the video recorded by the camera. This snapshot is scanned from left-to-right and converted into sound, played through headphones from left-to-right. The images are scanned at intervals of one second. The auditory equivalent is dynamic and spread out over time. After the vOICe, other solutions have been developed: the PSVA (Prosthesis for Substitution of Vision by Audition) developed by Capelle and his col-leagues (Capelle et al., 1998), the SmartSight developed by CronlyDillon and his colcol-leagues (Cronly-Dillon et al., 2000), and the Vibe developed by Hanneton and his colleagues (Auvray and Myin, 2009). The Vibe uses inter-aural disparity, and the PSVA uses a pixel-frequency relationship mapping. These visual-to-auditory devices are useful for object localization and help the accomplishment of spatial tasks (Auvray et al., 2007; Cronly-Dillon et al., 2000; Renier et al., 2005). Hearing is the right candidate as substituting sensory modality because the human auditory system can easily manage rapid changes in sound patterns.
Furthermore, the generation of auditory stimuli requires a small amount of energy, and the wearable devices only need simple instrumentation like headphones, webcam, and computers (Capelle et al., 1998). The use of the SDDs has been widely investigated. Their benefits have been proven at behavioral and cortical levels.
1.5 Aims of the thesis 13
1.4.2
Limitations of the solutions to date available
However, the SSDs present several limitations. Firstly, none of the devices shown above can convey the exact information usually carried by the visual system. It is indeed challenging to translate a high-resolution image into an equivalent audio or tactile signal. For instance, transmitting an image via the audio modality raises the problem of transforming rich spatial information into a time signal, which requires either some form of image scanning or complex code. The SSDs stress one sensory modality (e.g., hearing or touch), and after a long sensory stimulation, the user might not perceive the signals coming from the device due to habituation mechanisms. As already stated above, these devices require intense training sessions that can be very difficult to be accomplished for users both because of potentially excessive physical and cognitive load. The majority of the SSDs are prototypes and cannot be used in everyday life yet. Very few devices have been tested, and the ones employed in experimental settings involved a small sample size that usually do not include visually impaired individuals. Furthermore, these technologies are only thought for adults and cannot be easily used by children. The main reason why assistive devices created for adults are not feasible for children is that they are based on artificial operating principles that young users might find challenging to learn. Finally, the principal limitation of SSDs is that they aim at substituting the visual modality instead of considering the nature of the input sensory modality and the influence of sensory deprivation. In sum, most of the SSDs lack of adaptability to visually impaired people; technological development often tends to neglect the impact of sensory deprivation on perceptual and cognitive abilities fundamental to readout the information conveyed by the SSD.
1.5
Aims of the thesis
Spatial WM and imagery processes have been studied intensively and for a long time, in the visual and haptic domains during the lifespan and in case of early visual deprivation. Although blind people need to rely on the auditory modality to process surrounding spatial information, not much research has focused on the use of sounds to assess spatial WM in blindness. During my PhD, I studied audio-spatial memory abilities in sighted and blind individuals of all ages. The scientific aims of this thesis were:
1. To investigate audio-spatial memory abilities during the lifespan and the influence of WM development in the context of spatial audition;
1.5 Aims of the thesis 14 2. To study the effect of early visual deprivation on audio-spatial memory skills and on
the processing of spatial locations provided by real or simulated acoustic sources; The investigation of these issues sheds light on the relationship between vision and audition in the context of cognitive processes and spatial cognition during typical development and in the case of congenital blindness. The devices and the experimental paradigms developed in the context of this thesis, provide an appropriate tool for the evaluation of cognitive and spatial skills in congenitally blind and sighted individuals of all ages.
Chapter 2
Technological solutions developed for the
evaluation of audio-spatial memory
abilities
High-level cognitive abilities, in blind individuals, have been mostly assessed in the last decades in the haptic domain or with verbal non-spatialized stimuli. The majority of the technologies to date available for visually impaired people, as discussed in chapter 1, are assistive and cannot be used in clinical settings for the evaluation of spatial or cognitive abilities. They indeed just convey visual signals in other sensory domains, and they are too complex to be used by children. The three devices on which I worked on during my PhD aimed at studying audio-spatial memory skills in sighted and blind individuals of all ages through spatialized sounds. I worked on the software development of two audio-tactile devices named ARENA2D and Audiobrush (see Figures 2.1 and 2.11 respectively, sections 2.1 and 2.3) that allow the spatial emission of sounds through real speakers. Furthermore, I designed a system based on an acoustic VR (see section 2.2). During these three years, these solutions served as tools for the evaluation of audio-spatial memory abilities, but the final aim will be to use them in clinical settings for rehabilitative purposes.
2.1
ARENA 2D
ARENA2Dis a novel device that provides auditory feedback (Cappagli et al., 2017b; Setti et al., 2019). This novel technological solution allows the serial emission of spatialized sounds. The hardware was developed by the Electronic Design Laboratory (EDL) Unit
2.1 ARENA 2D 16 of the Italian Institute of Technology (IIT) in Genoa. Two conference proceedings have been published on ARENA2D (https://ieeexplore.ieee.org/abstract/document/8802160 and https://ieeexplore.ieee.org/abstract/document/8802172). ARENA2D is a vertical array of 25
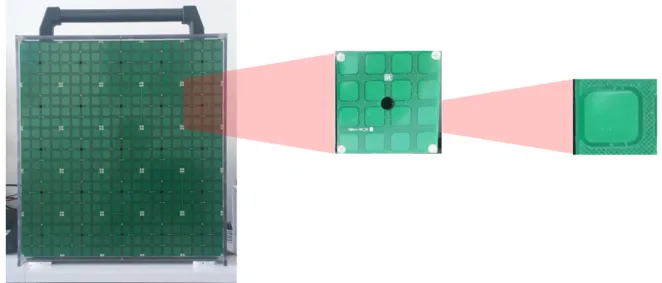
Figure 2.1 ARENA2D. ARENA2D is shown at a different level of detail. The panel on the left presents the device. ARENA2D is a vertical surface (50 x 50 cm), composed of 25 haptic blocks, each provided of a loudspeaker in the center, arranged in the form of a matrix. The middle panel shows a detail of a haptic block. The black hole is the speaker from which the sound is emitted. The blocks are covered by 16 (4x4 matrix) tactile sensors (2 x 2 cm) that register the positions of the touches. The green square on the right represents a detail of a tactile sensor)
haptic blocks arranged in the form of a matrix (50 x 50 x 10 cm). Each block (5 x 5 cm) is a 4 x 4 matrix of tactile sensors or pads (2 x 2 cm each) provided of a speaker in its center. One of the most important hallmarks of this device is its modularity. The blocks are connected in cascade through USB cables and can be released from each other up to a distance of 20 cm. Furthermore, all the blocks can be programmed independently (for instance, the user can set different sounds for each block). ARENA2D weighs 12 Kg.
2.1.1
Block Diagram
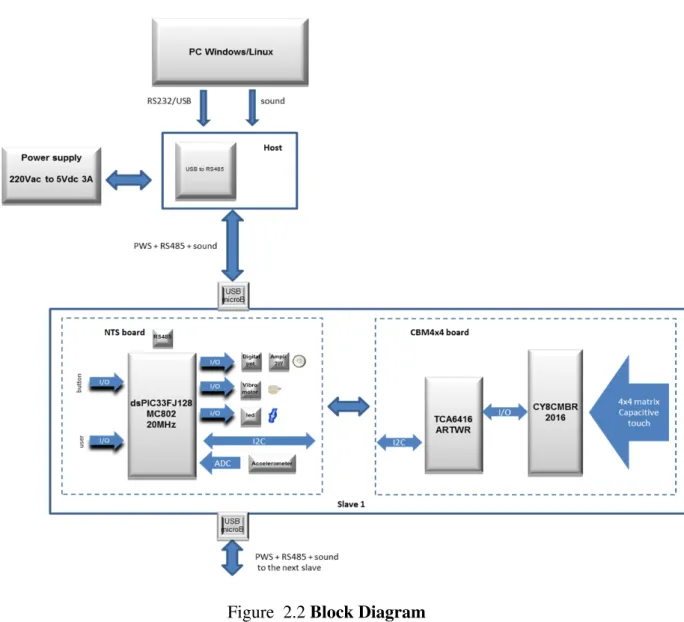
In Figure 2.2 it is represented the general schema of the system: all the blocks composing ARENA2Dare connected with wires through USB terminals. The connection with the PC is made possible by an interface, which is the Host, a serial network for data exchanging.
2.1 ARENA 2D 17
Figure 2.2 Block Diagram
2.1.2
Host Control
The Host units allow the PC and the ARENA2D to communicate with each other. The strings containing the commands are transferred by the PC via a virtual serial port and transferred to the chain of blocks through an RS485 interface. The interface ensures great reliability in terms of distance. Additionally, the USB port provides the necessary power for the unit.
2.1.3
Slave Unit
The blocks that compose ARENA2D consist of an NTS (New Tactile Sensor Unit) and CBM8x8 boards. The auditory signal, from the PC, reaches a class C amplifier (3 W). A potentiometer modifies the volume of the signal. The latter and the amplifier are controlled
2.1 ARENA 2D 18 by a DSPIC33FJ128MC802 microcontroller that draws up the strings received by the host. In detail, the microcontroller interprets the commands received by the Host.
2.1.4
Wiring and Power cables
The system uses an external power supply (see Figure 2.3). All the NTS boards are connected
Figure 2.3 Power and Data connections The panel on the left shows the power connection and the panel on the right the data connections.
to the host through the data cable and also the power cord. Furthermore, the Host board is linked to the power supply via USB connection and an audio source (e.g., the PC).
2.1.5
Operating protocol
2.1.6
Serial Interface
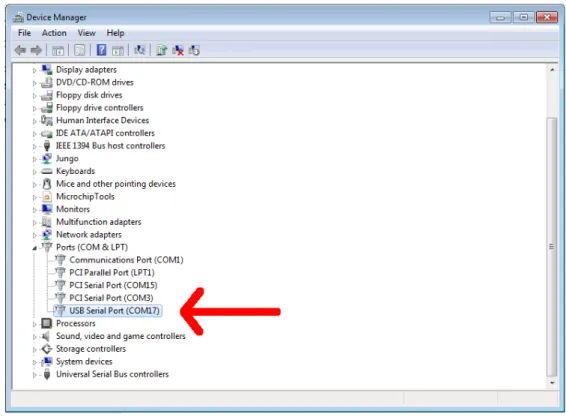
The transport of information between the NTS boards and the PC is entrusted to a standard serial communication protocol (RS485). Data reception by the PC is made possible with an RS485/USB adapter. Driver’s adapter uses a software emulation of a standard serial port (see Figure 2.4). In Windows, the serial port is found by using the windows "Device Manager," by looking at which serial port appears when the USB is connected to the PC.
2.1 ARENA 2D 19
Figure 2.4 Virtual serial communication.
2.1.7
Tactile Sensors
The pads (see Figure 2.1, right panel) are capacitive sensors and belong to the CY8CMBR2016 CapSense Express capacitive touch sensing controller. This device supports up to 16 ca-pacitive touch buttons that can be organized in any format, like a matrix array. Finally, the component costs are saved by the wide operation range (1.71 V to 5 V).
2.1.8
Communication Protocol
The communication is made possible by exchanging strings formatted as follows: 1. A starting byte (Start);
2. A byte that contains the NTS address to which the command is intended; 3. A byte that identifies the command;
4. Optionally, one or more bytes to identify the commands of the parameter; 5. An end byte;
2.2 The audio virtual reality system 20 The NTS boards complete the command after the receipt of the end byte. When one string has to be sent to all the boards, it is possible to use the broadcast address (0xFF recognized by all the boards). In this way, all the boards execute the string almost simultaneously. If the instructions to be sent are different, or the user does not want to command all the boards at the same time, a different communication protocol has to be employed. Several commands are therefore chained consecutively, and the ending byte will be sent just after the last command.
2.2
The audio virtual reality system
I spent three months at the Dyson School of Design Engineering at the Imperial College in London. There I designed a system based on an acoustic virtual reality (VR). This apparatus was developed to study audio-spatial memory abilities, using virtual auditory sources spatially displaced. Concerning ARENA2D, this system is cheaper and more portable and allows the displacement of sounds around the participant’s head. The system consists of a software and a hardware part (an Arduino based keyboard), both described in the following paragraphs.
2.2.1
3D-Tune In application
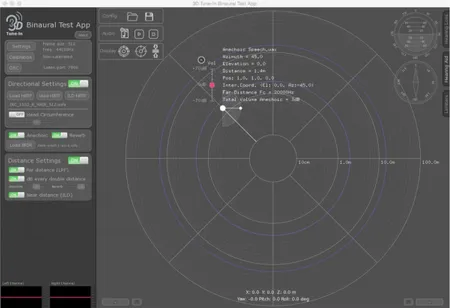
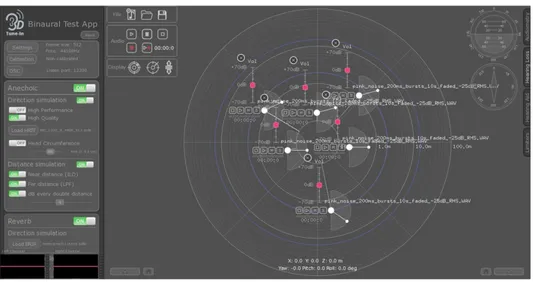
The 3D Tune-In Toolkit was developed by the Imperial College of London and the University of Malaga (Cuevas-Rodríguez et al., 2018, 2019; Levtov et al., 2016). This project aimed at the design of a Toolkit to develop games and applications for hearing loss and hearing aid technology. The acoustic VR simulation is based on binaural spatialization, a technique that allows the creation of three-dimensional soundscapes using a simple pair of headphones as a playback device. The generation of binaural signals is based on the convolution of a monaural signal with head-related transfer functions (HRTFs), which model the directional filtering of the incoming signal due to the characteristics of the listener’s body shape (i.e., torso, shoulders, head and pinna) (Algazi and Duda, 2010). In Figure 2.5, it is shown user’s interface of the application. The Toolkit implements HRTF-based binaural spatialization integrating advanced features such as:
• User-imported HRTF. For this test, the HRTF number IRC1032 from the IRCAM Listen database was used (Caulkins et al., 2003; Kearney and Doyle, 2015);
• Barycentric interpolation between different Head-Related Impulse Responses (HRIRs), to allow smooth and realistic source/head movements;
2.2 The audio virtual reality system 21 • Customisation of the Interaural Time Differences (ITD) according to the head
circum-ference of the listener;
• Advanced source distance simulation, including acoustic parallax and both near- and far-field correction filters;
• 3D reverberation based on a virtual-Ambisonic approach and Binaural Room Impulse Responses (BRIRs);
Figure 2.5 Binaural Test App. The picture, downloaded from the website of the project, represents the layout of the binaural test app. The app allows the spatialization of sound sources for binaural (headphones) listening. The app is also provided of some algorithms for simulating near-field and far-field auditory sources and reverberation in a 3D binaural context. Moreover, it allows the integration of hearing loss and hearing aid simulators. (http://www.3d-tune-in.eu/)
2.2.2
Communication protocol
Starting from the already developed 3D Tune-In Toolkit, we designed an application for blind individuals, by implementing the communication between Matlab (Matlab2017, The Mathworks) and the Toolkit. The 3D Tune-In Toolkit’s test application receives instructions with OSC messages (Wright, 2005), based on wireless (WLAN) communication. The latter is a protocol for data exchange among devices based on the UDP communication protocol, which uses the IP addresses and the port of the units in communication. The UDP communication was established in Matlab by creating an UDP object (udp() function). Using
2.2 The audio virtual reality system 22 the oscsend() Matlab function instead, it was possible to pilot the sounds when needed (e.g., start-stop individual sources, modify source positions according to head rotations, etc.), by using instructions compatible with the Toolkit.
2.2.3
Virtual Environment Design
Once the communication between Matlab and the Toolkit was established, we designed an acoustic virtual environment composed of virtual auditory sources. Our goal was to set a maximum number of sounds that could be easily perceived as coming from different locations. In other words, we wanted to deliver acoustic stimuli that could be easily distinguishable in terms of the location around the user’s head.
To this aim, we carried out pilot studies where participants were presented with sound configurations and were asked to localize the positions of the sounds around their head. Sound configurations differed depending on the number of stimuli and the head (see Figure 2.6). The stimulus used was pink noise (2.5 seconds lasting, -25dB RMS). The pink noise was used because human sound sources localization abilities are improved when the signal that has to be localized is broadband (versus narrow-band - the wider the spectrum, the better) and when it has a complex envelope (e.g., it is not continuous) (Grantham, 1995; Moore, 2012). The Toolkit allows simulating simple attenuation for every double distance. The attenuation value is configurable (set to 6dB by default). On each trial, the sounds were presented one by one. After each emission, the participant was asked to indicate the position of the stimulus on the target configuration printed on paper. Each configuration was presented on a different block of trials. Twenty-five participants in total took part in the study. The percentage of correct responses for each sound stimulus was taken as a measurement of the ability to localize sounds in each configuration. As shown in Figure 2.6, the greater number of correct responses was achieved in the configuration shown in panel D of the figure (6 sounds, arranged onto 2 circles). In Table 2.1, the features of the single sources in this configuration (azimuth, elevation, distance from the listener) are shown. In the toolkit, each source is represented with two white dots (which turn to pink when audio is playing). The larger dot is connected to the listener with a white line (see Figure 2.5). The angle between the connection line and the horizontal axis of the chart indicates the azimuth angle, from 0.0 to 359.9 degrees anti-clockwise. The smaller dot represents the elevation of the source. The angle between the line that connects the two white dots and the horizontal axis of the chart represents the relative elevation of the source. The elevation varies between 0 and 90 degrees anti-clockwise (top-right quadrant), and clockwise from 360 to 270 (bottom-right quadrant).
2.2 The audio virtual reality system 23
Figure 2.6 Results of the pilot tests. The filled circles represent the positions of the virtual sources. Participants listened to the sounds one by one, in random order, while looking at the configuration printed on a paper placed in front of them. In A C and D, the sounds were displaced on two circles: one closer to participants’ head (perceived at a higher volume), the other further (perceived at a lower volume). Circle’s colors represent the percentage of participants that correctly indicated the position of the sounds.
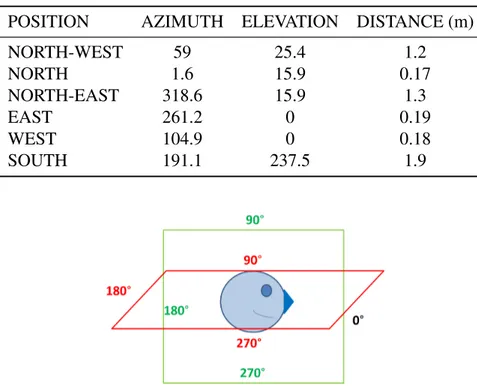
In the virtual environment, the sounds’ elevation varied on a semi-circle. In order to represent the virtual environment more intuitively for the reader, in figure 2.7, azimuth, and elevation are represented relative to the participant’s head. Thus the value in table 2.1 are related to this configuration. Some of the chosen sources have different elevations to improve localization of the sounds. Since The Head-Related transfer function (HRTF) is equal between the frontal and backward locations, we decided to position the sound in the southern location below the head to facilitate the discrimination between this sound source and the one in the north position.
2.2 The audio virtual reality system 24 Table 2.1 Sources in the virtual environment. In the table, the first column refers to the position of the sound for the head of the listener. The other three columns instead refer to the azimuth, the elevation of the sound and the distance of the sound from listeners’ head in the virtual environment. The value of the elevation of the sound positioned behind user’s head is equal to 327.5° in the virtual environment (according to the model used for the Toolkit). The value here presented corresponds to the model proposed in Figure 2.7
POSITION AZIMUTH ELEVATION DISTANCE (m) NORTH-WEST 59 25.4 1.2 NORTH 1.6 15.9 0.17 NORTH-EAST 318.6 15.9 1.3 EAST 261.2 0 0.19 WEST 104.9 0 0.18 SOUTH 191.1 237.5 1.9
Figure 2.7 Sound’s azimuth and elevation. The picture represents the radial variation of the azimuth (red square) and the elevation (green square) of the virtual sources. The 0° value is common to both azimuth and elevation and coincides with user’s nose. The sound positions in the azimuth and elevation vary from 0° to 359.9° anti-clockwise.
2.2 The audio virtual reality system 25
Figure 2.8 Sounds’ arrangement in the virtual environment .
2.2.4
Arduino-Based keyboard
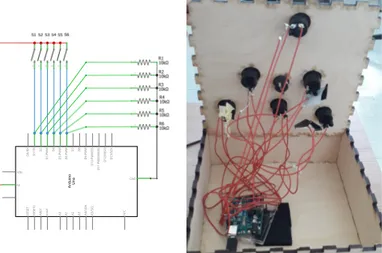
In order to register the responses in the experimental sessions, we designed an Arduino-based keyboard (see Figure 2.10). This system replicates the features of the virtual environment, to let the user know sounds’ dispositions through haptic exploration. The keyboard, designed in AutoCad, was built as a laser-cut wooden box of 30x30 cm with a set of buttons on the top surface, which also hosted the needed electronic components (see Figures 2.9 and 2.10). The keyboard is composed of 6 buttons that replicate the positions of the virtual sources (see Figure 2.8) and a bigger central blue, which serves as a reference point.
The keyboard was controlled by an Arduino Uno1, which logged the button presses by the user through a pull-down resistor configuration (see Figure 2.9a). The buttons were connected to the Arduino through tinned copper wires. The Arduino was connected to a computer via USB which allowed for serial communication and also powered the device. We used the Matlab support package for Arduino to allow communication between the readout and recording of participants’ response. This package enables the user to acquire analog and digital data from the board over a USB connection or wirelessly over Wi-Fi. The arduino() function was used to connect the Arduino hardware to Matlab, by giving the port and board names as input data in the function. Once the arduino object is created, the user can program the hardware and employ custom add-on libraries.
2.3 Audiobrush 26
(a) Keyboard circuit schematic (b) Keyboard circuit assembly
Figure 2.9 Keyboard circuit
(a) Top view (b) Side view
Figure 2.10 Assembled keyboard
2.3
Audiobrush
Audiobrush is a tablet (35 x 35 cm, see Figure 2.11) that allows serial and parallel emission of spatialized sounds.
The tablet is composed of 576 capacitive sensors. The auditory files have a fixed format: 8bit/sample, 22050 Hz, mono. The system is composed of six TAT1 and TAT2 boards (see Figure 2.12), managed locally by a Raspberry board (SO Linux) and through WiFi by a PC or a smartphone. The Raspberry looks for a WiFi network to connect with (named "AudioBrush"). The data are exchanged with the Raspberry at a fixed address. The TAT1 is composed of 96 tactile sensors (pads) and 12 speakers. It is connected to the TAT2
2.3 Audiobrush 27
Figure 2.11 Audiobrush
Figure 2.12 TAT boards. The panel on the left is the TAT1, while the panel on the right is the TAT2
that provided the power supply, the connection to RS485 port, and the auditory signal to be emitted. The TAT2 boards control the TAT1 boards but are also provided of voltage regulators for the whole device and RS232/RS485 converters.
2.3.1
Communication Protocol
The structure of the command strings is equal to the ARENA2D one. Every command transmitted by the Raspberry contains the address of the corresponding board. All the boards (TAT1, TAT2, and Raspberry) have their address. 0xFF is again the broadcast address. Before sending the reply, the boards wait for the end byte.