Open Access
Research article
Computational annotation of genes differentially expressed along
olive fruit development
Giulio Galla
1, Gianni Barcaccia
1, Angelo Ramina
1, Silvio Collani
1,
Fiammetta Alagna
2, Luciana Baldoni
2, Nicolò GM Cultrera
2,
Federico Martinelli
3, Luca Sebastiani
3and Pietro Tonutti*
3Address: 1Department of Environmental Agronomy and Crop Science, University of Padova, Viale dell'Università 16, 35020 Legnaro (Padova),
Italy, 2CNR - Istituto di Genetica Vegetale - Research Division of Perugia, Via Madonna Alta 130, 06128 Perugia, Italy and 3Scuola Superiore
Sant'Anna - Pisa, Piazza Martiri della Libertà 33, 56127 Pisa, Italy
Email: Giulio Galla - [email protected]; Gianni Barcaccia - [email protected]; Angelo Ramina - [email protected]; Silvio Collani - [email protected]; Fiammetta Alagna - [email protected]; Luciana Baldoni - [email protected]; Nicolò GM Cultrera - [email protected]; Federico Martinelli - [email protected]; Luca Sebastiani - [email protected]; Pietro Tonutti* - [email protected]
* Corresponding author
Abstract
Background: Olea europaea L. is a traditional tree crop of the Mediterranean basin with a
worldwide economical high impact. Differently from other fruit tree species, little is known about the physiological and molecular basis of the olive fruit development and a few sequences of genes and gene products are available for olive in public databases. This study deals with the identification of large sets of differentially expressed genes in developing olive fruits and the subsequent computational annotation by means of different software.
Results: mRNA from fruits of the cv. Leccino sampled at three different stages [i.e., initial fruit set
(stage 1), completed pit hardening (stage 2) and veraison (stage 3)] was used for the identification of differentially expressed genes putatively involved in main processes along fruit development. Four subtractive hybridization libraries were constructed: forward and reverse between stage 1 and 2 (libraries A and B), and 2 and 3 (libraries C and D). All sequenced clones (1,132 in total) were analyzed through BlastX against non-redundant NCBI databases and about 60% of them showed similarity to known proteins. A total of 89 out of 642 differentially expressed unique sequences was further investigated by Real-Time PCR, showing a validation of the SSH results as high as 69%. Library-specific cDNA repertories were annotated according to the three main vocabularies of the gene ontology (GO): cellular component, biological process and molecular function. BlastX analysis, GO terms mapping and annotation analysis were performed using the Blast2GO software, a research tool designed with the main purpose of enabling GO based data mining on sequence sets for which no GO annotation is yet available. Bioinformatic analysis pointed out a significantly different distribution of the annotated sequences for each GO category, when comparing the three fruit developmental stages. The olive fruit-specific transcriptome dataset was used to query all known KEGG (Kyoto Encyclopaedia of Genes and Genomes) metabolic pathways for characterizing and positioning retrieved EST records. The integration of the olive sequence datasets within the MapMan platform for microarray analysis allowed the identification of specific Published: 24 October 2009
BMC Plant Biology 2009, 9:128 doi:10.1186/1471-2229-9-128
Received: 30 March 2009 Accepted: 24 October 2009 This article is available from: http://www.biomedcentral.com/1471-2229/9/128
© 2009 Galla et al; licensee BioMed Central Ltd.
This is an Open Access article distributed under the terms of the Creative Commons Attribution License (http://creativecommons.org/licenses/by/2.0), which permits unrestricted use, distribution, and reproduction in any medium, provided the original work is properly cited.
biosynthetic pathways useful for the definition of key functional categories in time course analyses for gene groups.
Conclusion: The bioinformatic annotation of all gene sequences was useful to shed light on
metabolic pathways and transcriptional aspects related to carbohydrates, fatty acids, secondary metabolites, transcription factors and hormones as well as response to biotic and abiotic stresses throughout olive drupe development. These results represent a first step toward both functional genomics and systems biology research for understanding the gene functions and regulatory networks in olive fruit growth and ripening.
Background
Fruit development is the result of genetically programmed processes influenced by environmental factors. To iden-tify and characterize genes involved in these processes, different genomic approaches (ESTs, large-scale microar-rays, deep transcriptome profiling, etc.) have been used in several fruit species [1] and the body of information con-cerning transcriptional networks and regulatory circuits involved in important physiological and developmental processes increased tremendously during the last two dec-ades. In tomato, large-scale EST sequencing projects resulted in a better insight into molecular mechanisms of fruit ripening processes and in the identification of com-mon transcription factors not previously associated with ripening [2,3]. Generation of ESTs and consequent dis-covery of genes with potential roles in fruit development have also been reported in grape berry [4,5]. In apple, an extensive analysis has been made using all EST sequences available in public databases to identify genes temporally or spatially regulated during fruit growth and develop-ment [6]. Other extensive EST sequencing projects focus-ing on fruit development have been set up in peach [7], melon [8] and kiwifruit [9]. Sequence information derived from advanced EST sequencing is an essential resource for functional genomics studies based on the use of microarray technology and real-time PCR. Following the pioneering work of Aharoni and co-workers [10] on strawberry, several papers have now been published on the use of microarrays in different fruit species.
Olea europaea L. is an evergreen species, traditionally cul-tivated in the Mediterranean basin. The oil that results from mechanical extraction of the fruits is a predominant component of the worldwide known 'Mediterranean diet', to which increasing attention is being paid for its health benefits and cancer-protective properties [11]. These attributes are closely related to the oil composition and to the concentration of active bio-molecules resulting from the catabolic and anabolic processes taking place through-out olive fruit development which is a long process lasting several months. The oil content of olives can reach up to 30% (fresh weight) at full ripening [12]: it accumulates in the mesocarp and, at a lower extent, in the seed [13]. Oil accumulation in the pulp increases slowly, reaching the
plateau after veraison. A marked tryacylglycerol (TAG) accumulation in seed and pulp occurs after endocarp lig-nification, when about 40 mg of oil per fruit per week can be synthesized. The fatty acid profile of the oil accumulat-ing in the fruit is important in relation to its nutritional properties [11]. The main fatty acid is oleic acid (C18:1), which represents about 75% of total fatty acids, followed by linoleic (C18:2), palmitic (C16:0), stearic (C18:0) and linolenic (C18:3) acid. The pattern of fatty acid synthesis and desaturation varies during maturation and ripening, according to cultivars and to environmental conditions [14,15]. Other important metabolites accumulate throughout olive fruit development. They include polyphenols [16], carotenoids [17], chlorophylls [18], sterols and terpenoids [19] all directly or indirectly affect-ing olive oil quality and its technological and nutritional properties.
Information concerning genetic regulation of these meta-bolic processes in olive is still very limited. Only few genes involved in fatty acid metabolism have been characterized [13,20-24]. A monosaccharide transporter (OeMST2), whose expression increases during fruit maturation, when a massive accumulation of sugars occurs, has been recently cloned [25]. Moreover, the gene encoding a gera-nylgeranyl reductase (OeCHLP) has been isolated and its role in organ development and stress response in relation to tocopherol action hypothesized [26]. Information at molecular level about polyphenol and triterpenoid metabolism is lacking, as well as the mechanisms involved in olive fruit development and ripening. Among different strategies available for identifying differ-entially expressed genes, suppression subtractive hybridi-zation (SSH) libraries have been successfully used in fruit science to elucidate mechanisms regulating anthocyanin metabolism in grape berries [27], proanthocyanidin bio-synthesis in persimmon [28], processes involved in early growth and ethylene-induced ripening in banana [29,30], and in orange pigmentation [31].
This paper deals with the identification via SSH of large repertories of differentially expressed genes in developing olive fruits, and their computational annotation by means
of different bioinformatic software. The identification and characterization of gene regulatory networks and key met-abolic pathways during fruit growth and development represent a prerequisite for improving olive oil quality and its health-related properties.
Results
The study was based on the preparation of cDNA libraries using SSH that, likewise to the differential display (DD), represents an efficient strategy to isolate genes with an antagonist expression pattern. This technique enabled to identify transcripts of genes differentially expressed among the three different developmental stages of olive fruit corresponding to initial fruit set (30 DAF), com-pleted pit hardening (90 DAF) and veraison (130 DAF) (Figure 1).
As far as the composition of the four subtractive libraries is concerned, the number of differentially expressed
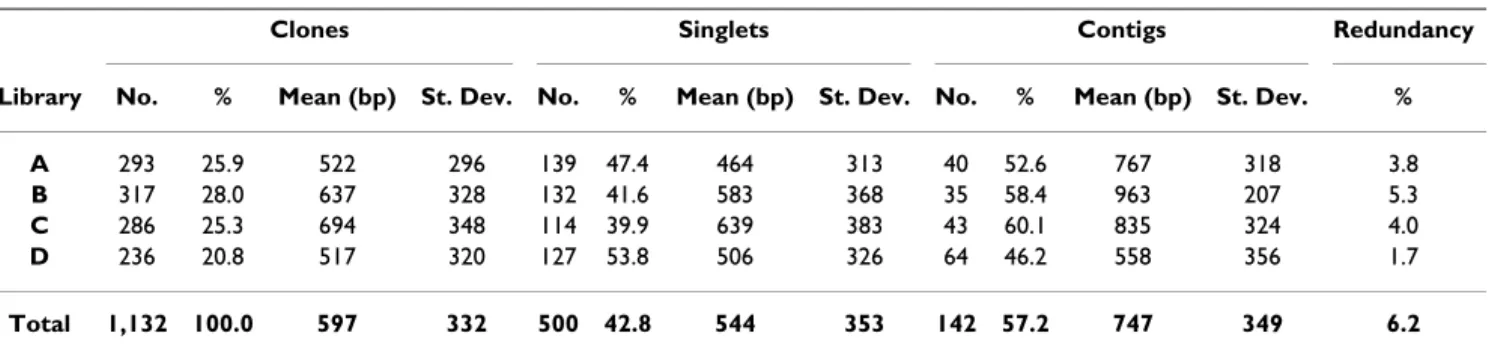
sequences randomly chosen varied from a minimum of 236 to a maximum of 317 per library, with a total number of clones equal to 1,132 (Table 1). The average length of the cDNA clones was 597 bp with a wide range of varia-tion, from 48 up to 1,283 bp. The redundancy within each single library was relatively low, ranging between 1.7% and 5.3%. Taking into account the whole set of sequences, the overall redundancy calculated among the four librar-ies was equal to 3.7%. The sequences of each single library were preliminarily analyzed using the CAP3 program in order to isolate the singlets and assemble contiguous and overlapping clones into contigs. This affected the compar-ative redundancy that increased up to 6.2%.
Querying with cDNA sequences the non-redundant NCBI databases allowed the attribution of a BLAST hit of 79%, 91%, 88% and 78% of the clones belonging to the A, B, C and D libraries, respectively (Table 2). The average sequence similarity was around 76%, ranging from 72% to 80%, and the median E-value for each single library ranged from 1e-47 to 1e-77.
Around 75% of the BLAST hits of the olive fruit cDNA sequences were homologous to coding sequences present in the rice, Arabidopsis and grapevine genomes, with more than 1,000 hits per species. It is worthy to note that until now (June 2009) only 47 BLAST hits for olive could be recorded (Figure 2).
The computational analysis of the whole EST collection using the software Blast2GO allowed the annotation of the expressed sequences according to the terms of the three main Gene Ontology vocabularies, i.e. cellular com-partment, molecular function and biological process (Fig-ure 3). As far as cellular compartments are concerned, the most represented are plastids and mitochondria, with more than 50% of the total annotations, followed by cytosol, plasma membrane, endoplasmic reticulum and nucleoplasm, whereas other cellular compartments were represented at a much lower scale (Figure 3A). Concern-ing the molecular function, the most represented catego-ries were those of nucleotide binding proteins, followed by proteins with transport, kinase and enzymatic activi-ties. The other molecular functions were represented at a lower extent (Figure 3B). More than 30 categories were found for the biological process vocabulary, being carbo-hydrate metabolism, response to biotic and environmen-tal stresses, generation of precursors, metabolites and energy, and catabolic processes the most represented (Fig-ure 3C). Although numerically less represented, it is worth to mention the presence of terms related to the secondary metabolites, metabolism of lipids, synthesis of amino acids and derivatives, metabolites and their precursors, and protein modification process.
Olive fruit growth and developmental stages considered for SSH library construction
Figure 1
Olive fruit growth and developmental stages consid-ered for SSH library construction. (A) Olive fruit (cv
Leccino) growth curve expressed as fresh weight (g) accumu-lation. Pericarp was sampled at initial fruit set (stage 1, 30 days after flowering, DAF), end of pit hardening (stage 2, 90 DAF), and veraison (stage 3, 130 DAF). (B) Suppression sub-tractive hybridization (SSH) libraries were constructed by comparing samples collected at stages 1 and 2 (libraries A and B), and at stages 2 and 3 (libraries C and D). For the two forward libraries A and C, cDNA from samples collected at stages 1 and 2, respectively, were used as tester and cDNA from stages 2 and 3, respectively, were used as drivers, vice versa for the reverse subtractive libraries B and D.
Focusing on the GO annotation of each single subtractive library, a number of olive fruit stage-specific GO terms were identified (Figure 4). Among the 296 and 464 GO terms found in the A and B libraries, 75 and 101 were associated to down- and up-regulated genes, respectively. The most significant GO terms were encoding elements of hormone biosynthesis and signal transduction mediated by ethylene, jasmonic acid, salicylic acid, and abscisic acid, as well as biosynthesis of secondary metabolites, such as terpenoids. In the C and D libraries, a total of 375 and 549 GO terms were recovered, 78 and 183 of which were related to down- and up-regulated genes, respec-tively. Among these, there are GO terms associated to environmental stress responses, catabolism of secondary metabolites (as terpenes, limonene and carotene), response to hormones (gibberellins and cytokinins), and auxin signal transduction.
The analysis of GO terms shared by pair-wise library com-binations allows to determine which genes are continu-ously or transiently down- or up-regulated during the studied process. This analysis retrieved only 7 terms for the down-regulated genes, whereas as many as 69 were those collected among the up-regulated ones. On the con-trary, comparable numbers (21 vs. 25) of GO terms asso-ciated to transiently up- and down-regulated genes among the three fruit developmental stages were found (Figure 5).
Quantitative Real-Time PCR experiments were carried out to corroborate the expression patterns of a subset of
sequences (i.e. 89 out of 642 unisequences, equal to 14%), corresponding to 61 different genes. Expression patterns related to the selected gene sequences and esti-mated in pair-wise comparisons between the three differ-ent fruit stages are reported in Figure 6. The Real-Time PCR analyses validated the results from SSH experiments for 42 out of 61 genes (about 69%). The validated genes were grouped according to different expression patterns (Additional file 1).
The Kyoto Encyclopaedia of Genes and Genomes (KEGG) was queried for sequences encoding enzymes and the deduced gene products were associated to specific meta-bolic and/or biosynthetic pathways related to carbohy-drates, fatty acid and secondary metabolism. The most represented KEGG maps associated with carbohydrate and fatty acid biosynthesis and metabolism were organ-ized in a simple network analysis representative of major communication ways among retrieved metabolic path-ways (Additional files 3 and 4). As expected, several genes encoding enzymes related to carbohydrate and fatty acid compounds were transcriptionally up- or down-regulated during olive fruit development. Several components of the carbon fixation in photosynthetic organisms (Map:00710), and starch and sucrose metabolism (Map:00500) were modulated in their expression in the early stages of fruit development (30-90 DAF). KEGG maps analysis pointed out an intense up-regulation of the majority of enzymes related to the pentose phosphate pathway (Map:00030), glycolysis and gluconeogenesis (Map:00010) along with starch and sucrose metabolism Table 1: Library characteristics defined by clone abundance and size, proportion of singlets and contigs and related redundancy.
Clones Singlets Contigs Redundancy
Library No. % Mean (bp) St. Dev. No. % Mean (bp) St. Dev. No. % Mean (bp) St. Dev. %
A 293 25.9 522 296 139 47.4 464 313 40 52.6 767 318 3.8
B 317 28.0 637 328 132 41.6 583 368 35 58.4 963 207 5.3
C 286 25.3 694 348 114 39.9 639 383 43 60.1 835 324 4.0
D 236 20.8 517 320 127 53.8 506 326 64 46.2 558 356 1.7
Total 1,132 100.0 597 332 500 42.8 544 353 142 57.2 747 349 6.2
Table 2: Number of hits, similarity estimates and E-values resulting from BLAST analysis of EST clones against non-redundant NCBI databases.
Similarity E-value
Library BLAST hits (%) Mean St.Dev. Min-Max Median
A 79 72 16 41 - 99 1e-47
B 91 80 15 37 - 100 1e-71
C 88 73 15 45 - 100 1e-77
D 78 80 15 45 - 100 9e-58 The max E-value was equal to 1e--6 corresponding to the cut-off adopted for GO annotation.
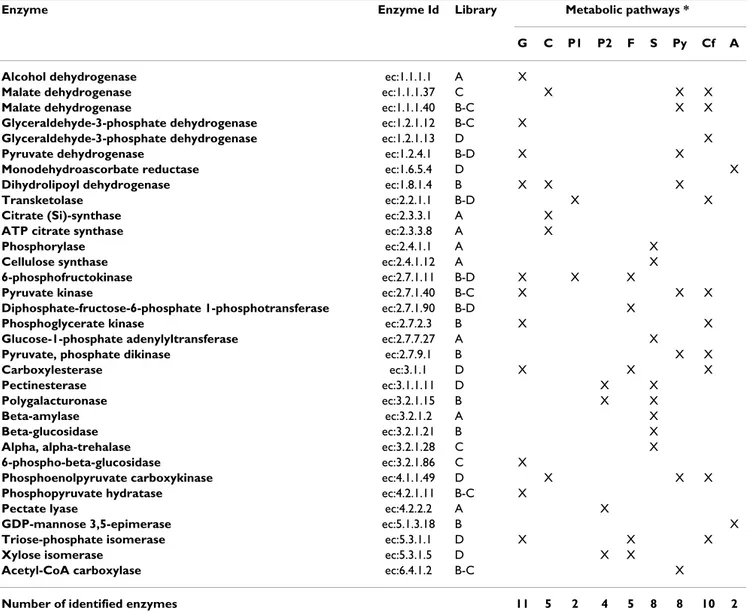
(Map:00500) (Additional file 3). Table 3 reports the enzymes involved in starch and sucrose metabolism, gly-colysis and gluconeogenesis. Transcripts of enzymes involved in the synthesis of pyruvate from β-D-fructose-6-P, such as 6-phosphofructokinase (ec:2.7.1.11), glyceral-dehyde-3-phosphate dehydrogenase (ec:1.2.1.12), phos-phoglycerate kinase (e.c:2.7.2.3), phosphopyruvate hydratase (e.c:4.2.1.11) and pyruvate kinase (ec:2.7.1.40) were up-regulated from 30 to 90 DAF and down-regulated from 90 DAF to 130 DAF (Table 3).
Consistent with the accumulation of oil in the drupe that starts around pit hardening and reaches the highest rate well before ripening begins, several transcripts encoding enzymes leading to fatty acid biosynthesis (Map:00061) from glycolysis (Map:00010), through the pyruvate metabolism (Map:00620) and citrate cycle (Map:00020) were up-regulated (Additional file 4). It is worthy to men-tion that several enzymes were found to be up-regulated from 30 to 90 DAF, when the lipid accumulation shows
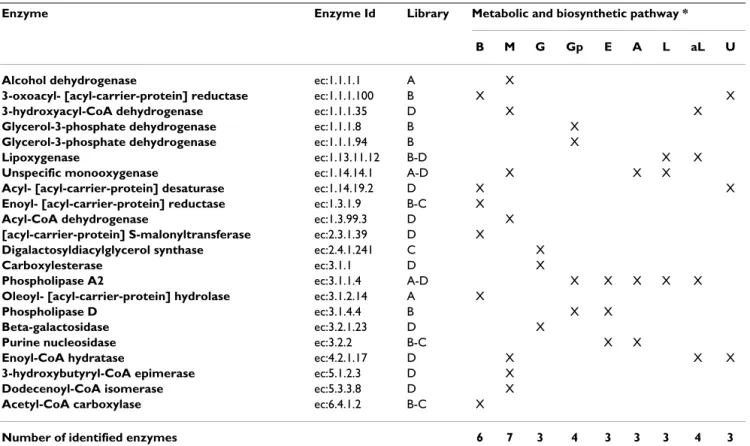
an increasing rate. A similar dynamics in terms of specific transcript accumulation was recorded for several compo-nents of the FA biosynthesis as acetyl-CoA carboxylase (ec:6.4.1.2) and enoyl- [acyl-carrier-protein] reductase (ec:1.3.1.9), actively involved in the synthesis of malonyl-CoA and FA chain elongation, respectively (Table 4). Moreover, enzymes controlling FA chain elongation were up-regulated throughout fruit development, whereas the synthesis of short chain FAs was impaired during early development. The malonylCoA-ACP transacylase (ec:2.3.1.39), the enzyme involved in one of the early steps of FA biosynthesis, and the acyl- [acyl-carrier-pro-tein] desaturase (ec:1.14.19.2), related to the synthesis of hexadecenoyl- [acp] and octadecenoyl- [acp], the precur-sors of palmitic and oleic acid, respectively, were up-regu-lated at veraison as well as a number of genes involved in the FA metabolism (Table 4).
KEGG maps were also produced for secondary metabolic pathways. Considering the flavonoids as an example, the BLAST hits as retrieved from NCBI databases
Figure 2
BLAST hits as retrieved from NCBI databases. Number of BLAST hits retrieved from NCBI databases and their
distri-bution among different plant species and different organisms. It is worthy to note that the majority of BLAST hits were recorded for rice, Arabidopsis and grapevine, while only 47 were the entries identified for olive.
isoforms of four different enzymes (i.e. dihydrokaemp-ferol 4-reductase, flavanone 3-dioxygenase, naringenin-chalcone synthase, and leucocyanidin oxygenase) control-ling flavone and flavonol as well as anthocyanin biosyn-thesis were mapped (Figure 7). Transcripts encoding these
enzymes were more abundant during the transition from 90 to 130 DAF, thus suggesting an increased accumula-tion of the related metabolites during late fruit develop-ment. A transient down-regulation of the dihydrokaempferol 4-reductase gene (ec:1.1.1.219) was GO terms distribution
Figure 3
GO terms distribution. GO terms distribution in the cellular components (A), molecular functions (B), and biological
proc-esses (C) vocabularies. In (A) plastids and mitochondria were the most represented cellular compartments. In (B) the most represented categories were nucleotide binding proteins, followed by proteins with transport, kinase and enzymatic activities. In (C) more than 30 categories were found, being carbohydrate metabolism, response to biotic and environmental stresses, generation of precursors, metabolites and energy, and catabolic processes the most represented.
recorded at 90 DAF (Additional file 5). Two isoforms of a peroxidase specifically involved in four different steps of the phenylpropanoid biosynthesis as well as few enzymes involved in alkaloid biosynthesis (Map:00950; Map:00960), limonene and pinene degradation (Map:00903) and caffeine metabolism (Map:00232) were also identified (Additional file 5).
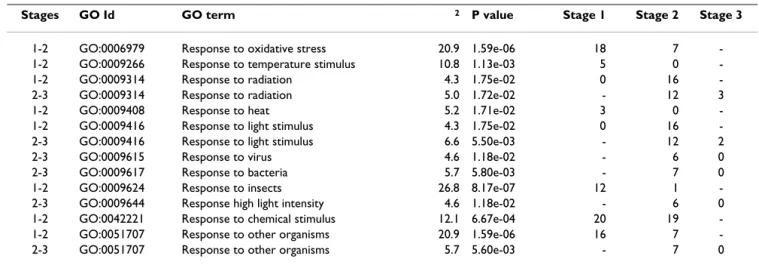
The analysis of the olive EST dataset with the MapMan software enabled to reconstruct overview metabolism maps (Additional file 6) and to group sequences in the main regulatory networks (Figure 8). As far as the in silico expression analysis of all olive EST clones linked to the Arabidopsis genechip sequences (Affymetrix), most genes proved to be associated to constantly and transiently reg-ulated genes during fruit development involved in cell wall synthesis and breakdown, fatty acid biosynthesis and lipid breakdown, starch and sucrose metabolism, glycoly-sis, and secondary metabolism (i.e., terpenoids and flavo-noids). Gene products involved in amino acid biosynthesis and metabolism were also identified (Addi-tional file 6). Furthermore, several genes encoding tran-scription factors were mainly down-regulated throughout fruit development, while some others were related to pro-tein modification and degradation (Figure 8). Genes related to hormone biosynthesis and action appeared to be differently regulated according to the type of hormone. A down-regulation of genes involved in auxin biosynthe-sis and metabolism, as an oxido/reductase and an IAA-amino acid synthase, occurred between 30 and 90 DAF, while during late development the expression of auxin responsive factors such as ARF1 and ARF7, were up- and down-regulated, respectively. By contrast, the synthesis of abscisic acid (ABA) was clearly stimulated throughout development, since two key enzymes encoded by ABA2 (ABA DEFICIENT 2) and AAO3 (ABSCISIC ALDEHYDE OXIDASE 3), were up-regulated at completed pit-harden-ing and veraison, respectively. In addition, a down-regula-tion of a gene encoding a GA-regulated protein occurred between completed pit hardening and veraison. During the same developmental phase, an up-regulation of the ARR1, a protein involved in the citokinin response, as well as a down-regulation of an UGT2, encoding a UDP-gluco-syl transferase, actively involved in the metabolism of the hormone, were observed. Genes involved in jasmonic acid (JA) metabolism were up-regulated throughout fruit development. A transcriptional up-regulation of an ethyl-ene receptor of the ERS type as well as a down-regulation of genes involved in brassinosteroid (BR) biosynthesis and action were observed during early development. Taking into account genes related to biotic and abiotic stress responses, dual multiple contingency tests were per-formed to identify GO terms associated to sequences sig-nificantly and antagonistically distributed between libraries. The results of this analysis evidenced the abun-dance of sequences related to light stimulus (GO:0009416) and radiation (GO:0009314), as well as to biotic and abiotic stresses (Table 5). Sequences related to light stimulus and radiation resulted to be up-regulated from 30 to 60 DAF, while those associated with response to oxidative stresses were down-regulated during the same developmental period.
Venn diagrams Figure 4
Venn diagrams. Diagrams showing numbers of GO terms
specific of libraries A, B, C and D. Among the 296 and 464 GO terms found in the A and B libraries, 75 and 101 were associated to down- and up-regulated genes, respectively. In the C and D libraries, a total of 375 and 549 GO terms were recovered, 78 and 183 of which were related to down- and up-regulated genes, respectively.
Venn diagrams Figure 5
Venn diagrams. Diagrams showing numbers of GO terms
retrieved for genes constantly or transiently down- and up-regulated throughout the three fruit developmental stages. Only 7 terms were found for the down-regulated genes, whereas as many as 69 were collected among the up-regu-lated ones. On the contrary, 21 and 25 terms associated to transiently up- and down-regulated genes, respectively, were found.
Clustering of gene sequences performed according to the Real-Time PCR expression values Figure 6
Clustering of gene sequences performed according to the Real-Time PCR expression values. Pair-wise analysis of
expression patterns related to the selected 89 gene sequences was performed by Cluster software comparing the three differ-ent fruit stages (2 versus 1 and 3 versus 2). Differdiffer-ent tonalities of green and red represdiffer-ent down- and up-regulation levels, respectively. Enzyme names corresponding to enzyme codes are listed in the supplementary materials (Additional file 2).
Discussion
Olea europaea L. is a common tree species of the Mediter-ranean basin that plays a peculiar role in the landscape characterization and represents a major agricultural com-modity as source of olive oil. Olives are not only a signif-icant food source, but also contribute to human health and are becoming popular in health-conscious diets far beyond the Mediterranean area of olive oil traditional use. Taking into account the increasing worldwide commercial interest of olive oil and the lack of information on its genomic features, a functional genomic approach, able to gain insights into the genetic and molecular aspects con-trolling fruit development and ripening, may be consid-ered of primary interest.
A number of physiological and biochemical data is avail-able on growth, development and ripening of the olive drupe but, unlike other fruit species such as peach, apple and grape, information on olive gene sequences and gene products is very limited in the main public gene data-bases. This study was carried out on cv. Leccino, one of the most widespread Italian varieties, characterized by a rela-tively short fruit developmental cycle, and a high degree of synchronization of processes defining ripening.
The SSH approach allowed the identification of 1,132 dif-ferentially expressed gene sequences in three selected developmental stages of the olive fruit, named initial fruit set (30 DAF), completed pit hardening (90 DAF) and Table 3: List of enzymes involved in carbon fixation, starch and sucrose metabolism, glycolysis and gluconeogenesis along with the library of origin of the correspondent EST clones.
Enzyme Enzyme Id Library Metabolic pathways *
G C P1 P2 F S Py Cf A
Alcohol dehydrogenase ec:1.1.1.1 A X
Malate dehydrogenase ec:1.1.1.37 C X X X
Malate dehydrogenase ec:1.1.1.40 B-C X X
Glyceraldehyde-3-phosphate dehydrogenase ec:1.2.1.12 B-C X
Glyceraldehyde-3-phosphate dehydrogenase ec:1.2.1.13 D X
Pyruvate dehydrogenase ec:1.2.4.1 B-D X X
Monodehydroascorbate reductase ec:1.6.5.4 D X
Dihydrolipoyl dehydrogenase ec:1.8.1.4 B X X X
Transketolase ec:2.2.1.1 B-D X X
Citrate (Si)-synthase ec:2.3.3.1 A X
ATP citrate synthase ec:2.3.3.8 A X
Phosphorylase ec:2.4.1.1 A X
Cellulose synthase ec:2.4.1.12 A X
6-phosphofructokinase ec:2.7.1.11 B-D X X X
Pyruvate kinase ec:2.7.1.40 B-C X X X
Diphosphate-fructose-6-phosphate 1-phosphotransferase ec:2.7.1.90 B-D X
Phosphoglycerate kinase ec:2.7.2.3 B X X
Glucose-1-phosphate adenylyltransferase ec:2.7.7.27 A X
Pyruvate, phosphate dikinase ec:2.7.9.1 B X X
Carboxylesterase ec:3.1.1 D X X X
Pectinesterase ec:3.1.1.11 D X X
Polygalacturonase ec:3.2.1.15 B X X
Beta-amylase ec:3.2.1.2 A X
Beta-glucosidase ec:3.2.1.21 B X
Alpha, alpha-trehalase ec:3.2.1.28 C X
6-phospho-beta-glucosidase ec:3.2.1.86 C X
Phosphoenolpyruvate carboxykinase ec:4.1.1.49 D X X X
Phosphopyruvate hydratase ec:4.2.1.11 B-C X
Pectate lyase ec:4.2.2.2 A X
GDP-mannose 3,5-epimerase ec:5.1.3.18 B X
Triose-phosphate isomerase ec:5.3.1.1 D X X X
Xylose isomerase ec:5.3.1.5 D X X
Acetyl-CoA carboxylase ec:6.4.1.2 B-C X
Number of identified enzymes 11 5 2 4 5 8 8 10 2
* G: Glycolysis and gluconeogenesis; C: Citrate cycle (TCA cycle); P1: Pentose phosphate pathway; P2: Pentose and glucuronate interconversions; F: Fructose and mannose metabolism; S: Starch and sucrose metabolism; Py: Pyruvate metabolism; Cf: Carbon fixation; A: Ascorbate and aldarate metabolism
veraison (130 DAF). All the sequences were deposited in the NCBI databases on August 28, 2008 [GenBank: FL683310-FL684411, ESTdb: 60119979-60121080]. This contribution represented a major implementation of the public olive EST repertories that currently include a total number of 3,859 sequences (last verified on July 27, 2009).
The SSH technique confirmed its suitability for transcrip-tome studies and for identifying genes differentially expressed along fruit development in olive. In fact, of the 1,132 differentially expressed sequences as many as 642 demonstrated to be unique sequences. Among these, 89 (14%) corresponding to 61 different key genes, further investigated by quantitative Real-Time PCR, pointed out a validation of SSH findings as high as 69%
Olive fruits showed significant differences for the distribu-tion of GO terms among ontological vocabularies and cat-egories in relation to the developmental stages. GO terms involved in carbohydrate, fatty acid and flavonoid metab-olism were analyzed by setting up KEGG maps. As far as carbohydrates are concerned, genes involved in
carbohy-drate metabolism were modulated in their expression and, in particular, the expression pattern of genes related to starch metabolism was coherent with a temporary role of starch as storage compound during fruit early develop-ment. Sequences of enzymes involved within the pentose phosphate pathway, glycolysis and gluconeogenesis, along with starch and sucrose metabolism, were up-regu-lated. The up-regulation of genes encoding enzymes involved in the synthesis of pyruvate from different sub-strates occurring during early development, may indicate that the fruit at this stage is highly energy demanding. There are two sources of assimilates for fruit growth in olive. The major source is certainly the sugars translocated in the phloem from leaves or sites of storage, comprising mannitol, raffinose, stachyose, and sucrose [32]. The sec-ondary source is sugars formed by photosynthesis in developing fruits themselves that remain green for a con-siderable period and retain active chlorophyll even when they change colour as approaching maturity. While chlo-rophyll is mostly in the exocarp, the mesocarp has been shown to contain significant amounts of phosphoenol pyruvate [12], the CO2 fixation enzyme of the CAM and C4 photosynthetic pathway.
Table 4: List of enzymes involved in fatty acid biosynthesis and metabolism along with the library of origin of the correspondent EST clones.
Enzyme Enzyme Id Library Metabolic and biosynthetic pathway *
B M G Gp E A L aL U
Alcohol dehydrogenase ec:1.1.1.1 A X
3-oxoacyl- [acyl-carrier-protein] reductase ec:1.1.1.100 B X X
3-hydroxyacyl-CoA dehydrogenase ec:1.1.1.35 D X X
Glycerol-3-phosphate dehydrogenase ec:1.1.1.8 B X
Glycerol-3-phosphate dehydrogenase ec:1.1.1.94 B X
Lipoxygenase ec:1.13.11.12 B-D X X
Unspecific monooxygenase ec:1.14.14.1 A-D X X X
Acyl- [acyl-carrier-protein] desaturase ec:1.14.19.2 D X X
Enoyl- [acyl-carrier-protein] reductase ec:1.3.1.9 B-C X
Acyl-CoA dehydrogenase ec:1.3.99.3 D X
[acyl-carrier-protein] S-malonyltransferase ec:2.3.1.39 D X
Digalactosyldiacylglycerol synthase ec:2.4.1.241 C X
Carboxylesterase ec:3.1.1 D X
Phospholipase A2 ec:3.1.1.4 A-D X X X X X
Oleoyl- [acyl-carrier-protein] hydrolase ec:3.1.2.14 A X
Phospholipase D ec:3.1.4.4 B X X
Beta-galactosidase ec:3.2.1.23 D X
Purine nucleosidase ec:3.2.2 B-C X X
Enoyl-CoA hydratase ec:4.2.1.17 D X X X
3-hydroxybutyryl-CoA epimerase ec:5.1.2.3 D X
Dodecenoyl-CoA isomerase ec:5.3.3.8 D X
Acetyl-CoA carboxylase ec:6.4.1.2 B-C X
Number of identified enzymes 6 7 3 4 3 3 3 4 3
* B: Fatty acid biosynthesis; M: Fatty acid metabolism; G: Glycerolipid metabolism; Gp: Glycerophospholipid metabolism; E: Ether lipid metabolism; A: Arachidonic acid metabolism; L: Linoleic acid metabolism; aL: Alpha-Linolenic acid metabolism; U: Biosynthesis of unsaturated fatty acids.
Genes related to fatty acid (FA) biosynthesis appeared to be up-regulated throughout development although tran-scripts of specific enzymes accumulate at different extent depending on the developmental stage. Enzymes control-ling FA chain elongation were up-regulated throughout fruit development: the synthesis of short chain FAs was impaired during early development whereas the synthesis of the precursors of palmitoleic and oleic acids was up-regulated during late development. This finding is consist-ent with the oil accumulation pattern in olive mesocarp, that starts around 40-60 DAF and reaches at ripening the highest amount, confirming what previously observed [20,21]. A number of genes involved in the FA metabo-lism appeared to be differentially expressed throughout development with a significant up-regulation at veraison. This might be interpreted as a homeostatic reaction to the large FA accumulation occurring at this developmental stage.
Taking into account the secondary metabolites, genes involved in phenylpropanoid and alkaloid biosynthesis and caffeine, limonene and pinene metabolism appeared to be differentially expressed throughout fruit develop-ment. Dihydrokaempferol 4-reductase, flavanone 3-diox-ygenase, naringenin-chalcone synthase, and leucocyanidin oxygenase, four enzymes controlling fla-vone and flavonol, as well as anthocyanin biosynthesis, were up-regulated from 90 to 130 DAF, thus suggesting an increased accumulation of the related metabolites during late development. Flavonoids are important secondary metabolites precursor of flavonols and anthocyanins, the latter being responsible of the color development occur-ring at ripening. Key genes related to the anthocyanin bio-synthetic pathway (chalcone synthase, CHS, flavanone 3-hydroxylase, F3H, dihydroflavonol reductase, DFR, and anthocyanidin synthase, ANS) proved to be up-regulated at veraison stage. A similar coordinated up-regulation of KEGG pathway for flavonoid biosynthesis (Map:00941)
Figure 7
KEGG pathway for flavonoid biosynthesis (Map:00941). The isoforms of four different enzymes (i.e. dihydrokaempferol
4-reductase, ec:1.1.1.219; flavanone 3-dioxygenase, ec:1.14.11.9; naringenin-chalcone synthase, ec:2.3.1.74; and leucocyanidin oxygenase, ec:1.14.11.19) controlling flavone and flavonol as well as anthocyanin biosynthesis were mapped (see also Additional file 5).
these genes has been observed in grape berries at the onset of ripening, at the time of pigmentation changes [33]. The relatively high abundance of transcripts related to hormones supports their key regulatory role in olive fruit development, as demonstrated in several other fruits [34]. The synthesis of ABA is clearly stimulated throughout fruit development, as demonstrated by the up-regulation of two key enzymes of its biosynthetic pathway. The pattern of expression changed according to the type of hormone. The observed down-regulation of genes involved in auxin biosynthesis and metabolism is consistent with a lower-ing of the auxin content reported in other fruits through-out development. The different regulation of auxin responsive factors, such as ARF1 and ARF7, which act as negative and positive regulators of IAA responsive genes, respectively [35], might imply a decreased sensitivity to
the hormone during late fruit development. This is con-sistent with a negative regulation of auxin on the onset of the ripening syndrome observed in non climacteric fruits. At late developmental stage, a down regulation of the zea-tin O-glucosyltransferase 2, actively involved in CK metabolism, as well as an up-regulation of ARR1, a pro-tein involved in the CK response, have been observed. ARR1 is a type-B ARR transcription factor involved in CK-responsive phenomena. It has been proposed that ARR1, together with ARR10 and ARR12, redundantly play piv-otal roles in the AHK-dependent phosphorelay signaling in response to CK [36]. Taking into account that CK met-abolic enzymes are up-regulated by the hormone, these transcriptional changes may reflect a lowering of CK con-centration, along with an increase of fruit sensitivity to CK occurring during late development. The veraison is a developmental stage characterized by a strengthening of Regulatory network map constructed with MapMan software using the olive fruit EST dataset
Figure 8
Regulatory network map constructed with MapMan software using the olive fruit EST dataset. Several genes
encoding transcription factors were mainly down-regulated throughout fruit development, while some others were related to protein modification and degradation. Genes related to the biosynthesis and action of IAA, ABA, GA, ethylene, cytokinins, JAs and SA appeared to be differently regulated according to the type of hormone.
the fruit sink action, that, also in olive, might be regulated by a complex hormone cross-talk and interaction, as dem-onstrated in other non climacteric fruits as grape berries [37]. In spite of any signal variation in terms of expression of genes related to ethylene biosynthesis, an up-regulation of an ERS type ethylene receptor has been observed during early fruit development. This might imply an increase in sensitivity of the fruitlet to ethylene, the hormone involved in the regulation of the immature fruit physio-logical drop that in olive occurs between fruit set and pit hardening [38]. Genes involved in the jasmonates (JAs) metabolism and brassinosteroids (BRs) biosynthesis were up- and down regulated, respectively. If the gene expres-sion pattern is mirrored by a similar evolution of JA and BR concentration in fruit tissues, this would indicate that the role of JAs and BRs in olive is different from other fruit types such as peach and grape. In fact, in peach it has been demonstrated that JAs delay fruit ripening [39], while BRs stimulate the onset of veraison in grape berry [40]. The dual multiple contingency tests allowed the identifi-cation of GO terms related to biotic and abiotic stress responses significantly and antagonistically distributed between libraries. The transcriptional profile of genes related to light, temperature and biotic stresses parallels the dynamics of day length and light intensity, both peak-ing at the pit hardenpeak-ing stage. Moreover, these data may indicate that genes responding to environmental stimuli are transcriptionally regulated up to pit hardening, and post-transcriptionally up to the veraison.
Conclusion
As a concluding remark, the SSH technique allowed to identify a set of 642 differentially expressed unique sequences. Among these, 89 (14%) corresponding to 61 different key genes were further investigated by Real-Time PCR, pointing out a validation of the SSH results as high
as 69%. The bioinformatic annotation of all gene sequences was useful to shed light on metabolic pathways and to understand specific regulatory networks. In fact, data here reported represent a significant contribution to the elucidation of transcriptional aspects related to carbo-hydrates, FAs, secondary metabolites, transcription factors and hormones as well as response to biotic and abiotic stresses. Particularly interesting are data related to hor-mones, pointing out the complexity of the role played by these compounds in olive fruit development and ripen-ing.
These molecular and bioinformatic data represent a first step toward both functional genomics and systems biol-ogy research for understanding the gene functions and regulatory networks in olive fruit growth, development and ripening.
Methods
Plant material
In an orchard located nearby Perugia (Italy), growth of olive (Olea europaea L., cv Leccino) fruits was determined by monitoring fresh weight accumulation. Olive samples were collected at 30 days after flowering (DAF) (initial fruit set, stage 1), 90 DAF (completed pit hardening, stage 2) and 130 DAF (veraison, stage 3)] (Figure 1).
RNA extraction
Total RNA was extracted from pericarp of about 16 fruits for each sampling date, using the RNeasy Plant Mini Kit (Qiagen). Contaminating genomic DNA was removed from total RNA by two DNase treatments. The first was performed using the RNase-Free-DNase Set (Qiagen) dur-ing RNA isolation procedure. After sample elution, total RNA was treated with DNAse I (Promega). The RNA aque-ous method (Ambion) was applied to purify total RNA from phenolic compounds and other substances that Table 5: Dual multiple contingency tests performed to identify GO terms associated to sequences significantly and antagonistically distributed between libraries for genes related to biotic and abiotic stress responses.
Stages GO Id GO term 2 P value Stage 1 Stage 2 Stage 3
1-2 GO:0006979 Response to oxidative stress 20.9 1.59e-06 18 7 -1-2 GO:0009266 Response to temperature stimulus 10.8 1.13e-03 5 0 -1-2 GO:0009314 Response to radiation 4.3 1.75e-02 0 16 -2-3 GO:0009314 Response to radiation 5.0 1.72e-02 - 12 3 1-2 GO:0009408 Response to heat 5.2 1.71e-02 3 0 -1-2 GO:0009416 Response to light stimulus 4.3 1.75e-02 0 16 -2-3 GO:0009416 Response to light stimulus 6.6 5.50e-03 - 12 2 2-3 GO:0009615 Response to virus 4.6 1.18e-02 - 6 0 2-3 GO:0009617 Response to bacteria 5.7 5.80e-03 - 7 0 1-2 GO:0009624 Response to insects 26.8 8.17e-07 12 1 -2-3 GO:0009644 Response high light intensity 4.6 1.18e-02 - 6 0 1-2 GO:0042221 Response to chemical stimulus 12.1 6.67e-04 20 19 -1-2 GO:0051707 Response to other organisms 20.9 1.59e-06 16 7 -2-3 GO:0051707 Response to other organisms 5.7 5.60e-03 - 7 0
could inhibit reverse transcription. The RNA was quanti-fied by both, spectrophotometer and gel electrophoresis on a denaturing agarose gel. The mRNA was isolated from about 400 μg of total RNA for each sample using oligo dT cellulose resin.
cDNA synthesis and library construction
For all samples, the first strand cDNA was synthesized with reverse transcriptase using oligo dT primer, modified for a tail containing RsaI restriction site. The second strand was synthesized by incubating the first strand cDNA with DNA polymerase I, RNAse H and DNA ligase at 16°C for 2.5 hrs. T4 polymerase was added to blunt the ends of the cDNA to facilitate the ligation of adapters in the later steps. The samples were extracted with phenol/chloro-form. Subtracted and reverse subtracted cDNA libraries were constructed using a combination of a PCR-based subtraction kit (Clontech) and a unique subtraction pro-cedure (Rx Biosciences). Four subtracted cDNA libraries have been constructed to compare samples collected at 30 and 90 DAF (libraries A and B) and samples at 90 and 130 DAF (libraries C and D) (Figure 1). For the two forward libraries A and C, cDNA from samples collected at 30 and 90 DAF, respectively, were used as tester and cDNA from 90 and 130 DAF, respectively, were used as drivers, vice versa for the reverse subtractive libraries B and D. For DNA isolation alkaline lyses method was followed. The clones were grown in 0.5 ml of Terrific Broth (TB) overnight in 96 well plates. An aliquot was saved for glycerol stocks. Rest culture was centrifuged in HT-6000BSorvall centri-fuge and re-suspended in P-1 buffer. Following re-suspen-sion, buffer P-2 was added to lyse the cells. After 2 min, buffer P3 was added to neutralize the solutions. The lysate was transferred to 96-well filter plates then the centrifuga-tion was performed at 2,000 g for 2 min. The clear lysate thus obtained was mixed with 0.7 volumes of ethanol and centrifuged at 6,500 g in HT-6000B centrifuge for 20 min. The pellet was once washed with 70% ethanol, dried dis-solved and re-suspended in 50 μL of sterile water. The complete analysis was performed using CLC Combined Workbench 3 software. The sequence data were imported in the directory files of the software. The software has data bank of various vectors in use for library construction, if not it was imported from Manufacture's web site (Invitro-gen). The sequence data were mass aligned with the vector and the sequences homologous to vector were mass trimmed. The vector trimmed sequences were mass blasted in batches using CLC software. The resulting files were saved and exported into Microsoft excel format. The sequencing was performed using ABI3700 automatic DNA sequencers using 25-50 ng of DNA template accord-ing to manufactures protocol. These experimental steps have been performed at Rx Biosciences Lab (Rockville, MD, USA).
Gene Ontology annotation
Nucleotide sequences retrieved by SSH were screened for vector contamination by using a home made BioPearl script. Once cleaned by vector residuals, all sequences were used for contig assembly by using a web interface of the CAP3 software (CAP3, http://deepc2.psi.iastate.edu/ aat/cap/cap.html, [41]) and redundancy within and among libraries were calculated as ratio of sequences belonging to a contig out of the total sequences consid-ered. Computational annotation of the four olive EST datasets was performed using the Blast2GO software v1.3.3 (http://www.blast2go.org, [42,43] as described in [44] with minor modifications. Briefly, a sequence length threshold of 200 bp was considered for all libraries and used to split the datasets in according to the length. BlastX algorithm was used for both short and long sequence datasets with different parameters according to the length. Blast expectation value threshold was constantly set to 10, whereas HSP length cutoff was set at 15 and 33, respec-tively. Similarly, the Blast2GO software v1.3.3 was used to obtain GO information from retrieved database matches. Annotation of all sequences was performed by using default parameters on the two ranges of length previously described. Furthermore, InterPro Scan [45] was per-formed to find functional motifs and related GO terms by using the specific tool implemented in the Blast2GO soft-ware with the default parameters. Finally, the 'Augment Annotation by ANNEX' function was used to refine anno-tations (http://www.goat.no, [46]). The GOslim 'goslim_plant.obo' was used to achieve specific GO terms by means of a plant-specific reduced version of the Gene Ontology http://geneontology.org.
Annotation distribution among originated libraries was represented by Venn diagrams by computing all retrieved annotation with the VennMaster software with the default parameters http://www.informatik.uni-ulm.de/ni/staff/ HKestler/vennm/doc.html.
Enzyme mapping of annotated sequences was done by direct GO to Enzyme annotation and used to query the Kyoto Encyclopaedia of Genes and Genomes (KEGG -http://www.genome.jp/kegg/, [47-49]) to define the main metabolic pathways involved.
MapMan http://gabi.rzpd.de/projects/MapMan/ analysis was done using the olive dataset properly rearranged as input files. The Arabidopsis proteome was downloaded from ftp://ftp.arabidopsis.org/home/tair/Genes/ TAIR8_genome_release/TAIR8_sequences/ and the olive transcriptome dataset used as query for local BLASTX analysis. Once blasted, the Arabidopsis AGI code relative to all BLAST hits with an E-value equal or greater than E-6 were recovered by means of an home made Perl script.
Retrieved AGI codes were then converted in ATH1-121501 genechip identifiers (Affymetrix) by using the PhyloGenie web interface http://bioinfos erver.rsbs.anu.edu.au/utils/affytrees/; [50]). For each library, an arbitrary expression values were assigned to all EST-linked Affymetrix identifiers, and the originated data-set used as input form for subsequent MapMan analysis. Finally, a time course representation of whole olive EST dataset related to primary and secondary metabolites and cellular processes environment was done by mapping the datasets within the appropriate MapMan pathways.
Real-Time PCR analysis
Quantitative Real-Time PCR experiments were carried out to validate some of the genes isolated by SSH and charac-terized by GO. Among the whole dataset of non-redun-dant sequences, 89 gene sequences belonging to key biosynthetic and metabolic pathways were selected according to the length (over 100 bp) and e-value (higher than 1E-6). All cDNAs were prepared from fruits collected at three developmental stages (30, 90, and 120 DAF), cor-responding to the ones used for the construction of SSH libraries, using the Super Script Reverse Transcriptase kit (Invitrogen).
Specific primer pairs for each of the sequences were designed (Additional file 7) and tested for their activity at 60°C by conventional PCR. Different primers were also designed to discriminate putative isoforms. Quantitative Real-Time RT-PCR analyses were then performed using a thermal cycler 7300 Real-Time PCR System (Applied Bio-system) equipped with a 96 well plates system with the SYBR green PCR Master Mix reagent (Applied Biosystem). All Real-Time PCR experiments were performed with two independent sets of RNA samples: each analysis was per-formed in a final volume of 20 μl containing 2 μl of cDNA diluted 1:50, 0,3 μM of each primer, and 10 μl of 2× SYBR Green PCR Master Mix according to the manufacturer's instructions. The following thermal cycling profile was used for all PCRs: 95°C for 20 sec, 50 cycles of 95°C for 10 s and 60°C for 1 min. All quantifications were normal-ized to the Olea europaea Elongation Factor 1 gene used as housekeeping gene and amplified in the same conditions. Data resulting from quantitative Real-Time PCR were cor-rected on the basis of the housekeeping gene by the ΔΔCt method. Pair-wise analyses of gene expression values at the three developmental stages were performed by com-paring fruit stages (2 versus 1 and 3 versus 2). These two series of ratios were treated by Cluster 3.0 software [51]. All data were normalized and transformed in a logarith-mic scale to compare expression levels of all genes and group them according to expression patterns.
Authors' contributions
PT, LB, LS, and AR conceived the research plan. FA, FM and NGMC collected samples and carried out RNA extrac-tions. SC performed Real-Time PCR experiments. GG, GB, FM, and FA, performed computational analyses. GG, and GB developed and implemented the annotation and bio-informatics analyses. AR, GB, PT; and LB drafted the man-uscript. All authors read and approved the manman-uscript.
Additional material
Additional file 1
RT-PCR validation. Results of the validation of 42 genes analyzed by
quantitative Real-Time PCR and grouped according to eight different sub-groups of expression patterns among the three fruit developmental stages.
Click here for file
[http://www.biomedcentral.com/content/supplementary/1471-2229-9-128-S1.JPEG]
Additional file 2
List of enzyme names and codes. List of enzyme names, codes and library
of the 89 gene sequences tested by quantitative Real-Time PCR.
Click here for file
[http://www.biomedcentral.com/content/supplementary/1471-2229-9-128-S7.PDF]
Additional file 3
KEGG map. KEGG pathway for starch and sucrose metabolism
(Map:00500) (A) combined with glycolysis and gluconeogenesis (Map:00010) (B). Box colors: blue and green correspond to up-regulated genes between olive stages 1 and 2, and 2 and 3, respectively, whereas red and yellow correspond to down-regulated genes between olive stages 1 and 2, and 2 and 3, respectively; gray indicates transiently regulated genes from stage 1 to stage 3.
Click here for file
[http://www.biomedcentral.com/content/supplementary/1471-2229-9-128-S3.JPEG]
Additional file 4
KEGG map. KEGG pathway related to fatty acid biosynthesis
(Map:00061) (A) and metabolism (Map:00071) (B). Box colors: blue and green correspond to up-regulated genes between olive stages 1 and 2, and 2 and 3, respectively, whereas red and yellow correspond to down-reg-ulated genes between olive stages 1 and 2, and 2 and 3, respectively; gray indicates transiently down-regulated genes while violet indicates con-stantly and down-regulated genes from stage 1 to stage 3.
Click here for file
[http://www.biomedcentral.com/content/supplementary/1471-2229-9-128-S3.JPEG]
Additional file 5
Secondary metabolism enzymes. List of enzymes involved in the
biosyn-thesis and metabolism of secondary metabolites, such as steroids, phenyl-propanoids, flavonoids, alkaloids and specific products like caffeine, limonene and pinene.
Click here for file
[http://www.biomedcentral.com/content/supplementary/1471-2229-9-128-S4.PDF]
Acknowledgements
The authors gratefully acknowledge funding for this research from the Project FISR "Improving flavour and nutritional properties of plant food after first and second transformation" (activity 'Identification of genes involved in the synthesis and degradation of secoiridoids in olive fruits'), from the Associazione Olivicultori Euganei (Padova), and the Fondazione Cassa di Risparmio di Lucca. A special thank is due to Dr. Massimo Ferasin for sponsoring this research.
References
1. Seymour G, Poole M, Manning K, King GJ: Genetics and epigenet-ics of fruit development and ripening. Curr Op Pl Biol 2008, 11:58-63.
2. Moore S, Vrebalov J, Payton P, Giovannoni JJ: Use of genomics tools to isolate key ripening genes and analyse fruit matura-tion in tomato. J Exp Bot 2002, 53:2023-2030.
3. Fei Z, Tang X, Alba RM, White JA, Ronning CM, Martin GB, Tanksley SD, Giovannoni JJ: Comprehensive EST analysis of tomato and comparative genomics of fruit ripening. Plant J 2004, 40:47-59. 4. da Silva FG, Iandolino A, Al-Kayal F, Bohlmann MC, Cushman MA, Lim H, Ergul A, Figueroa R, Kabuloglu EK, Osborne C, Rowe J, Tattersall E, Leslie A, Xu J, Baek J, Cramer GR, Cushman JC, Cook DR: Char-acterizing the grape transcriptome. Analysis of expressed sequence tags from multiple Vitis species and development of a compendium of gene expression during berry develop-ment. Plant Physiol 2005, 139:574-597.
5. Peng FY, Reid KE, Liao N, Schlosser J, Lijavetzky D, Holt R, Zapater JMM, Jones S, Marra M, Bohlmann J, Lund ST: Generation of ESTs in Vitis vinifera wine grape (Cabernet Sauvignon) and table grape (Muscat Hamburg) and discovery of new candidate genes with potential roles in berry development. Gene 2007, 402:40-50.
6. Park S, Sugimoto N, Larson MD, Beaudry R, van Nocker S: Identifi-cation of genes with potential roles in apple fruit develop-ment and biochemistry through large-scale statistical analysis of expressed sequence tags. Plant Physiol 2006, 141:811-824.
7. Lazzari B, Caprera A, Vecchietti A, Merelli I, Barale F, Milanesi L, Stella A, Pozzi C: Version VI of the ESTtree db: an improved tool for peach transcriptome analysis. BMC Bioinformatics 2008, 9:S9.
8. Gonzalez-Ibeas D, Blanca J, Roig C, Gonzalez-To M, Pico B, Truniger V, Gomez P, Deleu W, Cano-Delgado A, Arus P, Nuez F, Garcia-Mas J, Puigdomenech P, Aranda MA: MELOGEN: an EST database for melon functional genomics. BMC Genomics 2007, 8:306. 9. Crowhurst RN, Gleave AP, MacRae EA, Ampomah-Dwamena C,
Atkinson RG, Beuning LL, Bulley SM, Chagne D, Marsh KB, Matich AJ, Montefiori M, Newcomb RD, Schaffer RJ, Usadel B, Allan AC, Bold-ingh HL, Bowen JH, Davy MW, Eckloff R, Ferguson AR, Fraser LG, Gera E, Hellens RP, Janssen BJ, Klages K, Lo KR, MacDiarmid RM, Nain B, McNeilage MA, Rassam M, Richardson AC, Rikkerink EHA, Ross GS, Schroder R, Snowden KC, Souleyre EJF, Templeton MD, Walton EF, Wang D, Wang MY, Wang YY, Wood M, Wu RM, Yauk YK, Laing WA: Analysis of expressed sequence tags from Acti-nidia: Applications of a cross species EST database for gene discovery in the areas of flavor, health, color and ripening.
BMC Genomics 2008, 9:351.
10. Aharoni A, Keizer LCP, Bouwmeester HJ, Sun ZK, Alvarez-Huerta M, Verhoeven HA, Blaas J, van Houwelingen AMML, De Vos RCH, Voet H van der, Jansen RC, Guis M, Mol J, Davis RW, Schena M, van Tunen AJ, O'Connell AP: Identification of the SAAT gene involved in strawberry flavor biogenesis by use of DNA microarrays.
Plant Cell 2000, 12:647-661.
11. Pérez-Jiménez F, Ruano J, Perez-Martinez P, Segura F, Lopez-Miranda J: The influence of olive oil on human health: not a question of fat alone. Mol Nutr Food Res 2007, 51:1199-1208. 12. Sánchez J: Lipid photosynthesis in olive fruit. Prog Lipid Res 1994,
33:97-104.
13. Hernandez ML, Mancha M, Martinez-Riva JM: Molecular cloning and characterization of genes encoding two microsomal oleate desaturases (FAD2) from olive. Phytochemistry 2005, 66:1417-1426.
14. Zarrouk M, Marzouk B, Daoud DBM, Cherif A: Oil accumulation in olives and effect of salt on their composition. Olivae 1996, 61:40-45.
15. Ayton J, Mailer RJ, Robards K, Orchard B, Vonarx M: Oil concentra-tion and composiconcentra-tion of olives during fruit maturaconcentra-tion in south-western New South Wales. Aust J Exp Agric 2001, 41:815-821.
16. Obied HK, Prenzler PD, Ryan D, Servili M, Taticchi A, Esposto S, Robards K: Biosynthesis and biotransformations of phenol-conjugated oleosidic secoiridoids from Olea europaea L. Nat
Prod Rep 2008, 25:1167-1179.
17. Roca M, Mínguez-Mosquera MI: Carotenoid levels during the period of growth and ripening in fruits of different olive vari-eties (Hojiblanca, Picual and Arbequina). J Plant Physiol 2003, 160:451-459.
18. Roca M, Mìnguez-Mosquera MI: Involvement of chloropyllase in chlorophyll metabolism in olive varieties with high and low chlorophyll content. Physiol Plant 2003, 117:459-466.
19. Stiti N, Triki S, Hartmann MA: Formation of triterpenoids throughout Olea europaea fruit ontogeny. Lipids 2007, 42:55-67.
20. Haralampidis K, Milioni D, Sanchez J, Baltrusch M, Heinz E, Hatzopou-los P: Temporal and transient expression of stearoyl-ACP carrier protein desaturase gene during olive fruit develop-ment. J Exp Bot 1998, 49:1661-1669.
21. Poghosyan ZP, Giannoulia K, Katinakis P, Murphy DJ, Hatzopoulos P: Temporal and transient expression of olive enoyl-ACP reductase gene during flower and fruit development. Plant
Physiol Biochem 2005, 43:37-44.
22. Poghosyan ZP, Haralampidis K, Martsinkovskaya AI, Murphy DJ, Hat-zoupolos P: Developmental regulation and spatial expression of a plastidial fatty acid desaturase from Olea europaea. Plant
Physiol Biochem 1999, 37:109-119.
23. Banilas G, Moressis A, Nikoloudakis N, Hatzopoulos P: Spatial and temporal expressions of two distinct oleate desaturases from olive (Olea europaea L.). Plant Sci 2005, 168:547-555. 24. Banilas G, Nikiforiadis A, Makariti I, Moressis A, Hatzopoulos P:
Dis-crete roles of a microsomal linoleate desaturase gene in olive identified by spatiotemporal transcriptional analysis.
Tree Physiol 2007, 27:481-490.
25. Conde C, Agasse A, Silva P, Lemoine R, Delrot S, Tavares R, Geros H: OeMST2 encodes a monosaccharide transporter expressed throughout olive fruit maturation. Plant Cell Physiol 2007, 48:1299-1308.
Additional file 6
MAPMAN map. Overview MAPMAN metabolism map showing several
constantly and transiently up- and down-regulated genes related to cell wall synthesis and breakdown, fatty acid biosynthesis and lipid break-down, starch and sucrose metabolism, glycolysis, Calvin cycle and the sec-ondary metabolism (e.g., terpenoids, flavonoids, phenols). Signal colors: blue and green correspond to up-regulated genes between olive stages 1 and 2, and 2 and 3, respectively, whereas red and yellow correspond to down-regulated genes between olive stages 1 and 2, and 2 and 3, respec-tively; cyan and violet indicate, respectively, constantly up-regulated and down-regulated genes from olive stage 1 to stage 3; gray and orange indi-cate, respectively, transiently down- and up-regulated genes.
Click here for file
[http://www.biomedcentral.com/content/supplementary/1471-2229-9-128-S5.JPEG]
Additional file 7
List of specific primers used for RT-PCR analysis. List of specific primers
designed on the selected key genes for the validation of their expression patterns by Real-Time PCR analysis.
Click here for file
[http://www.biomedcentral.com/content/supplementary/1471-2229-9-128-S6.PDF]
Publish with BioMed Central and every scientist can read your work free of charge "BioMed Central will be the most significant development for disseminating the results of biomedical researc h in our lifetime."
Sir Paul Nurse, Cancer Research UK Your research papers will be:
available free of charge to the entire biomedical community peer reviewed and published immediately upon acceptance cited in PubMed and archived on PubMed Central yours — you keep the copyright
Submit your manuscript here:
http://www.biomedcentral.com/info/publishing_adv.asp
BioMedcentral 26. Bruno L, Chiappetta A, Muzzalupo I, Gagliardi C, Iaria D, Bruno A,
Greco M, Giannino D, Perri E, Bisonti MB: Role of geranylgeranyl reductase gene in organ development and stress response in olive (Olea europaea) plants. Func Plant Biol 2009, 36:370-381. 27. Ageorges A, Fernandez L, Vialet S, Merdinoglu D, Terrier N, Romieau
C: Four isogenes of the anthocyanin metabolic pathways are systematically co-expressed with the red colour of grape berries. Plant Sci 2006, 170:372-383.
28. Ikegami A, Eguchi S, Kitajima A, Inoue K, Yonemori K: Identification of genes involved in proanthocyanidin biosynthesis of per-simmon (Diospyros kaki) fruit. Plant Sci 2007, 172:1037-1047. 29. Kesari R, Trivedi PK, Nath P: Ethylene-induced ripening in
banana evokes expression of defense and stress related genes in fruit tissue. Postharvest Biol Technol 2007, 46:136-143. 30. Xu BY, Su W, Liu JH, Wang JB, Jin ZQ: Differentially expressed
cDNAs at the early stage of banana ripening identified by suppression subtractive hybridization and cDNA microar-ray. Planta 2007, 226:529-539.
31. Licciardello C, Russo MP, Valè G, Recupero RG: Identification of differentially expressed genes in the flesh of blood and com-mon oranges. Tree Gen Genomes 2008, 4:315-331.
32. Conde C, Delrot S, Geros H: Physiological, biochemical and molecular changes occurring during olive development and ripening. J Plant Phyisiol 2008, 165:1545-1562.
33. Boss PK, Davies C, Robinson SP: Analysis of the expression of anthocyanin pathway genes in developing Vitis vinifera L.cv. Shiraz grape berries and the implications for the pathway regulation. Plant Physiol 1996, 111:1059-1066.
34. Adams-Phillips L, Barry C, Giovannoni JJ: Signal transduction sys-tems regulating fruit ripening. Trends Plant Sci 2004, 9:331-338. 35. Tiwari SB, Hagen G, Guilfoyle T: The roles of auxin response
fac-tor domains in auxin-responsive transcription. Plant Cell 2003, 15:533-543.
36. Argyros RD, Mathews DE, Chiang YH, Palmer CM, Thibault DM, Eth-eridge N, Argyros DA, Mason MG, Kieber JJ, Schaller GE: Type B response regulators of Arabidopsis play key roles in cytoki-nin signaling and plant development. Plant Cell 2008, 20:2102-2116.
37. Deytieux-Belleau C, Gagne S, L'Hyvernay A, Doneche B, Geny L: Possible roles of both abscisic acid and indol-acetic acid in controlling grape berry ripening process. J International des
Sci-ences de la Vigne et du Vin 2007, 41:141-148.
38. Rapoport HF, Rallo L: Postanthesis flower and fruit abscission in "Manzanillo" olive. J Amer Soc Hort Sci 1991, 116:720-723. 39. Ziosi V, Bonghi C, Bregoli AM, Trainotti L, Biondi S, Sutthiwal S,
Kondo S, Costa G, Torrigiani P: Jasmonate-induced transctional changes suggest a negative interference with the rip-ening syndrome in peach fruit. J Exp Bot 2008, 59:563-573. 40. Symons GM, Davies C, Shavrukov Y, Dry IB, Reid JB, Thomas MR:
Grapes on steroids. Brassinosteroids are involved in grape berry ripening. Plant Physiol 2006, 140:150-158.
41. Huang X, Madan A: CAP3: A DNA sequence assembly pro-gram. Genome Res 1999, 9:868-877.
42. Conesa A, Götz S, Garcìa-Gòmez JM, Terol J, Talòn M, Robles M: Blast2GO: a universal tool for annotation, visualization and analysis in functional genomics research. Bioinformatics 2005, 21:3674-3676.
43. Aparicio G, Gotz S, Conesa A, Segrelles D, Blanquer I, Garcia JM, Hernandez V, Robles M, Talon M: Blast2GO goes grid: develop-ing a grid-enabled prototype for functional genomics analy-sis. Stud Health Technol Inform 2006, 120:194-204.
44. Botton A, Galla G, Conesa A, Bachem C, Ramina A, Barcaccia G: Large-scale Gene Ontology analysis of plant transcriptome-derived sequences retrieved by AFLP technology. BMC
Genomics 2008, 9:347.
45. Berardini TZ, Mundodi S, Reiser L, Huala E, Garcia-Hernandez M, Zhang P, Mueller LA, Yoon J, Doyle A, Lander G, Moseyko N, Yoo D, Xu I, Zoeckler B, Montoya M, Miller N, Weems D, Rhee SY: Func-tional annotation of the Arabidopsis genome using control-led vocabularies. Plant Physiol 2004, 135:745-755.
46. Zdobnov EM, Apweiler R: InterProScan-an integration plat-form for the signature-recognition methods in InterPro.
Bio-informatics 2001, 17:847-848.
47. Kanehisa M, Goto S: KEGG: Kyoto Encyclopaedia of Genes and Genomes. Nucleic Acids Res 2000, 28:27-30.
48. Kanehisa M, Goto S, Hattori M, Aoki-Kinoshita KF, Itoh M, Kawashima S, Katayama T, Araki M, Hirakawa M: From genomics to chemical genomics: new developments in KEGG. Nucleic
Acids Res 2006, 34:D354-357.
49. Kanehisa M, Araki M, Goto S, Hattori M, Hirakawa M, Itoh M, Katayama T, Kawashima S, Okuda S, Tokimatsu T, Yamanishi Y: KEGG for linking genomes to life and the environment.
Nucleic Acids Res 2008, 36:D480-D484.
50. Frickey T, Lupas AN: PhyloGenie: automated phylome genera-tion and analysis. Nucleic Acids Res 2004, 32:5231-5238. 51. de Hoon MJL, Imoto S, Nolan J, Miyano S: Open Source Clustering