The GLAST Large Area Telescope
The Gamma-ray Large Area Space Telescope (GLAST)(Gehrels & Michelson, 1999) is an international space mission devoted to the study of the γ-ray Universe. Planned for launch in autumn 2007, GLAST will bring a dramatic improvement in our understanding of the γ-ray emission processes in cosmic environments, probing the most powerful sources in the Universe.
GLAST will be launched from the NASA Kennedy Space Center with a rocket Delta II 2920-10H, the same used for launching the SWIFT mission. GLAST will be placed at 575 km of altitude in an orbit inclined by 28.5◦. During its normal operations GLAST will
orbit around the Earth with a period of 95 minutes and will scan the sky with a rocking angle of about 30◦. Fig. 2.1 shows an artistic view of the GLAST spacecraft in orbit.
GLAST will carry two main instruments, the Large Area Telescope (LAT)(”Michelson, 2000) and the GLAST Burst Monitor (GBM)(Meegan, 2000).
The LAT, the main GLAST instrument, is a pair-conversion telescope based on
high-Figure 2.1: Artistic view of the GLAST satellite
precision detectors from High Energy Physics technology (Atwood & et al., 2008). The 30
LAT will cover an energy range from about 30 MeV up to about 300 GeV. The LAT is the successor of the EGRET telescope aboard the Compton Gamma Ray Observatory (CGRO), but it has much higher sensitivity and better resolution.
The GLAST Burst Monitor (GBM) is entirely devoted to the study of the transient γ-ray sources, i.e. Gamma Ray Bursts (GRBs) and Solar Flares. It is made up by two kind of detectors based on scintillating materials, which together will cover an energy window from 15 keV up to about 25 MeV. This energy range will guarantee an energy overlap with the LAT.
2.1
Before GLAST: the Compton Gamma Ray
Ob-servatory
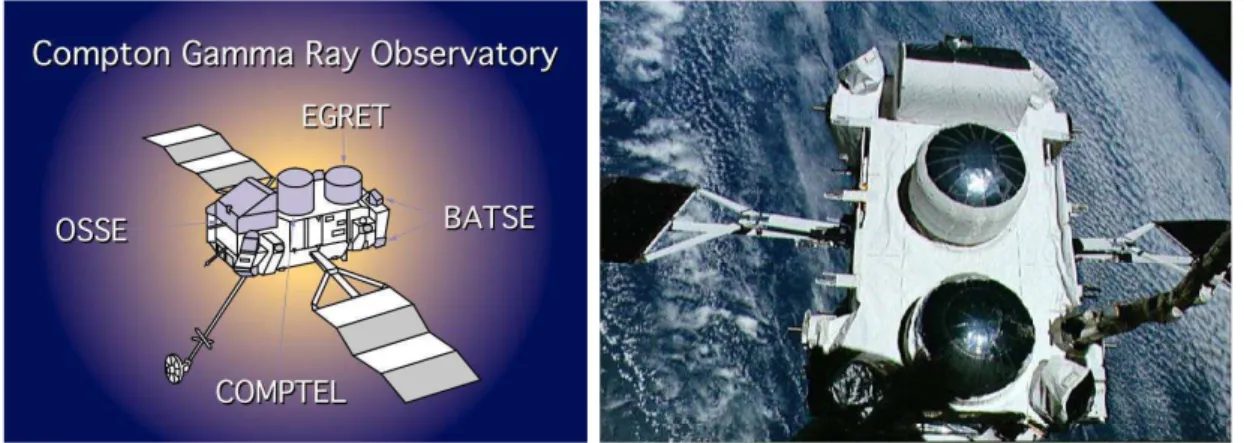
The Compton Gamma Ray Observatory is the predecessor of GLAST and was launched on April 5, 1991 (Fichtel et al., 1994). It was the second NASA Great Observatory (after the Hubble Space Telescope) and the first entirely devoted to γ-ray astrophysics. The total weight of CGRO was more than 17 tons, the heaviest payload ever put into orbit at that time. The CGRO was put in orbit during a Space Shuttle mission and an image can be seen in Fig. 2.2.
CGRO carried onboard four experiments (Fig.2.2). The Burst and Transient Source Experiment (BATSE)(Fishman et al., 1989) was mainly devoted to the study of the Gamma Ray Bursts and monitored the sky at energies of 20-1000 keV. The Oriented Scintillation Spectrometer Experiment (OSSE)(Johnson et al., 1993) worked in an energy range of 0.05-10 MeV. The Compton Telescope (Comptel)(Diehl, 1988), whose detecting technique was based on Compton scattering, had an imaging capability of about 1 sr in the energy range 0.8-30 MeV. The Energetic Gamma Ray Experiment Telescope (EGRET) (Hartman et al., 1999) was a pair conversion telescope designed to cover an energy band between 30 MeV and about 10 GeV.
Figure 2.2: Left: Scheme of the CGRO experiments. Right: An image taken during the deployment of the CGRO. The CGRO observatory is clearly visible outside the Space Shuttle bay.
2.1.1
The EGRET telescope
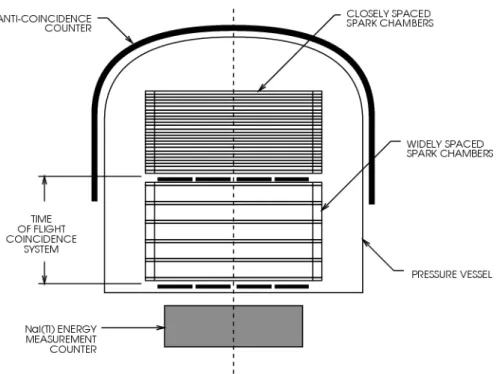
The Energetic Gamma Ray Experiment Telescope (EGRET) was the first instrument that performed a complete sky survey in the 30 Mev - 10 GeV energy band. The dominant process of radiation-matter interaction at EGRET energies is pair production, then the EGRET detecting strategy was based on the pair production. This strategy is the same adopted for the LAT, in fact both are pair conversion telescopes. A scheme of EGRET is presented in Fig. 2.3. The main detectors of EGRET were a spark chamber tracker, a NaI calorimeter, a Time Of Flight (TOF) detector and a monolithic anticoincidence dome for rejecting the charged particles background.
The incoming γ-rays enter the upper detector and converts into an e−e+pair in one of
Figure 2.3: Scheme of the EGRET telescope.
the plates between the spark chambers in the tracker. The trigger initiated if at least one of the two pair members was recognized as downward particle by the TOF detectors and there was no signal in the anticoincidence dome. In this case the tracking system provided a digital picture of the event and the measurement of energy started. The energy was obtained with the NaI counters located below the tracker.
The tracker consisted of 28 spark chambers detectors interleaved with 27 plates with a thickness of 0.02 Radiation Lengths (R.L.) for gamma-ray conversion. The upper spark chamber provided the initial direction, while the bottom one provided information about the separation between electron and positron and about the energy balance. The energy measurement was provided by an 8 R.L., 76 cm x 76 cm square NaI(Tl) scintillator crystal located below the lower TOF scintillator plate. The energy resolution in the central region of the EGRET energy range was about 20%. The energy resolution is degraded at higher energies because of incomplete shower containment. At energies below 100 MeV the energy resolution also degraded because ionizaton losses in the spark
chambers comprised an appreciable portion of the total photon energy.
2.2
The LAT scientific-driven requirements
The basic instrumental requirements for the GLAST experiment are: a short dead time for transient studies, a good energy resolution over a broad energy band, a large field of view and effective area with excellent angular resolution in order to achieve high sensitivity with great localization power. Below, for each science topic, an estimate of the basic telescope properties that are more relevant to reaching the science goals are listed.
• Blazars and Active Galactic Nuclei (AGN):
– Broad energy response from 20 MeV to 300 GeV to explore the low energy spectrum where many AGN have peak emission, to measure high energy cutoff and to overlap with ground based telescopes.
– Energy resolution better than 10% between 100 MeV and 10 GeV to facilitate the study of spectral breaks at both low and high energies.
– Peak effective area greater than 8000 cm2
to allow for variability studies of bright sources down in the sub-day timescales.
– FOV at least 2 sr for significant sky coverage.
– Flux sensitivity better than 6 × 10⁻⁹ cm−2s−1 for the 1 year sky survey to
measure the AGN logN-logS function. – Mission life of at least 5 years.
• Unidentified sources:
– Source localization power to less than 5 arcmin for sources of strength > 10−8 cm−2s−1 and 0.5 arcmin for strong sources (> 10−7 cm−2s−1) to
facilitate counterpart searches at other energies.
– Broad energy range to extrapolate spectra into the hard x-ray and TeV regimes to facilitate studies at other wavelengths.
– Peak effective area greater than 8000 cm2
to allow for variability studies of bright sources down in the sub-day timescales.
– Short dead time for short term variability studies.
– Wide (> 2 sr) FOV to allow high duty cycle monitoring of unidentified sources for time variability.
– Mission life of at least 5 years. • Gamma-ray diffuse background:
– Background rejection capability such that the contamination of the observed high latitude diffuse flux (assumed to be 1.5 × 10⁻⁵cm−2s−1sr−1) is less than
– Broad energy response from 20 MeV to 300 GeV to extend the measurement of the diffuse background to unexplored energy ranges.
– Broad field of view (more than 2 sr) for sensitive full sky maps. • Dark matter:
– Broad energy range with response up to 300 GeV to constrain dark matter candidates.
– Spectral resolution of 6% above 10 GeV for side-incident events to identify relatively narrow spectral lines.
– Mission life of at least 5 years, for reaching high statistical significance • Gamma Ray Bursts (GRBs):
– Quick (less than 5 s) localization of GRBs.
– Broad field of view (more than 2 sr) to monitor a substantial fraction of the sky at any time.
– Energy resolution better than 20% above 1 GeV to allow seraching for breaks in the spectra.
– Less than 100 µs dead time for identifying correlation between low energy and high energy time structures in the bursts.
– Single photon angular resolution better than 10 arcmin at high energy for good localization.
• Solar flares:
– Long mission lifetime (more than 5 years) to provide solar flares observations over a range of solar cycle activity.
– Broad energy band (20 MeV - 300 GeV) to observe high energy emission. – Less than 100 µs dead time to ensure good time resolution during flares. • Pulsars:
– Energy resolution better than 10% in the 100 MeV - 10 GeV energy range, where pulsars breaks occur.
– Absolute timing accuracy better than 100 µs dead time for resolving pulsation in the light curve.
– Large effective area for improving the statistics.
– Large FOV to allow high duty cycle monitoring of pulsars.
• Interstellar clouds, SNRs, Galactic Center and Cosmic Rays production:
– Single photon angular resolution better than 3.5◦ at 100 MeV for normal
incidence, improving to better than 0.1◦ at 1 GeV for mapping extended
– Point source localization better than 1 arcmin for identifying Supernovae remnants.
– Energy resolution better than 10% above 100 MeV for studying the spectral shape in proximity of SNR and of the GC.
– Broad energy band (up to 300 GeV) for correlating the observations with ground-base telescopes, especially in the observation of the high energy emis-sion from SNR and GC.
Moreover, the direct detection of gamma-ray implies that the observatory has to be placed in orbit, in order to avoid the atmospheric absorption. This necessity is strictly linked with the Space Craft requirements in terms of mass, dimensions and power con-sumption. The following table summarize “mission requirements” set by the Space Craft interaction.
Parameter Mission requirement
Mass 3000 kg
Center of gravity <0.246 m from the LAT/SC interface
Overall dimensions
Maximum x-y dimension <1.8 m
Maximum z dimension <3.15 m
Power consump-tion
Average power (1 orbit) <650 W
Peak power <1000 W
Peak power duration <10 min
2.3
Overview of the Large Area Telescope
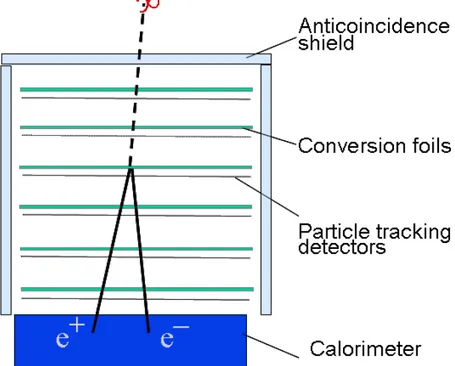
Pair production is the dominant mechanism of interaction between radiation and matter at the energies studied by the GLAST Large Area Telescope (LAT)(”Michelson, 2000; Atwood & et al., 2008). For this reason a pair conversion telescope is made basically by a tracking system, a Calorimeter and an Anticoincidence system, as displayed in Fig. 2.4. The EGRET experiment aboard CGRO had this structure and contained these detector substystems, and also the previous instruments aboard SAS-2 and COS B mission share the same detecting strategy.
A γ-ray entering the LAT creates an electron-positron pair, whose energies and direc-tions are reconstructed by the LAT subsystems. From this information is is possible to determine the energy and arrival direction of the incoming photon using the conserva-tion of four-momentum.
The tracking system has the primary goal of measuring the tracks of the electron and of the positron. In order to maximize the conversion probability, detecting planes are interleaved with conversion foils of particular thickness. Since the conversion proba-bility increase with the atomic number Z as Z2
by high-Z material. As an example, EGRET used tantalum (Ta) foils and LAT use tungsten (W) foils.
The electron-positron pair create an electromagnetic shower in the calorimeter, and from the measurement of the shower performed by the calorimeter the energy of the pair is determined.
The measurements gathered by the tracking system and by the calorimeter are then used to reconstruct the energy of the incoming γ-ray.
The orbit environment is extremely rich of charged particles that enter the detector with rates that are of the order of 105
the rate of γ-rays. In order to reject the charged parti-cles background an anticoincidence detector is used. The Anticoincidence surrounds the telescope and it is usually made by plastic scintillator. Charged particles gave a signal when crossing the sintillators of the anticoincidence, while γ-rays does not. This is an useful way to reduce with high efficiency the charged particles background.
The GLAST Large Area Telescope (LAT) share the same base philosophy but is based on new generation detectors developed for High-Energy Physics. The main LAT sub-systems are the Tracker (TKR), the Calorimeter (CAL), the AntiCoincidence Detector (ACD) and the Data Acquisition System (DAQ). The tracker is made up of silicon
Figure 2.4: Simplified scheme of a pair conversion telescope like the LAT
microstrip detectors and allow the conversion of the γ-rays and the reconstruction of the electron and the positron tracks. The Calorimeter is located below the tracker and determines the energy of the pair. In order to reduce the background due to charged par-ticles, the LAT is covered by an Anticoincidence Detector (ACD), which discriminates the charged particles from γ-rays. The Data Acquisition System (DAQ) will manage the main subsystems functions, e.g. the reading procedures and the trigger control. An incoming γ-ray pass through the ACD without giving any signal, then enter the Tracker where are converted into an electron-positron pair. The energies and directions
of the pair members are reconstructed by the Tracker itself and by the Calorimeter, as displayed in Fig. 2.4.
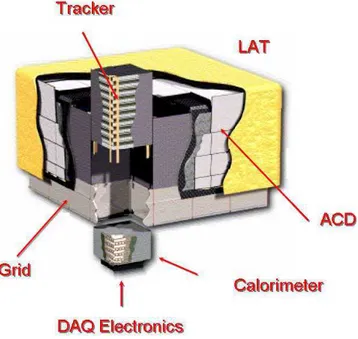
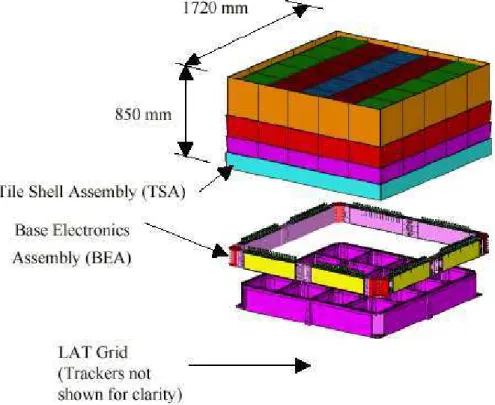
Two key concepts of the LAT design are the modularity, that simplified the construction and integration phases, and the redundancy, that will limit the problems raising from possible malfunctioning during the instrument life. The LAT is made of an array of 4 x 4 towers, each made by a Tracker module, a Calorimeter module and a DAQ module (Fig. 2.5). The LAT offer higher performances with respect to its predecessor EGRET thanks to the new design strategy and the new detecting technologies. The main innovation of
Figure 2.5: The GLAST Large Area Telescope.
the whole LAT is the introduction of the Tracker based on solid-state detectors instead of spark chambers used for the EGRET tracker.
These detectors have many advantages. First of all they provide a spatial resolution about 10 times better than spark chambers without many complications during fabri-cation. In the silicon trackers of the modern High Energy experiments the distances between the microstrips are of 50-60 µm , while the pitch between LAT Tracker mi-crostrips is of 228 µm . Additionally they offer a lower dead time of about 20 µs, with respect to the dead time of 100 ms of the EGRET spark chambers.
The silicon detectors used for the LAT Tracker are radiation hard and does not contain consumables: this is an enormous advantage for mainly two reasons.
EGRET used spark chambers for the tracking system and the gas deteriorated with time. For this reason it must be substituted many times during the mission using on-board refilling system. In order to maximize the instrument lifetime, the gas must be conserved the most long possible but at each trigger it deteriorates, then EGRET trig-ger strategy minimized the number of trigtrig-gers. For this purpose TOF counters were used in order to know if photons were coming from upside or from downside. The use of TOF counters limited the EGRET aspect ratio, since the height of the detector had to be enough to guarantee a measurable time of flight between the top and bottom of the detector. The aspect ratio of the instrument was then constrained to have a Field
Of View (FOV) of about 0.5 sr. Since there are no consumable in the silicon detectors, there are no such limitations in the trigger, then the LAT aspect ratio could be lower, assuring a FOV of about 2.4 sr. A wider FOV will allow a wider sky coverage, allowing a better sky monitoring for the study of transient sources and the observation of a big portion of the sky at the same time. A silicon based Tracker permits to avoid other complications, such the gas refilling of the usage of high potential differences.
Another important aspect is that no consumables aboard GLAST LAT will increase the instrument lifetime, that is currently planned in 5+5 years.
The LAT Calorimeter is made by scintillation bars, in order to better reconstruct the electromagnetic shower development, while the EGRET calorimeter was based on a monolithic scintillating detector.
The segmented ACD detector is also another big LAT innovation, since the EGRET ACD was made by a single scintillator panel. This segmentation will provide an higher detecting efficiency at energies greater than 10 GeV.
At these energies the self-veto problem becomes important, because a particle from the electromagnetic shower can backscatter in the ACD producing a spurious signal. In the LAT the ACD is segmented, then is it possible to know roughly which ACD panel gave a signal, in order to determine if the panel has undergone a backsplash or not. In this way it will be possible to avoid efficiency loss at high energies as was for the EGRET telescope.
In order to achieve its scientific goals the LAT must reject most of the background due to various contributions. The main contribution is due to cosmic rays, that enter the detectors producing spurious signals. In order to strongly reduce this background the ACD will be used together with more finer cuts on the reconstructed parameters of the incoming particle. Another contribution comes from the albedo γ-rays from the Earth, that will be removed mainly by considering the position of the spacecraft with respect to our planet. The last contribution to the background is from the radioactive activation of the materials of the satellite, but the simulations have shown that this contribution will be negligible in comparison with the others. Over a sample of 10 million background events, simulations have shown that about 40 events survived the background rejection, confirming the background rejection requirements of 105
:1.
2.4
The LAT Calorimeter
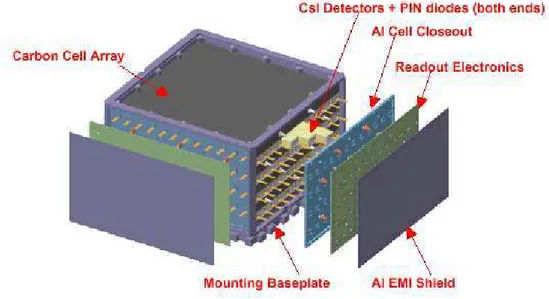
The LAT Calorimeter(Johnson et al., 2000) measures the energy of the electron-positron pair and gives information about the high-energy photons that have not converted in the Tracker. From the measure of the e−e+energy it is possible to determine the
en-ergy of the primary photon using the conservations of the enen-ergy and momentum. A schematic view of the LAT Calorimeter is in Fig.2.6 The LAT Calorimeter is made up of a set of CsI(Tl) scintillating bars in hodoscopic configuration, in order to obtain more information about the structure and development of the electromagnetic shower. Each scintillating bar is read by PIN photodiodes located at both end of the bar itself. This strategy provides an high energy resolution, a good signal ( roughly 500 e−
M eV) and
requires a low working voltage of about 50 Volts. Another relevant characteristic of this system is the compactness, very important for space missions. This calorimeter is simi-lar to the EGRET calorimeter, but it is fine segmented in the longitudinal and traversal
Figure 2.6: Schematic view of the LAT Calorimeter.
direction, while the EGRET calorimeter was a monolithic NaI(Tl) scintillator. This fine segmentation helps to have a good imaging capability in order to better reconstruct the electromagnetic shower. This is important also for estimating the arrival direction of the γ-ray that does not convert in the Tracker and for comparing the direction determined using the shower shape fit with the direction determined by the Tracker.
The total thickness of the calorimeter is 8.5 R.L. The LAT Calorimeter is constituted by an array of 4 x 4 modules, each of them made by 12 scintillating bars of 2 cm x 2.8 cm x 35.2 cm. These dimensions are comparable with the Radiation Length (1.8 cm) and the Moliere Radius (3.8 cm) thus a fine imaging of the shower.
A good shower reconstruction is important for at least two reasons. The longitudinal development helps to determine the energy using fits with analytical models of the lon-gitudinal development. Then the shower shape and symmetry help to determine the arrival direction in case of γ-rays that have passed the Tracker without converting. The information about the shower are also combined with the ones coming from the Tracker and the ACD in order to improve the background rejection.
At both ends of each bar is placed a PIN photo diode used for reading, and the mea-surement of the relative intensity at both ends helps to determine the position where the energy deposition has taken place. The precision that can be obtained varies from some mm at low energies (about 10 MeV), up to less than a mm for energies above 1 GeV.
In order to obtain information on the position each layer is rotated of 90◦ with respect
to the adjacent layers. This 3D imaging capability helps to determine the direction of the γ-rays that have not converted with a resolution of about 1◦.
2.5
The LAT Tracker
The LAT Tracker (Johnson & GLAST LAT Collaboration, 2005; Bellazzini et al., 2003) is used to increase the conversion probability of the incoming photons, to determine its
arrival direction and to start the Level 1 trigger.
First of all the threshold condition for pair production must be satisfied, then the incom-ing γ-ray must have an energy E > 2me−c
2
, where me− is the mass of the electron and
cis the speed of light. This process can take place only in the field of a nucleus in order to simultaneously have the energy and momentum conservation (Shapiro & Teukolsky, 1983). In order to understand this we can consider an e−e+pair moving with speed v
parallel to the original direction of the primary γ-ray, so that the total momentum is 2me−v. We can write the energy conservation equation:
hν = 2γmec 2
(2.1) If both e−and e+
move parallel to the γ-ray direction, the total momentum of the pro-duced pair can be obtained from the Eq. 2.1:
Pin= 2γmev = (
hν c )(
v
c) (2.2)
Since v cannot be equal to the speed of light, it is not possible to have simultaneously energy and momentum conservation in vacuum. A third body (in this case a nucleus) is required in order to adsorb part of the energy and momentum of the incoming γ-ray. The pair production cross section is proportional to Z2
, where Z is the atomic number, then is is good to use high-Z conversion foils in order to maximize the conversion prob-ability. The LAT tracker use conversion foils of tungsten (Z=74).
The technology employed in past years in High Energy Physics has been fundamental to choose the tracking detectors, since the alternatives were gas-filled trackers and scin-tillating fibers detectors. The silicon-based detectors were chosen for the LAT because of their higher sensitivity and angular resolution. A scheme of the LAT Tracker is dis-played in Fig. 2.7.
In addition the silicon detectors have been successfully employed as vertex detectors in many High Energy Physics experiments and also in space missions. In particular the cost of these detectors is decreased in the last years, allowing an extensive usage in experiments like the LAT, that requires a wide sensitive area. The total silicon surface of the LAT tracker is of about 82 m2
. Wih respect to previous gas-based detectors the silicon detectors use for the LAT offer many significative advantages:
• Long lifetime; • High efficiency; • Stability;
• No consumables
• Operation at relatively low voltages; • Low dead time;
Figure 2.7: Schematic view of the GLAST LAT Tracker.
The LAT Tracker presented some tecnological challenges that have been studied, mainly the number of channels have been extensively studied and optimized.
The solution have been found as a tradeoff between silicon strip length,number of chan-nels and angular resolution and readout noise. The chanchan-nels number impact directly the readout power budget and the thermal design of the instrument. The mechanical design must also accomodate the transfer of heat dissipated in each module. With care-ful design 200 µW per channel appeared feasible.
Another aspect that is related to number of channels is the onboard computation power. In order to reduce computation effort on a single processor, each module of the Tracker has an independent readout and trigger system that operate in a semi-autonomous way. As for the other part of the LAT, carefully studies have produced the parameters for the Tracker in order to satisfy all the requirements and mantain the basic constraints as low consumed power, low detector noise and low computation power required.
2.5.1
Structure of the Tracker
The LAT tracker has been designed with the same basic ideas of modularity and redun-dancy of the whole LAT. The basic unit is a square Silicon Strip Detector (SSD) with the size of 8.95 cm x 8.95 cm, where are implanted 384 parallel microstrips spaced by 228 µm .
Four SSDs, each of them is 400 µm thick, are then assembled in a ladder. In a ladder the end of each microstrip of a SSD can be connected to the end of the correspondent microstrip on the adjacent SSD in order to form a single longer microstrip. At this point 4 ladders are assembled to form a sensitive silicon microstrip layer, which will be then inserted in a tray. The scheme of a tray is displayed in Fig. 2.8. A tray is a
Figure 2.8: Exploded view of a tracker tray.
composite structure with a mechanical structure in carbon fiber that bring at both faces a sensitive silicon plane. The main components of a tray are a detecting silicon layer on the top face, an aluminum core, a tungsten foil for the conversion of the γ-ray and another silicon layer on the bottom face of the tray. The two silicon layers are mounted in a tray with parallel orientation of the microstrips. Each tray is then connected to the reading electronic, with the GLAST Tracker Front End (GTFE) chips are directly connected to the end of the microstrips.
Trays are then piled up with a separation of 2 mm and each tray is rotated of 90◦ with
respect to the adjacent tray. In this way the resulting system is made by a conversion foil followed by a couple of silicon layers with perpendicular microstrips in order to have XY detection capability. The resulting module is called tower and it is made by 19 trays with 18 XY detection layers. In Fig. 2.9 are diplayed the scheme of a LAT tracker tower compared with a real tower assembled in the INFN laboratory in Pisa. All trays are identical, except for the top and the bottom tray, that have a special mechanical interface for installing in the rest of the LAT.
The first 12 top trays are 0.03 R.L. thick, the following 4 are 0.18 R.L. thick, while the last 3 trays does not have conversion foils.
The different thickness of the conversion foils comes from the design strategy. The con-version foils should be thin in order to reduce the effects of the Multiple Scattering and Bremsstrahlung emission, than strongly limit the angular resolution. This will guarantee a better Point Spread Function (PSF). On the other side the total thickness should be high in order to increase the conversion probability and then the effective area.
The designers have then decided to divide the tracker in two parts, a front section and a back section. The front section is made by the first 12 layers with the most thin conver-sion foils, in order to have a good PSF on the low-energy γ-rays. The back section with the most thick foils should maximize the conversion of the high-energy photons, even with a lower angular resolution. Anyway for these layers in fact the resolution would be lower, because the particles after been tracked, exit the tracker without permitting to measure other points in they trajectory. Last 3 trays does not have conversion foils
Figure 2.9: Left: Scheme of a LAT Tracker tower. Right: Picture of a completed Tracker tower.
in order to permit the start of a L1 trigger. For the tracker this condition is called Three-in-a-row, i.e. 3 planes have triggered.
The total tracker width is 1.3 R.L. because an higher value would make the energy resolution worst.
The total 4 x 4 tower array form the LAT silicon tracker. During the assembly of each tower the single components have been continuously tested electronically. In addition the trays and the towers have undergone thermal and thermovacuum tests and mechan-ical vibrational tests, in order to test the functionality in space environments and to avoid problems due to the vibrations during launch.
The LAT Tracker have been assembled in Italy under the coordination of the Italian collaboration and has been successfully completed in September 2005.
2.6
The LAT Anticoincidence detector
One of the main problems of the LAT during orbit will be the discrimination of the γ-rays from the background made of charged particles. In γ-ray missions a system often used is the Anticoincidence detector (Moiseev et al., 2007).
When a γ-ray photon enter the LAT, it does not produce any signal in the Antico-incidence detector, but give a signal in the tracker and in the calorimeter due to the produced pair. A charged particle behaves differently, since during the passage a signal also in the Anticoincidence is produced, then it is possible to recognize a γ-ray from a charged particle thanks to the different signature in the subsystems and in particular in the ACD. The events that give signal in the Tracker and in the Calorimeter but not in the ACD can start the trigger, the other are refused as background events.
The LAT AntiCoincidence Detector (ACD) is made by a set of plastic scintillators cou-pled to photomultipliers that uses wavelength shifters (WS) in order to increase the reading efficiency. With respect to the EGRET anticoincidence system, that was made
by a single module, the LAT ACD is fine segmented. A scheme of the ACD assembly is displayed in Fig. 2.10.
The ACD segmentation help to increase the efficiency of background rejection in par-ticular for the high-energy γ-rays. In EGRET it was necessary to reduce the triggers frequency in order to avoid gas consuming in the spark chambers. The EGRET ACD was implemented in the Level 1 trigger. This reduced the working efficiency, mainly at GeV-energies, where the self-veto becomes important. The self-veto happen when a
Figure 2.10: Schematic view of the LAT ACD assembly.
member of the electromagnetic shower produced by the e−-e+pair is deflected and give
a signal in the anticoincidence detector (backsplash). The event has a signature of a cosmic ray and then it is rejected since it is confused with a background event.
Thanks to the segmentation it is possible to know exactly which scintillator have been hit, and it is then possible to compare the track direction with the position of the hit scintillator. In case of backsplash the position of the hit scintillator panel does not correspond exactly with the intersection of the track and the ACD, then a self veto is recognized and avoided.
Thanks to the lower dead time and to the absence of consumables in the Tracker, the LAT can undergo a much higher Level 1 trigger frequency, then the ACD can be inserted in the Level 2 trigger. In this way each event can be analyzed with more care (as will be explained in the following Section) and the self-veto can be avoided in a very efficient way.
A total of 89 panels constitute the ACD, some of them are disposed in a 5 x 5 array on top of the Tracker and the other are at the sides of the LAT.
and scintillating fibers covering the gaps in the other dimension. Each scintillator is read out by an interleaved set of Wavelength Shifting (WS) fibers, with bundles connected to two phototubes, in order to guarantee redundancy.
The ACD is the first step in the background rejection scheme, and the required rejection factor at this stage is about 3×10³
:1.
2.7
Data Acquisition System and Trigger
The LAT Data Acquisition System (DAQ) have three main functions(”Michelson, 2000). First of all it controls the trigger, then it guides the event reading sequence and store it in a temporary memory. The DAQ also manage the data elaboration and transfer to the ground.
This system also is responsible for other functions, among others the control and mon-itoring and housekeeping of the instrument and the power management of the whole LAT.
The DAQ is made by 16 Tower Electronic Modules (TEM) located below each tower and two TEM specific for the ACD. Also two Spacecraft Interface Unit TEM are in this system and are located in the spacecraft below the LAT.
2.7.1
The LAT Trigger
The LAT trigger has a multi-level structure, in a similar way of the triggers employed in High Energy Physics experiments.
In particular the hardware trigger is based on special signals, called primitives, that originate from from LAT subsystems. Primitives from Tracker, Calorimeter and Anti-coincidence Detector are combined to decide if an event is recorded or no.
The trigger of the LAT is very flexible in order to allow change of configuration to opti-mize trigger efficiency and versatile in order to accomodate various signatures of events. One possible implementation is the one proposed in LAT proposal.
The Level 1 Trigger (L1T) is managed by the hardware electronics, while the Level 2 Trigger (L2T) is managed by the TEM of each tower. The Level 3 Trigger (L3T) filters the results of the L1T and L2T in order to reduce the amount of data to be sent to the ground. The events selected by the L3T are then stored in the Space Solid State Recorder (SSSR) before the transmission.
With respect to this original project, there are some chages, for example the ACD signal is used for the L1T. Testing of the trigger are currently done and will be performed also on flight by commands from the ground.
The goal of the L1T is to begin the reading sequence, and it is expected that this trigger will start with a frequency of few kHz. Each tower forms independently a trigger and the global trigger is the logic OR of the single trigger at tower-level. A tower trigger can be initiated by two conditions that can happen in the tracker and in the calorimeter. The Tracker trigger is made by the logic OR of the signals of every GTFE channel. This asynchronous OR is called Fast OR and it is send from each tracker layer to the TEM. The logic system of the TEM search for coincidences in the XY layers and then for the coincidences of 3 consecutive XY planes (Three-in-a-row condition). Simulations have shown that this system is very efficient also for the photons misaligned with the axis of
the tower. In order to reduce the noise associated with the electronics it is possible to apply a mask to the read channels in order to avoid the noisy channels.
The trigger in the Calorimeter is based on the counts of the scintillating bars that have given a signal in coincidence. This system is based on two threshold for every crystal face in the Calorimeter. In flight the Low-Energy Level trigger threshold (CAL-LOW) will be set to 100 MeV. This will allow the identification of at least 30% of the γ-rays above 1 GeV that does not convert in the Tracker. Another trigger threshold is called High-Energy Level (CAL-HIGH) and it is set to 1 GeV. CAL-HIGH trigger plays a role when there are events with an high energy deposit in the calorimeter. In this case the CAL informs the TEM that an high-energy event has occurred. If any crystal goes above threshold, a trigger primitive from the Calorimeter is sent.
The AntiCoincidence detector has also two thresholds for every scintillator tile. One (VETO) is set to 1/2 MIP and is meant to veto charged particles. The other (CNO) is set to several MIPs to trigger on cosmic ray ions for CAL calibration.
Since the timing of the primitives is different for the individual subsystems each trigger line has an input delay which has to be set such that all trigger primitives arrive at the central trigger unit at the same time. In order to be sure that all primitives arrive at the proper time, a calibration on timing is needed.
There are also other trigger sources prepared for different purposes, e.g. external trigger for ground testing, periodic trigger, and software trigger.
The L2T is elaborated in parallel by all TEM modules and serve to combine the in-formation of the L1T with the ACD signal. First of all a simple track reconstruction algorithm is applied and an extrapolation of the track into the ACD is performed by looking for an ACD signal. This strategy allow the recognition of a backsplash event. This check of the track is not performed in case of a CAL-HIGH signal, because it could be due to a secondary particle that could cause a self-veto. It is estimate that the fre-quency of the L2T is of about 1 kHz.
Finally the software trigger L3T is executed by the SIU modules and give a complete reconstruction using the information of all subsystems. There are no many cuts to the event and the only significant reduction is in the removal of the albedo γ-rays coming from the Earth. The resulting frequency of the events is 15 Hz and the amount of data have been reduced to be trasferred to the ground.
2.8
LAT expected performances
LAT has the typical structure of a pair conversion telescope, i.e. Tracker, a Calorimeter and AntiCoincidence detector and every subsystem is designed with very high require-ments (”Michelson, 2000; Digel & Myers, 2001). In addition every subsystem of the LAT is based on new High Energy Physics detectors. By comparing LAT performances with EGRET, as done in the Table 2.1, it turns out that LAT will have a superior resolution and sensitivity that will guarantee a big amount of scientific discoveries. One of the main characteristics of LAT is the angular resolution that reach 0.1◦at high energies.
The angular resolution is not so good at lower energies because the measurement of the tracks is limited by the Multiple Scattering that increases at low energy. At high energy the only factor that limit resolution is the microstrip pitch, while the Multiple Scattering contribution becomes negligible. On the other side it is not possible to have
EGRET GLAST LAT (min. req.) GLAST LAT
Energy range 20 MeV-30GeV 20 MeV-300 GeV 10 MeV-1TeV
Angular Resolution 5.8 (E=100 MeV) < 3.5 (E=100 MeV) Front: 3.1 (E=100 MeV)
single photon < 0.15 (E>10 GeV) Total: 4.4 (E=100Mev)
( 68% containment) Front: 0.074 (E=10 GeV)
Total: 0.1 (E=10 GeV) Effective Area 1500 cm2
8000 cm2
12900 cm2
peak
Field Of View 0.5 sr > 2 sr 2.4 sr
Resolution 10% 10% (0.1-100GeV) 10% (0.1-100GeV)
in energy 50% (20-100MeV) < 25% (20-100MeV)
Dead Time 100 ms < 100 µs 20 µs
Sensitivity 2 x 10⁻⁷ ph cm−2 s−1 4×10⁻⁹ ph cm−2 s−1 1.6 x 10⁻⁹ ph cm−2 s−1
Table 2.1: LAT Expected performances compared with EGRET. Quoted sensitivity for the LAT is referred to sources out of the Galactic plane
too many channels mainly because of limitation of total power consumption.
The effective area of the LAT is much higher than EGRET, mainly thanks to the higher geometrical sensitive surface of the LAT Tracker and to the lower dead time of silicon detectors. The effective area decreases at very high energies (E≃200 GeV). One of the main reasons for this decrease it incomplete shower containement, that makes difficult the reconstruction of photon energy and direction.
One of the main parameters for a telescope is the Field Of View (FOV), that allow the instrument to observe a big portion of the sky. The LAT FOV will be of about 2.3 sr, about five times grater than the FOV of EGRET. This difference is due to the different detectors employed by LAT and EGRET, that constrained the aspect ration of the instrument, as described in Sec. 2.1.1.
The better LAT energy resolution is achieved through the fine segmentation of the calorimeter. In this manner it is possible a better reconstruction of shower develop-ment.
LAT will have a much higher sensitivity than EGRET, such that in one day the faintest EGRET source is detectable. This will allow the LAT to discover a lot of new sources and build a very extended catalog of high energy sources in the sky.
A set of plots showing the expected LAT performances is shown in Fig. 2.11.
2.9
MonteCarlo simulations of the LAT
During LAT design and during the study of the LAT capabilities it is very useful to have a complete MonteCarlo simulation of the LAT. This MonteCarlo has been also val-idated during important milestones in the GLAST mission like the 2006 LAT beamtest at CERN. Presently the GLAST collaboration has provided a detailed MonteCarlo sim-ulation of the LAT called Gleam, while a fast observation simulator is also present (Observation Simulator, see Sect:2.10).
Figure 2.11: LAT detector performance compared with EGRET for a point source ob-servation.(”Michelson, 2000)
Gleam is based on the Gaudi1
framework often used in High Energy Physics. Gaudi has been designed in order to provide an environment for developing applications and algorithms useful for the generation of events and for the reconstruction and analysis of them. The data that can be manipulated are the event variables, e.g. energy and direction, or the detector characteristics, e.g. geometry of materials.
A first type of algorithms for the generation of events. Different types of particles can be generated, among others γ-rays . For every particle it is possible to specify an en-ergy and direction or give a spectral distribution in order to reproduce emission from a particular source, e.g. a pulsar. The data relative to a source can be inserted in a XML file in a source model.
The LAT geometry is managed by Gleam through XML files where information about sizes and materials are stored. The simulation of the particle interactions with the de-tector is managed using the libraries of Geant42
, the C++-based toolkit used in most of the High Energy Physics experiments simulations today. The simulation can be run in graphical mode or in command-line mode in order to save memory. The Graphical User Interface (GUI) can be switched between the basic one and FRED3
, an advanced Event Display developed mainly in Italy. FRED can be also used for displaying real data, e.g. from the test beam. In Fig. 2.12 an cosmic ray event on 8 LAT towers is displayed with
1 http://proj-gaudi.web.cern.ch/proj-gaudi/ 2 http://geant4.web.cern.ch/geant4/ 3 http://www-glast.slac.stanford.edu/software/Display/FredDisplay.htm
FRED. Fig. 2.13 show a simulated 5 GeV photon entering the LAT
There is the possibility to simulate the GLAST orbit or to keep the LAT fixed, i.e. for
Figure 2.12: An example of an event viewed with the FRED Event Display.
simulating Beamtest setup.
The hit parts of the detectors can be highlighted with different colors and also the recontructed tracks can be visualized in the GUI. A set of Digitization algorithm
simu-Figure 2.13: An example of a 5 GeV photon entering the LAT viewed by the Gleam defaut GUI.
late the conversion from to digital signal in the detectors and then a set of opportune Reconstruction algorithms allow to determine the reconstructed energy and direction of the simulated incoming particle. The data relative to the MonteCarlo events, the
Digitization and the Reconstruction can then be stored into ROOT4
trees to be used for analysis.
2.10
The GLAST
Science Analysis Environment
Another major component of the GLAST software is devoted to the Data Analysis. The GLAST Collaboration has developed a suite of analysis tools called Science Anal-ysis Environment (SAE). The purpose of the SAE is to collect a set of useful software for managing the data coming from the LAT and GBM.
The concept of the SAE is similar to the suite of analysis tools developed for the CGRO mission and presently available at the NASA High Energy Astrophysics Soft-ware Archive(HEASARC)5
. In this site is possible to retrieve not only the data from several High Energy Astrophysics missions, but also a lot of useful software for manag-ing astrophysical data and packages for analyzmanag-ing mission-specific data.
The SAE is composed by some sections that contain tools for specific purposes. The SAE contains also the definition of the LAT Data Format6
. A Diagram of the full SAE is displayed in Fig.2.14
2.10.1
Data Format
The communication between tools is guaranted by FITS files, in order to be compliant with this wide-used standard in astrophysics. In this way both the events data and other analysis data are stored under this format with different names that begin. The detailed description of the header content of each F T file can be found at(The LAT Instrument Team, 2004).
The data relative to each event are contained in the F T 1 files, where the user can find the main high-level information for every photon event, e.g. energy, time, direction. Also some details relative to the reconstruction are stored in the F T 1 files, e.g. the conversion layer or the cosines of the reconstructed track.
The F T 2 file contains the data relative to the orbit of the satellite and its position in time. This data files are of particular importance for pulsar analysis, since they are used for barycentric corrections.
The F T 3,F T 4 and F T 5 contain data that can be used for spectral analysis using XSpec software7
, in particular F T 3 refer to the PHA spectrum files, the F T 4 to the Auxiliary Matrix File (AMF) files and F T 5 to the Response Matrix Files (RMF).
The F T 7 files contain the data relative to exposure, that for example can be used during the likelihood calculations when studying the stationary sources.
The last data file, called F T 8, should contain the source definition. This files are im-portant for observation simulations and also for likelihood calculations.
Another set of FITS data file form the Databases (D). For pulsar analysis the Pulsar
4
http://root.cern.ch 5
http://heasarc.gsfc.nasa.gov/docs/software.html 6
A detailed definition of the SAE can be found at:
http://www-glast.slac.stanford.edu/ScienceTools/slwg/SAE/default.htm(The LAT Instrument Team, 2004)
7
Figure 2.14: The diagram containing all the tools of the Standard Analysis Environment (SAE).
Database (D4) and the LAT Point Source Catalog (D5) are of particular importance. The D4 contains the ephemerides of a set of targeted pulsars that can have a γ-ray coun-terpart and that can be of interest for GLAST. This database contains also the infor-mation about orbits of selected binary pulsars of interest for GLAST. The D5 contains
the Catalog of point source that have been detected by spatial analysis through various methods, e.g. maximum of likelihood. The LAT Catalog is important for pulsar anal-ysis since it can give the position of potential γ-ray pulsars that need to be identified through timing analysis.
2.10.2
Science Tools
The GLAST Science Tools are divided in main subclasses depending upon the tool functionality: the main classes are the Utilities(U), the Analysis Tools(A), the User Interface(UI) and the Observation Simulation Tools(O).
The Utilities contain several tools that have a wide use, e.g. that can allow the user to select a subset of photons according to some particular selection cuts, or can gen-erate the exposure maps useful for the likelihood analysis. The utilities in the SAE specific for pulsar analysis are the Photon Arrival Time Converter (U 10), that perform the barycentric corrections, the Pulsar Ephemeris Extractor (U 11) that extract form D4 ephemerides related to a particular pulsar under analysis and the Pulsar Phase Assign-ment(U 12), that assign a phase to each photon according to a particular ephemeris. The Analysis tools contain the most complex software for data analysis, in particular the Likelihood tool for spatial analysis (A1) and several tools for GRB timing and spec-tral analysis. The Analysis tools useful for pulsar analysis are the Pulsar Periodicity Testing tool (A3), that perform basic periodicity test on a set of baricenterized photons (Chi-Squared test, Z2
n test and H-test). Another tool currently under development is
the Pulsar Period Search tool (A4), that has not yet reached a stable version.
The Observation Simulation part of the SAE is composed by 2 main tools, the Live-time/pointing simulator, that simulate the GLAST position with time given a specific orbit as input, and the Observation Simulator (O2), that takes a sky model with some sources and simulate a LAT observation according to a specific observational time win-dow. The difference between Observation Simulator and Gleam is that the former is much faster since it make a convolution of the input photons with the Instrument Re-sponse Functions if the LAT, instead of computing each interaction of each photon in the detector. For the purpose of studying LAT response to some objects, that does not need a very high detailed knowledge of the detector behaviour, the Observation Simu-lator is pretty good.
The User Interface tools contains some software for plotting data and for event display and are currently still under development and definition.
2.11
LAT status
The construction and assembly of the LAT subsystems have been completed during 2005. The schedule for the 2006 was devoted to the assembly of the LAT, the vibra-tional and environmental tests and the integration with the GBM. In Fig. 2.15 it is displayed the LAT before the installation of the ACD and the micrometeorites shield. The Termovacuum tests have been performed at the Naval Research Laboratories and have been completed successfully.
Meanwhile during Summer 2006 an italian-french team coordinated the LAT Beamtest at CERN. During this beamtest a Calibration Unit (CU) has been exposed to the beam
Figure 2.15: A picture of the complete LAT before installing the ACD.
at the CERN PS and SPS. The goal of this beamtest was to study the detectors response to γ-rays, electrons, positrons, pions, positrons at various energies from 100 MeV up to about 280 GeV. The LAT have been integrated into the spacecraft together with the GBM and will be then transferred to the NASA Kennedy Space Center. The launch is scheduled for winter 2007.
2.12
Summary
In this Chapter an overview of the GLAST Large Area Telescope have been given. The basic detecting strategy of the LAT have been discussed and the comparison between LAT and LAT have been presented.
LAT is the results of careful science driven design that imposed specific Science Require-ments In order to design an instrument like the LAT various possible configurations must be considered and all the variables must be taken into account in order to have a trade off among low readout power, low computing power, low noise, high efficiency and reso-lution and while mantaining cost low. The use of silicon detectors for the LAT Tracker has offered a good solution to these problems a by offering very high performances. The stucture of the main LAT Subsystems have been discussed with detailed informa-tion of the tecnical choices for every detector. At the end the MonteCarlo simulainforma-tion of the LAT and the Science Analysis Environment containing the LAT data analysis software have been presented since it will be used extensively in this thesis.