A metabolomics-driven approach to predict cocoa product
consumption by designing a multimetabolite biomarker
model in free-living subjects from the PREDIMED study
Mar Garcia-Aloy1,2, Rafael Llorach1,2∗, Mireia Urpi-Sarda1,2, Olga Ja´uregui2,3, Dolores Corella4,5, Miguel Ruiz-Canela5,6, Jordi Salas-Salvadó5,7, Montserrat Fitó5,8, Emilio Ros5,9,
Ramon Estruch5,10 and Cristina Andres-Lacueva1,2
1Biomarkers & Nutrimetabolomic Lab, Nutrition and Food Science Department, XaRTA, INSA, Campus
Torribera, Pharmacy Faculty, University of Barcelona, Spain.
2INGENIO-CONSOLIDER Program, Fun-C-Food CSD2007–063, Spain.
3Scientific and Technological Centers of the University of Barcelona (CCIT-UB), Barcelona, Spain.
4Department of Preventive Medicine and Public Health, University of Valencia, Valencia, Spain.
5CIBER Fisiopatolog´ıa de la Obesidad y Nutricio´ n (CIBERobn), Instituto de Salud Carlos III (ISCIII),
Madrid, Spain.
6Department of Preventive Medicine and Public Health, Medical School, University of Navarra, Pamplona,
Spain.
7Human Nutrition Unit, Hospital Universitari de Sant Joan de Reus, Institut d’Investigacio´ Sanitària Pere
Virgili (IISPV), Universitat Rovira i Virgili, Reus, Spain.
8Cardiovascular Risk and Nutrition Research Group, IMIM-Institut de Recerca del Hospital del Mar,
Barcelona, Spain.
9Lipid Clinic, Endocrinology and Nutrition Service, Biomedical Research Institute August Pi i Sunyer
(IDIBAPS), Hospital Clínic, Barcelona, Spain.
10Department of Internal Medicine, Hospital Clinic, Institut d’Investigacions Biom` ediques August Pi
Sunyer (IDIBAPS), Barcelona, Spain.
*Correspondence: Cristina Andres-Lacueva and Rafael Llorach. Biomarkers & Nutrimetabolomic Lab., Nutrition and Food Science Department, Campus Torribera, Pharmacy Faculty, University of Barcelona, Av. Joan XXIII s/n, 08028 Barcelona, Spain. E-mail: [email protected] and [email protected]. Phone: +34.934034840. Fax: +34.934035931.
ABSTRACT
Scope: The aim of the current study was to apply an untargeted metabolomics strategy to
characterize a model of cocoa intake biomarkers in a free-living population.
Methods and results: An untargeted HPLC-q-ToF-MS based metabolomics approach was
applied to human urine from 32 consumers of cocoa or derived products (CC) and 32 matched control subjects with no consumption of cocoa products (NC). The multivariate statistical analysis (OSC-PLS-DA) showed clear differences between CC and NC groups. The discriminant biomarkers identified were mainly related to the metabolic pathways of theobromine and polyphenols, as well as to cocoa processing. Consumption of cocoa products was also associated with reduced urinary excretions of methylglutarylcarnitine, which could be related to effects of cocoa exposure on insulin resistance. To improve the prediction of cocoa consumption, a combined urinary metabolite model was constructed. ROC curves were performed to evaluate the model and individual metabolites. The AUC values (95% CI) for the
model were 95.7% (89.8–100%) and 92.6% (81.9–100%) in training and validation sets, respectively, whereas the AUCs for individual metabolites were <90%.
Conclusions: The metabolic signature of cocoa consumption in free-living subjects reveals that
combining different metabolites as biomarker models improves prediction of dietary exposure to cocoa.
Abbreviations: AUC, area under the curve; CC, cocoa consumers; FFQ, food-frequency
questionnaire; MVA, multivariate analyses; NC, nonconsumers of cocoa; OSC-PLS-DA, partial least squares discriminant analysis with orthogonal signal correction; ROC, receiver operating curve; VIP, variable importance for projection
Keywords: Biomarker model / Cocoa / HPLC-q-ToF-MS / Metabolomics / Nutrition
1. INTRODUCTION
Due to the complexity and limitations of traditional dietary assessment tools, in addition to their inherited measurement biases, there is a growing interest in the implementation of dietary biomarkers in nutritional epidemiology as objective measures of dietary exposure [1]. Recently, the food metabolome has been proposed as a novel data-driven approach to improve dietary consumption measurements and uncover new food biomarkers [2]. Biomarkers of dietary consumption are defined as the compounds characteristic of a dietary constituent that discriminate consumers from nonconsumers [1]. However, most food constituents are broadly present in different foods, hence they are not unique to a specific food item. This fact adds complexity to the discovery of new food biomarkers and means that only a few compounds can be considered as biomarkers of a particular dietary constituent, such as proline betaine for the consumption of citrus fruits [3] or resveratrol for wine [4]. To overcome this issue, a combination of food-derived metabolites could provide a more accurate and precise measurement of consumption. However, this field has been practically unexplored for the discovery of dietary biomarkers [2].
There is a growing body of evidence on the beneficial health effects of cocoa consumption, especially in relation to cardiovascular diseases [5]. To better examine the link between cocoa consumption and health outcomes, an accurate and objective assessment of dietary exposure to
cocoa products is required. Various controlled dietary intervention studies have used both untargeted [6-8] and targeted approaches [9-11] on urinary excretion profiles associated with acute and chronic cocoa interventions and reported host and microbiota metabolites as conventional candidates for biomarkers of cocoa consumption. Nevertheless, not all of the proposed cocoa consumption biomarkers have been studied in populations under free-living conditions. Although some studies on dietary patterns [12] and food items [3, 13, 14] have already been conducted in free-living subjects, to our knowledge no study has evaluated the urinary metabolome of habitual cocoa consumers in a free-living population. This kind of study could provide more realistic data about differences in metabolome according to habitual cocoa consumption.
In this context, the aim of the current study was to apply a metabolomics strategy to develop a potential model of cocoa intake biomarkers in a free-living population not submitted to dietary recommendations.
2. MATERIALS AND METHODS
The present report was designed and conducted as a cross-sectional study using baseline data and urine samples of 275 participants from the PREDIMED study.
2.1. The PREDIMED study
The PREDIMED study was a large, parallel-group, multicentre, randomized, and controlled clinical trial (ISRCTN 35739639; http://www.predimed.org). It was designed to assess the effects of the Mediterranean diet on the primary prevention of cardiovascular diseases in a high-risk population. The details of the trial have been published elsewhere [15]. Briefly, participants were men (55–80 years) and women (60–80 years) with no cardiovascular disease at enrolment and fulfilling at least one of the two following criteria: presence of type 2 diabetes mellitus or at least three conventional cardiovascular risk factors [15]. The samples used in the present study were baseline spot urines collected and stored according to the PREDIMED study protocol. In parallel to these, dieticians administered to participants a validated semiquantitative 137-item food-frequency questionnaire (FFQ) [15]. The PREDIMED trial protocol was conducted according to the Declaration of Helsinki and was approved by the institutional review boards of all the centres involved. All participants provided written informed consent.
2.2. Sample selection according to cocoa consumption
In order to assess the biomarkers of cocoa exposure by a metabolomics approach, baseline urine samples from three PREDIMED trial centres (Barcelona, Valencia, and Navarra) were matched to corresponding individual FFQ data. Two cocoa consumer groups were formed: (i) nonconsumers (NC), i.e., individuals who never consumed any (0 g/day) of three FFQ-defined cocoa-containing food items: chocolate, cocoa powder or chocolate chip cookies; and (ii) cocoa consumers (CC), i.e., subjects with consumption of at least three servings/week of chocolate (serving size, 30 g) and/or cocoa powder (serving size, 5g), whereas chocolate cookie consumption was not taken into consideration in this second group due to the very low amount of cocoa per serving. There were 32 subjects defined as CC and 192 defined as NC (the other 51 participants did not fulfil any criteria from both cocoa consumer groups). In order to reduce the potential sources of variability not related to cocoa exposure, one NC was selected for each CC. NC subjects were matched to CC subjects by sex (male or female), age (≤67 or >67 years), energy intake (≤2000 or >2000 kcal), and centre (Barcelona, Valencia or Navarra). Furthermore, the two groups had to be homogeneous regarding body mass index, leisure time physical activity, smoking habit, diabetes status, presence of hypertension and dyslipidaemia, and use of insulin, oral antidiabetics, lipid-lowering drugs and antihypertensive drugs.
2.3. Sample preparation, HPLC-q-ToF-MS analysis, and data acquisition
Sample preparation and data acquisition was based on methodology previously published by our group [6, 7]. HPLC-q-ToF-MS analyses were performed using an Agilent 1200 Series Rapid Resolution HPLC system coupled to a hybrid quadrupole TOF (QTOF) QSTAR Elite (AB Sciex).
2.4. Data processing
The HPLC-q-ToF-MS raw data were extracted and aligned using MarkerView TM 1.2.1. software (AB Sciex; Toronto, Ontario, Canada). Data from negative and positive ionization modes were included in two separate data sets in order to analyze them individually. Peak detection was performed as specified elsewhere [6, 7]. A 0.05 Da mass tolerance range was used for alignment. RT tolerance windows were 0.10 and 0.14 min for negative and positive ionization mode data sets, respectively. Mass features that were missing in at least 20% of samples from both groups were considered to be noise and excluded from further analyses [16].
2.5. Data analyses and biomarker selection: Metabolic profiling differentiation
Principal component analysis was applied to evaluate the quality of the data acquisition. Multivariate analyses (MVA) were performed using SIMCA-P+ 13.0 software (Umetrics, Umeå Sweden). Partial least squares discriminant analysis with orthogonal signal correction (OSC-PLS-DA) was used to examine between-group differences. As this study involved samples from free-living subjects, OSC filtration was applied to reduce the variability not associated with dietary classification, i.e., differences in lifestyle, dietary habits or drug prescriptions within the given population in the days before sample collection [13]. The data set was log-transformed and Pareto-scaled prior to MVA. The quality of the models was evaluated by R2Y(cum) and Q2(cum) parameters. Model validation was evaluated by a permutation test (n = 200). Those variables with the highest variable importance for projection (VIP) values (cut-off ≥1.5) were selected as the most relevant to explain the differences in metabolic profile. In parallel, Mann–Whitney analysis or independent sample t-test were performed on the OSC filtered dataset, according to their distribution. The Kolmogorov– Smirnov test was used to check data distribution.
2.6. Identification of metabolites
A method combining computational-assisted metabolite identification and LC-MS profile analysis was applied [6, 7] on the basis of exact mass (±5 mDa), which was compared to those registered in HMDB, KEGG, and METLIN. In addition, an in-house database focused on cocoa-derived metabolites was employed [6, 7] using an automated identification algorithm implemented in an R package [17]. The biological interpretation was performed using information from relevant scientific bibliographies and online databases such as HMDB and KEGG.
2.7. Venn diagram
A Venn diagram was created [18] in order to plot which identified metabolites overlapped with previous studies from our group on biomarkers of cocoa exposure with different study designs [6, 7].
2.8. Developing models of combined urinary markers
We designed a prediction model and constructed receiver operating characteristic (ROC) curves to evaluate the accuracy of the model and of each discriminatory metabolite using filtered data from the OSC-PLS-DA analysis.
First, the data set was randomly split into two-thirds for training (n = 42) and one-third for validation sets (n = 22). Then, a forward stepwise logistic regression model was constructed on the training sample set in order to design the best combination of metabolites for cocoa consumption prediction. This analysis was conducted using IBM SPSS Statistics 20 software (SPSS Inc., Chicago, IL, USA). The model was constructed employing the dichotomous variable of cocoa consumption (yes/no) as dependent variable and those metabolites which overlapped in the three studies according to the results of the Venn diagram as independent variables (continuous).The correlation between cocoa intake and the combined model was evaluated using Spearman's rank correlation coefficient.
ROC curves were used to evaluate the accuracy of this model, in addition to separate evaluation of discriminatory metabolites individually [19]. ROC curve analyses for the designed model were performed in training and in validation sets to evaluate the combined model and in the whole population when assessing individual metabolites. The global performance of each metabolite and biomarker model was evaluated by the area under the ROC curve (AUC) and by the determination of sensitivity and specificity at the optimal cut-off point defined by the minimum distance to the top-left corner.
3. RESULTS AND DISCUSSION
The mean (±SD) cocoa consumption of the consumer group was 18.3 ± 13.4 g/day. The subjects included were 18 (28.1%) men and 46 (71.9%) women, with age 67.0 ± 6.3 years and BMI 29.8 ± 3.7 kg/m2.
3.1. MVA of urinary metabolomic profiles
The principal component analysis of urine samples revealed that they were not clustered according to the order of injection (Supporting Information Fig. 1). The OSC-PLS-DA analysis resulted in two one-component models with satisfactory modeling and prediction results, indicating that both models were able to discriminate the cocoa consumption group. The quality
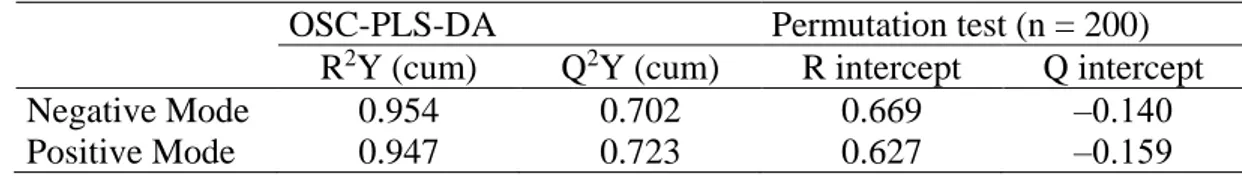
parameters of both OSC-PLS-DA models are summarized in Table 1. The obtained models were well validated by a permutation test [13].
Table 1. Summary of parameters for assessing the OSC-PLS-DA modeling quality
OSC-PLS-DA Permutation test (n = 200) R2Y (cum) Q2Y (cum) R intercept Q intercept
Negative Mode 0.954 0.702 0.669 ‒0.140
Positive Mode 0.947 0.723 0.627 ‒0.159
3.2. Metabolic footprint of cocoa product exposure
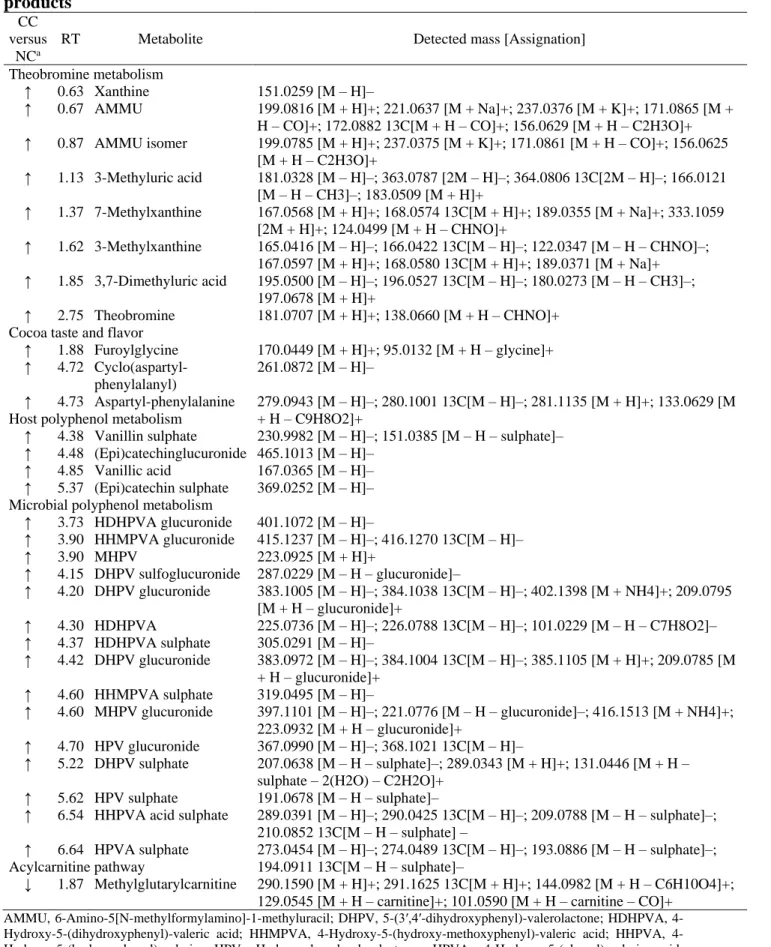
In order to select those markers with the largest contributions to the difference in urinary metabolome of each cocoa consumption group, VIP ≥1.5 was considered as the cut-off value. Based on this, we identified a total of 31 discriminating metabolites, as listed in Table 2. This table includes information about retention time, detected mass, and putative identifications of metabolites. Further information about statistical significance (p-value), VIP-values, mean of feature intensities from raw data, and the percentages of samples in which the feature was detected is provided by Supporting Information Table 1.
Cocoa products such as chocolate are important sources of phytochemicals, mainly polyphenols (flavan-3-ols), and purine alkaloids (theobromine) [8]. Additionally, cocoa manufacturing procedures, such as roasting or fermentation, alter its composition by incorporating new compounds. In this context, the obtained results are in accordance with previous controlled dietary intervention studies, in which different compounds derived from theobromine and polyphenol metabolism, manufacturing processes, and acylcarnitine pathways were identified [6, 7]. In particular, in the CC group there were higher urinary excretions of xanthine, 5-acetylamino-6-amino-3-methyluracil (AMMU), 3-methyluric acid, 7- and 3-methylxanthine, 3,7-dimethyluric acid, and theobromine. With regard to polyphenols, both host (epicatechin and vanillin metabolites) and microbial (hydroxyphenylvalerolactones and hydroxyphenylvaleric acids) metabolites were tentatively identified. Additionally, processing-derived compounds were also characteristic of the CC group. Levels of aspartyl-phenylalanine and cyclo(aspartyl-phenylalanil) were also elevated in the CC group. Cyclo(aspartyl-cyclo(aspartyl-phenylalanil) is a constituent of roasted cocoa nibs (metabocard HMDB31360). Furthermore, both compounds are degradation products of aspartame. Furoylglycine is a derivative of furan, which is a compound detected in roasted cocoa [20].
Table 2. Discriminating metabolites between nonconsumers and consumers of cocoa products
CC versus
NCa
RT Metabolite Detected mass [Assignation] Theobromine metabolism
↑ 0.63 Xanthine 151.0259 [M – H]–
↑ 0.67 AMMU 199.0816 [M + H]+; 221.0637 [M + Na]+; 237.0376 [M + K]+; 171.0865 [M + H – CO]+; 172.0882 13C[M + H – CO]+; 156.0629 [M + H – C2H3O]+ ↑ 0.87 AMMU isomer 199.0785 [M + H]+; 237.0375 [M + K]+; 171.0861 [M + H – CO]+; 156.0625
[M + H – C2H3O]+ ↑ 1.13 3-Methyluric acid 181.0328 [M – H]–; 363.0787 [2M – H]–; 364.0806 13C[2M – H]–; 166.0121 [M – H – CH3]–; 183.0509 [M + H]+ ↑ 1.37 7-Methylxanthine 167.0568 [M + H]+; 168.0574 13C[M + H]+; 189.0355 [M + Na]+; 333.1059 [2M + H]+; 124.0499 [M + H – CHNO]+ ↑ 1.62 3-Methylxanthine 165.0416 [M – H]–; 166.0422 13C[M – H]–; 122.0347 [M – H – CHNO]–; 167.0597 [M + H]+; 168.0580 13C[M + H]+; 189.0371 [M + Na]+ ↑ 1.85 3,7-Dimethyluric acid 195.0500 [M – H]–; 196.0527 13C[M – H]–; 180.0273 [M – H – CH3]–; 197.0678 [M + H]+ ↑ 2.75 Theobromine 181.0707 [M + H]+; 138.0660 [M + H – CHNO]+ Cocoa taste and flavor
↑ 1.88 Furoylglycine 170.0449 [M + H]+; 95.0132 [M + H – glycine]+ ↑ 4.72 Cyclo(aspartyl-phenylalanyl) 261.0872 [M – H]– ↑ 4.73 Aspartyl-phenylalanine 279.0943 [M – H]–; 280.1001 13C[M – H]–; 281.1135 [M + H]+; 133.0629 [M + H – C9H8O2]+
Host polyphenol metabolism
↑ 4.38 Vanillin sulphate 230.9982 [M – H]–; 151.0385 [M – H – sulphate]– ↑ 4.48 (Epi)catechinglucuronide 465.1013 [M – H]–
↑ 4.85 Vanillic acid 167.0365 [M – H]– ↑ 5.37 (Epi)catechin sulphate 369.0252 [M – H]– Microbial polyphenol metabolism
↑ 3.73 HDHPVA glucuronide 401.1072 [M – H]– ↑ 3.90 HHMPVA glucuronide 415.1237 [M – H]–; 416.1270 13C[M – H]– ↑ 3.90 MHPV 223.0925 [M + H]+ ↑ 4.15 DHPV sulfoglucuronide 287.0229 [M – H – glucuronide]– ↑ 4.20 DHPV glucuronide 383.1005 [M – H]–; 384.1038 13C[M – H]–; 402.1398 [M + NH4]+; 209.0795 [M + H – glucuronide]+ ↑ 4.30 HDHPVA 225.0736 [M – H]–; 226.0788 13C[M – H]–; 101.0229 [M – H – C7H8O2]– ↑ 4.37 HDHPVA sulphate 305.0291 [M – H]– ↑ 4.42 DHPV glucuronide 383.0972 [M – H]–; 384.1004 13C[M – H]–; 385.1105 [M + H]+; 209.0785 [M + H – glucuronide]+ ↑ 4.60 HHMPVA sulphate 319.0495 [M – H]– ↑ 4.60 MHPV glucuronide 397.1101 [M – H]–; 221.0776 [M – H – glucuronide]–; 416.1513 [M + NH4]+; 223.0932 [M + H – glucuronide]+ ↑ 4.70 HPV glucuronide 367.0990 [M – H]–; 368.1021 13C[M – H]– ↑ 5.22 DHPV sulphate 207.0638 [M – H – sulphate]–; 289.0343 [M + H]+; 131.0446 [M + H – sulphate – 2(H2O) – C2H2O]+
↑ 5.62 HPV sulphate 191.0678 [M – H – sulphate]–
↑ 6.54 HHPVA acid sulphate 289.0391 [M – H]–; 290.0425 13C[M – H]–; 209.0788 [M – H – sulphate]–; 210.0852 13C[M – H – sulphate] –
↑ 6.64 HPVA sulphate 273.0454 [M – H]–; 274.0489 13C[M – H]–; 193.0886 [M – H – sulphate]–; 194.0911 13C[M – H – sulphate]–
Acylcarnitine pathway
↓ 1.87 Methylglutarylcarnitine 290.1590 [M + H]+; 291.1625 13C[M + H]+; 144.0982 [M + H – C6H10O4]+; 129.0545 [M + H – carnitine]+; 101.0590 [M + H – carnitine – CO]+
AMMU, 6-Amino-5[N-methylformylamino]-1-methyluracil; DHPV, 5-(3′,4′-dihydroxyphenyl)-valerolactone; HDHPVA, Hydroxy-5-(dihydroxyphenyl)-valeric acid; HHMPVA, Hydroxy-5-(hydroxy-methoxyphenyl)-valeric acid; HHPVA, 4-Hydroxy-5-(hydroxyphenyl)-valeric; HPV, Hydroxyphenyl-valerolactone; HPVA, 4-Hydroxy-5-(phenyl)-valeric acid; MHPV, Methoxyhydroxyphenylvalerolactone; RT, retention time.
aRows indicate levels in consumers of cocoa products versus nonconsumers: ↑ and ↓ means higher and lower levels,
With respect to the endogenous metabolome, methylglutarylcarnitine showed reduced levels associated with habitual cocoa consumption. This metabolite belongs to the acylcarnitine class of compounds. Mass spectra of this metabolite is shown in Supporting Information Fig. 2. Fragments include the neutral loss of 77 and 161 amu corresponding to the loss of the trimethylamine moiety in addition to a loss of H2O and the loss of the carnitine backbone, respectively, as well as, the common fragments of the acylcarnitine family at m/z 85 and 144 [21]. The protonated molecule of methylglutarylcarnitine was observed in all samples in both groups, but was significantly more abundant in the NC group (Supporting Information Table 1). Zuniga and Li (2011) published the most comprehensive acylcarnitine profile in urine [21]. It was composed by a wide range of molecules with different chain lengths. Acylcarnitines are involved in mitochondrial lipid oxidation. They are originated from the conjugation of carnitine with fatty acids and promote fatty acid transport into the mitochondrial matrix for β-oxidation. The accumulation of these compounds has been related to insulin resistance through alterations in fatty acid β-oxidation in insulin-sensitive tissues, such as skeletal muscle [22]. In line with the present results, dark chocolate intake was previously associated with reduced levels of methylglutarylcarnitine together with other acylcarnitinies [8]. Indeed, this observation could reflect a potential mechanism of action for previously observed associations between chocolate or cocoa intake and improved insulin resistance [23].
3.3 Discriminant biomarkers of cocoa exposure replicated in studies with different designs
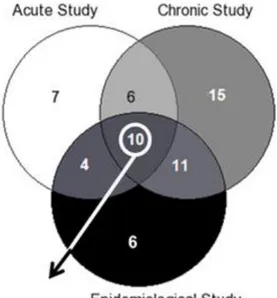
A large proportion of all identified metabolites characteristic of habitual cocoa product exposure under free-living conditions matched with biomarkers of cocoa intake previously proposed by our research group using different study designs [6, 7]. Figure 1 illustrates a Venn diagram that shows that ten metabolites were characteristic of cocoa exposure independently of the study design. They were characteristic of theobromine metabolism (AMMU, 3-methyluric acid, 7- and 3-methylxanthine, 3,7-dimethyluric acid and theobromine) as well as polyphenol microbial metabolites (methoxyhydroxyphenylvalerolactone, and glucuronide and sulphate conjugates of 5-(3′,4′-dihydroxyphenyl)-valerolactone). All of these compounds can be considered as medium-term markers of cocoa intake: theobromine-derived metabolites have been detected over a 24 h period [6, 24] and polyphenol metabolites derived from microbial metabolism are excreted after those derived from metabolism by host tissues [6]. Thus, these results reinforce the concept that, in free-living populations, slowly excreted compounds could be better biomarkers than those that are rapidly excreted [13].
Figure 1. Venn diagram showing overlapping and unique metabolites associated with cocoa consumption for the three types of study.
With this study we have completed the pipeline recently proposed by Heinzmann et al. [3] and Pujos-Guillot et al. [13], in which three studies with different designs were developed in order to discover biomarkers of dietary exposure. First, we conducted an acute study in which urine samples from ten volunteers who randomly consumed either a single dose of cocoa powder with milk or water, or milk without cocoa, were collected before and at different times during a 24 h period after the ingestion of the test meal, and were analyzed through untargeted metabolomics. In this study, 27 compounds were linked to cocoa consumption [6]. Subsequently, we performed a 4 wk crossover dietary intervention study with 20 subjects who received cocoa powder with skimmed milk or milk alone. After the analysis of 24 h urine samples from baseline and at the end of the intervention by the same untargeted metabolomics approach, 42 metabolites were identified as the most discriminating of regular cocoa consumption [7]. Finally, in the present study we examined the differences in urinary metabolome between individuals who reported regular consumption of cocoa products and those who reported no consumption. After the untargeted metabolomics analysis, we identified
a total of 31 discriminating metabolites. Ten of them have been reported in both previous studies, thus they could be the best candidates for biomarkers of cocoa consumption (Fig. 1). The reason for some metabolites not being shared among the three types of studies could be a different level of control of the diet and other lifestyle variables, the heterogeneity of the study population, the type of biological sample used or the amount of cocoa products ingested. Interestingly, the ten overlapping compounds remained discriminative of cocoa exposure in both middle-aged and older adults, as well as in healthy and high-cardiovascular risk individuals. Additionally, in the dietary intervention studies, the other sources of polyphenols were avoided during the days prior to the intervention, but subjects included in this analysis followed their habitual dietary habits, that is, these metabolites remained characteristic of cocoa consumption despite the fact that no dietary restriction was enforced prior to sample collection. Regarding the type of biological samples used, they were different in each study. In the first acute study urine samples were obtained before consumption and 6, 12 and 24 h after cocoa intake [6]. In the second study, 24 h urine samples were used [7] since they have been described as the best method for monitoring daily intake [25]. However, the collection of 24 h urines samples is impractical in large-scale epidemiological studies [25]. For that reason, the replication of these metabolites using spot urines from free-living subjects, as those from the present study, reinforces their discriminatory power for exposure to cocoa products. Finally, different amounts of cocoa were consumed: in the acute study, subjects received 40 g of cocoa powder, while in the long-term intervention trial, volunteers consumed two sachets/day of 20 g of cocoa powder. However, in the present study we still observed differential urinary metabolomic profiles explained by the same classes of metabolites despite the fact that the study subjects had weekly exposure to cocoa products. Because the proposed biomarkers have remained differential with the habitual amount of cocoa consumption and morning spot urines have been used, our results support the application of this metabolomic approach to other nutritional epidemiologic studies.
3.4 Proposed model of combined urinary metabolites as a new biomarker of intake
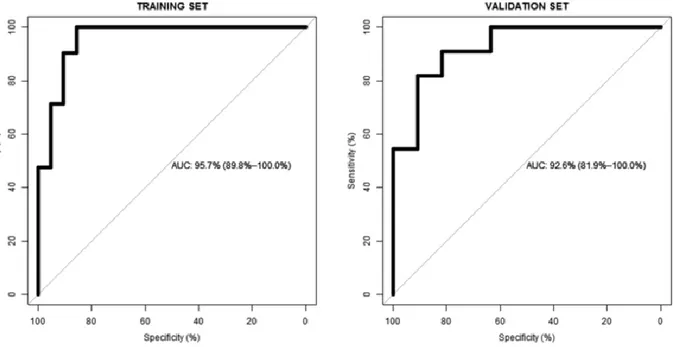
To improve the prediction of cocoa product exposure, a combination of more than one discriminatory metabolite was developed using the training set (Table 3). For this analysis, we considered those metabolites that were common to the three types of studies (Fig. 1). Because all overlapping metabolites were detected in positive ionization mode, the data set with this type of data was used. As a result, the model included 7-methylxanthine and 5-(3′,4′-dihydroxyphenyl)-valerolactone glucuronide. Reported daily cocoa product consumption correlated [r (95% CI)] significantly with values of the combined model [r = 0.74 (0.61-0.83); p < 0.001]. The performance of the designed model was evaluated by the AUC in both training and validation sets (Fig. 2). We also constructed ROC curves for the ten overlapping metabolites independently. Table 4 shows that the combination of metabolites is a better discriminator (AUC > 90% in both training and validation sets) than each metabolite individually (AUC < 90% in all cases), reinforcing the improved capacity of biomarker patterns to distinguish between different dietary exposures. It is important to note that one component of theobromine metabolism together with another from polyphenol microbiota metabolism were present in the combined model. Any of the other eight metabolites did not enter the model, probably as a result of colinearity in the information provided by these compounds. We hypothesize that this could be because all of those from the same metabolic pathways give similar biological or dietary information and when one is introduced in the model the others do not provide more relevant information. Thus, the two metabolites contributed to the combined model, giving complementary information about habitual cocoa intake.
Table 3. Metabolites selected by stepwise logistic regression model for the discrimination of cocoa product consumption using the training set
Metabolite Coefficient Standard error p-value 7-Methylxanthine 5.563 1.899 0.003 DHPV glucuronide 4.081 1.559 0.009
Figure 2. Receiver operating characteristic (ROC) curves of the combined urinary metabolite model in the training and validation sets.
Table 4. Receiver operating characteristic (ROC) curve parameters of the combined urinary metabolite model in the training and validation sets and of overlapping discriminatory metabolites in the three types of study among all population
Specificity
(%)
Sensitivity
(%) AUC (95% CI) Combined model Training set 90.5 90.5 95.7 (89.8–100)
Validation set 81.8 90.9 92.6 (81.9–100) AMMU 81.3 87.5 88.2 (79.5–96.9) AMMU isomer 71.9 71.9 76.7 (65.1–88.3) 3-Methyluric acid 78.1 78.1 82.2 (71.2–93.2) 7-Methylxanthine 87.5 78.1 88.3 (80.1–96.5) 3-Methylxanthine 81.3 81.3 85.2 (75.6–94.7) 3,7-Dimethyluric acid 78.1 81.3 83.6 (73.3–93.9) Theobromine 68.7 78.1 69.8 (56.5–83.2) Methoxyhydroxyphenylvalerolactone 71.9 71.9 73.4 (60.6–86.2) DHPV glucuronide 59.4 78.1 68.3 (55.0–81.5) DHPV sulphate 75.0 62.5 71.1 (58.3–83.9)
4. CONCLUDING REMARKS
In the current study we applied an untargeted metabolomics strategy to discriminate the urinary metabolome of regular cocoa product consumers in a free-living population. This approach revealed a number of metabolites, most of which have already been detected in other controlled cocoa dietary intervention studies. The fact that some of them are produced by the gut microbiota reinforces the hypothesis that the microbial food metabolome is an important source of dietary biomarkers. Interestingly, an acylcarnitine metabolite was inversely associated with cocoa intake. Because of the potential role of this class of compounds in insulin resistance, this observation could provide a mechanistic insight into the beneficial effects of cocoa consumption on insulin sensitivity previously described in epidemiological studies. Additionally, we developed a combined model of urinary metabolites that could be used as a more accurate tool for the discrimination of cocoa consumers in epidemiological studies. With this report, one more step has been taken in the research on dietary biomarkers. Until now, the study of food metabolome in the discovery of biomarkers of dietary consumption has focused mainly on changes and differences in individual metabolites. Here we show that combining different metabolites improves measurements of dietary exposure to cocoa products. These findings should be further validated in a wider cohort. We anticipate that this approach might also be successfully applied in the evaluation of complex dietary patterns, composed of distinct food items. Finally, the nature of this study adds complementary information about the metabolic footprint of a cocoa consumption closer to the real conditions encountered in epidemiological studies, which deal mostly with free-living subjects without any dietary restriction or specific supplementation.
ACKNOWLEDGMENTS
This work has been supported by the Spanish National Grants from Ministry of Economy and Competitiveness (MINECO) and co-founded by FEDER (Fondo Europeo de Desarrollo Regional): AGL2009-13906-C02-01; CONSOLIDER-INGENIO 2010 Program, FUN-C-FOOD (CSD2007-063); PCIN-2014-133; and PI13/01172 Project (Plan Nacional de I+D+i 2013-2016) by the “ISCIII-Subdirección General de Evaluación y Fomento de la Investigación”. We also thank the award of 2014SGR1566 from the Generalitat de Catalunya's Agency AGAUR; and the “CIBER de Fisiopatología de la Obesidad y Nutrición (CIBEROBN)”, an initiative of the Instituto de Salud Carlos III, Madrid, Spain. MG-A thanks the AGAUR for the predoctoral FI-DGR 2011 fellowship; RLl and MU-S thank the “Ramón y
Cajal” program (RYC-201007334 and RYC-2011-09677, respectively) from the MINECO and Fondo Social Europeo. MF and DC were funded by a contract from the Catalan Government and the Instituto de Salud Carlos III FEDER (FIS CP06/00100) and PI11/02505, respectively.
The authors have declared no conflict of interest.
5. REFERENCES
[1] Jenab, M., Slimani, N., Bictash, M., Ferrari, P. et al., Biomarkers in nutritional epidemiology: applications, needs and new horizons. Hum. Genet. 2009, 125, 507–525. [2] Scalbert, A., Brennan, L., Manach, C., Andres-Lacueva, C. et al., The food metabolome: a window over dietary exposure. Am. J. Clin. Nutr. 2014, 99, 1286–1308.
[3] Heinzmann, S. S., Brown, I. J., Chan, Q., Bictash, M. et al., Metabolic profiling strategy for discovery of nutritional biomarkers: prolinebetaine as a marker of citrus consumption. Am. J. Clin. Nutr. 2010, 92, 436–443.
[4] Zamora-Ros, R., Urpi-Sarda, M., Lamuela-Raventos, R. M., Estruch, R. et al., Resveratrol metabolites in urine as a biomarker of wine intake in free-living subjects: the PREDIMED Study. Free Radic. Biol. Med. 2009, 46, 1562–1566.
[5] Arranz, S., Valderas-Martinez, P., Chiva-Blanch, G., Casas, R. et al., Cardioprotective effects of cocoa: clinical evidence from randomized clinical intervention trials in humans. Mol. Nutr. Food Res. 2013, 57, 936–947.
[6] Llorach, R., Urpi-Sarda, M., Jauregui, O., Monagas, M. et al., An LC-MS-based metabolomics approach for exploring urinary metabolome modifications after cocoa consumption. J. Proteome Res. 2009, 8, 5060–5068.
[7] Llorach, R., Urpi-Sarda, M., Tulipani, S., Garcia-Aloy, M. et al., Metabolomic fingerprint in patients at high risk of cardiovascular disease by cocoa intervention. Mol. Nutr. Food Res. 2013, 57, 962–973.
[8] Martin, F. P., Montoliu, I., Nagy, K., Moco, S. et al., Specific dietary preferences are linked to differing gut microbial metabolic activity in response to dark chocolate intake. J. Proteome Res. 2012, 11, 6252–6263.
[9] Urpi-Sarda, M., Monagas, M., Khan, N., Llorach, R. et al., Targeted metabolic profiling of phenolics in urine and plasma after regular consumption of cocoa by liquid chromatography-tandem mass spectrometry. J. Chromatogr. A 2009, 1216, 7258–7267.
[10] Actis-Goretta, L., Leveques, A., Giuffrida, F., Romanov-Michailidis, F. et al., Elucidation of (-)-epicatechin metabolites after ingestion of chocolate by healthy humans. Free Radic. Biol. Med. 2012, 53, 787–795.
[11] Mullen, W., Borges, G., Donovan, J. L., Edwards, C. A. et al., Milk decreases urinary excretion but not plasma pharmacokinetics of cocoa flavan-3-ol metabolites in humans. Am. J. Clin. Nutr. 2009, 89, 1784–1791.
[12] Xu, J., Yang, S., Cai, S., Dong, J. et al., Identification of biochemical changes in lactovegetarian urine using 1H NMR spectroscopy and pattern recognition. Anal. Bioanal. Chem. 2010, 396, 1451–1463.
[13] Pujos-Guillot, E., Hubert, J., Martin, J. F., Lyan, B. et al., Mass spectrometry-based metabolomics for the discovery of biomarkers of fruit and vegetable intake: citrus fruit as a case study. J. Proteome Res. 2013, 12, 1645–1659.
[14] Rothwell, J. A., Fillatre, Y., Martin, J. F., Lyan, B. et al., New biomarkers of coffee consumption identified by the non-targeted metabolomic profiling of cohort study subjects. PLoS One 2014, 9, e93474.
[15] Martinez-Gonzalez, M. A., Corella, D., Salas-Salvado, J., Ros, E. et al., Cohort profile: design and methods of the PREDIMED study. Int. J. Epidemiol. 2012, 41, 377–385.
[16] Bijlsma, S., Bobeldijk, I., Verheij, E. R., Ramaker, R. et al., Large-scale human metabolomics studies: a strategy for data (pre-) processing and validation. Anal. Chem. 2006, 78, 567–574.
[17] Fernandez-Albert, F., Llorach, R., Andres-Lacueva, C., Perera, A., An R package to analyse LC/MS metabolomic data: MAIT (Metabolite Automatic Identification Toolkit). Bioinformatics 2014, 30, 1937–1939.
[18] Pirooznia, M., Nagarajan, V., Deng, Y., GeneVenn—a web application for comparing gene lists using Venn diagrams. Bioinformation 2007, 1, 420–422.
[19] Robin, X., Turck, N., Hainard, A., Tiberti, N. et al., pROC: an open-source package for R and S+ to analyze and compare ROC curves. BMC Bioinformatics 2011, 12, 21414208.
[20] Bonvehí, J. S., Investigation of aromatic compounds in roasted cocoa powder. Eur. Food Res. Technol. 2005, 221, 19–29.
[21] Zuniga, A., Li, L., Ultra-high performance liquid chromatography tandem mass spectrometry for comprehensive analysis of urinary acylcarnitines. Anal. Chim. Acta 2011, 689, 77–84.
[22] Schooneman, M. G., Vaz, F. M., Houten, S. M., Soeters, M. R., Acylcarnitines: reflecting or inflicting insulin resistance? Diabetes 2013, 62, 1–8.
[23] Hooper, L., Kay, C., Abdelhamid, A., Kroon, P. A. et al., Effects of chocolate, cocoa, and flavan-3-ols on cardiovascular health: a systematic review and meta-analysis of randomized trials. Am. J. Clin. Nutr. 2012, 95, 740–751.
[24] Rodopoulos, N., Hojvall, L., Norman, A., Elimination of theobromine metabolites in healthy adults. Scand. J. Clin. Lab. Invest. 1996, 56, 373–383.
[25] Zamora-Ros, R., Rabassa, M., Cherubini, A., Urpi-Sarda, M. et al., Comparison of 24-h volume and creatinine-corrected total urinary polyphenol as a biomarker of total dietary polyphenols in the InvecchiareInCHIANTI study. Anal. Chim. Acta 2011, 704, 110–115.