OUTDOOR MEASUREMENTS FOR AN EFFECTIVE PV MODULES TEMPERATURE CHARACTERIZATION
M. Pellegrino*, C. Cornaro(1),(2), S. Bartocci(2), G D'Angiolini(2) , G. Flaminio*, V. Giglio*, A. Matano*, G. Nardelli*, A. Ortense* and A. Spena(1),(2)
* ENEA Centro Ricerche Portici
Località Granatello. P.O. Box 32, I-80055 Portici (NA), Italy. tel:+39-81-7723-267, Fax:+39-81-7723-344
(1) Dipartimento di Ingegneria dell'Impresa Facoltà di Ingegneria (2)Chose
Università degli Studi di Roma "Tor Vergata" Via del Politecnico, 1
00133 ROME Tel. +39 06 7259 7233/7248 Fax. +39 06 7259 7233
ABSTRACT: PV system designers need an estimation of the temperature at which a system will be operating in the field, in order to evaluate the losses due to thermal effects. To that purpose the IEC Standards for qualification of modules point out at the NOCT, the Nominal Operating Cell Temperature, as an useful parameter. Anyway NOCT measurements require an accurate elaboration of data, since they are to be referred to quasi stationary conditions, and sometimes the correct interpretation of some clauses of the Standards are not so easy. Because NOCT measurements put severe restrictions on the specific mounting and measurement conditions some laboratories as the ESTER laboratory of the University of Rome Tor Vergata measure instead the NOST, the Nominal Operating Specific Temperature. So a better and a deeper understanding of what can be effectively used as the operating temperature is highly required. The paper intends to present and compare results of NOCT and NOST measurements, obtained respectively by two different laboratories located one, the ENEA laboratory, in the Southern Italy, near Naples, and the other in Rome, in the Central part of Italy.
Keywords: Qualification and Testing, Thermal Performance, Energy Performance 1 INTRODUCTION
PV system designers need an estimation of the temperature at which a system will be operating in the field, in order to evaluate the losses due to thermal effects. To that purpose the IEC Standards for qualification of modules point out at the NOCT, the Nominal Operating Cell Temperature, as an useful parameter [1,2]. The IEC 61215 and the draft of the new IEC 61646 define the NOCT as the equilibrium mean solar cell junction temperature within an open-rack mounted module in the following standard reference environment (SRE):
– tilt angle: at 45° tilt from the horizontal – total irradiance: 800 W/m2
– ambient temperature: 20 °C – wind speed: 1 m/s
– electrical load: nil (open circuit)
Even the Italian technical guide for PV installation issued by the Italian National Electrotechnical Commission, CEI, [3] refers that the NOCT can be used to estimate the loss of the PV generator due to thermal effects as
(
)
100 800 20 25 δ⎥⎦
⎤
⎢⎣
⎡
− + − = T NOCT G Loss ambbeing δ the power temperature coefficient of the module. NOCT measurements require an accurate elaboration of data, since they are to be referred to quasi stationary conditions, and sometimes the correct interpretation of some clauses of the Standards are not so easy.
The method defined in the Standards is based on gathering actual measured cell temperature data under an established range of environmental conditions, as irradiance, temperature and wind conditions, and then referring at SRE.
Since the data should allow accurate and repeatable interpolation of the NOCT it could be useful to determine the accuracy of the NOCT measurements, according to the various defined operating conditions and the way the statistics used for data elaboration could influence the value.
Because NOCT measurements put severe restrictions on the specific mounting and measurement conditions some laboratories as the FTA Lab ESTER facility of the University of Rome Tor Vergata measure instead the NOST [4] , the Nominal Operating Specific Temperature, defined as the site and mounting specific module temperature of a module operating at maximum power point, 800 W/ m2 and 20°C ambient temperature. So a better and a deeper understanding of what can be effectively used as the operating temperature is highly required.
The paper intends to present and compare results of NOCT and NOST measurements, obtained respectively by two different laboratories located one, the ENEA laboratory, in the Southern Italy, near Naples, and the other in Rome, in the Central part of Italy. Incidentally and for sake of a j more complete information it is worth to mention that there are some other group that investigate on a slight different concept of operating equivalent module or cell temperature [5-9] or on energy balance but at the moment this will not be considered in the work.
2 NOCT AND STANDARD
NOCT, as described in the IEC 61215 [1] , can be defined by ‘the primary method’, universally applicable to all PV modules.
This method requires the collection of actual measured cell temperature data under a range of environmental conditions including the SRE. The data
processing has its assumption in the fact that the difference can be considered independent of the ambient temperature and is essentially linearly proportional to the irradiance at levels above 400 W/m2. The procedure calls for plotting as a function of for a period when wind conditions are favorable. A regression analysis must be used to fit the data points. A preliminary NOCT value is determinate by adding 20°C to the value of interpolated at the SRE irradiance of 800 W/m2. Finally, a correction factor, dependent on the average temperature and wind speed during the test period, is added to preliminary NOCT to correct it to 20°C and 1 m/s.
Environmental data must be recorded, together with cell temperature and within an interval of no more than 5s, in a sunny day with low wind speed, making sure that data are from both before and after solar noon, and rejecting all data taken during the following conditions: irradiance below 400 W/m2; in a 10 min interval after the irradiance varies more than 10% from the maximum value to the minimum value recorded during that 10 min period; wind speed outside the range 1 m/s ± 0.75 m/s; ambient temperatures outside the range 20 °C ± 15 °C or varying by more than 5 °C from the maximum to the minimum value recorded during one data collection run; in a 10 min interval after a wind gust of more than 4 m/s; wind direction within ±20° of east or west.
For Si crystalline modules the entire procedure must be repeated on two additional days, considering at last the average of the three values of NOCT [1].
For amorphous PV modules IEC 61646 indicates [2] the repetition of the entire procedure on a different day, averaging the two values of NOCT if they are within 0.5 °C. If the difference is more than 0.5 °C one has to repeat the procedure on a third day and average all three values of NOCT.
3 NOST AND DIFFERENCE WITH NOCT
The term NOST, the Nominal Operating Specific Temperature, is defined as the site and mounting specific module temperature of a module operating at maximum power point, 800 W/m² and 20°C ambient temperature.
The value of NOST is established from the complete measured data set by plotting the module and ambient temperature differences against irradiance, just like in the standard NOCT determination procedure, with the transformation on the measured data following a quite similar equation: Tc=(NOST−20°)GT/800+Ta [5].
4 EXPERIMENTAL
4.1 NOST measurements at FTA Lab ESTER facility The south oriented stand of the outdoor ESTER facility [4], on the roof top of the Engineering building of the University of Rome Tor Vergata, is currently hosting two polycrystalline PV modules (KC125 and PW1650) and an amorphous silicon module (EPV50). The devices are kept at maximum power point and continuously monitored together with the most relevant environmental variables. Each month the stand tilt angle is changed to maximize energy collection and guarantee normal incidence at noon. KC and PW modules reliable data are available since March 2008 while EPV has been exposed
more recently (May 2009). For the cited modules, NOST has been calculated filtering the data with the dedicated software NORIA [10], following the indications provided by the IEC61215 [1] for the NOCT calculation. It has to be noted that the new norm version of 2006 prescribes that the holding stand is tilted at 45° ± 5°, while the old one (1997) indicates that data have to be registered while the PV modules are at normal incidence at noon. This difference sometimes is not considered and the old norm version is used instead of the new one as, for example, reported in [11]. For this reason NOST has been calculated extracting the data with the two conditions for the module tilt angle. The calculation made for normal incidence has been labeled as “condition 1” while the one made with the stand at 45° has been indicated as “condition 2”. The difference between back of the module temperature and ambient temperature is plotted against irradiance and a linear regression is applied to the data set to get the best fit line, then from the linear equation the temperature difference corresponding to an irradiance of 800 W/m2 is calculated. First approximation NOST at 20°C is then determined summing 20°C to this difference. Evaluating average ambient temperature and average wind speed of the data set it is possible to correct the first attempt NOST value using the graph provided by the norm.
Both versions of the norm recommend to use irradiance data greater than 400 W/m2 to guarantee linear correlation between temperature difference and irradiance. To analyze the effect of this filter, NOST has been derived for condition 1 and 2 considering also all the data set. This condition has been identified as “1bis” and “2bis”, respectively.
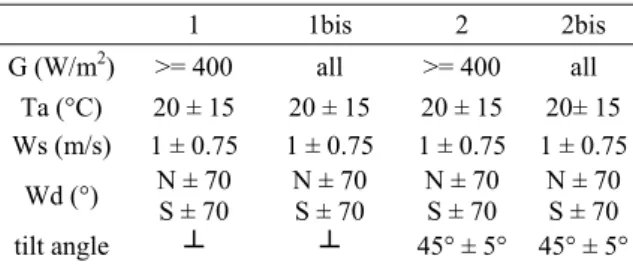
Table 1 summarizes the conditions applied to get the data set for NOST calculation with the four conditions applied. Also the condition on the wind direction (Wd) has been applied, that prescribes to reject data with wind direction from East and West ± 20°.
Table I: Data filtering conditions for NOST calculation. 1 1bis 2 2bis G (W/m2) >= 400 all >= 400 all Ta (°C) 20 ± 15 20 ± 15 20 ± 15 20± 15 Ws (m/s) 1 ± 0.75 1 ± 0.75 1 ± 0.75 1 ± 0.75 Wd (°) N ± 70 S ± 70 N ± 70 S ± 70 N ± 70 S ± 70 N ± 70 S ± 70 tilt angle ┴ ┴ 45° ± 5° 45° ± 5° For KC125 and PW1650 all the conditions could be applied while for EPV50, due to the short period of exposure, only conditions 1 and 1bis has been studied. As an example, figure 1 shows the temperature difference versus irradiance for KC125 with data filtering according to condition 2.
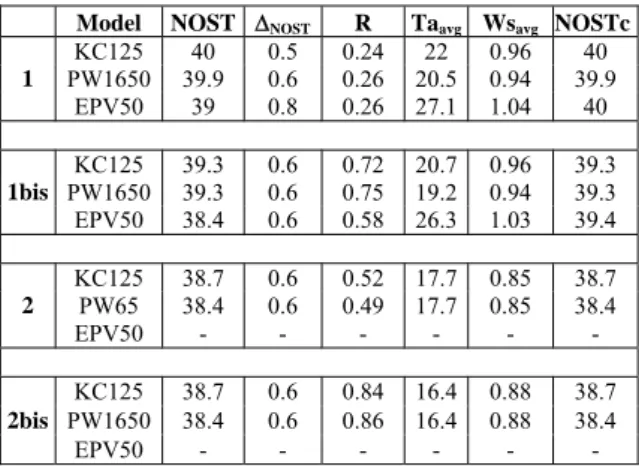
Table 2 summarizes the NOST results obtained for the PV modules under test for the four conditions applied. ΔNOST is the uncertainty on the NOST value calculated through the error propagation of the linear equation used to calculate NOST (red line in fig. 1); R is the correlation coefficient for the linear regression; Taavg and Wsavg represents the average ambient temperature
Figure 1: Data collected according to condition 2 for NOST calculation of KC125 PV module.
and wind speed of the data set used for the NOST determination, while NOSTc is the NOST value corrected for the average ambient temperature and wind speed using the graph of IEC61215 [1].
Table 2: NOST calculated for the PV module under test.
Model NOST ΔNOST R Taavg Wsavg NOSTc KC125 40 0.5 0.24 22 0.96 40 PW1650 39.9 0.6 0.26 20.5 0.94 39.9 1 EPV50 39 0.8 0.26 27.1 1.04 40 KC125 39.3 0.6 0.72 20.7 0.96 39.3 PW1650 39.3 0.6 0.75 19.2 0.94 39.3 1bis EPV50 38.4 0.6 0.58 26.3 1.03 39.4 KC125 38.7 0.6 0.52 17.7 0.85 38.7 PW65 38.4 0.6 0.49 17.7 0.85 38.4 2 EPV50 - - - - KC125 38.7 0.6 0.84 16.4 0.88 38.7 PW1650 38.4 0.6 0.86 16.4 0.88 38.4 2bis EPV50 - - - -
Figure 2 shows the NOST calculated for the three PV modules under the four conditions in a graphical way.
Figure 2: NOST evaluated for the three modules according to the four conditions of data filtering.
Using the old version of the norm, i.e. positioning the module plane at normal incidence of the solar radiation, the three modules exhibit the same NOST value of approximately 40°C and a slight underestimation is observed if all the irradiance data set is used (condition
1bis) evidencing a slight difference in the two calculation procedure. On the contrary, this difference is not present if the 45° configuration of the modules plane is considered (conditions 2 and 2bis) and instead a small variation is observed between KC and PW modules however within the calculated uncertainty. For all modules the condition 2 report a NOST lower of approximately 2°C than condition 1.
Table 3: NOCT calculated for the PV module under test.
Day Time interval Filt. data NOCT EPV50 (°C) NOCT KC125 (°C) 2/09 9:09 – 17:30 30 40.26 41.70 7/09 7:39 – 16:30 332 40.27 41.66 8/09 7:39 – 16:24 227 40.23 41.79 Avg. - - 40.25 41.72
For the EPV and KC modules also the NOCT values have been estimated using the same experimental set up, by tilting the stand at 45° and putting both devices at open circuit. Three days of September 2009 have been chosen for the test and the data have been processed with the norm procedure implemented by the ENEA Portici group. The results are summarized in table 3.
An optimum agreement can be noted among the NOCT evaluated for each day for both modules (maximum error of 0.02 °C for EPV and 0.05 °C for KC). Also a difference of approximately 3 °C between NOST and NOCT is confirmed by other authors [12]. However low values have been observed for both modules. The lower value of EPV with respect to KC can be explained by the fact that the module is a double glass with no insulation on the back. For both modules the particular mounting (free stand, with no black panels around) and location (roof top, with no obstructions) could be responsible for such results.
4.2 Measurements at PV ENEA Lab
An outdoor facility, composed of an open fixed rack for placing the modules, a meteorological station and a data acquisition system, has been set-up at ENEA following the specifications of the corresponding standard.
The main idea was the evaluation of the energetic performance of PV modules in outdoor conditions. At the same time a measurement of NOCT could be performed. Determinations of NOCT for p-x Si PV module encapsulated in glass-EVA-white tedlar and for an a-Si PV module encapsulated in glass-EVA-black tedlar were carried over in order to investigate the effects of different typologies of modules [13].
Table 4: Types of modules and corresponding NOCT .
The table 4 shows the characteristics of the modules under test and the calculated values of their NOCT.
a-Si PV m. p-x Si PV m. Pm [W] 95 50 Module area [ ] 1.58 0.44 N. of cells in series 119 36 NOCT [°C] 47 48 NOCT deviation ±2 ±2
A deviation of ±2 degrees comes from the relevant differences for wind conditions, both as speed and direction, during the three days of measurements.
From the data shown in table 4 it seems that nor the technology, neither the overall size and the black colour of the back, instead of the usual with tedlar, could really affect the NOCT.
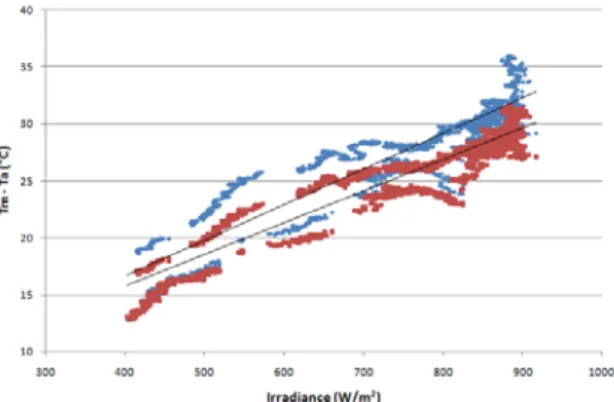
Figure 3 represents the temperature difference between the module and the surrounding air vs. the irradiance for the two modules under test.
Figure 3: Data collected for the two different modules. Red points represent the filtered temperature difference vs. irradiance for the p-x Si PV module. Blue ones represent the trend for the a-Si PV module.
All the parameters used for NOCT determination are recorded every 5s during the testing periods, according to the standard requirements; it is more reliable to relay the measurements on a larger number of data available so to minimize the error affecting the final result of NOCT.
The standards require a minimum of 10 acceptable data points; but we had experienced that, if the data are just a few data, even though are more then 10 as required, there could be in some cases an underestimation or overestimation of NOCT, quantifiable in more than 1.5 °C, respect the values calculated having more data available.
Figure 4 shows the different fitted-lines obtained from the two datasets.
Figure 4: Red: set of all data points. Blue: set of 10 data. To reduce the error to less than 0.5°C at least 30 evenly distributed data should be taken.
Another interesting aspect that we have taken into account in the data processing is the difference between the morning and the afternoon values of NOCT.
Indeed, considering two different distributions of data for the day, the first related to data taken before the solar noon and the second after, we have always find values of NOCT in the morning higher than the one calculated considering only the afternoon data, as shown in fig. 5.
Figure 5: different values of NOCT for the morning (blue points) and afternoon (red points).
Figure 5 refers to a thin-film module with environmental parameters typical of a summer day.
The discrepancy of NOCT between the morning and the afternoon can be explained by the different spectral distribution, the module thermal lag and the different ambient temperature, that is usually greater in the afternoon [13].
As a consequence we experienced that it is not only fundamental to take the data before and after the solar noon, as established by the Standards, but also their uniformity is crucial as well, in term of number and their symmetry.
That maybe can be justified by the non-perfect linearity relationship between the irradiance above 400 W/m2 and the difference .
Another aspect is the lack of precision in detecting temperature data due to imperfect thermal adhesion of the probes to the back of the module/s.
This could be overcome by using a translation equation that takes into account the temperature dependence of the Voc of the module itself, as well as from ambient temperature and irradiance. At the moment the research is in progress to confirm that possibility.
Lately a second period of tests at ENEA has regarded the comparison of NOCT/NOST.
Samples consisting in two a-Si PV modules encapsulated in glass-EVA-black tedlar have been observed and the values of NOCT and NOST determined. The NOST value has been estimated using the same experimantal set up and conditions used for the NOCT but connecting the modules to the grid by an inverter with the maximum power peak tracker, MPPT.
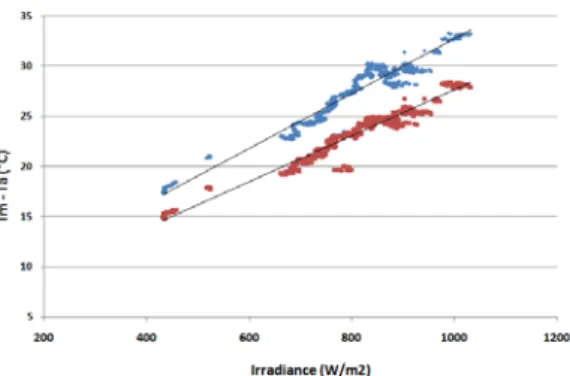
The two modules have been put close together and all parameters required for the estiamaton of NOCT/NOST, as above defined, have been recorded every 5 s during the testing periods. Figure 6 represents the temperature difference between the module and the air vs. irradiance for the two a-Si PV modules.
Figure 6: Data collected for the module at open circuit for NOCT (blue) and for module operating at maximum power point for NOST (red).
Differences between the values of NOCT and NOST have been found to be about four degrees, in good agreement with literature and with the results coming from the ESTER laboratory.
We performed an analysis of sensitivity on the data isolating the single effect of all environmental parameters and get an estimation of their effect and interaction with the thermal performance of the PV module.
The procedure was applied to the a-Si PV module; we found a NOCT value of 48 °C in a sunny and low windy summer day.
The environmental conditions which more affect the results are wind speeds greater than 1.75 m/s and lower than 0.25 m/s.
By excluding this conditions the value of NOCT can change in the order of magnitude of less than 0.5 °C. 6 CONCLUSIONS
As a conclusion it can be argued that the thermal performance of a module has to be well known in order to estimate the thermal loss affecting the energetic performance. So what is more realistic NOCT or NOST or other operating temperature equivalent concepts? While NOCT is a specific test required explicitly by the standards, NOST from one another hand is much more close to the real operating condition. At the same time the set up for making the NOCT measurements is easier not requiring a tracking structure or a MPPT, the maximum power point tracker, for simulating the load and allowing the module to work at the maximum power condition. NOCT values are higher than NOST values since in open circuit condition all the irradiance entering the module is degraded in thermal energy. Both the laboratory have found this results and 3 or 4 degrees Celsius of difference can justify the electric power delivered to the load. The errors and the uncertainties affecting the measurements have been estimated and they were largely below 1 degree Celsius. Nevertheless NOCT and NOST estimation results are very different for the two laboratories. That could be ascribed to the different set up of the apparatus and of the measurements, the different types of instrumentation, their precision and accuracy, the different filter used to treat the data, the different location with different spectrum or irradiance conditions. At the moment it is not possible to decide if this can be reports as a systematic error. In the near future the laboratories will be involved in a Round Robin campaign, changing
the samples and exchanging the information. Anyway NOCT and NOST seem to be clearly related so they can be used indifferently for quality evaluation. For thermal loss estimation at the moment it is not possible to draw a realistic conclusion. NOST is more close to the real operating condition but its estimation seems to require a more complicated set up, but probably NOST or another different operating condition can be deduced once the value of the corresponding NOCT is known by making use of translation equations. Once the set up is prepared the uncertainty can be kept as low as possible and under control but it is the method itself, e.g the assumptions which they are relied on, that could be the source of error and the procedure under which data are taken, stored and processed as well. This is the reason why the NOCT has to be determined as an average of different data set collected in different days. Besides the site dependence, that seems to be important as a conclusion of this work, has to be further investigated.
7 REFERENCES
[1] IEC 61215. Crystalline silicon terrestrial photovoltaic (PV) modules – Design qualification and type approval (2006).
[2] IEC 61646. Thin film terrestrial photovoltaic (PV) modules – Design qualification and type approval (1997).
[3] CEI 82-25 “Guida alla realizzazione di sistemi di generazione fotovoltaica allogatia lla rete di bassa e media tensione” (2008).
[4] A. Spena, C. Cornaro, S. Serafini, Proceedings of the 33rd IEEE PV Specialists Conference, San Diego (CA), May, 11-16 (2008).
[5] R.P. Kenny, G. Friesen, D. Chianese, A. Bernasconi, E.D. Dunlop, Proceedings of the 3rd World Conference of Photovoltaic Solar Energy Conversion, May 11–18, Osaka, Japan, (2003).
[6] M. Mattei, G. Notton, C. Cristofari, M. Muselli, P. Poggi, - Renewable Energy 31 (2006) 553–567. [7] E. Skoplaki, J.A. Palyvos ,Solar Energy 83 (2009)
614–624.
[8] E. Skoplaki, J.A. Palyvos, Renewable Energy 34 (2009) 23–29.
[9] Piyatida Trinuruk , Chumnong Sorapipatana , Dhirayut Chenvidhya , Renewable Energy 34 (2009) 2515–2523.
[10] A.Spena, C. Cornaro, P.G. Traini, Proceedings of the 23th European Photovoltaic Solar Energy Conference and Exhibition, September, 21-25 (2008). [11] E. Skoplaki, A.G. Boudouvis, J.A. Palyvos, Solar
Energy Materials and Solar Cells, v. 92, 1393-1402 (2008).
[12] M.C. Alonso Garcıa, J.L. Balenzategui. Renewable Energy 29 (2004) 1997–2010.
[13]Ruhi Bharti, Joseph Kuitche, Govindasamy Tamizh-Mani, Arizona State University, Photovoltaic Reliability Laboratory. Internal report.