Genetic characterization of Uruguayan Pampa Rocha pigs with microsatellite
markers
M Montenegro
1, S Llambí
1, G Castro
2, N Barlocco
3, A Vadell
3, V Landi
4, JV Delgado
4and A Martínez
41
Department of Animal Breeding and Genetics, Veterinary School, University of the Republic,
Montevideo, Uruguay.
2
Department of Farm Animals, Veterinary School, University of the Republic, Montevideo, Uruguay.
3Department of Farm Animals, Faculty of Agronomy, University of the Republic, Montevideo, Uruguay.
4Department of Genetics, Veterinary School, University of Cordoba, Cordoba, Spain.
Abstract
In this study, we genetically characterized the Uruguayan pig breed Pampa Rocha. Genetic variability was assessed by analyzing a panel of 25 microsatellite markers from a sample of 39 individuals. Pampa Rocha pigs showed high genetic variability with observed and expected heterozygosities of 0.583 and 0.603, respectively. The mean number of alleles was 5.72. Twenty-four markers were polymorphic, with 95.8% of them in Hardy Weinberg equilibrium. The level of endogamy was low (FIS= 0.0475). A factorial analysis of correspondence was used to assess the genetic dif-ferences between Pampa Rocha and other pig breeds; genetic distances were calculated, and a tree was designed to reflect the distance matrix. Individuals were also allocated into clusters. This analysis showed that the Pampa Rocha breed was separated from the other breeds along the first and second axes. The neighbour-joining tree gen-erated by the genetic distances DAshowed clustering of Pampa Rocha with the Meishan breed. The allocation of
indi-viduals to clusters showed a clear separation of Pampa Rocha pigs. These results provide insights into the genetic variability of Pampa Rocha pigs and indicate that this breed is a well-defined genetic entity.
Keywords: genetic resources, microsatellites.
Received: May 9, 2014; Accepted: July 25, 2014.
Introduction
Pampa Rocha pigs are a genetic resource of the Ori-ental Republic of Uruguay (Castro, 2007; Vadell, 2008). These pigs are characterized by a black coat with six differ-ent regions of white hair. The ears are mostly of the celtic type, while the side of the face can be rectilinear or subconcave (Vadell, 2008). Figure S1 (Supplementary Ma-terial) shows the phenotypic characteristics of these pigs. The origin of this breed dates back to the introduction of the first pigs into South America by Spanish and Portuguese colonists from Europe and Asia, with subsequent modern contributions from Berkshire and Poland China breeds (Urioste et al., 2002). According to the classification of the Food and Agriculture Organization (FAO) of the United Nations, these pigs are not at risk of extinction, but preser-vation is required (over 1000 breeding animals) (Delgado, 2002). Since 2002, the possibility of extinction of these ani-mals has increased because of the decrease in the number of small farmers in the eastern region of Uruguay. This
situa-tion is compounded by the absence of policies from special-ized organisations engaged in the conservation of this re-source (Vadell, 2011). The number of animals in this breed is currently unknown.
The characterization of genetic resources is one of the steps in establishing possible conservation strategies. Cur-rently, DNA microsatellite molecular markers are the most commonly used genetic markers for studying genetic vari-ability in domestic species. In recent years, knowledge of the local pig resources of Uruguay has increased, following a similar trend in other countries. The productivity of Pam-pa Rocha pigs is already well-characterized. The productiv-ity life-span, grazing adaptabilproductiv-ity, good maternal abilproductiv-ity and high milk production of Pampa Rocha females is re-markable. In addition, the superiority of crossbreeding these pigs with Duroc or Large White breeds in terms of the growth stage and weight gain of offspring is also notewor-thy (Barlocco and Vadell, 2005; Vadell et al., 2010). How-ever, the genetic characterization of Pampa Rocha is still insufficient. In Uruguay, the first studies using molecular markers in pigs were done by Kelly et al. (2004) who ana-lyzed a panel of nine microsatellites and the haplotypes of the mitochondrial cytochrome B gene in ten Pampa Rocha
Send correspondence to María Montenegro. Department of Animal Breeding and Genetics, Veterinary School, University of the Re-public, Alberto Lasplaces 1620, 11600 Montevideo, Uruguay. E-mail: [email protected].
pigs. This study revealed high genetic variability that sug-gested that the most probable origin of this breed was Euro-pean breeds with the introgresion of Asian breeds.
The aim of this study was to analyze the genetic vari-ability and population structure of Pampa Rocha using microsatellite markers and to determine the genetic rela-tionships of Pampa Rocha with other pig breeds.
Materials and Methods
Collection of samples and DNA extraction
Thirty-nine DNA samples from Pampa Rocha pigs were analyzed. The animals belonged to the breeding group of the Pig Production Unit of the Southern Regional Center of the Experimental Station of the Faculty of Agronomy (University of the Republic) located in Progreso, Cane-lones, Uruguay. This breeding group was created in 1995 with animals from different farms from eastern Uruguay, where this resource originated. Some localities where Pam-pa Rocha is found include Castillos, Barrancas, Costas de Pelotas and Valizas. DNA was extracted from hair follicles using Chelex®resin (Walsh et al., 1991). The samples are currently in the DNA bank of the Genetics Area of the Fac-ulty of Veterinary Medicine (University of the Republic). Microsatellite analysis
A panel of 25 microsatellites recommended by the FAO/ISAG was amplified (FAO, 2011) in the Laboratory of Molecular Genetics at the University of Cordoba, Spain, where the technique has been optimized based on the proto-col used by Martínez et al. (2000). Markers were amplified in multiplex polymerase chain reactions (PCRs) using fluo-rescence-labelled primers. PCR products were separated by electrophoresis on ABI instruments (ABI PRISM 377XL, Applied Biosystems, Foster City, CA) according to manu-facturers recommendations, and allele sizing was done by using the internal size standard of GeneScan-400HD ROX (Applied Biosystems, Warrington, UK). Genotyping was done with Genescan Analysis software v.3.1.2, which pro-vides information about the sizes of the studied fragments, and Genotyper 2.5 software was used to identify the differ-ent alleles for each marker.
Statistical analysis
The within breed genetic diversity was investigated by calculating the observed (Ho) and expected (He) hetero-zygosities, polymorphism information content (PIC) and average number of alleles using Microsatellite Toolkit soft-ware (S Park, 2001,PhD thesis, University of Dublin, Ire-land). The statistical parameter FIS and the
Hardy-Weinberg equilibrium value (Fisher’s exact test, using the Markov chain Monte Carlo method; Guo and Thompson, 1992) were calculated using Genetix 4.05.2 (Belkhir et al., 2004) and Genepop 4.0.10 (Raymond and Rousset, 1995), respectively.
To determine the genetic diversity among breeds, the following breeds were included in the study: Berkshire, Celtic, Duroc, Iberian, Landrace, Large White, Meishan and Pietrain, to a total of 415 individuals. Information about these breeds was obtained from the BIOPIG Consor-tium’s database of the Iberoamerican Porcine Biodiversity Project. This consortium is part of the Red CONBIAND. These data have previously been published by Martínez et
al. (2000), Sancristobal et al. (2006), Vicente et al. (2008)
and Gama et al. (2013). BIOPIG consortium analyses were done by A. Martínez at the University of Cordoba, Spain, where the microsatellite markers used have been standard-ized. This comparative analysis was done with 37 samples of Pampa Rocha pigs and 23 microsatellites (excluding the CGA and S0026 markers). Factorial correspondence analy-sis was done using Genetix v.4.01 (Belkhir et al., 2004). Nei’s genetic distance DAwas calculated (Nei, 1983) and a
neighbour joining tree was built with Populations 1.2.28 software and viewed with Treeview (Page, 1996). The pop-ulation structure was assessed using Structure v.2.3.4 soft-ware, which uses a Bayesian algorithm (Markov chain Monte Carlo) to allocate individuals to clusters (K) that are more genetically similar. For this analysis, the markers that were in Hardy-Weinberg disequilibrium were removed. Burn-in periods of 200,000 and 600,000 iterations were used, assuming K values from 2 to 12, with five repetitions for each K and an admixture model and correlated allele frequencies (Falush et al., 2003). To identify the most likely K modal distribution, delta K was determined (Evanno et al., 2005) using Harvester software (Earl and vonHoldt, 2012). The corresponding graphs were cons-tructed with Distruct software (Rosenberg, 2004).
Results
Within-breed diversity
All the loci studied were polymorphic. Microatellites S0386 and S0002 showed the lowest number of alleles (two), whereas S0068 and SW240 had the highest number of alleles (10). The average number of alleles was 5.72± 2.46. PIC values ranged from 0.030 for S0386 to 0.819 for CGA. Seventeen of the 25 markers were highly informative (PIC > 0.5), seven were moderately informative (PIC be-tween 0.25 and 0.5) and one was uninformative (S0386, PIC < 0.25). The expected heterozygosities ranged from 0.030 for S0386 to 0.837 for CGA, with a mean of 0.603± 0.199, while the observed heterozygosities ranged from 0.031 for S0386 to 0.875 for S0005, with a mean of 0.583± 0.208. The FIS statistic ranged from 0.115 for S0227 to
0.401 for S0002, with a confidence interval of 95%. Seven-teen of the 25 markers had a positive sign, indicating an ex-cess of homozygotes, while eight had a negative sign. An FISmultilocus of 0.0475 indicated a low value of
Of the 24 microsatellites analyzed using Fisher’s ex-act test, 95.8% were in Hardy-Weinberg equilibrium, and only the marker SW72 was out of equilibrium (p < 0.01). The microsatellite S0386 was analyzed by thec2test, and p = 1.0 was obtained, indicating that the marker was in equilibrium (Table 1).
Between breed diversity
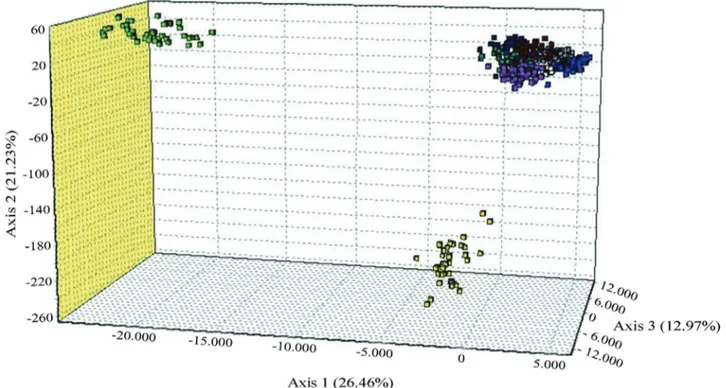
Figure 1 shows the results of the factorial analysis of correspondence. The first three components accounted for nearly 60% of the total variability. In this analysis, Pampa Rocha was separated from the other breeds by the first and second axes. Figure 2 shows the neighbour-joining tree cal-culated based on Nei’s genetic distance matrix DA (Nei,
1983). The tree showed a cluster of all European breeds and a cluster of the Pampa Rocha and Meishan breeds. This grouping has a 97% bootstrap, indicating that both races
were far apart. This divergence most likely reflects a com-mon ancestor influence rather than direct introgression.
Structure v.2.3.4 (Pritchard et al., 2000) was used to allocate the individuals into clusters, with each individual being represented by a vertical bar (Figure 3). When the to-tal number of individuals (415) was assigned to K = 2, the Pampa Rocha individuals were grouped together with the Asian breed Meishan. The remaining breeds used for the analysis (Berkshire, Celtic, Duroc, Iberian, Large White, Landrace and Pietrain) were grouped into the other cluster. For K = 5, the Pampa Rocha pigs were separated from Meishan pigs (q > 0.970). This separation was maintained for K values from 5 to 9; at K = 9, all nine breeds were sepa-rated. An optimal K value of 9 was determined (Figure S2, Supplementary Material).
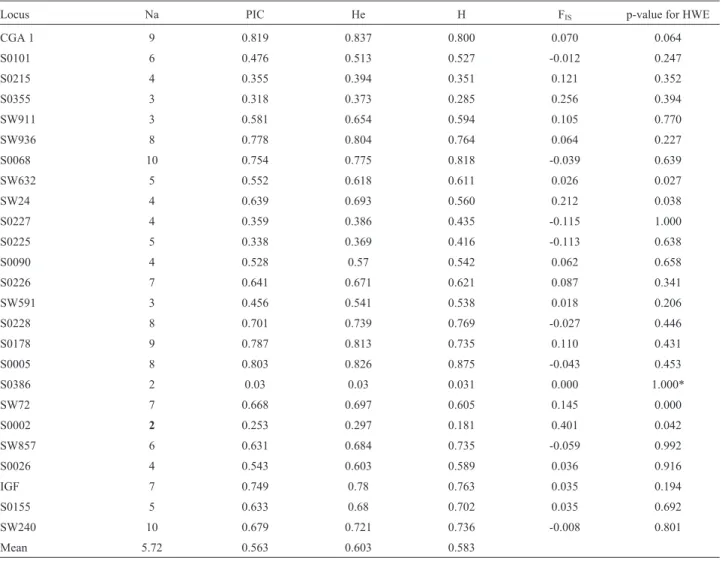
Table 1 - Details of 25 microsatellite loci typed in Pampa Rocha pigs.
Locus Na PIC He H FIS p-value for HWE
CGA 1 9 0.819 0.837 0.800 0.070 0.064 S0101 6 0.476 0.513 0.527 -0.012 0.247 S0215 4 0.355 0.394 0.351 0.121 0.352 S0355 3 0.318 0.373 0.285 0.256 0.394 SW911 3 0.581 0.654 0.594 0.105 0.770 SW936 8 0.778 0.804 0.764 0.064 0.227 S0068 10 0.754 0.775 0.818 -0.039 0.639 SW632 5 0.552 0.618 0.611 0.026 0.027 SW24 4 0.639 0.693 0.560 0.212 0.038 S0227 4 0.359 0.386 0.435 -0.115 1.000 S0225 5 0.338 0.369 0.416 -0.113 0.638 S0090 4 0.528 0.57 0.542 0.062 0.658 S0226 7 0.641 0.671 0.621 0.087 0.341 SW591 3 0.456 0.541 0.538 0.018 0.206 S0228 8 0.701 0.739 0.769 -0.027 0.446 S0178 9 0.787 0.813 0.735 0.110 0.431 S0005 8 0.803 0.826 0.875 -0.043 0.453 S0386 2 0.03 0.03 0.031 0.000 1.000* SW72 7 0.668 0.697 0.605 0.145 0.000 S0002 2 0.253 0.297 0.181 0.401 0.042 SW857 6 0.631 0.684 0.735 -0.059 0.992 S0026 4 0.543 0.603 0.589 0.036 0.916 IGF 7 0.749 0.78 0.763 0.035 0.194 S0155 5 0.633 0.68 0.702 0.035 0.692 SW240 10 0.679 0.721 0.736 -0.008 0.801 Mean 5.72 0.563 0.603 0.583
Na – number of alleles, PIC – polymorphic information content, He – expected heterozygosities, H – observed heterozygosities, FIS– inbreeding coeffi-cient, HWE – Hardy-Weinberg equilibrium.
Figure 1 - Graphical representation of the factorial analyses of correspondence.
Figure 2 - Neighbour-joining tree based on Nei’s genetic distances (DA). Breed abbreviations: BK – Berkshire, CL – Celtic, DC – Duroc, IB – Ibe-rian, LD – Landrace, LW – Large White, MS – Meishan, P – Pietrain, PR – Pampa Rocha.
Figure 3 - Graphical representation of the results generated by Structure
software for nine breeds with K = 2 to K = 9. Breed abbreviations: BK – Berkshire, CL – Celtic, DC – Duroc, IB – Iberian, LD – Landrace, LW – Large White, MS – Meishan, P – Pietrain, PR – Pampa Rocha.
Discussion
The average number of alleles found in this study (5.72± 2.46) was lower than that in Mexican Hairless pigs (7.07) (Canul et al., 2005), Cuban Creole pigs (8.2) (Martínez et al., 2005) and North East Argentina Creole pigs (9.25) (MA Revidatti, 2009, PhD thesis, University of Córdoba, Spain), but higher than the average number of al-leles found by Martínez et al. (2000) in some varieties of Iberian pigs (values of 3.44-5.44), except for the black Entrepelado pig variety (5.84). This value for Pampa Rocha was also higher than that found by Vicente et al. (2008) in local and commercial pig breeds from Portugal (5.36) and by Gama et al. (2013) in native pig breeds from Iberia and its island (5.14).
The average expected (0.603) and observed (0.583) heterozygosities of Pampa Rocha indicated a high degree of variability. The heterozygosity observed here resembled the values found for other breeds, such as Mexican Hairless pigs (He = 0.635) (Canul et al., 2005), Cuban Creole pigs (He = 0.653) (Martínez et al., 2005) and North East Argen-tina Creole pigs (He = 0.682) (MA Revidatti, 2009, PhD thesis, University of Córdoba, Spain). In Brazilian breeds, such as Monteiro, Moura and Piau, the reported He values were 0.573, 0.569 and 0.661, respectively (Sollero et al., 2009). Thus, the He for Pampa Rocha pigs was greater than the He values reported for the first two Brazilian breeds but lower than those for the Piau breed. For Iberian pigs, He ranges from 0.439 (Jabugo Spotted) to 0.567 (Entrepelado) (A Martínez, 2001, PhD thesis, University of Córdoba, Spain), while for Canary Black pigs, the reported He is 0.475 (Martínez et al., 2007). In local and commercial pig breeds from Portugal the reported He is 0.66 (Vicente et al., 2008), and in native pig breeds from Iberia and its island the reported He is 0.534 (Gama et al., 2013). For Pampa Rocha, the heterozygosity found here was similar to that reported by Kelly et al. (2004), who also observed high genetic vari-ability with an He value of 0.653; however, the latter study was done with a sample of 10 pigs and nine microsatellite markers. In general, Pampa Rocha showed levels of genetic diversity in its geographical context that resulted from a low level of artificial selection in Creole breeds.
The FISvalues in the sample of Pampa Rocha pigs
ranged from -0.115 to 0.401. The degree of inbreeding de-termined by the FISmultilocus was low, in agreement with
the genetic diversity results.
Of the markers analyzed, 95.8% were in Hardy-Weinberg equilibrium; only marker SW72 was not (p < 0.01). Microsatellite S0386 was analyzed with thec2 test and p = 1.0 was obtained, indicating that this micro-satellite was in Hardy-Weinberg equilibrium. Overall, these results demonstrated a high genetic stability, and indi-cated that this breed was not undergoing genetic drift, se-lection or other genetic forces, such as mutation or migration. Factors that contribute to disequilibrium include
selection and inbreeding in the case of closed populations. Selection forces can be ruled out in this case because the breed is not involved in any modern selection program.
The factorial analysis of correspondence (Figure 1) showed that Pampa Rocha was separated from the other breeds studied by the first and second axes. The Meishan breed was also separated from the remaining races. Struc-ture software v.2.3.4 (Pritchard et al., 2000) was used to al-locate individuals into clusters based on their genetic simi-larity, with the assumption that gene frequencies were correlated and that populations were mixed and in Hardy-Weinberg equilibrium (the SW72 marker was excluded). The initial clustering of the races Pampa Rocha and Meishan indicated some level of ancestry, which has been shown before. However, upon further analysis, the Pampa Rocha breed proved to be completely different from the other breeds. The separation into a distinct single cluster in-dicated that Pampa Rocha individuals constituted a well-defined genetic entity.
The genetic distances between Pampa Rocha and the other breeds were high. The lowest estimated genetic dis-tance was between Pampa Rocha and the Celtic breed (0.57), while the greatest estimated genetic distance was between Pampa Rocha and Meishan (0.73). The tree con-structed from this genetic distance analysis consisted of a cluster of all European races and a very distant cluster con-taining Pampa Rocha and Meishan.
These analyses did not demonstrate an influence of Spanish breeds in Pampa Rocha, which is unexpected be-cause Spanish breeds have been assumed to have a strong influence on the origin of Creole pig populations. The time gap and accumulation of genetic differences may partially explain the separation observed in the tree, but the succes-sive bottleneck effects that occurred during pig coloniza-tion of America could also explain this basic differentia-tion. Commercial breeds are thought to have had less influence on the origin of Creole pig populations, except for the Berkshire and Meishan breeds. The Berkshire breed was not grouped with Pampa Rocha in this analysis. The tree analysis indicated some influence of the Asian breed on the origin of Pampa Rocha because when the number of ancestral populations was small (K = 2, K = 4), Pampa Rocha and Meishan were grouped in the same cluster. This is consistent with the studies of Kelly et al. (2004) who de-termined that the maternal origin of the Pampa Rocha breed could be European and Asian. These authors identified the most common haplotype of European wild and domestic pigs and the characteristic haplotype of Asian breeds, such as the Japanese Wild Boar and Meishan, in Pampa Rocha. This has also been described in other breeds, such as Berk-shire, Canary Islands’ Black Pig, Duroc, Landrace and Large White, and indicates the participation of Asian breeds in their formation. These authors concluded that the origin of the Asian haplotype in Pampa Rocha pigs likely derived from crosses with Poland China or the Canary
Is-lands’ Black Pig breeds (introduced during Iberian coloni-zation). Additionally, the most likely origin of Pampa Rocha pigs was European breeds, some of which could have been introgressed with Chinese breeds, as indicated by mitochondrial DNA haplotypes. Burgos-Paz et al. (2013) affirmed that the pig breeds or races of the Americas were the result of many independent colonization and intro-gression events, possibly including direct Chinese into-gression. With regard to the origin of Pampa Rocha, neither Asiatic nor European influences could be rejected because both were strongly supported by the history of the move-ment of persons and, consequently, domestic animals dur-ing colonization of the Americas (Rodero et al., 1992; Gómez, 2007; González Fernández, 2011).
Conclusions
The various parameters and values used to quantify genetic variability, such as the high percentage of polymor-phic loci and the expected and observed heterozygosities, indicated high genetic variability in the Pampa Rocha pig breed. A comparative analysis of Pampa Rocha and other breeds showed that Pampa Rocha pigs had high genetic dif-ferentiation and conformed to a well-defined and differenti-ated genetic group. The results described here did not relate Pampa Rocha with Iberian pigs, even though the latter are thought to have influenced the origin of Pampa Rocha be-cause of the historical process that Creole breeds experi-enced. This lack of association may reflect the time gap between these resources in which genetic drift (bottleneck effects) may have generated differentiation. There have been additional contributions from other breeds. The Meishan breed appears to be the most closely related to Pampa Rocha because of its genetic introgression, a situa-tion not observed for the Iberian or Berkshire breeds, even though they are thought to have participated in the forma-tion of the Pampa Rocha breed. The influence of Asiatic genes on the origin of Pampa Rocha could not be rejected because of the introgression of these genes from the Philip-pines to the Americas through the so called “Navio de Ma-nila” during the 16thcentury and later (Rodero et al., 1992). Other modern Asiatic introgressions also cannot be dis-carded.
Acknowledgments
The present work was funded by the National Agency of Investigation and Innovation (ANII) and the Sectorial Commission of Scientific Investigation (CSIC).
References
Barlocco N and Vadell A (2005) Experiencias en la caracte-rización del cerdo Pampa-Rocha de Uruguay. Agrociencia 9:495-503.
Belkhir K, Borsa P, Chikhi V, Raufaste N and Bonhomme F (2004) Genetix 4.05, logiciel sous Windows TM pour la
génétique des populations. Laboratoire Génome, Popula-tions, InteracPopula-tions, CNRS UMR 5000, Université de Montpellier II, Montpellier, France.
Burgos-Paz W, Souza CA, Megens HJ, Ramayo-Caldas Y, Melo M, Lemús-Flores C, Caal E, Soto HW, Martínez R, Alvarez LA, et al. (2013) Porcine colonization of the Americas: a 60k SNP story. Heredity 110:321-330.
Canul M, Sierra A, Martínez A, Ortiz O, Delgado JV, Vega-Pla J and Pérez G (2005) Caracterización genética del cerdo pelón mexicano mediante marcadores moleculares. Arch Zootec 54:267-272.
Castro G (2007) Situación de los recursos genéticos porcinos lo-cales en Uruguay. Arch Zootec 56:783-788.
Delgado J (2002) Gestión genética de las poblaciones. In: Jor-nadas Iberoamericanas sobre la Mejora y Conservación de Razas Ganaderas Locales para el Desarrollo Rural Soste-nible. Antigua, Guatemala. 12-17.14.
Evanno G, Regnaut S and Goudet J (2005) Detecting the number of clusters of individuals using the software STRUCTURE: a simulation study. Mol Ecol 14:2611-2620.
Falush D, Stephens M and Pritchard JK (2003) Inference of popu-lation structure using multilocus genotype data: linked loci and correlated allele frequencies. Genetics 164:1567-1587. FAO (2011) Molecular Genetic Characterization of Animal
Ge-netic Resources. FAO Animal Production and Health Guidelines. No. 9. FAO, Rome.
Gama LT, Martínez A, Carolino I, Landi V, Delgado JV, Vicente AA, Vega-Pla JL, Cortés O, Sousa CO and BIOPIG Consor-tium (2013) Genetic structure, relationships and admixture with wild relatives in native pig breeds from Iberia and its is-lands. Genet Sel Evol 45:e18.
Guo S and Thompson E (1992) Performing the exact test of Hardy-Weinberg proportions for multiple alleles. Bio-metrics 48:361-372.
Kelly L, Clop A, Vadell A, Nicolini P, Monteverde S, Amills M and Sanchez A (2004) El cerdo Pampa-Rocha como recurso zoogenético en Uruguay. Marcadores moleculares. Vete-rinaria (Montevideo) 39:15-16.
Martínez AM, Delgado JV, Rodero A and Vega Pla JL (2000) Ge-netic structure of Iberian pig breed using microsatellites. Anim Genet 31:295-301.
Martínez AM, Pérez Pineda E, Vega-Pla JL, Barba C, Velázquez FJ and Delgado JV (2005) Caracterización genética del cerdo criollo cubano con microsatélites. Arch Zootec 54:369-375.
Martínez A, Quiroz J, Marques J and Delgado JV (2007) Estudio de la diversidad genética del cerdo Negro Canario con microsatélites de ADN. Arch Zootec 56:425-428.
Nei M (1983) Genetic polymorphism and the role of mutation in evolution. In: Nei M and Khoen R (eds) Evolution of Genes and Proteins. Sinauer Press, Sunderland, MA, pp 165-190. Page R (1996) TREEVIEW: an application to display
phylogen-etic trees on personal computers. Comput Appl Biosci 12:357-358.
Pritchard J, Stephens M and Donnelly P (2000) Inference of popu-lation structure using multilocus genotype data. Genetics 155:945-959.
Raymond M and Rousset F (1995) Genepop (Version 3.4): popu-lation genetics software for exact tests and ecumenicism. J Hered 86:248-249.
Rodero A, Delgado JV and Rodero E (1992) Primitive Andalusian livestock and their implications in the discovery of America. Arch Zootec 42:383-400.
Rosenberg NA (2004) Distruct: a program for the graphical dis-play of population structure. Mol Ecol Notes 4:137-138. Sancristobal M, Chevalet C, Haley CS, Joosten R, Rattink AP,
Harlizius B, Groenen MAM, Amigues Y, Boscher M, Rus-sell G, et al. (2006) Genetic diversity within and between European pig breeds using microsatellite markers. Anim Genet 37:189-198.
Sollero B, Paiva S, Faria D, Guimarães S, Castro S, Egito A, Al-buquerque M, Piovezan U, Bertani G and Mariante A (2009) Genetic diversity of Brazilian pig breeds evidenced by microsatellite markers. Livest Sci 123:8-15.
Urioste J, Vadell A and Barlocco N (2002) El cerdo Pampa Rocha como recurso zoogenético en Uruguay. Aspectos generales. In: III Simposio Iberoamericano sobre la Conservación de los Recursos Zoogenéticos Locales y el Desarrollo Rural Sostenible. Montevideo.
Vadell A (2008) Una reseña corta sobre la raza criolla de cerdos Pampa Rocha y su utilización en Uruguay. RCPP 15:105-112.
Vadell A (2011) Los cerdos criollos en el ecosistema de los palmares de Rocha. In: Situación y conservación de recursos zoogenéticos porcinos (Curso-Taller de Posgrado). Facultad de Veterinaria - UdelaR. pp 27-30.
Vadell A, Barlocco N and Carballo C (2010) Prolificidad y longe-vidad productiva de cerdas Pampa Rocha en un sistema de producción al airelibre. RCPP 17:149-153.
Vicente AA, Carolino MI, Sousa MCO, Ginja C, Silva FS, Marti-nez AM, Vega-Pla JL, Carolino N and Gama L (2008) Ge-netic diversity in native and commercial breeds of pigs in Portugal assessed by microsatellites. J Anim Sci 86:2496-2507.
Walsh P, Metzger D and Higuchi R (1991) Chelex 100 as a me-dium for simple extraction of DNA for PCR-based typing from forensic material. Biotechniques 10:506-513.
Internet Resources
BIOPIG Consortium’s database: Iberoamerican Porcine Biodi-versity Project. http://biopig.jimdo.com/ (May 5, 2012).
Populations 1.2.28 software.
http://www.cnrs-gif.fr/pge/bioinfo/populations/ (May 5, 2012).
Structure software v.2.3.4. http://pritch.bsd.uchicago.edu/struc-ture.html (May 12, 2012).
Distruct software.
http://www.stan-ford.edu/group/rosenberglab/distruct.html (May 12, 2012). Earl DA and vonHoldt BM (2012) Structure Harvester: A website
and program for visualizing STRUCTURE output and im-plementing the Evanno method. Conserv Genet Resour
4:359-361. Core version: vA.1
http://taylor0.biol-ogy.ucla.edu/structureHarvester/ (August 27, 2013). Gómez S (2007) El Galeón de Manila en el siglo XVIII. Navíos de
la Carrera de Filipinas.
http://www.todoababor.es/articulos/nav_carrerafilipinas.ht m (August 20, 2013).
González Fernández M (2011) Proa a la Mar N162: 40-43.
Revista de la Real Liga Naval Española.
http://rlne.info/proaenpdf/proa162pdfs/galeonmanila162.p df (August 20, 2013).
Supplementary Material
The following online material is available for this article: Figure S1 - Pampa Rocha pigs.
Figure S2 - Graphical representation of delta K.
This material is available as part of the online article from http://www.scielo.br/gmb.
Associate Editor: Alexandre Rodrigues Caetano
License information: This is an open-access article distributed under the terms of the Creative Commons Attribution License, which permits unrestricted use, distribution, and reproduction in any medium, provided the original work is properly cited.