F
ACOLTÀ DI
C
HIMICA
I
NDUSTRIALE
Dipartimento di Chimica Industriale e dei Materiali
Master of Science in Advanced Spectroscopy in Chemistry
Classe LM/71 - Scienze e Tecnologie della Chimica Industriale
Anaerobic oxidation of ethanol over spinel
mixed oxides: the first step in the steam-iron
process for H
2
production
EXPERIMENTAL THESIS
First Session
Academic Year 2011-2012
Presented by: Supervisor:
Juliana Velásquez Ochoa Prof. Fabrizio Cavani
Co-supervisor:
ALMA MATER STUDIORUM -UNIVERSITÀ DI BOLOGNA
| 2
TABLE OF CONTENTS SUMMARY ... 3 1. INTRODUCTION ... 4 1.1 HYDROGEN ... 4 1.1.1 Properties ... 4 1.1.2 Production ... 51.2 STEAM-IRON AND THE ―CHEMICAL LOOP‖ CONCEPT ... 7
1.2.1 Steam-iron process: Modified materials ... 10
Ferrites properties ... 10
Mixed-Ferrite cycles ... 11
1.2.2 Steam-iron process: Using reducing fuels ... 12
1.3 INFRARED STUDIES OF THE INTERACTION ALCOHOL-CATALYST ... 14
Principle ... 14
Experimental setup ... 16
Applications ... 18
1.3.1 Diffuse Reflectance Infrared Fourier Transform Spectroscopy (DRIFTS) . ... 23
1.4 AIM OF THE THESIS ... 26
2. EXPERIMENTAL METHODOLOGY ... 27 2.1 CATALYSTS SET ... 27 2.1.1 Synthesis... 27 2.1.2 Characterization ... 28 3. RESULTS ... 35 3.1 X-RAY DIFFRACTION (XRD) ... 35 3.2 SURFACE AREA ... 38
3.3 TEMPERATURE PROGRAMMED REDUCTION (TPR) ... 38
3.4 RAMAN SPECTROSCOPY ... 39
3.5 DIFFUSE REFLECTANCE INFRARED FOURIER TRANSFORM SPECTROSCOPY (DRIFTS) ... 43
3.5.1 Session I: Room temperature adsorption of ethanol and its transformation + temperature programmed desorption (TPD) ... 44
NF450 ... 45 CF450 ... 48 CuF450 ... 50 FF450 ... 52 Comparison ... 53 Proposed pathways ... 55
3.5.2 Session II: Room temperature adsorption of ethanol + water ... 57
3.5.3 Session III: Ethanol adsorption at different temperatures ... 64
3.5.4 Session IV: Influence of the annealing temperature of the precursors .. 72
4. CONCLUSIONS AND PERSPECTIVES ... 82
ACKNOWLEDGMENTS ... 83
ALMA MATER STUDIORUM -UNIVERSITÀ DI BOLOGNA
| 3
SUMMARY
The future hydrogen demand is expected to increase, both in existing industries (including upgrading of fossil fuels or ammonia production) and in new technologies, like fuel cells. Nowadays, hydrogen is obtained predominantly by steam reforming of methane, but it is well known that hydrocarbon based routes result in environmental problems and besides the market is dependent on the availability of this finite resource which is suffering of rapid depletion. Therefore, alternative processes using renewable sources like wind, solar energy and biomass, are now being considered for the production of hydrogen. One of those alternative methods is the so-called ―steam-iron process‖ which consists in the reduction of a metal-oxide by hydrogen-containing feedstock, like ethanol for instance, and then the reduced material is reoxidized with water to produce ―clean‖ hydrogen (water splitting). This kind of thermochemical cycles have been studied before but currently some important facts like the development of more active catalysts, the flexibility of the feedstock (including renewable bio-alcohols) and the fact that the purification of hydrogen could be avoided, have significantly increased the interest for this research topic.
With the aim of increasing the understanding of the reactions that govern the steam-iron route to produce hydrogen, it is necessary to go into the molecular level. Spectroscopic methods are an important tool to extract information that could help in the development of more efficient materials and processes. In this research, ethanol was chosen as a reducing fuel and the main goal was to study its interaction with different catalysts having similar structure (spinels), to make a correlation with the composition and the mechanism of the anaerobic oxidation of the ethanol which is the first step of the steam-iron cycle. To accomplish this, diffuse reflectance spectroscopy (DRIFTS) was used to study the surface composition of the catalysts during the adsorption of ethanol and its transformation during the temperature program. Furthermore, mass spectrometry was used to monitor the desorbed products. The set of studied materials include Cu, Co and Ni ferrites which were also characterized by means of X-ray diffraction, surface area measurements, Raman spectroscopy, and temperature programmed reduction.
ALMA MATER STUDIORUM -UNIVERSITÀ DI BOLOGNA
| 4
1. INTRODUCTION
1.1 Hydrogen
1.1.1 Properties
Among common fuels, hydrogen has the highest specific energy and is the only one with zero CO2 emission (see Table 1). this makes it a good alternative especially when
compared to fossil fuels that are more contaminant and whose reserves are decreasing drastically with time. The challenge about moving into a hydrogen-based economy is the cost of the present production methods, the storage and transportation of it [1]. However, due to the importance of this kind of technology (especially hydrogen for fuel cells), the scientific community is working to overcome those issues. The present research work, for instance, is concerned with the development of a more efficient and clean hydrogen production process.
Table 1. Energetic characteristic for common fuels
Fuel Specific Energy KJ/g Density KHW/gal Chemical Formula Lbs CO2/gal Propane 50.4 26.8 C3H8 13 Ethanol 29.7 24.7 C2H5OH 13 Gasoline 46.5 36.6 C7H16 20 Diesel 45.8 40.6 C12H26 22 Biodiesel 39.6 35.0 C18H32O2 19 Methane 55.8 27.0 CH4 3 Oil 47.9 40.5 C14H30 20 Wood 14.9 11.3 -- 9 Coal 30.2 22.9 -- 19 Hydrogen 141.9 10.1 H2 0
ALMA MATER STUDIORUM -UNIVERSITÀ DI BOLOGNA
| 5
1.1.2 Production
Hydrogen does not exist alone in nature; it must be extracted from a hydrogen-containing feedstock. This can be done in different ways depending on the sources and technologies available as illustrated in Figure 1.1—1. There, it is also presented the different final uses of this gas [2]. Nowadays steam reforming of methane and electrolysis are the two main commercial processes. Nevertheless, hydrogen production from alternative pathways (as from biomass) is a strategic area of development since the demand of this gas is expected to increase rapidly in the future. The following paragraphs present the description and main facts of the two mentioned main processes. On the other hand, session 1.2 presents the description of the unconventional route studied in this research project (steam-iron process).
Figure 1.1—1. Summary of the hydrogen economy. Upper part: production – Lower part: uses.
Steam methane reforming (SMR)
In this process the methane source (usually natural gas) is put in contact with high temperature steam (700°C - 1000°C) at high pressure (3-25 bar). The products obtained in this step include hydrogen, carbon monoxide and carbon dioxide. Afterwards there is a second reaction called "water-gas shift" in which the resulting carbon monoxide is reacted with more steam to produce carbon dioxide and hydrogen.
Collimated Beam
ALMA MATER STUDIORUM -UNIVERSITÀ DI BOLOGNA
| 6
The final step is a purification of the hydrogen produced in a reaction known as "pressure swing absorption (PSA)" that condenses and removes all the carbon dioxide and impurities leaving only the hydrogen gas. The reactions representing this process are as following:
Steam-Methane reforming: CH4 + H2O (+heat) → CO + 3H2
Water-Gas Shift reaction (WGS): CO + H2O → CO2 + H2 (+small amount of heat)
This process is known for being economical and its efficiency is among the highest of current commercially available hydrogen production methods (65-75%). Furthermore, natural gas is a convenient and easy to handle hydrogen feedstock with a high hydrogen-to-carbon ratio. On the other hand, the cost of hydrogen produced by SMR is highly dependent on natural gas price which is nowadays a non expensive source but if the demand of natural gas in other market sectors continues to grow, the natural gas reserves would decrease and the supply, and so the price, will be compromised. Another drawback is the big amount of CO2 production which makes the expensive process of separation and
carbon sequestration necessary to have the pure hydrogen.
Electrolysis
Electrolysis consists in the dissociation of water into hydrogen and oxygen by means of an electric current that passes through the water. The reactions involved are:
Anode: 2 H2O(l) → O2(g) + 4 H+(aq) + 4e− Eoox = -1.23 V
Cathode: 2 H+(aq) + 2e− → H2(g) Eored = 0.00 V
The total reaction is endothermic, and the voltage indicated (1.23 V) is the minimal value to make this reaction thermodynamically favored at room temperature. It is necessary the addition of an electrolyte to the water in order to increase the conductibility, which for pure water is very low (0,055 Scm-1).
ALMA MATER STUDIORUM -UNIVERSITÀ DI BOLOGNA
| 7
These electrolytes should satisfy features such as low cost, high solubility and not to compete for the H+ and OH- species. In general making hydrogen from water by electrolysis is one of the most energy-intensive methods and it is also associated with considerable losses. Moreover, these electrolytic systems need costly materials such as the electrolyte membrane and noble metal-based electrocatalysts [3]. Therefore, this process is normally used when a higher purity of hydrogen is required. An advantage of this route is that it could be a zero emission technology if a renewable energy source, like a wind turbine or solar energy is used to produce the energy required for the process.
All the hydrogen production methods have variety of costs, benefits and challenges to overcome regarding the environmental impact, security, and economy. In this work the proposed method to produce hydrogen is the called ―steam-iron‖ which is interesting now that it implies the inherent separation from the carbon oxides and moreover because renewable feedstock as bio-alcohols can be used. Next session is dedicated to this particular process.
1.2 Steam-Iron and the ―chemical loop‖ concept
The so called ―Steam Iron‖ is an old process which allows producing, store and releasing pure hydrogen. It was developed in the late 19th century to produce hydrogen from gasified coal (mainly for use in aerial navigation) [4]. The use of cheap and low reactive iron ores made the process unviable in those early years and thus this method was quickly replaced by the more efficient and economical natural gas reforming.
However, the steam-iron process is nowadays subject of renewed interest because of its simplicity, feedstock flexibility (including renewable energy sources) and the purity of the obtained hydrogen which is especially important for the use in hydrogen fuel cells [5].
ALMA MATER STUDIORUM -UNIVERSITÀ DI BOLOGNA
| 8
Figure 1.2—1. Scheme of a thermochemical cycle using a reducing fuel
The principle of this process is a chemical-loop that separates the hydrogen production from the feedstock oxidation (as illustrated in Figure 1.2—1) so the reaction consists in two temporarily separated steps, reduction and oxidation. During the reduction step, a metal oxide (mainly iron-based) is put in contact with a reducing stream which is thus converted into carbon oxides and water, producing a lean gas. In the subsequent oxidation step, the reduced catalyst is re-oxidized by water vapor yielding a hydrogen rich fuel gas and restoring the original oxidation state of the metal oxide [6]. This type of thermochemical cyclic process for water cleavage has been studied for a variety of materials. A more generic schematization could be written as
A-O A + ½O2
A + H2O H2 + A-O
Where A can also be a combination of different compounds. The most relevant cycles are presented in Table 2 [7], from this data it can be noticed the high operation temperatures which makes them difficult to implement commercially. Another drawback is that the compounds involved in some of the cycles are toxic and/or corrosive (H2SO4, HCl)
and for this reason the research in this area is also aimed at finding new and highly resistance materials required because of the combination of high temperatures, high pressures and corrosive compounds.
ALMA MATER STUDIORUM -UNIVERSITÀ DI BOLOGNA
| 9
Table 2. Thermochemical cycles currently under consideration
Thermal Cycle Steps
Maximum Temperature (°C) Efficiency (%) Sulfur cycles Hybrid Sulfur
(Westinghouse, ISPRA Mark 11) Sulfur-iodine
(General Atomics, ISPRA Mark 16) 2 3 900 (1150 without catalyst) 900 (1150 without catalyst) 43 38
Volatile metal oxide cycles Zinc/zinc oxide Hybrid cadmium 2 1800 1600 45 42 Non-volatile metal oxide cycles
Iron oxide Cerium oxide Ferrites 2 2 2 2200 2000 1100-1800 42 68 43 Low-temperature cycles Hybrid copper-chloride 4 530 39
Among the various thermo-chemical cycles, those using pure and mixed iron oxides are considered the most feasible ones due to the availability, performance and low cost of this kind of catalysts. The ―steam-iron‖ cycle, originally proposed by Nakamura in 1977 [8], uses magnetite (Fe3O4) which is then reduced to wustite (FeO) and afterwards re-oxidized
with water to give hydrogen:
ALMA MATER STUDIORUM -UNIVERSITÀ DI BOLOGNA
| 10
Nowadays the studies are pointing towards the decrease of the operative temperatures. There are different approaches in the effort to improve this cycle:
a) Modification of the catalyst
b) The use of a reducing agent in the first step c) Reactors and devices design
Next session presents a general description of the former two since they are the ones explored in this research work but focusing mainly in the first one because there is a need for more efficient catalysts, especially for the first step since the reduction of the metal-oxide by the feedstock is endothermic and will determine probably the highest temperature required for the whole process
1.2.1 Steam-iron process: Modified materials
Ferrites properties
Magnetite is a ferrimagnetic mineral with chemical formula Fe3O4 that belongs to the
spinel group whose general formula is . To be more precise, this compound presents the inverse spinel structure in which the Fe2+ occupies octahedral sites and the Fe3+ occupies both octahedral and tetrahedral sites, a representation can be seen in Figure 1.2—2 (adapted from [9]). The spinel class of oxides belongs to the space group and to the point group. The lattice is cubic and consisting of 8 molecules within the unit cell, for a total of 56 atoms. The positions of the oxygen atoms are more or less fixed but the arrangement of the cations varies considerably within certain limits [10].
Figure 1.2—2. (a) Face-centered cubic spinel structure of magnetite. (b) Magnification of one tetrahedron and one adjacent octahedron sharing an oxygen atom.
Fe3+
ALMA MATER STUDIORUM -UNIVERSITÀ DI BOLOGNA
| 11
Mixed-Ferrite cyclesThe idea of the steam iron cycle is first to reduce magnetite (Fe3O4) to wustite (FeO)
but this reaction takes place only at temperatures higher than 1600 °C. However, if the composition is modified with other transition metals like Cu, Ni, Co, Zn, Mn and so on, it could help to decrease the operational temperatures of this first step in the thermo-chemical cycle. Those materials with the same structure and similar composition to magnetite are the ones known as ferrites. In most of the cases the modified materials have a lower reduction temperature but on the other hand sometimes the reoxidation step is more difficult than for the pure Fe3O4.
Figure 1.2—3 shows an example on how the free energy of the oxidation and reduction of Co3O4, Mn3O4 and Fe3O4 are related to the composition [7]. In this case,
Co3O4 is thematerial showing the lower temperature for thermal reduction but it presents
thermodynamic limitations regarding the reoxidation step with water. The opposite is true for the Fe3O4. From this, it can be stated that the redox properties of this spinel type mixed
oxides are strictly related to both the chemical composition and some morphological properties.
Figure 1.2—3. Gibbs free energy of the two reactions of the chemical loop for Co, Mn and Fe spinel-type oxides: (a) thermal reduction (b) water reoxidation.
ALMA MATER STUDIORUM -UNIVERSITÀ DI BOLOGNA
| 12
In order to develop the more active catalysts some modifications to the original composition have been proposed, for example, the replacement of the iron 2+ in Fe3O4 by
other transition metals, such as Mn, Ni or Co, to form mixed metal oxides (Fe1-xMx)3O4
could help to make easier the oxygen transfer to the reagents. This type of oxides called ferrites and their behavior in the ethanol oxidation are the subject of the present study.
In the literature there are some reports about modified ferrites and that present promising features for their use in this type of reaction. For example, Fresno et al., studied some commercially available mixed oxides (NiFe2O4, Ni0.5Zn0.5Fe2O4, ZnFe2O4,
Cu0.5Zn0.5Fe2O4 and CuFe2O4) by carrying out the reduction step at 1723°C and in this
case NiFe2O4 showed the lowest temperature for the thermal reduction and the highest net
hydrogen production for the oxidation step [11].
In another work, Kodama et al studied CoFe2O4/ZrO2 and compared it with the
MnFe2O4/ZrO2 reported also by them before. They performed the thermochemical cycle in
an inert atmosphere at temperatures starting from 1400 °C for the reduction step and around 1000 °C for the oxidation with water. They concluded that In most of the runs, Co-ferrite displayed higher reactivity than the Mn(II)-Co-ferrite [12]. In a related paper the performance of the Ni-ferrite is reported under the same conditions and as a conclusion they stated that the NiFe2O4/ZrO2 was found to be a very promising working material for
the cycle and that the reactivity of this material could be reproduced in the repeated cycle with even a better performance than the obtained with the CoFe2O4/ZrO2 [13].
1.2.2 Steam-iron process: Using reducing fuels
The high temperatures needed for the thermal reduction are mainly attributed to the high activation energy for releasing the oxygen in lattice so the addition of a chemical reaction with a reducing agent can lower the reaction temperature and this is another approach in the attempt to improve this process: the study of the reducing fuel used in the first step. Among the options available, the most commonly used are:
ALMA MATER STUDIORUM -UNIVERSITÀ DI BOLOGNA
| 13
Hydrogen: The aim of using hydrogen in the first step is for chemical storage since the hydrogen can be later released in the moment when it is needed. For example, as a fuel in a car the reduced material can be charged (metallic iron for instance) and then water can be added to finally produce the hydrogen. The practical limitation for this approach is the amount of hydrogen that can be stored (less than 4,8%)[14].Methane: The redox cycle based on methane as a reducing agent is as follows:
This particular process is attractive since is an alternative to the classical SMR+WGS+PSA process used for the production of high purity hydrogen [15]. Besides, as mentioned before, methane is nowadays a rapidly available feedstock. The drawback is that it is still hydrocarbon-based. Other publications use syngas as the reducing stream, derived from the reforming of light hydrocarbons; this approach is similar to that from methane because the real reducing agents are CO and H2 obtained from methane
decomposition (as previously discussed) [16].
Pyrolysis oil: The use of pyrolysis oil in the steam-iron process facilitates transportation and simplifies gasification and combustion processes of the feedstock before being processed to hydrogen as exposed by Bleeker et al [17]. The same authors mentioned the fact that coke deposition on the catalyst could be a drawback but they suggested that C can also be used as a reducing material.
Biomass gasification gas: The gasification of biomass yields the so-called biosyngas that contains amounts of CO and H2 depending on the applied process, oxidation medium, temperature processes and so on as studied by Wiebren et al., [18]. On the other hand low-temperature (<1000°C) gasification processes yields a product gas that contains significant amounts of hydrocarbon compounds. In most of the cases the biomass-derived gas produced is purified in a tar extractor and then used in the steam-iron process but doing so then there is the possibility of integrating the gasification part and the hydrogen production with fuel cell final application as explained in [19].
ALMA MATER STUDIORUM -UNIVERSITÀ DI BOLOGNA
| 14
Bio-Alcohols: Bio-ethanol is produced by fermentation of biomass materials. When oxygen is insufficient for normal cellular respiration, anaerobic respiration takes place by yeasts, converting glucose into ethanol and carbon dioxide. Using ethanol and bio-methanol to produce hydrogen by autothermal and steam reforming is currently an active research field [20]. The technology to produce these bio-alcohols, especially ethanol, from biomass is already accessible but it is still developing very fast so in the future the availability of this feedstock will be even higher. The advantages of using bio-ethanol as feedstock include its low toxicity, ease of deliverability and its potential for production from many different sources, ranging from cellulosic biomass to algae [21]. For these reasons, in the present research work ethanol was chosen as the probe molecule.1.3 Infrared studies of the interaction alcohol-catalyst
In the field of heterogeneous catalysis, the main goal is the understanding of surface chemistry phenomena and Infrared spectroscopy (IR) has been successfully applied for it since the early 20th century when Buswell et al., reported the spectra of water adsorbed on montmorillonite [22]. Further developments related to IR, as Fourier transform instruments and diffuse reflectance attachments, have made this technique one of the most widely used for the characterization of solid surfaces.
The advantages of using this technique include the relative low cost of the instrumentation and accessories needed to study catalysts surfaces, moreover, it is relatively easy to adapt the IR apparatus for in-situ studies making possible to apply it in the mechanistic studies of heterogeneous catalyzed reactions. Next session gives a brief description of the principle of infrared spectroscopy. A detailed explanation is not the purpose of this handout.
Principle
Energy levels in a molecule, include the electronic, vibrational and rotational levels as depicted in Figure 1.3—1 [23]. At absolute zero all polyatomic chemical species are at the ground state but they can be promoted to a higher level if they adsorb radiation of the
ALMA MATER STUDIORUM -UNIVERSITÀ DI BOLOGNA
| 15
adequate intensity. In the case of infrared radiation, the energy is of the order of transitions between vibrational states, this means that when infrared light hits a sample it mainly causes vibrational motions of the atoms like stretching, bending, wagging, rocking and so on. If the movement causes a variation of the dipole moment along the vibrational coordinate of the molecule, then it is said to be infrared active.
The most important IR bands arise from the simplest distortions of the molecule called "normal modes" and here the molecule is going from the ground state to the first excited level. In some cases, "overtone bands" are observed when the absorption of a photon leads to an excited vibrational state which is not necessarily the first one. Such bands appear at approximately twice the energy of the normal mode. There are also some other possible phenomena as the ―combination modes" that involve more than one normal mode and the ―hot bands‖ which appear when the transition starts in a vibrational state which is not the ground state. The phenomenon of Fermi resonance can arise when two modes are similar in energy; Fermi resonance results in an unexpected shift in energy and intensity of the bands.
Figure 1.3—1. Energy levels of a molecule.
The number of potentially occurring normal vibrations depends on the degree of freedom of the system. In the case of a single molecule consisting of N atoms, there are 3N-6 degrees of vibrational freedom (3 for each atom, minus 3 rotational and 3 translational movements of the entire molecule in the 3D space). Linear molecules have 3N-5 degrees of vibrational freedom, because the rotation around the main molecule axis does not produce any change of rotational energy.
ALMA MATER STUDIORUM -UNIVERSITÀ DI BOLOGNA
| 16
The possible modes of vibrations in a solid differ from the ones in the gas or liquid phase now that in the former case the atoms are not free to translate and rotate. Instead, they vibrate in a collective way giving rise to modes give rise to lattice vibrations ('frustrated translations and rotations') and acoustic modes [24]. Therefore, for a solid, the number of vibrational modes is in total 3N-3 where N is the number of atoms present in the smallest (primitive) Bravais cell, and minus three because those are the number of translations of the cell as a whole in the 3D space.
Experimental setup
There are a several ways in which the IR technique may be implemented for the study of the vibrations of adsorbates on surfaces. The most common ones include:
Transmission/Absorption IR Spectroscopy: This configuration is by far the most used. It follows the well known Beer-Lambert law: A = log(I0 /I1) where I0 and I1 are the intensities
of radiation before and after transmission through the sample (like in Figure 1.3—1).
Figure 1.3—2. Infrared absorption/transmission optical path
The solid sample must, of course, be able to transmit part of the IR radiation which is sometimes not the case for some of the common catalysts which are highly absorbent and in any case as normally the sample is prepared in the form of a pressed disk, it can have some mass transport limitations for the adsorption of molecules on it. This is often used for studies on supported metal catalysts where the large metallic surface area permits a high concentration of adsorbed species to be sampled.
ALMA MATER STUDIORUM -UNIVERSITÀ DI BOLOGNA
| 17
Reflection-Absorption IR Spectroscopy (RAIRS): In this case the IR beam is specularly reflected from the front face of a highly-reflective sample, such as a metal single crystal surface (see Figure 1.3—3, [25]). In this configuration vibrations can only be detected if they are perpendicular to the surface. One major problem is that the signal is usually very weak owing to the small number of adsorbing molecules. Typically, the sampled area is around 1 cm2.Figure 1.3—3. Infrared reflection-absorption optical path
Attenuated Total Reflection (ATR): Also known as Multiple Internal Reflection Spectroscopy (MIR). Here the IR beam is passed through a thin, IR transmitting sample in a manner such that it alternately undergoes total internal reflection from the front and rear faces of the sample. At each reflection, some of the IR radiation may be absorbed by species adsorbed on the solid surface [26].
Figure 1.3—4. Infrared Attenuated Total Reflection optical path
Diffuse Reflectance IR Spectroscopy (DRIFTS): in which the diffusely scattered IR radiation from a sample is collected, refocused and analyzed. This modification of the IR technique can be employed with samples that are not sufficiently transparent to be studied in transmission. Next session is dedicated to this particular experimental setup since it was the one employed during the present work.
ALMA MATER STUDIORUM -UNIVERSITÀ DI BOLOGNA
| 18
Figure 1.3—5. Infrared diffuse reflectance optical path
Applications (IR+Ethanol adsorption)
Nowadays approximately 80% of the processes in the chemical industries require the use of catalysts. Most of the catalytic processes are heterogeneous in nature, which means that the catalyst is in a different phase than the reagents [27]. Therefore, the study of the chemistry about the interactions developing on those interfaces is of great interest. Supported noble metals and transition metal oxides represent the majority of the solids used for catalysis. When performing in a reaction, these solids are able to absorb and transform the initial molecules to the desired products according generally to the following sequence:
Diffusion of reactants to the active surface
Adsorption of one or more reactants onto the surface
Surface reaction
Desorption of products from the surface
Diffusion of products away from the surface
The above scheme not only takes into account the adsorption process but also its reverse - namely desorption. The adsorption and transformation of ethanol over metal oxides surfaces has been extensively studied [28-31] but even when ethanol seems to be a simple molecule, the range of possible products and the pathways followed are not a simple matter. Next paragraphs present examples where the infrared spectroscopy was useful to understand the adsorption and transformation of ethanol over different catalysts surfaces.
ALMA MATER STUDIORUM -UNIVERSITÀ DI BOLOGNA
| 19
Ni/MgOBusca et al. [32] performed reactivity and FTIR studies of this system and concluded that ethanol decomposition occurs on catalyst surface through formation of acetaldehyde, which is converted to acetates and then to carbonates (detected by IR), or decomposes to CO2, C and H. They proposed the following pathway:
Figure 1.3—6. Main reaction steps in the ethanol-acetaldehyde dry decomposition over Ni/MgO
TiO2, Au/TiO2
In the study by Nadeem et al. [33], the TPD/FTIR results of the titania support and the support impregnated with gold showed significant differences and allow them to propose the route followed in each case. The detection of crotonaldehyde by infrared gave them a hint to suggest the route for the formation of benzene which was the main product over the gold containing catalyst.
ALMA MATER STUDIORUM -UNIVERSITÀ DI BOLOGNA
| 20
Pt/Al2O3, Pt/SiO2Petkovic et. al [34] used a combination of in situ DRIFTS analysis and first-principles DFT-based calculations to study the ethanol oxidation on Pt-containing catalysts. They found that Pt nanoparticles trap and accumulate oxygen at their surface and perimeter sites and play the role of sites that burn ethanol molecules and their partially oxidized derivatives to the ‗‗final‘‘ products. With respect to the support, they stated that alumina provides higher mobility of the fragments of ethanol molecules than the silica surface and hence increases the conversion rate of ethanol.
Pd/CeO2, Pt/CeO2, Rh/CeO2
In the work reported by Idris [35] the comparison of ethanol adsorption over the three different ceria-supported noble metal catalysts was studied mainly by DRIFTS/TPD experiments and he found that ethanol dehydrogenation to acetaldehyde was facilitated by the presence of Pt or Pd; at higher temperatures the acetaldehyde condensed to other organic compounds, such as crotonaldehyde. By contrast, in the presence of Rh only traces of acetaldehyde or other organic compounds were seen on the surface, and detectable amounts of CO were found upon ethanol adsorption at room temperature. This, according to the author, indicates the powerful nature of Rh in breaking the carbon-carbon bond in ethanol. At the end he proposed the following general route depending on the metal.
Figure 1.3—8. Adsorption and decomposition pathways of ethanol over Rh, Pd or Pt supported catalysts
ALMA MATER STUDIORUM -UNIVERSITÀ DI BOLOGNA
| 21
Ni–Co–Zn–Al mixed oxides (from hydrotalcites)The research presented by Busca and co-workers [36] shows a complete picture of the catalysts for the ethanol steam reforming system since they performed infrared characterization of the precursors (hydrotalcites) and the corresponding mixed oxides in combination with an infrared study of the species adsorbed and those on the gas phase (Figure 1.3—9). Besides, reactivity studies were also performed. Roughly, the remarks of the research are that the presence of cobalt increases the selectivity to H2 and CO and
decreases selectivity to methane in the low temperature range and that the most relevant fact influencing the selectivity is the evolution of surface acetate species (observed by infrared).
Figure 1.3—9. IR spectra of the adsorbed species (down) and of the gas phase (up) upon adsorption and conversion of ethanol
Pt/ZrO2, Pt/CeO2 and Pt/CeZrO2
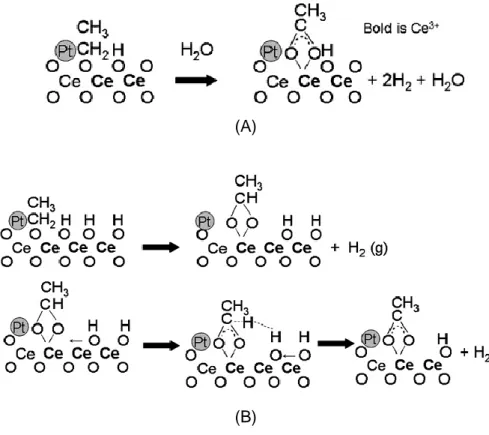
In the study carried out by De Lima et al. for this system [37] the authors proposed two routes for the formation of acetates when using the CeO2 support (Figure 1.3—10).
They observed that addition of Zr strongly increased the density of oxygen vacancies of the support due to the high oxygen mobility of the CeO2–ZrO solid solution formed. Therefore, the density of Type II bridging OH can be higher and it favors the pathway for the conversion of ethoxy to acetate species involving this group (Similar to Figure 1.3—10 (B))
ALMA MATER STUDIORUM -UNIVERSITÀ DI BOLOGNA
| 22
(A)
(B)
Figure 1.3—10. Acetate formation by two routes: (A) the hydroxyl route (without changing Ce oxidation state) and (B) via type II OH groups
Ni/Ca-Al2O3
The authors (Choong et al., [38]) compared the DRIFTS and TPD spectra of the support and the material promoted with Ni and they observed that Ni has a good capability to break the C-H and C-C bonds as well as high WGS activity. About the addition of Ca to the support, they stated that is useful since it promotes water adsorption providing abundant OH groups adsorbed that can participate along with Ni in the conversion of adsorbed intermediate species such as CH3CO and CH3CO into CH3COO at lower temperatures and that it reduces the dehydration reactions because Ca addition reduces the density of acidic sites on the alumina surface as seen by DRIFTS of the alumina with and without added Ca (see Figure 1.3—11).
ALMA MATER STUDIORUM -UNIVERSITÀ DI BOLOGNA
| 23
Figure 1.3—11. DRIFT spectra of the catalyst support in the OH region
There are many more examples in the literature of this kind of studies since ethanol adsorption is the key step in several reactions of interest, including steam reforming and partial oxidation. Nevertheless, until now no reports were founds of in-situ DRIFTS (or transmission) spectroscopy for the adsorption of ethanol over ferrites which is the topic explored on the present research.
1.3.1 Diffuse Reflectance Infrared Fourier Transform Spectroscopy (DRIFTS)
When an infrared beam reaches a sample, the incoming light can be reflected, scattered or transmitted. Only the part of the beam that is scattered within a sample and returned to the surface is considered to be diffuse reflection. As the light that leaves the surface has passed through a thin layer of the material, the intensity of the incident wavelength will be modified and this will give the structural information about the substrate. The principle of this technique is illustrated in Figure 1.3—12.
In DRIFTS the light intensity scattered at a given wavelength from an ―infinitely thick‖ closely packed catalyst layer is compared with that scattered of a non-absorbing (white) reference. The light scattered is then collected in an integration sphere and detected.
ALMA MATER STUDIORUM -UNIVERSITÀ DI BOLOGNA
| 24
Figure 1.3—12. DRIFTS principle illustration
A more complete view of the experimental configuration can be observed in Figure 1.3—13 (adapted from [39]). Here the infrared source is collimated and directed to the paraboloid (P) that focuses the beam onto the sample (S) trough a small hole. The specular reflected light returns to the paraboloid but the diffuse one is collected by the ellipsoid (E) and directed to the detector.
Figure 1.3—13. Example of configuration of the optics allowing the diffuse light to be collected.
Regarding the intensity of the scattered light collected, generally the Kubelka-Munk theory is accepted. It provides a correlation between reflectance and concentration expressed with the Kubelka-Munk formula:
IR Source Reflected light
ALMA MATER STUDIORUM -UNIVERSITÀ DI BOLOGNA
| 25
Where, R = reflectance k = absorption coefficient s = scattering coefficientc = concentration of the absorbing species A = absorbance
The original theory has some limitations since it assumes infinite sample dilution in a non-absorbing matrix, a constant scattering coefficient and an ―infinitely thick‖ sample layer. However, with proper sample preparation diffuse reflectance spectroscopy can provide ppm sensitivity and high quality results. It is also stated by G. Busca in his review about infrared of organic molecules adsorbed on metal oxides [40] that the performances obtained using the transmission/absorption technique and those with the diffuse reflectance technique are today quite comparable.
Among the different experimental setups for infrared spectroscopy, diffuse reflectance is maybe the one giving the easiest access to the study of the surface of materials. One of the great advantages of this technique is that it does not require a complicated sample preparation, the catalyst powder is directly put in the sample holder and diluted with KBr if needed, and this avoids the mass transport limitations that are usually a drawback when using pressed discs (as in transmission) for kinetic studies for example.
Another characteristic that makes this technique attractive is the possibility to perform in-situ and even operando studies of reactions. The former term refers to the study of the catalyst under controlled atmosphere including the actual reaction mixture. Operando definition requires besides, the simultaneous measure of the conversion or a reaction rate alongside the spectroscopic data on the same cell and catalyst bed [41]. However, this last aspect is still under development since is the determination of an intrinsic reaction rate would require the careful consideration of the chemical engineering aspects of the reactors when designing the spectroscopic cells since normally they are not ideal reactors.
ALMA MATER STUDIORUM -UNIVERSITÀ DI BOLOGNA
| 26
1.4 Aim of the thesis
The present research work was carried out in order to understand the interaction of ethanol with spinel-like catalysts having different composition and under different experimental conditions. The study was focused in the characterization of the species adsorbed on the surface of the materials by means of diffuse reflectance infrared Fourier transformed spectroscopy (DRIFTS). The parent project which is the frame for this study is the production of hydrogen by the steam-iron process here illustrated:
Figure 1.4—1. Steam-iron process with Ethanol (A=Fe, Ni, Co, Cu)
The reduction of the ferrite by the ethanol is the first step of the cycle that, due to its endothermic nature, is crucial when choosing the operative temperature of the process. In order to optimize this step, it is necessary to understand the mechanism involved in the reduction process of the catalyst and how it is related to the structure, composition and/or to morphological characteristics. In this regard, in situ DRIFT spectroscopy combined with mass spectrometry is a powerful tool since it allows the identification of the species adsorbed on the surface of the catalyst and those desorbed as product of the reaction. This information can help to understand the differences in the reactivity of the catalysts and their product distribution which at the same time should guide the development of a more efficient catalyst for this important process.
The set of catalyst chosen to perform this study were modified ferrites with a general formula A2+Fe23+O4 since they have showed good performance in the thermal reduction
followed by hydrogen production. However, the idea in this case is also to use ethanol as a reducing stream which could help to decrease the operative temperatures and produce a lean gas that could have different uses depending on the composition. In order to compare and correlate the behavior of the different materials they were first characterized by means of x-ray diffraction (XRD), Raman spectroscopy, temperature programmed reduction (TPR) and surface area measurements.
ALMA MATER STUDIORUM -UNIVERSITÀ DI BOLOGNA
| 27
2. Experimental methodology
2.1 Catalysts set
The aim of the parent research project is to find a catalyst able to perform efficiently the ferrite cycle with ethanol as reducing fuel, using for the reaction conditions as soft as possible. This particular research was focused on the characterization of the catalysts and in the study of the interaction of the ethanol with them. Materials investigated include CoFe2O4, NiFe2O4, CuFe2O4 and Fe3O4 (magnetite); these materials are expected to be
good O2-/electrons carriers and thus helpful for the cyclic reforming of ethanol.
2.1.1 Synthesis
The four catalysts were synthesized using a co-precipitation method. For the CoFe2O4
catalyst 250ml of a 2M solution of NaOH were added dropwise to 50 ml of a solution 1M of Fe(NO3)2•6H2O and 0.5M of Co(NO3)2•xH2O at 50°C and pH>10. Afterwards the solution
was kept under vigorous stirring for 3h and the precipitate was finally washed with water and filtered under vacuum. Same method was used for the other catalyst using Ni(NO3)2•6H2O as the Ni2+ source and Cu(NO3)2•2,5H2O for the Cu2+. For the magnetite,
the supplies used were FeSO4•7H2O (for the Fe2+) and FeCl3 (for Fe3+).
The powders were dried at 120°C for 4h (for the magnetite the drying temperature is 80°C in order to avoid the oxidation of Fe2+ to Fe3+). These compounds are the precursors of the final mixed oxides. In order to obtain the catalysts, these precursors are annealed in static air at 450°C for 8h (N2 flow was used in the thermal treatment of the magnetite).
ALMA MATER STUDIORUM -UNIVERSITÀ DI BOLOGNA
| 28
Table 3. Labels used for the different materials
M2+ Precursor
Catalyst
(after thermal treatment) Co CFp CF450 Ni NFp NF450 Cu CuFp CuF450 Fe FFp FF450
2.1.2 Characterization
X-ray diffraction (XRD)From the famous Brag-law it is known that diffraction of x-rays occurs at all the angles of 2 simultaneously in powder samples. In order to obtain a diffraction pattern, the detector (in most designs) rotates to various 2 angles to measure diffraction from the sample. Figure 2.1—1 is a schematic diagram of a powder X-ray diffractometer, showing the rotating detector [42]. The most common source of X-rays is the Cu or Mo X-ray tube.
ALMA MATER STUDIORUM -UNIVERSITÀ DI BOLOGNA
| 29
In the present research this technique was used to determine if the synthesized catalysts had the expected inverse-spinel structure. XRD patterns in the range 10°<2<80° were recorded with a Philips PW 1050/81 apparatus controlled by a PW1710 unit (λ=0.15418nm (Cu), 40kV, 40mA). The scanning rate was 0,05°/s and step time of 1s.
The Debye-Scherrer equation was used for the calculation of crystallite dimensions, which is related to the FWHM (Full Width at Half Maximum) through the formula:
Where:
is the shape factor which is dimensionless and has a typical value of about 0.9, but varies with the actual shape of the crystallite, is the x-ray wavelength, is the line broadening at half of the maximum intensity (FWHM) in radians, θ is the Bragg angle and is the mean size of the ordered (crystalline) domains.
Surface area
The specific surface area was measured applying the single point BET method. The instrument used for this analysis was a Carlo Erba Sorpty 1700. The BET method (Brunauer Emmet Teller) calculates the surface area of the sample from the volume of the gas corresponding to the monolayer adsorption. The single-point approximation consists in the measurement of the pressure of adsorption and the corresponding gas volume adsorbed. The equation correlating this with the monolayer gas volume is:
Where P is the pressure, Ps is the surface tension of the adsorbed gas (nitrogen in
this case), V is the adsorbed gas volume and Vm is the monolayer gas volume. The percent error that derives from these approximations is about 5% on values over 3 m2; below this limit, the surface area calculated cannot be considered reliable.
ALMA MATER STUDIORUM -UNIVERSITÀ DI BOLOGNA
| 30
In the analysis around 0.5g of the sample was placed inside the sample holder and then heated at 150°C under vacuum (4 Pa) in order for it release the water, air or other molecules adsorbed. Afterwards the sample was put in liquid nitrogen and the adsorption of the gaseous N2 was carried out.
Temperature Programmed Reduction (TPR)
Temperature-programmed reduction (TPR) is a widely used tool for the characterization of metal oxides, mixed metal oxides, and metal oxides dispersed on a support. TPR is a method in which a reducing gas mixture (typically 3% to 17% hydrogen diluted in argon or nitrogen) flows over the sample. A thermal conductivity detector (TCD) is used to measure changes in the thermal conductivity of the gas stream. The TCD signal is then converted to concentration of active gas using a level calibration. Integrating the area under the concentration vs. time (or temperature) yields total gas consumed. Figure 2.1—2 shows an example of a TPR profile.
Figure 2.1—2. Temperature-programmed reduction profile for a metal oxide. Trace A displays the TCD signal output as a function of time. Trace B displays the temperature as a function of time during a 10
ALMA MATER STUDIORUM -UNIVERSITÀ DI BOLOGNA
| 31
The figure illustrates a TPR spectrum where the peak maximum indicates the temperature that corresponds to the maximum rate of reduction. The TPR method provides a qualitative, and sometimes quantitative, picture of the reproducibility of the catalyst surface, as well as its high sensitivity to chemical changes resulting from promoters or metal/support interactions.
This analysis is important and attractive because it does not depend of a specific property of the catalysts besides having reducible specie. This technique is not restricted to the study of metal oxides but almost all data existing are related to this type of solids. The reaction of a metal oxide with hydrogen can be expressed as follows:
For most part of the oxides this reaction has a negative free standard energy. But even with positive energies it could be carried out if the value of the water vapor partial
pressure is small enough now that in this case the term
2 2 log H O H P P
would be negative and
eventually can overcome the positive ΔG° in the equation:
2 2log
*
*
º
H O HP
P
T
R
G
G
The instrument used for this analysis was the TPD/R/O 1100 catalytic surface analyzer of Thermo Quest Company. The reducing gas was 5% H2 in Ar. The temperature
program started at 50 °C and then the temperature was increased at a rate of 10 °C/min until 650 °C were it was hold for 60 min.
ALMA MATER STUDIORUM -UNIVERSITÀ DI BOLOGNA
| 32
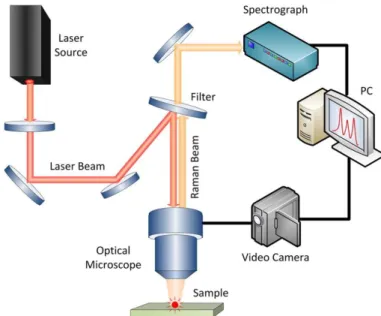
Raman SpectroscopyUsing Raman spectroscopy is possible to observe the differences in the vibrational modes of the samples with respect to the composition which causes local distortions that are not seen by x-ray diffraction. Raman spectra were recorded using a Ranishaw spectrometer with a 514.5 nm Ar+ ion laser source equipped with a microscope (50X lens was used). The power was 12.75 mW using 20 second exposure and 15 accumulations. The configuration to acquire this kind of spectra is similar to the one in Figure 2.1—3.
Figure 2.1—3. Raman spectrometer scheme
Diffuse Reflectance Infra-red Fourier Transform Spectroscopy (DRIFTS)
This technique was used to study the interaction of the ethanol with the different catalysts. The experimental setup is depicted in Figure 2.1—4. DRIFT-MASS scheme. First the sample is loaded in the sample holder and the cell is closed and inserted into the DRIFT apparatus. In order to feed the ethanol a system was adapted to the apparatus where the alcohol is loaded in a syringe which is pushed by a pump at the desired constant rate.
ALMA MATER STUDIORUM -UNIVERSITÀ DI BOLOGNA
| 33
Subsequently, ethanol is vaporized in the heating jacket and mixed with the carrier gas flow (Ar); finally, this gas mixture reaches the inlet of the diffusion reflectance cell and passes through the catalysts. The outlet in this case is connected to a quadrupole mass analyzer.
During a standard procedure, the sample was heated at 450°C with an Ar flow (4.5 ml/min) for 45 min in order to remove molecules eventually adsorbed on the material. Then the sample was cooled down to room temperature and the IR background was collected. Right after, ethanol was fed until saturation was reached (as seen by IR and MS, around 15 min) and then Ar was left to flow until the weakly adsorbed ethanol was evacuated. When the mass and DRIFT spectra were not changing, the temperature was increased to 200 °C for 1.5 min and then cool down to 30 °C to record the spectra. This last step was repeated for the other temperatures (200, 250, 300, 350 and 400°C).
Figure 2.1—4. DRIFT-MASS scheme
1. Inert feed (Ar). 2. Bubble flow meter. 3. Syringe for liquid feed. 4. Syringe pump.
5. Heating stripe. 6. DRIFT apparatus 7. High temperature cell 8. MASS analyzer
ALMA MATER STUDIORUM -UNIVERSITÀ DI BOLOGNA
| 34
Regarding the mass analysis, selected ions at the outlet of the DRIFTS apparatus were followed with time. Table 4 shows the m/z values detected and the correspondent characteristic products.
Table 4. Ions followed for the outlet of the DRIFTS
M/Z Main Compound Other compounds
2 Hydrogen
16 Methane
25 Ethylene
28 Carbon monoxide Ethylene, Ethane
29 Acetaldehyde Ethanol, Ethyl ether
30 Ethane
31 Ethanol Ethyl ether
40 Argon 41 Crotonaldehyde Butene 43 Ethyl acetate Acetaldehyde, Acetic acid Acetone
44 Carbon dioxide Acetaldehyde
45 Ethanol, Ethyl ether, Acetic acid 56 Butene 58 Acetone 59 Ethyl ether 60 Acetic acid 61 Ethyl acetate
ALMA MATER STUDIORUM -UNIVERSITÀ DI BOLOGNA
| 35
3. Results
3.1 X-ray diffraction (XRD)
Cobalt-ferrite
Figure 3.1—1 shows the XRD pattern for the cobalt ferrite catalyst after calcination at 450 °C. From this pattern it can be deduced that the desired CoFe2O4 spinel phase was
obtained and there is not segregation or transformation to other crystalline phases. The patter on the bottom, shown as a reference, is the calculated one for magnetite [43].
Figure 3.1—1. XRD pattern for the cobalt-ferrite catalyst calcined at 450°C (CF450) and the corresponding reference pattern for a ferrite spinel (magnetite).
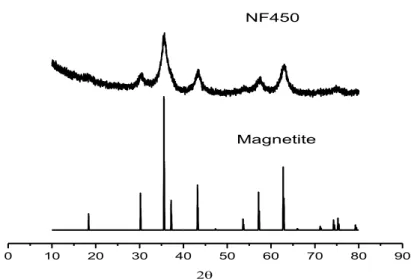
Nickel-ferrite
The XRD pattern of the nickel-ferrite catalyst calcined at 450 °C is shown in Figure 3.1—2 also compared to the magnetite structure. It can be observed that is less crystalline than the one for the cobalt-ferrite but still it has the spinel structure and it does not show the presence of other phases.
0 10 20 30 40 50 60 70 80 90
CF450
ALMA MATER STUDIORUM -UNIVERSITÀ DI BOLOGNA
| 36
Figure 3.1—2. XRD pattern for the nickel-ferrite catalyst calcined at 450°C (NF450) and the corresponding reference pattern for a ferrite spinel (magnetite).
Copper-ferrite
The XRD pattern (Figure 3.1—3) of the copper-ferrite shows that the spinel phase was obtained. However, there is an extra peak in the XRD pattern that indicates that in this case part of the Cu is not incorporated into the structure. The peak was ascribed to CuO (Tenorite) whose calculated pattern is also shown for comparison [43]. The segregation of the copper oxide can be due to the differences in ionic radii of the Cu2+ with respect to the Fe2+ (see Table 5) and also to the distortions caused by the Jahn-Teller effect. For this reason, this kind of spinel is normally synthesized with harder methods as solid state reaction above 1000 °C obtaining crystalline materials but with low surface area.
Table 5. size and mass of the different divalent ions
Catalyst Oh ionic radii1 Atomic mass
CF450 0.65 58.9
NF450 0.69 58.7
CuF450 0.73 63.5
FF450 0.61 55.8
1
For the divalent metal in the general formula of an inverse spinel [44]
0 10 20 30 40 50 60 70 80 90
NF450
ALMA MATER STUDIORUM -UNIVERSITÀ DI BOLOGNA
| 37
Figure 3.1—3. XRD pattern for the copper-ferrite catalyst calcined at 450°C (CuF450) and the corresponding reference pattern for a ferrite spinel (Magnetite) and copper oxide (Tenorite).
Magnetite
Figure 3.1—4 shows the XRD pattern for the unmodified ferrite catalyst after calcination at 450 °C. Also in this case the spinel phase was obtained.
Figure 3.1—4. XRD pattern for the magnetite calcined at 450°C (FF450) and the corresponding literature reference pattern for this material.
0 10 20 30 40 50 60 70 80 90 CuF450 Magnetite Tenorite 0 10 20 30 40 50 60 70 80 90 FF450 Magnetite
ALMA MATER STUDIORUM -UNIVERSITÀ DI BOLOGNA
| 38
3.2 Surface area
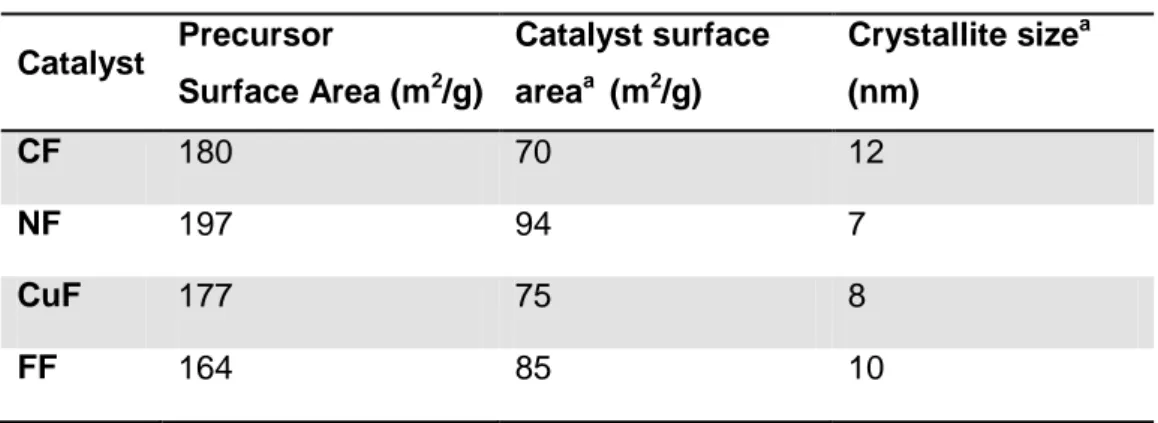
Table 6 shows the result of the surface area measurements for the fresh and calcined catalysts. The results show that all the ferrites have high surface area even after the thermal treatment. They all present similar SSA and crystallite size, which gives the possibility to compare the chemical differences without contribution from these morphological features. The results reported in Table 6 show a trend indicating that there is an inverse proportional relationship between the surface area and the crystallite size.
Table 6. Surface area and crystallite size results for the ferrites
Catalyst Precursor Surface Area (m2/g) Catalyst surface areaa (m2/g) Crystallite sizea (nm) CF 180 70 12 NF 197 94 7 CuF 177 75 8 FF 164 85 10
aFor the material annealed at 450 °C 8h
3.3 Temperature programmed reduction (TPR)
From Figure 3.3—1 it can be deduced that the reduction profile is highly dependent on the ferrite composition. As a general fact it is observed that the presence of the different cations (Ni2+, Co2+ and Cu2+) has a positive effect on the reducibility with respect to the pure magnetite which agrees with the thermodynamic comparison previously discussed. Among them, CuF450 has a superior degree of reduction at lower temperature. However, as shown by x-ray diffraction, this sample is not a pure spinel but this first peak at low temperature could be assigned to the reduction of Cu, both in the spinel and in the segregated CuO according to the studies of Khan et al., in similar materials (spinel Fe2.73Cu0.27O4 and CuO) [45].
ALMA MATER STUDIORUM -UNIVERSITÀ DI BOLOGNA
| 39
Figure 3.3—1. TPR profile upon hydrogen adsorption for the different catalysts
3.4 Raman Spectroscopy
Next paragraph describes the possible assignments of the normal modes of vibrations in ferrites according to the information collected by Hosterman [46]. In this assignment the main assumption is that the simplest unit of the spinel (
) is composed of two
AO4 tetrahedra and one B4 tetrahedra as proposed by Waldron [47].
A1g: Involves mainly oxygens moving away from the tetrahedral cation.
Eg: Symmetric bending motion of O anions within the AO4 unit.
F2g(1): Complet translation of the AO4 unit within the spinel lattice.
F2g(2): Translation along one direction of the lattice with the cation and oxygen moving
in opposite direction.
F2g(3): Either antisymmetric AO4 breathing or asymmetric bending motion of the oxygen
bonded to the tetrahedral ion. CuF450
NF450
FF450 CF450
ALMA MATER STUDIORUM -UNIVERSITÀ DI BOLOGNA
| 40
Even thought this assignment does not take into account the motion of the octahedral cation many researchers use it in assigning the vibrational modes [48-50]. However, taking into account that every oxygen atom is bound to three octahedral cations and only one single tetrahedral cation even if the cation remains at rest, the bonding force between octahedral cations and the oxygen atoms must be relevant for determining phonon energies.
This part of the characterization could help in this disclosure since in the structure of inverse spinels the tetrahedral cation should be the Fe3+ and the one changing is the octahedral one. However, this kind of study should be carried out much more carefully now that the spinels not necessarily have ideal cation distribution. Here, this technique was used just as an identification tool. Figure 3.4—1 shows the Raman spectra obtained for the catalysts annealed at 450 °C. The bands observed are collected and assigned in Table 7. The values are in agreement with previous reports in the literature for this type of materials [51-53].
Figure 3.4—1. Raman Spectra for the catalyst calcined at 450 °C: NiF450 (A), CF450 (B), CuF450 (C), FF450 (D). 200 300 400 500 600 700 800 900 100011001200 (D) (B) (C) (A) 200 400 600 800 1000 1200 (D) (B) (C) (A) Raman Shift (cm-1) (E)
ALMA MATER STUDIORUM -UNIVERSITÀ DI BOLOGNA
| 41
In the literature, there is not a general agreement regarding the assignment of the specific atomic motions within the spinel lattice during the Raman-active vibrations, especially in the inverse structure since they sometimes show active modes additional to the five predicted by group theory. Besides, the transition metal added can cause local distortions of the crystal lattice which usually are not detected by x-ray diffraction. Those local distortions of the structure respect to the pure magnetite depend upon the mass of the cations, the bonding forces, and the ionic radii. The idea with this type of studies on the differences of one structure with different composition helps to have an idea of which are the atoms involved in the vibration and their coordination.
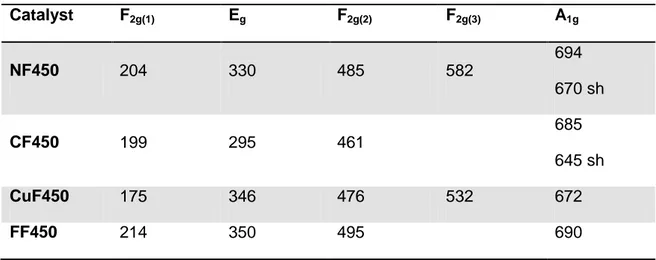
Table 7. Assignation of the Raman-active vibration for the different catalysts
Catalyst F2g(1) Eg F2g(2) F2g(3) A1g NF450 204 330 485 582 694 670 sh CF450 199 295 461 685 645 sh CuF450 175 346 476 532 672 FF450 214 350 495 690
As observed from the graph and the table, the most intense mode of vibration is the A1g and it is supposed to be related to the AO4 stretching which means that it should be the
same for all the samples since is the Fe3+ the one occupying this tetrahedral sites, so the small shift among them is an indication that in fact the ion in octahedral coordination has also influence in this mode. This mode of vibration has a shoulder in the case of the NF450 and CF450 which has been interpreted as the result of the distinct AO6 and BO6 octahedral units within the inverse lattice. The magnetite on the other hand does not present these two features but this is due to the fast electron transfer between the Fe3+ and Fe2+ cations occupying the octahedral sites. As a result, a valence of Fe+2.5 is often quoted for the octahedral site of Fe3O4 [46].
ALMA MATER STUDIORUM -UNIVERSITÀ DI BOLOGNA
| 42
On the other hand, the shift observed for the F2g(2) mode is bigger so it might be that
this one is more sensitive to the divalent cation in the octahedral coordination which has not been documented in detail in the literature. For the other vibrational modes the intensity is not enough to make an unambiguous assignment. A deeper study on the assignment of the vibrational modes is beyond the scope of this research but following the shifts in frequencies of some Raman-active modes while the metal cations within the spinel lattice are exchanged gives information about the dependence of the lattice vibrations on the tetrahedral and octahedral coordination and this could be helpful in a future in-situ study of the reaction by Raman spectroscopy.
For the ferrite modified with Ni, the Raman spectra was taken for the samples calcined at 320, 450 and 750 °C as presented in Figure 3.4—2. From there it is evident that an increase in the thermal annealing temperature produces more intense bands without any significant shift of the frequencies for the different vibrational modes. Thus, morphological factors as crystallite size and surface area should not affect the position of the main vibrational modes if the structure and the composition remain the same.
Figure 3.4—2. Raman spectra for the NiFe2O4 annealed at 750°C (A) 450 °C (B) and 320 °C (C)
200 300 400 500 600 700 800 900 1000
(A)
(B)
Raman Shift (cm-1) (C)
ALMA MATER STUDIORUM -UNIVERSITÀ DI BOLOGNA
| 43
3.5 Diffuse Reflectance Infrared Fourier Transform Spectroscopy
(DRIFTS)
The adsorption of alcohols over metal oxides can lead to different kind of adsorbed species depending on the surface properties of the material under study. Table 8 shows the most representative intermediates and collects the characteristic infrared bands for the adsorption of ethanol according to the literature [54-56] and the observations during this research. In general there is an agreement on the way that ethanol adsorbs at low temperature which is mainly as an ethoxide.
Table 8. Common species upon adsorption of ethanol on catalysts surfaces
Specie Characteristic frequency (cm-1)
Adsorbed ethanol 3200-3700 OH 1380 CH3 1270 OH Adsorbed ethoxide 2970 CH3 (as) 2930 CH2 (as) / CH3 (s) 2875 CH2 (as) 1107 CO(as) monodent
1065 CO(as) bident / CC (as)
1-Aldehyde 1650-1700 CO 2 -Aldehyde 2755 CH 1348 CH3 1275 CO 1148 CC 972 CH3 Acyl 2978 CH3 (as) 2901 CH2 (as) / CH3 (s) 1636 CO Acetate 1547 OCO(as) 1445 OCO(s) 1338 CH3 (s)
Carbonate 1547 OCO(as)
1318 OCO(s) Ö CH3CH2 H