Antonietta Aliberti
Tutor:
Prof.ssa Amalia Barone
University of Naples Federico II
Department of Agricultural Sciences
Division of Plant Genetics
Ph.D. Agricultural and Agri-food
Sciences
Exploiting genetic and genomic
resources to increase the ascorbic acid
3 INDEX
ABSTRACT 5
CHAPTER 1. INTRODUCTION 7
1.1THE TOMATO FRUIT QUALITY 8
1.1.1 Ascorbic acid 10
1.2TOMATO INTROGRESSION LINES 12
1.2RNA SEQUENCING TECHNIQUE 19
1.3CRISP/CAS9 TECHNIQUE 20
CHAPTER 2. SELECTION AND CHARACTERIZATION OF S. PENNELLII SUB-LINES 22
2.1MATERIALS AND METHODS 22
2.1.1 Plant materials 22
2.1.2 Morpho-agronomic analyses 22
2.1.3 Qualitative analyses 23
2.1.4 Ascorbic acid determination 23
2.1.5 Carotenoids determination 24
2.1.6 Statistical analysis 24
2.2RESULTS 25
2.2.1 Phenotypic characterization during the year 2016 25
2.2.2 Phenotypic characterization during the year 2017 32
CHAPTER 3. IDENTIFICATION OF CANDIDATE GENES CONTROLLING HIGH ASA CONTENT IN THE
SELECTED SUB-LINES 38
3.1MATERIALS AND METHODS 38
3.1.1 Raw data materials 38
3.1.2 S. lycopersicum cv M82 genome assembly 38
3.1.3 S. lycopersicum cv M82 annotation 39
3.1.4 IL12-4 and IL7-3 assembly 39
3.1.5 Molecular marker analysis 40
3.1.6 RNA-seq analysis 40
3.2RESULTS 42
3.2.1 S. lycopersicum cv M82 genome reconstruction 42
3.2.2 IL12-4 assembly 47
4
3.2.6 RNA-seq R182vsM82 62
CHAPTER 4. STRATEGIES TO STUDY THE FUNCTION OF GENES CONTROLLING ASA CONTENT IN
TOMATO FRUIT 66
4.1MATERIALS AND METHODS 66
4.1.1 Plant materials 66
4.1.2 RNA extraction and cDNA synthesis 66
4.1.3 DNA isolation 67
4.1.4 Primer design 67
4.1.5 Polymerase Chain Reaction 68
4.1.6 Escherichia coli DH5α Calcium Chloride competent cells 68
4.1.7 Overexpression Gateway cloning 69
4.1.8 Agrobacterium transformation 69
4.1.9 Stable and transient overexpression 70
4.1.10 Genotyping of GGP plants 72
4.1.11 AsA determination 72
4.1.12 Bioinformatics and statistical analysis 72
4.2RESULTS 73
4.2.1 Study of an epimerase gene 73
4.2.2 Epimerase stable and transient overexpression 82
4.2.3 GGP plants genotyping 83
4.3.3 AsA analysis of GGP plants 89
CHAPTER 5 DISCUSSION 91
5.1SELECTION AND CHARACTERIZATION OF S. PENNELLII SUBLINES 92 5.2IDENTIFICATION OF CANDIDATE GENES CONTROLLING HIGH ASA CONTENT IN THE SELECTED SUB-LINES B27
AND R182 95
5.3STRATEGIES TO STUDY THE FUNCTION OF GENES CONTROLLING ASA CONTENT IN TOMATO FRUITS 102
CHAPTER 6 CONCLUSIONS 107
REFERENCES 109
5
Abstract
The wild tomato species such as Solanum pennellii are an important source of genes that were lost during tomato selection and cultivation. The S. pennellii Introgression lines (ILs), which carry defined homozygous segments of the wild genome in the cultivated genetic background of cv.M82, are an important genetic resource to map quantitative traits loci (QTLs), such as those controlling plant yield and fruit quality, and to exploit the genetic diversity present in the wild species. Two introgression lines (IL12-4 and IL7-3) harbouring QTLs for ascorbic acid content were previously identified in the laboratory of Structural and Functional Genomics at the Department of Agricultural Sciences of University of Naples Federico II. These two ILs showed increased content of antioxidant compounds in the fruit compared to the cultivated S. lycopersicum cv. M82. Afterwards, sub-lines with reduced sizes of the introgressed region were obtained from IL7-3 and IL12-4.
The first aim of the present thesis was to perform the phenotypic selection and characterization of the S. pennellii sub-lines in different environmental conditions. In the fruit of the different sub-lines, the level of soluble solids content in terms of °Brix, firmness and ascorbic acid was highly variable in three different environmental conditions. The sub-lines R182 and B27, deriving from IL7-3 and IL12-4, respectively, were selected for their better performances in terms of fruit quality since they exhibited a significantly higher firmness, °Brix and ascorbic acid content compared to M82. Moreover, the two sub-lines also showed a production comparable to that of the control line M82 in all the environment conditions tested.
The second aim of the present thesis was to identify candidate genes involved in determing the high level of ascorbic acid in the fruit and mapping in the introgressed regions of the sub-lines R182 and B27. Since today the only reference genome used to investigate gene positions and functions in tomato still remains that of the first completely sequenced genome, i.e. that of S. lycopersicum cv. Heinz, the first step to reach this second aim was to reassembly the S. pennellii IL7-3 and IL12-4 genomes. In order to reassemble the genome of M82 and of the ILs, several resources were used. These consisted of Next Generation Sequence resources available today, such as the sequence data of the S. pennellii and different RNA-seq data related to the IL populations.
6 By using an integrated bioinformatic approach a new reference genome and annotation for IL12-4 and the IL7-3 was built. Moreover, to confirm the reliability of the IL7-3 assembly and define the size of S. pennellii introgression region in the sub-line R182, a group of species-specific molecular markers were designed based on polymorphisms found comparing the genomes of the cultivated and the wild species. Finally, to identify candidate genes mapping in the wild regions better defined in the present thesis, a transcriptomic approach with RNA-Seq was carried out. Transcriptome analyses allowed identifying three candidate genes in the two sub-lines: the Solyc12g098480 encoding for the UDP-glucoronic-acid-4-epimerase in the wild introgressed region of B27 and the Solyc07go49310 and Solyc07g049290 corresponding to two Major facilitator superfamily (MFS) proteins in in the wild introgressed region of R182. The third aim of the present thesis was to carry out the functional validation of candidate genes potentially involved in the control of ascorbic acid content in the red ripe fruit. The first gene selected was the UDP-glucoronic-acid-4-epimerase gene mapping in the introgressed region of the line B27. Its role in increasing ascorbic acid in this sub-line fruit was investigated through its over-expression in tomato fruit by stable and transient techniques. In addition, the genotyping and phenotyping evaluation of CRISP/Cas9 knock-out mutants for a non-canonical uORF carried by two GDP-L-galactosephosphorylases (GGP1, Solyc06g073320 and GGP2, Solyc02g091510) allowed demonstrating that these two genes are involved in the regulation of the ascorbate biosynthesis in tomato.
In conclusion, the results obtained in the present thesis, allowed selecting two elite sub-lines that in the near future could be used as breeding material to improve tomato fruit for nutritional traits. In addition, the results achieved allowed increasing knowledge about genes involved in the control of ascorbic acid content in tomato fruit. Indeed, three candidate genes were identified exploiting the genomics resources available for tomato, and other two genes have been functionally validated. The transfer of these genes by conventional and innovative strategies will aid in the future the creation of new improved varieties.
7
Chapter 1. Introduction
The cultivated tomato (Solanum lycopersicum) belongs to the nightshades Solanaceae, one of the most important and large plant family in the world, being present on all continents except Antarctica. Indeed, it was supposed that the Solanaceae family consists of about 98 genera and 2,700 species (Yadav et al., 2016), and is divided in three subfamilies, Solanoideae (to which belongs the genus Solanum), Cestroideae, and Solanineae (Knapp et al., 2004) with a great diversity of habitat, morphology and ecology. The greatest species diversity has been found in South America and Central America, where most members of the Solanaceae are erect or climbing, annual or perennial herbs, shrubs are not uncommon and there are also a few trees (Yadav et al., 2016). The Solanaceae family contains several of the most important species with a high economic impact and used every day in the human nutrition, such as tomato, potato (S. tuberosum L.) and aubergine or eggplant (S. melongena L.) (Knapp and Peralta, 2016) and other common species as tobacco and petunia, used for ornamental purposes. The cultivated tomato is widely grown around the world and supplies a major agricultural industry. It is the second most important vegetable crop after potato with a global production of about 164 million tons (t) of fresh fruit harvested on a 4.7 million hectares (ha) surface (FAOSTAT, 2016, http://faostat.fao.org). Most of tomatoes are consumed fresh as raw vegetable or added to other food items, however some varieties are harvested to be processed as paste, whole peeled tomatoes, diced products, and various forms of juice, sauces, and soups. Although tomato optimal growing temperature is around 25ºC during the day and around 20ºC during the night, it is grown in almost every corner of the world, in open fields or greenhouses from the tropics to the Arctic Circle. In the 2016, the most important producing countries were China, India and United States, Turkey, Egypt, Italy and Iran (Figure 1.1), followed by minor producing countries, such as Spain, Brazil, Mexico, Russia, Uzbekistan, Nigeria, Ukraine, Portugal, Tunisia, Algeria, Morocco, Camerun and Greece (FAOSTAT, 2016).
8 Figure 1.1- World tomato production. Major tomato producing countries in the
world during the year 2016 (http://faostat.fao.org).
As for processing and fresh tomato cultivation in Italy, the major producing regions are Puglia, Emilia-Romagna and Campania (USDA Foreign Agricultural Service, 2016). Nowadays, tomato is involved as a key food in the Mediterranean diet, indeed it is an important source of substances such as vitamins, minerals, and antioxidants, already known for their beneficial effects on human health (Raiola et al., 2014).
1.1 The tomato fruit quality
Quality is a key trait in plant breeding, especially for fruit and vegetables (Diouf et al., 2018). Commercial quality mainly relies on external attractiveness (colour, form, size), firmness and shelf life; organoleptic quality depends on physical (texture or firmness) and biochemical traits (mainly the contents in sugars, acids and volatile compounds) determining the overall flavour (Bertin and Genard, 2018). In the last years, the interest in quality traits, allowed to detect quantitative trait loci (QTL), which represent a very useful tool for gene cloning, MAS breeding, and trait improvement (Li et al., 2017). Tomato, among all Solanaceae species, is considering as a model system for dissection of genetic determinants of QTLs. They were detected in tomato for many important traits such as yield (Eshed and Zamir, 1995), disease resistance (Mutschler et al., 1996), tolerance to abiotic stress (Foolad et al., 1998) and plant architecture (De Vicente and Tanksley, 1993, Paran et al., 1997).
9 In the last years researchers have focused their attention especially on the fruit compositional quality for human health such as antioxidant compounds. Indeed, tomato fruits are rich in phytochemicals such as carotenoids (mainly lycopene and β-carotene), phenolic compounds (mainly flavonoids, such as naringenin), vitamins C and E (Valderas-Martinez et al., 2016) and their consumption has been associated with a reduced risk of inflammatory processes, cancer, and chronic non-communicable diseases (CNCD) including cardiovascular diseases (CVD), such as coronary heart disease, hypertension, diabetes, and obesity (Canene-Adams et al., 2005). Antioxidant metabolites are a group of vitamins, carotenoids, phenolic compounds, and phenolic acid, with health-enhancing effects on human body (Raiola et al., 2014).
Carotenoids are the pigments synthesized during fruit ripening and responsible for the final red colour of the fruit. In tomato two main carotenoids were found: the lycopene that represents around 90% of the carotenoids and the β-carotene, which is approximately 10% of the total carotenoids (Frusciante et al., 2007). Lycopene has antioxidant ability since it acts as free radical scavenger from reactive oxygen species (ROS). Free radicals are highly reactive, short-lived molecules that can react with damaging essential structural proteins, enzymes, and DNA. Such damage has the potential to cause cancer, atherosclerosis, cardiovascular, and other diseases. Lycopene has the potential to reduce such undesirable molecular events because the high-energy, highly reactive free electron on DNA is transformed to a much less reactive more stable free electron after it is delocalized along the conjugated 13 double bonds of the lycopene molecule (Friedman, 2013).
β-carotene is an organic compound classified as a terpenoid and it is a precursor of vitamin A. As lycopene, it is directly involved in reducing the formation of free radicals. Some researchers demonstrated that β-carotene prevents photooxidative damage and sunburn (Raiola et al., 2014). Indeed, β-carotene is particularly used for skin treatments.
10
1.1.1 Ascorbic acid
Ascorbic acid (AsA), also known L-ascorbic acid or Vitamin C, is one of the most important antioxidant compounds in plants, which are the major source of this vitamin in the human diet since humans are unable to produce it. Indeed, to provide antioxidant protection, the recommended dietary allowance (RDA) for vitamin C for non-smoking is approximately 90 mg/day for adult men and 75 mg/day for adult women (Food and Nutrition Board, Institute of Medicine, 2000), but it varies between different countries (Fang et al., 2017). Tomato is one of the most important AsA source for human health especially for people feeding with the Mediterranean diet. Usually the AsA content in tomato fruit ranges from 10 to 88 mg/100 g of fresh weight (FW) even if some commercial cultivars show a lower value (from 10 to 40 mg/100 g of FW) (Ruggieri et al., 2016). This is probably consequence of the tomato domestication/breeding process that led to select for agronomical traits negatively associated with AsA content (Locato et al., 2013). In plants, AsA serves as a major redox buffer, as a cofactor for many enzymes, and as a regulator of cell division and growth, as well as in signal transduction (Gallie, 2013).
The biosynthesis of AsA in higher plants takes place in mitochondria via several proposed routes (Akram et al., 2017) (Figure 1.2). The primary pathway is the D-mannose/L-galactose pathway (Wheeler et al., 1998). In this pathway, D-glucose is converted to D-glucose phosphate by the enzyme hexokinase. The D-glucose 6-phosphate formed is then converted to GDP-D-mannose via a four steps reversible process catalysed by the enzymes phosphogluco-isomerase, mannose 6-phosphate isomerase, phosphomannose mutase and GDP-D-mannose phosphorylase, respectively (Akram et al., 2017). The second major phase involves the conversion of GDP-D-mannose into GDP-L-galactose following three reactions catalysed successively by GDP-D-mannose 3′,5′-epimerase, GDP-L-galactose phosphorylase and L-galactose 1-P phosphatase. The GDP-L-galactose is subsequently converted to L-galactose by the action of enzyme L-galactose dehydrogenase and finally into L-galactono-1, 4-lactone (final precursor of AsA). Lastly, ascorbic acid is formed from lactone in an enzymatic reaction catalysed by L-galactono-1,4-lactone dehydrogenase (Akram et al., 2017).
11 The second pathway involves the cell wall pectins degradation, which results in the formation of methyl-galacturonate that is converted into L-galactonate via two reactions catalysed by methyl esterase and D-galacturonate reductase. Later on, the enzyme aldono lactonase catalyses the conversion of L-galactonate into L-galactono-1, 4-lactone and is finally used in ascorbate synthesis (Smirnoff et al., 2001). The third pathway involves the conversion of GDP-D-mannose to GDP-L-gulose and subsequent formation of L-gulono-1, 4-lactone via L-gulose (Wolucka and Van Montagu, 2003). This is similar to the primary pathway which starts from glucose however this pathway branches off from mannose. From here, GDP-D-mannose is converted to L-gulose in three reactions catalysed by GDP-D- GDP-D-mannose-3′, 5′-epimerase, GDP-L-gulose-1-P-phosphatase and L-gulose-1-P-phosphatase, respectively. At this point, the enzyme L-gulono-1, 4-lactone dehydrogenase catalyses the conversion of L-gulose into L-gulono-1, 4-lactone which is then finally converted to AsA (Smirnoff et al., 2001).
In a fourth pathway, the synthesis of ascorbate from myo-inositol is reported. Briefly, myo-inositol is converted to L-gulono-1, 4-lactone via three reactions catalysed by a myo-inositol oxygenase, a glucuronate reductase and an aldono lactonase (Valpuesta and Botella, 2004). The gulono-1, 4-lactone is finally used in ascorbate synthesis (Smirnoff et al., 2001). For convenience, the four major pathways and important precursor molecules have been elucidated in the form of a schematic diagram (Akram et al., 2017).
12 Figure 1.2- AsA synthetic and recycling pathways in plants. The four pathways included GalUA (D-galacturonic acid) pathway, Gal (L-galactose) pathway, Gulose(L-gulose) pathway and MI (Myo-inositol) pathway (Lu et al., 2016).
1.2 Tomato introgression lines
In addition to the cultivated species S. lycopersicum there are some related wild species, including S. pimpinellifolium (Jusl.) Mill. (current tomato), S. cheesmanii Riley, S. chmielewskii Rick, Kes., Fob. and Holle, S. chilense Dun., S. neorickii Rick, Kes., Fob. and Holle, S. peruvianum (L.) Mill., S. habrochaites Humb. and Bonpl., and S. pennellii (Corr.) D’Arcy. Among the wild species, the researchers interest is focused on S. pennellii, species of the South America that is considered an important donor of germplasm for the cultivated tomato S. lycopersicum (Bolger et al., 2014) due to its greater genetic variability
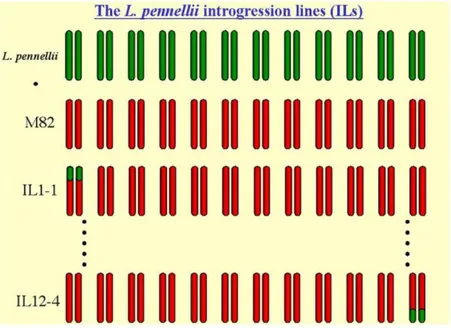
13 respect to S. lycopersicum, which lost lots of important traits during domestication and evolution. The cross among S. pennellii × S. lycopersicum cv M82 allowed to identify 76 ILs (Figure 1.3), which present different and defined wild chromosomal segments in the genetic background of the cultivated variety M82 (Eshed & Zamir, 1995,Zamir, 2001).
Figure 1.3- Schematic representation of S. pennellii ILs (http://zamir.sgn.cornell.edu).
Overall, these lines offer a complete coverage of the parental donor genome divided into 107 bins (with an average length of 12 cM each) (Smit et al., 2012) (Figure 1.4), which define the position of the donor parental introgression in the genome of the recurrent parent. These lines are an excellent resource of genetic variation so far used worldwide by several researchers for the identification of more than 2,700 agronomically useful QTLs, such as those controlling plant biomass yield, drought tolerance, morphology, chemical composition and other qualitative characteristics (Kamenetzky et al., 2010).
14 Figure 1.4- ILs bin mapping provides a rapid method for assigning a map position to DNA sequences (http://tgc.ifas.ufl.edu/vol49/VOL49/html/Vol4_26.htm), (http://zamir.sgn.cornell.edu).
In the last years, at the Department of Agricultural Sciences at the University of Naples Federico II, the attention was focused on two ILs, selected for the high content of AsA in the mature red fruit (Di Matteo et al., 2010, Sacco et al., 2013, Rigano et al., 2014). Indeed, the IL7-3 (Figure 1.5) carrying a S. pennellii introgression region of 35 cM, showed a QTL with possible candidate genes for the increase of antioxidant compounds in tomato fruit, as well as the IL12-4 (Figure 1.6) with an introgression fragment of 46 cM. Moreover, during breeding programs, these two ILs were crossed with the cultivated genotype S. lycopersicum cv. M82 in order to reduce the introgression size: different sub-lines were obtained and have been previously investigated to better identify possible candidate genes for the increment of AsA content (Figure 1.7, Figure 1.8) (Ruggieri et al., 2015, Calafiore et al., 2016). In the future these genes, using the new genomic techniques as RNA-seq and genome editing, could be identified and validated, to be then transferred in cultivated varieties to improve the content of quality traits as AsA content in fruits.
15 Figure 1.5- Chromosome 7 of S. pennellii IL7-3. A) Position of the introgression line IL7-3 respect to the chromosome 7. B)Mapping of possible candidate genes and of polymorphic molecular markers (N) in region 3 of chromosome 7. On the left, the position in bp of each gene/marker on the chromosome is also reported.
16 Figure 1.6- Chromosome 12 of S. pennellii IL12-4 A) Position of the introgression line IL12-4 respect to the chromosome 12. B) Mapping of possible candidate genes and of polymorphic molecular markers (M) in region 4 of chromosome 12. On the left, the position in bp of each gene/marker on the chromosome is also reported (Ruggieri et al., 2015).
17 Figure 1.7- Position of the IL12-4 sub-lines selected by Ruggieri et al. (2015).
18 Figure 1.8- Size and genomic identity of the seven sub-lines selected from the region 7-3 (Calafiore et al., 2016).
19
1.2 RNA sequencing technique
The term Next-generation sequencing (NGS) is used to describe several different modern sequencing technologies, including:
• Illumina sequencing; • Roche 454 sequencing;
• Ion torrent: Proton / PGM sequencing; • SOLiD sequencing.
These technologies allow to sequence DNA and RNA much more quickly and cheaply than the previously sequencing technique, revolutionizing the study of genomics and molecular biology (European Informatics institute,
https://www.ebi.ac.uk). Today the Illumina technology is most frequently used for RNA sequencing.
RNA sequencing (RNA-seq) now is the most common method to analyse gene expression and to uncover novel RNA species (Hrdlickova et al., 2017). In general, a population of RNA is converted to a library of cDNA fragments with adaptors attached to one or both ends. Each molecule, with or without amplification, is then sequenced in a high-throughput manner to obtain short sequences from one end (single-end sequencing) or both ends (pair-end sequencing) (Wang et al., 2009). After sequencing, reads are aligned to a reference genome or reference transcripts, whereas if the genomic sequence is not available a de-novo assembly strategy is performed (Wang et al., 2009). Generally, the RNA-seq is used to evaluate gene expression between two different conditions and to find different expressed genes using bioinformatics tools, as EdgeR packages from Bioconductor (Robinson et al., 2010), that count the number of read and compare them among samples.
This technique has allowed to identify candidate genes controlling different trait, in tomato as in many other species (Fang et al., 2016, Khalil-Ur-Rehman et al., 2017) In particular, RNA-seq analysis can be used in tomato to identify deferentially expressed gene involved in AsA pathways (Ye et al., 2015) or explore the interaction of mycorrhization and fruit development (Zouari et al., 2014).
20 Therefore, the transcriptomic analysis is key step to identify possible candidate genes, which function will be validated using different technique as stable or transient transformation, VIGS or the innovative genome editing technique.
1.3 Crisp/Cas9 technique
Since the last years, the functional validation of candidate genes was performed using different technique such as agroinfiltration mediated transient expression to overexpress gene involved in the content of AsA (Ye et al., 2015) or stable transformation (Ruf et al., 2001). However, actually, the most important validation technique is the genome editing with the CRISP/Cas9 approach.
The clustered regularly interspaced short palindromic repeats (CRISPR)/CRISPR- associated (Cas) technology is as a new gene-editing technique used to induce deletions or introduce specific changes at precise genomic loci (D’Ambrosio et al.,
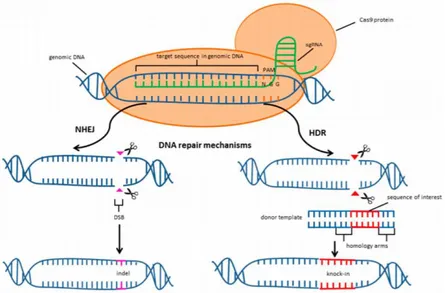
2018, Li et al., 2018, Tomlison et al., 2018, Ueta et al., 2017, Jinek et al., 2012). This CRISPR/Cas system is based on a Cas9 (Figure 1.9) bacterial endonuclease that forms a complex with a CRISPR RNA (crRNA) and a trans- activating CRISPR RNA (tracrRNA).
Figure 1.9- CRISPR/Cas9 mediated cleavage of genomic DNA and two major repair pathways (Kruminis-Kaszkiel et al, 2018).
21 These two RNA structures can be combined into the synthetic guide RNA complex (sgRNA) (Bassett et al., 2013). The sgRNA contains a 20-bp complementary sequence of the target sequence and brings target loci in the genome upstream of a specific protospacer adjacent motif (PAM), such as the canonical “NGG” for the Streptococcus pyogenes Cas9 endonuclease (Choo et al., 2017). These endonucleases play the function of a genomic scissors, create a double-strand breaks (DSBs), assuring precise genome editing. The disruption in the DNA sequence triggers various repair mechanisms, such as non-homologous end joining (NHEJ) and homology-directed repair (HDR), leading to the induction of specific knock-outs or knock-ins (Kruminis-Kaszkiel et al, 2018).
1.4 Aims of the thesis
The S. pennellii ILs IL7-3 and IL12-4, and their sub-lines already available, constitute a powerful genetic material to reach new results in the selection of superior genotypes and new insights in the identification of candidate genes for the increase of AsA in the tomato ripe fruit. The main goal of the present thesis is to increase the knowledge related to the accumulation of this metabolite in the fruit by exploiting various genetic and genomic resources available for the tomato species.
In particular, specific aims of the present thesis are:
1. to perform the phenotypic selection and characterization of S. pennellii IL7-3 and IL12-4 sub-lines, which carry positive QTLs for AsA accumulation in the tomato fruit;
2. to reassembly the S. pennellii IL7-3 and IL12-4 genomes and to identify candidate genes controlling high AsA content in the selected sub-lines and mapping in their wild genomic regions;
3. to carry out the functional validation of candidate genes through their over-expression in tomato fruit by stable and transient techniques or by the genotypic and phenotypic characterization of knock-out mutants obtained by the CRISP/Cas9 genome editing technique.
22
Chapter 2. Selection and characterization of S. pennellii
sub-lines
2.1 Materials and methods
2.1.1 Plant materials
Plant material used in Italy consisted of two S. pennellii in S. lycopersicum introgression lines (IL12-4 and IL7-3, accessions LA4102 and LA4066), the cultivated genotype M82 (accession LA3475), the IL12-4 subline B27 and seven IL7-3 sublines. The IL12-4 sub-line B27 was previously selected in our laboratory (Ruggieri et al., 2015). Two IL7-3 sub-lines (coded R201 and R202) were previously obtained in our laboratory (Calafiore et al., 2016), whereas five sub-lines (coded R176-R182) were kindly provided by Dr. Dani Zamir (Hebrew University, Israel). All genotypes were grown in open-field for two years (2016, 2017). Data collected in the year 2016 are related to one field (Acerra, Campania Region), whereas in the 2017 data were collected from three open fields in the South Italy: Acerra, Battipaglia and Giugliano following the traditional area farming practice. In each field a randomized complete block design was applied with three replicates per genotype and 10 plants per replicate. Fruits were collected at three development stages: Mature Green (MG), Breaker (BR) and Mature Red (MR). Seeds and columella were subsequently removed, and fruits were ground in liquid nitrogen and stored at −80°C until analyses. Leaves were also collected for each genotype, ground in liquid nitrogen by mortar and pestle to a fine powder and stored at −80°C until analyses.
2.1.2 Morpho-agronomic analyses
Three plants per genotype were used each week for measuring, from the second to the fifth inflorescence, traits related to fruit set (FS) and number of flowers/inflorescence (NFL), marking for each inflorescence the number of closed and cut flowers. Data recorded as number of fruit (NFR), fruit weight (FW) and yield (YP) were collected from all plants per genotype according to each genotype maturity.
23
The software Tomato Analyzer 3.0
(http://www.oardc.ohiostate.edu/vanderknaap/tomato_analyzer.php) was used for the fruit morphological characterization using six fruits per genotype to measure the fruit perimeter (FP), fruit area (FA), pericarp area (PA), pericarp thickness (PT), fruit shape index I and II (FSI I and II), distal and proximal angle (DA and PA, respectively).
2.1.3 Qualitative analyses
For each genotype and biological replicate 15 fruits were collected at MR stage to evaluate soluble solids content, firmness and colour. The soluble solids content was measured as °Brix in the homogenized juice from ripe fruit by a refractometer (Hanna), the firmness (F) of fruit cuticle was measured on one side of ripe fruit by a penetrometer with an 8 mm shore (PCE-PTR200 penetrometer). The colour of ripe fruit was assessed as percentage of reflectance (L) and absorbance index (a/b), where a is the absorbance a 540 nm and b at 675 nm, using a Konica Minolta CR-400a, and two measures per ripe fruit (six fruits per genotype).
2.1.4 Ascorbic acid determination
A colorimetric method was used for the ascorbic acid determination (Stevens et al., 2006) with modifications reported by Rigano et al. (2014). Briefly, 300 μl of ice-cold
6% TCA was used for 500 mg of frozen powder, afterwards the mixture was vortexed, for 15 min. incubated on ice and centrifuged at 14000 rpm for 20 min at 4°C. In an Eppendorf tube were placed 20 μl of supernatant with 20 μl of 0.4 M phosphate buffer (pH 7.4) and 10 μl of double distilled (dd) water. Then, 80 μl of colour reagent solution were prepared by mixing solution A [31% H3PO4, 4.6% (w/v) TCA and 0.6% (w/v) FeCl3] with solution B [4% 2,2′-dipyridil (w/v)]. The mixture was incubated at 37°C for 40 min and measured at 525 nm by a NanoPhotometerTM (Implen). Three separated biological replicates for each sample and three technical assays for each biological repetition were measured. The concentration was expressed in nmol of AsA according to the standard curve, designed over a range of 0–70 nmol; the values were then converted into mg/100 g of fresh weight (FW).
24
2.1.5 Carotenoids determination
The method reported by Zouari et al. (2014) was used for the carotenoids extraction. A solution of acetone/hexane (40/60, v/v) was added to one gram of powder and incubated for 15 min at room temperature. The mixture was centrifuged at 4000 rpm for 10 min and the absorbance of the supernatant was measured at 663, 645, 505, and 453 nm. Total carotenoids were determined by the equation reported by Wellburn (1994). Results were expressed as mg per 100 g FW. All biological replicates per sample were analysed in triplicate
.
2.1.6 Statistical analysis
Data analysis was carried out using SPSS Software version 23. The t-Student test was calculated for qualitative and quantitative traits to verify if genotypes were statistically different from the parental M82. A univariate analysis was performed to detect the genotype per environment interaction.
25
2.2 Results
2.2.1 Phenotypic characterization during the year 2016
The seven sub-lines derived from IL7-3 and the sub-line B27 derived from IL12-4 were analysed at Acerra in the year 2016 for productivity, measuring five yield-related traits compared to the control genotype M82 and to their parental lines IL7-3 and IL12-4. Moreover, eight different traits related to fruit quality were evaluated. As for the productivity (Table 2.1), no genotypes showed values of NFL significantly different from M82. Indeed, NFL varied from 5.08 (M82) to 5.94 (R202) with a mean value of 5.48. As for FS, the genotypes R179 and R202 showed a significant reduction of 25% (41.0) respect to M82 (56.0), as well as IL7-3 showed a significant reduction of 37% respect to M82 (35.6 vs 56.0). The FW was highly variable among the sub-lines, ranging from 35-42 g (R176, R178, R179, R201 and R202) to 54-55 g (R181 and R182), the latter value being not different from the parental genotypes M82 (51.7 g) and IL12-4 (54.8 g) whereas the other sub-lines showed a significant fruit weight reduction. As for NFR, this value ranged from the minimum of 24.7 recorded for R176 to the maximum of 32.4 recorded for R182, and no statistical differences were detected when comparing the sub-lines with M82, whereas IL7-3 exhibited a significantly lower value compared with the cultivated M82 (15.3 in IL7-3 vs 30.1 in M82). Finally, as for the yield per plant, in all the sub-lines a yield value similar to M82 was observed, with a mean of 1.26 kg/plant and only the genotype IL7-3 showed a value (0.60 kg/plant) significantly lower than M82 (1.58 kg/plant).
26 Table 2.1- Productivity of the sub-lines and their parental genotypes at Acerra in the year 2016.
Data related to parameters linked to the production, such as the number of flowers per inflorescence and the fruit set, are reported together with those strictly related to the yield/plant, such as fruit weight and the number of fruit per plant. The significance of differences of each genotype vs M82 was evaluated by the t-Student’s test (*:P<0.05; **:P<0.01).
M82 5.08±0.58 55.98±5.00 51.70±2.89 30.07±7.95 1.58±0.36 IL12-4 5.64±0.42 53.08±0.22 54.83±0.29 31.33±12.51 1.72±0.68 IL7-3 5.25±0.65 35.57±5.87** 39.50±1.80* 15.30±0.44* 0.60±0.03* B27 5.64±0.46 52.56±0.41 49.97±0.06 27.63±10.80 1.38±0.54 R176 5.44±0.51 40.93±7.05 42.00±4.00* 24.7±10.07 1.05±0.46 R178 5.61±0.59 53.38±1.49 39.00±6.56* 30.9±9.29 1.24±0.56 R179 5.44±0.27 41.74±3.44* 37.77±2.31* 27.7±5.40 1.05±0.17 R181 5.49±0.69 46.00±2.19 54.00±8.89 26.9±7.73 1.43±0.34 R182 5.19±1.47 53.86±13.28 55.00±1.00 32.4±8.76 1.78±0.28 R201 5.52±0.68 51.54±10.02 36.00±1.73** 29.1±15.10 1.07±0.61 R202 5.94±0.63 40.92±3.25* 35.33±3.51* 29.0±11.57 1.01±0.37 Yield/plant kg Genotype Flowers/inflorescence no. Fruit set % Fruit weight g Fruit/plant no.
27 The analysis of fruit quality traits carried out in Acerra in the year 2016 (Table 2.2) showed for some traits levels significantly different between IL7-3 sub-lines and M82. As for °Brix, a significantly higher level was observed for the sub-lines R178 (5.40), R179 (4.73), R181 (4.97), R182 (4.97), R201 (5.30) and R202 (5.47) respect to M82 (3.87), as well as IL7-3 and IL12-4 showed high significant values. As for fruit firmness R178, R179, R181 and R202 showed a lower value of 5.31 kg/cm2, 4.81
kg/cm2, 5.48 kg/cm2, 5.77 kg/cm2, respectively, compared with M82 (6.48 kg/cm2),
and only the sub-line R182 showed a very high level of firmness (8.40 kg/cm2). The
detection of fruit colour with Minolta in terms of a/b did not show significant differences among all lines analysed. Differences in the fruit colour were detected when measuring the chroma value, with a reduction of 12% between M82 and the genotypes R178 and R202. Metabolic analysis carried out on fruits (Table 2.3) evidenced that only R182 accumulated the significant highest levels of AsA compared to M82 in the green (18.45 mg/100 gr FW vs 11.00 mg/100 gr FW) and mature red (44.81 mg/100 gr FW vs 31.13 mg/100 gr FW) stages. In mature red stage significantly high AsA levels were also observed in IL7-3 (39.88 mg/100 gr FW), R202 (40.8 mg/100 gr FW) and B27 (35.35 mg/100gr FW) and only R179 (25.96 mg/100 gr FW) exhibited a significant lower value respect to M82. As for lycopene only R176, R178, IL12-4 and B27 showed significantly lower values respect to M82, whereas for total carotenoids only R176, R178 and B27 exhibited lower values compared with M82. As for β-carotene, only IL12-4 and B27 showed a lower value respect to the cultivated genotype.
28 Table 2.2- Fruit quality traits of the sub-lines and their parental genotypes at Acerra in the year 2016.
The significance of differences of each genotype vs M82 was evaluated by the t-Student’s test (*: P<0.05; ** :P<0.01; ***:P<0.001).
M82
3.87±0.25
6.48±0.15
1.22±0.09
41.99±1.54
IL12-4
4.78±0.03*
6.88±0.11
1.11±0.02
42.16±3.07
IL7-3
5.77±0.55*
6.42±0.66
1.12±0.09
37.10±3.42
B27
4.53±0.06
6.53±0.33
1.15±0.02
41.92±0.15
R176
4.37±0.45
6.31±0.13
1.04±0.04
42.69±0.54
R178
5.40±0.72*
5.31±0.35*
1.09±0.09
37.65±1.12*
R179
4.73±0.42 *
4.81±0.22***
1.18±0.05
41.04±3.29
R181
4.97±1.07
5.48±0.21*
1.23±0.03
43.50±0.90
R182
4.97±0.31**
8.39±0.62*
1.29±0.08
40.87±0.95
R201
5.30±0.26*
6,04±0.68
1.22±0.12
37.75±2.50
R202
5.47±0.84*
5.77±0.14*
1.20±0.11
37.91±0.37**
Genotype
Brix
(°)
Firmness
Color
a/b
Color
Chroma
29 Table 2.3- Metabolic analysis of the sub-lines and their parental genotypes at Acerra in the year 2016 (all data are reported as
mg/100 g FW).
Data related to parameters linked to the metabolic analyses on fruits, such as Lycopene, β-carotene, total carotenoids and AsA content in the mature green (MG), breaker (BR) and mature red (MR) ripe stages. The significance of differences of each genotype vs M82 was evaluated by the t-Student’s test (*: P<0.05; **:P<0.01).
M82 6.76±0.93 2.38±0.79 10.30±0.92 11.00±2.28 36.46±5.87 31.13±1.56 IL12-4 3.36±0.25* 0.89±0.15** 10.54±2.09 10.61±2.79 36.24±6.99 31.35±3.51 IL7-3 6.31±1.04 2.82±0.27 6.10±0.40* 14.90±3.00 43.07±3.87 39.88±1.82* B27 3.48±0.24* 0.78±0.05** 5.08±1.14* 9.21±2.49 33.90±4.16 35.35±0.17* R176 3.10±0.15* 1.33±0.02 5.75±0.24* 13.30±5.81 39.63±4.08 33.83±0.44 R178 3.50±0.30* 1.60±0.14 6.36±0.28* 13.40±2.09 33.65±3.96 38.54±7.19 R179 4.43±1.13 1.60±0.29 7.66±1.74 13.45±6.72 37.65±7.12 25.96±2.66* R181 4.06±0.97 1.68±0.26 6.98±1.41 14.31±1.67 34.83±7.13 32.44±4.39 R182 5.85±.13 2.14±0.53 9.22±1.13 18.45±3.08* 38.61±11.70 44.81±2.31** R201 5.17±1.04 2.18±0.26 8.79±2.07 14.37±2.75 43.37±7.96 37.55±6.33 R202 4.15±0.99 1.91±0.12 7.19±2.08 14.66±3.42 41.25±10.37 40.79±3.73*
β-carotene Total carotenoids AsA MG AsA BR AsA MR Lycopene
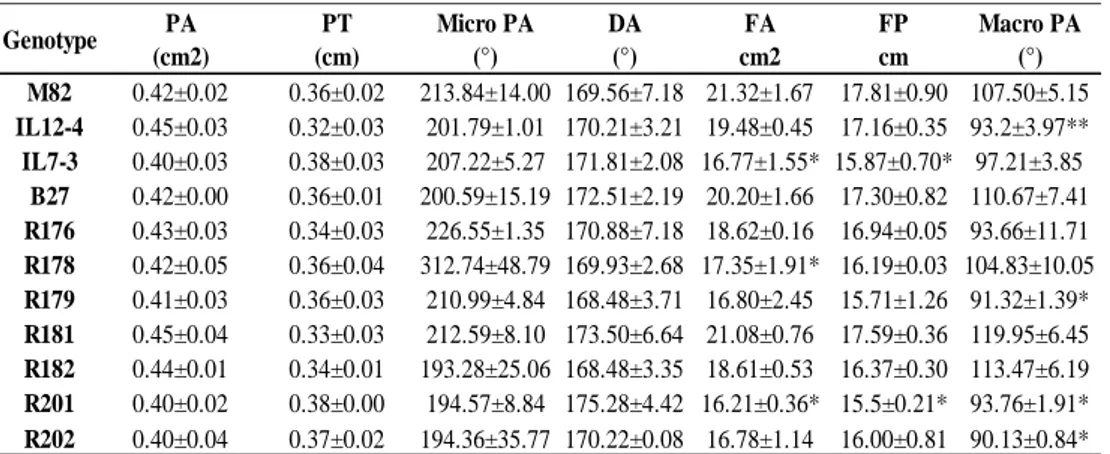
30 Finally, the morphological analysis of fruit evidenced no significant differences for pericarp area (PA) and thickness (PT) (Table 2.4, Figure 2.1), micro (Micro PA) proximal angles and for the distal angle (DA), whereas fruit area (FA) is significantly reduced in R176 (17.35 cm2) and R201 (16.21 cm2) compared with M82 (21.32 cm2),
and for fruit perimeter (FP) only R201 is significantly lower compared to M82 (15.5 cm vs 17.81 cm). Also, the macro (Macro PA) proximal angles showed significantly lower values from M82 in some sub-lines, particularly R179, R201 and R202, with values of 91.32°, 93.76° and 90.13°, respectively. Only the sub-lines B27, R181 and R182 showed morphological parameters similar to those exhibited by the control genotype M82.
Table 2.4- Morphological analysis of fruit of the sub-lines and their parental genotypes in the year 2016.
Data related to parameters linked to morphological analysis: pericarp area (PA), pericarp thickness (PT), fruit area (FA), fruit perimeter (FP), micro proximal angles (Micro PA) and macro proximal angles (Macro PA). The significance of differences of each genotype vs M82 was evaluated by the t-Student’s test (*: P<0.05; **:P<0.01). M82 0.42±0.02 0.36±0.02 213.84±14.00 169.56±7.18 21.32±1.67 17.81±0.90 107.50±5.15 IL12-4 0.45±0.03 0.32±0.03 201.79±1.01 170.21±3.21 19.48±0.45 17.16±0.35 93.2±3.97** IL7-3 0.40±0.03 0.38±0.03 207.22±5.27 171.81±2.08 16.77±1.55* 15.87±0.70* 97.21±3.85 B27 0.42±0.00 0.36±0.01 200.59±15.19 172.51±2.19 20.20±1.66 17.30±0.82 110.67±7.41 R176 0.43±0.03 0.34±0.03 226.55±1.35 170.88±7.18 18.62±0.16 16.94±0.05 93.66±11.71 R178 0.42±0.05 0.36±0.04 312.74±48.79 169.93±2.68 17.35±1.91* 16.19±0.03 104.83±10.05 R179 0.41±0.03 0.36±0.03 210.99±4.84 168.48±3.71 16.80±2.45 15.71±1.26 91.32±1.39* R181 0.45±0.04 0.33±0.03 212.59±8.10 173.50±6.64 21.08±0.76 17.59±0.36 119.95±6.45 R182 0.44±0.01 0.34±0.01 193.28±25.06 168.48±3.35 18.61±0.53 16.37±0.30 113.47±6.19 R201 0.40±0.02 0.38±0.00 194.57±8.84 175.28±4.42 16.21±0.36* 15.5±0.21* 93.76±1.91* R202 0.40±0.04 0.37±0.02 194.36±35.77 170.22±0.08 16.78±1.14 16.00±0.81 90.13±0.84* Macro PA (°) DA (°) PA (cm2) PT (cm) Genotype FP cm FA cm2 Micro PA (°)
31 Figure 2.1- Morphological analysis of fruit of the IL7-3 sub-lines and their parental genotypes in the year 2016.
Analyses were carried out using the software Tomato Analyzer. Pictures were obtained by longitudinal cutting of the fruit; the yellow line shows the fruit perimeter and area. Measures of fruit area (cm2) and perimeter (cm) are reported in the graph for parental genotypes and
32
2.2.2 Phenotypic characterization during the year 2017
In the summer 2017 analyses were restricted to the most relevant parameters among those measured in the 2016, with the aim of confirming the data of B27 and the selection of the best IL7-3 sub-lines in three different environments of South Italy (Table 2.5). As for parameters strictly concerning the productivity (FW, NFR and YP), the parental line IL7-3 showed significant lower values than M82 for all traits in all experimental fields, thus confirming the lower productivity exhibited in the previous year. Comparing data of 2017 in the three different environments, no GxE interaction at the two-way ANOVA test was observed for FW (p=0.446), as well as for NFR (p=0.289) and YP (p=0.315). Comparing the FW of the sub-lines with M82, significant differences were mainly observed in the Acerra field, where R178, R179, and R202 showed a significant reduction compared to M82, confirming data obtained in the year 2016. In Giugliano, only R182 exhibited a significantly higher value compared with M82 (50.29 g vs 42.39 g) and in Battipaglia R202 and IL12-4 showed a significant lower value respect to M82. Among the sub-lines, R176 and B27 showed a significant reduction of NFR in Giugliano and only R179 in Battipaglia field, whereas R182 and the other sub-lines exhibited values comparable to M82 in the three environmental conditions tested, except R178 that in Acerra showed a significant higher value. Finally, as for yield, the sub-lines R176, R178, R181 and R182 confirmed no differences compared to M82 in all the three fields whereas R179, R201 and R202 showed significantly lower value in Battipaglia.
33 Table 2.5- Productivity of the sub-lines and their parental genotypes in three different enviroments in the year 2017.
The Two-way ANOVA test results are reported for each trait as F value, to estimate the environment, the genotype and their interaction effect, considering as level of significance a<0.05. The percentage of total sum of squares (TSS%) for E, G and GxE is calculated dividing the TSS of each variable by the grand total TSS. The significance of differences of each genotype vs M82 was evaluated by the t-Student’s test (*:P<0.05; **:P<0.01; ***:P<0.001).
Acerra Giugliano Battipaglia Acerra Giugliano Battipaglia Acerra Giugliano Battipaglia
M82 51.22±2.41 42.39±2.49 60.14±4.30 33.19±2.69 60.76±8.59 104.48±19.45 1.68±0.14 2.60±0.73 3.36±0.30 IL12-4 55.11±5.00 42.07±4.13 47.01±5.56* 31.96±2.51 56.56±10.69 110.10±59.54 1.75±0.28 2.38±1.49 3.16±0.37 IL7-3 44.89±2.52* 36.78±2.25*** 34.33±1.70* 17.89±2.48* 24.00±1.65* 48.58±11.00* 1.10±0.05* 1.30±0.27* 1.17±0.55** B27 55.22±8.49 48.93±5.14 58.69±0.27 33.40±4.72 38.65±1.55* 123.89±30.49 1.71±0.18 2.15±0.20 3.73±1.56 R176 47.56±3.90 49.02±7.37 51.58±18.63 34.24±3.72 38.67±5.83* 117.0±57.07 1.61±0.17 2.65±0.93 3.15±1.12 R178 40.33±5.67* 36.82±6.32 42.71±12.15 42.56±3.75* 58.42±7.70 102.63±53.18 1.69±0.20 2.63±0.32 2.87±0.97 R179 43.33±2.67** 39.34±5.56 53.95±20.07 23.74±4.99 38.86±7.28 42.13±28.49* 1.01±0.22 2.03±0.33 1.12±0.39* R181 56.44±6.30 45.57±9.63 59.74±5.72 32.14±1.03 42.93±15.83 106.51±41.69 1.79±0.20 2.33±0.61 3.82±1.60 R182 51.56±5.35 50.29±2.25* 58.03±9.43 36.55±12.55 54.29±10.94 114.30±38.37 1.84±0.63 2.70±1.23 3.51±0.47 R201 39.44±4.60 36.58±2.89 44.67±12.68 39.05±6.93 50.31±18.56 84.09±25.86 1.55±0.41 2.51±1.01 1.99±0.45** R202 40.26±1.06** 37.29±5.21 46.07±4.93* 32.63±3.23 41.58±14.00* 81.23±12.31 1.31±0.23 2.11±0.74 2.06±0.53*
F Sign TSS% F Sign TSS% F Sign TSS%
ENVIRONMENT 11.6 0 0.7 66.23 0 15.21 22.22 0 4.1
GENOTYPE 5.82 0 1.77 2.67 0.009 3.07 4.65 0 4.29
GxE 1.03 0.446 0.62 1.19 0.289 2.74 1.16 0.315 2.14
Yield/plant g
Genotype Fruit weight g
Fruits/plant No.
34 Qualitative analyses carried out in 2017 were restricted to °Brix, firmness and ascorbic acid content in the ripe fruit, since these traits were the only showing relevant differences during the year 2016 (Table 2.6). As for °Brix, data collected in the year 2017 confirmed those of the year 2016, indeed significant differences were observed for most sub-lines and IL7-3 respect to M82 in Acerra field, as well as in Giugliano. Particularly, R182 exhibited a significantly high value in Acerra during both the years 2016 and 2017. In Acerra field, also R178, R181 and R202 showed a significantly higher value than M82, though only R178 and R202 confirmed the value exhibited in the year 2016. However, no differences were observed in Battipaglia whereas in Giugliano IL12-4, B27 and R201 were significantly different. Indeed, this trait evidenced a high GxE interaction (p=0.003). As for firmness, the two parental genotypes and most sub-lines showed very similar values in all the fields, with a not significant GxE interaction (p=0.114). The only relevant result was the significantly higher firmness observed in R182 in all cases (values always higher than 8 kg/cm2).
A significant higher value of AsA compared with M82 was evidenced in IL7-3, IL12-4 and B27, whereas most sub-lines showed a high variability, evidencing the presence of GxE interaction (p=0.006). The sub-line R182 was the only showing a higher level of AsA respect to M82 in all the three experimental fields confirming the data of Acerra 2016. Furthermore, in the year 2017 the AsA content was also evaluated in leaves in Acerra and Giugliano (Table 2.7) to understand if R182 showed a high value of this metabolite also in leaves. The AsA level in the leaves was not significantly different between the parental lines M82 IL12-4 and IL7-3. Comparing the AsA content of all sub-lines with M82, in Acerra only B27 and R182 showed a significant increase of AsA in the leaves (19.24 mg/100 g FW and 19.42 mg/100 g FW, respectively, vs 13.40 mg/100 g FW), indeed the other sub-lines exhibited values from 11 mg/100 g FW to 16 mg/100 g FW. Also in Giugliano, B27 and R182 showed a significantly higher value respect to M82 (12.01 mg/100 g FW and 14.90 mg/100 g FW, respectively, vs 9.93 mg/100 g FW) whereas R176, R179 and R202 exhibited a significant reduction of AsA respect to M82 with values of 7.04 mg/100 g FW, 6.01 mg/100 g FW and 6.32 mg/100 g FW, respectively. Finally, a not significant GxE interaction (p=0.10) was observed for AsA in the leaves.
35 Table 2.6- Fruit quality of the sub-lines and their parental genotypes in three different enviroments in the year 2017.
The Two-way ANOVA test results are reported for each trait as F value, to estimate the environment, the genotype and their interaction effect, considering a level of significance a<0.05. The percentage of total sum of squares (TSS%) for E, G and GxE is calculated dividing the TSS of each variable by the grand total TSS. The significance of differences of each genotype vs M82 was evaluated by the t-Student’s test (*: P<0.05; ** :P<0.01).
Acerra Giugliano Battipaglia Acerra Giugliano Battipaglia Acerra Giugliano Battipaglia M82 4.60±0.20 4.07±0.57 4.97±0.47 7.07±0.52 6.49±0.15 7.34±0.39 44.35±6.55 27.38±2.04 26.10±3.24
IL12-4 4.90±0.62 5.37±0.32* 4.87±0.67 missingvalue missingvalue missingvalue 56.46±1.02* 37.24±2.05** 41.97±1.13**
IL7-3 6.47±0.32** 6.00±0.26** 5.30±0.36 6.52±0.88 6.42±0.66 6.38±0.82 64.21±5.87* 38.17±3.08** 40.87±3.70**
B27 4.47±0.51 5.53±0.64* 4.43±0.50 missingvalue missingvalue missingvalue 55.31±1.39* 43.66±2.52** 38.95±1.36*
R176 4.90±0.26 4.40±0.46 4.57±0.15 7.73±0.90 6.27±0.15 6.95±0.75 39.90±6.53 16.51±5.36* 22.26±2.80 R178 5.93±0.47* 5.40±0.72 4.73±0.35 5.98±0.75 5.47±0.57* 6.64±1.02 51.75±9.90 24.63±0.40 26.96±4.98 R179 5.13±0.85 4.73±0.42 5.30±0.53 6.70±1.43 4.81±0.33** 7.38±0.39 43.91±8.97 31.13±9.67 15.10±5.88* R181 5.10±0.17* 4.97±1.07 4.87±0.51 8.46±0.81 7.16±1.50 6.46±0.85 49.67±2.96 35.81±8.45 30.34±3.97 R182 5.93±0.55* 4.96±0.31 3.93±0.38 8.32±0.57* 8.29±0.54** 8.77±0.53* 57.86±3.77* 34.82±2.21* 34.34±1.24* R201 4.97±0.15 5.30±0.26* 5.40±0.87 6.53±0.39 6.12±0.56 5.94±0.82* 46.87±3.17 35.93±3.31* 25.56±4.32 R202 5.63±0.38* 5.47±0.84 4.70±0.35 5.86±0.53* 6.06±0.21* 6.98±0.76 55.26±6.47 33.08±4.40 25.53±1.18
F Sign TSS% F Sign TSS% F Sign TSS%
ENVIRONMENT 6.386 0.003 0.132 4.943 0 0.154 190.9906137 0 5.595 GENOTYPE 4.806 0 0.499 8.5 0.011 1.058 18.7580631 0 2.748 GxE 2.528 0.003 0.525 1.555 0.114 0.387 2.329985841 0.006 0.682 Genotype Brix (°) Firmness AsA mg/100 g FW
36 Table 2.7- AsA content in leaves of the sub-lines and their parental genotypes in
Acerra and Giugliano in the year 2017.
The Two-way ANOVA test results are reported for each trait as F value, to estimate the environment, the genotype and their interaction effect, considering a level of significance a<0.05. The percentage of total sum of squares (TSS%) for E, G and GxE is calculated dividing the TSS of the each variable by the grand total TSS. The significance of differences of each genotype vs M82 was evaluated by the t-Student’s test (*: P<0.05; ** :P<0.01).
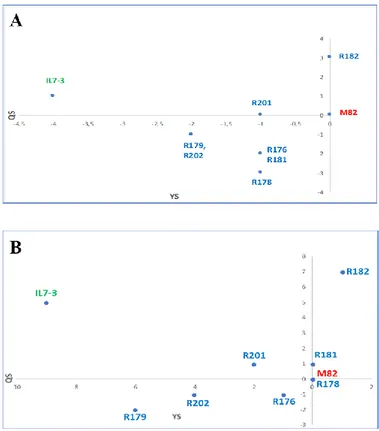
For a general selection of the IL7-3 sub-lines based on all evaluated traits during the year 2016, an Evaluation Index (EI) was assayed, which takes into consideration the scores obtained by each line compared to the control genotype M82. The EI estimated for productivity and fruit quality traits evidenced that the best sub-line in terms of quality (QS) and yield (YS) score was R182, which exceeded the control genotype M82 for QS and had the same value for QY, as shown in the scatter diagram of Figure 2.2 A. All the other sub-lines exhibited values of QS and YS worse than M82, and intermediate values between the two parental genotypes M82 and IL7-3. The EI was also estimated on data collected in the year 2017 for the three productive (FW, NFR, YP) and the three fruit quality traits (°Brix, FI, AsA) evaluated in three different environmental conditions. Genotype Acerra Giugliano M82 13.40±0.85 9.93±0.23 IL12-4 16.45±2.12 10.35±0.14 IL7-3 9.18±1.28 9.48±2.17 B27 19.24±1.91** 12.01±0.52* R176 13.31±1.87 7.04±0.55* R178 11.95±0.72 6.99±1.17 R179 11.71±1.34 6.01±0.19* R181 16.91±0.95 11.64±1.04 R182 19.42±1.75** 14.90±0.81* R201 14.12±1.20 8.89±0.67 R202 13.40±0.85 6.32±0.12** F Sign TSS% ENVIRONMENT 128.21 0 4.02 GENOTYPE 14.62 0 4.58 GxE 2.02 0.06 0.63 AsA leaves mg/100g FW
37 The scatter diagram (Figure 2.2 B) evidences that the sub-line R182 exhibited the highest QS and YS, and that sub-lines R178 and R181 were comparable to M82. Therefore, following the second year of phenotypic analyses carried out in three different environmental conditions, the sub-line R182 was confirmed as the elite one.
Figure 2.2-Scatter diagram of the Evaluation Indexes (EIs) measured for the sub-lines and IL7-3 in term of quality (QS) and yield (YS), in comparison to the control genotype M82, whose EI was fixed to zero.
A) Scatter plot of EIs measured in the year 2016; B) Scatter plot of EIs measured in the year 2017.
38
Chapter 3. Identification of candidate genes controlling high
AsA content in the selected sub-lines
3.1 Materials and methods
3.1.1 Raw data materials
DNA-seq materials used for the assembly of the M82 S. lycopersicum genome (Table 3.1) were retrieved from publicly available M82 raw data (Bolger et al., 2014). RNA-seq and RAD-RNA-seq materials used for the assembly of IL12-4 and IL7-3 genomes were publicly available raw data (Chitwood et al., 2013).
Table 3.1- RNA-seq, DNA-seq and RAD-seq material used for the assembly.
Information related the BioProject number, the name of the center where analyses were carried out, the platform used to prepare the RNA and DNA libraries and the Sequence Read Archive (SRA) study of RNA-seq and RAD-seq experiments are reported.
3.1.2 S. lycopersicum cv M82 genome assembly
The SRA files were converted to FASTQ file using fastq-dump of SRA Toolkit (http://www.ncbi.nlm.nih.gov/Traces/sra/sra.cgi?view=toolkit_doc&f=fastq-dump). FASTQ files were checked for quality using FASTQC [Andrews S. (2015
http://www.bioinformatics.babraham.ac.uk/projects/fastqc/]. The adapter
BioProject Center name Platform SRA Study
M82 PRJEB6302 RWTH AACHEN ILLUMINA ERP005818
ILs PRJNA222538 DEP. OF PLANT BIOLOGY, UNIVERSITY OF
CALIFORNIA, DAVIS ILLUMINA SRP031491
ILs PRJNA222545 DEP. OF PLANT BIOLOGY, UNIVERSITY OF
CALIFORNIA, DAVIS ILLUMINA SRP031490
DNA-seq
RNA-seq
39 sequences, poly-N stretches and low-quality reads (Phred score <20) were removed using the BBDuck module of the BBMap software package (version 34_90,
http://sourceforge.net/projects/bbmap).
The reconstruction analysis has been performed using Heinz SL3.0 (ftp://ftp.solgenomics.net/genomes/Solanum_lycopersicum/assembly/build_3.00/S_l ycopersicum_chromosomes.3.00.fa) as reference genome. The genome reconstruction analysis was carried out using the Reconstruction tool (v.1.0). The reconstruction pipeline is based on an iterative read mapping and a de-novo assembly (Scala, Grottoli et al., 2017).
3.1.3 S. lycopersicum cv M82 annotation
The S. lycopersicum cv M82 annotation has been performed using Heinz ITAG 3.2 (ftp://ftp.solgenomics.net/genomes/Solanum_lycopersicum/annotation/ITAG3.2_rel ease/ITAG3.2_cDNA.fasta) and NCBI annotated genomes release 102 (ftp://ftp.ncbi.nlm.nih.gov/genomes/Solanum_lycopersicum/RNA) as reference annotations. The genome annotation was carried out effecting two liftover using Maker programs (http://www.yandell-lab.org/software/maker.html). The quantitative measures for the assessment of the assembled genome and transcriptome completeness were carried out using BUSCO v3 program (https://busco.ezlab.org/).
3.1.4 IL12-4 and IL7-3 assembly
The IL7-3 and IL12-4 break points and introgression size were defined using an IL check pipeline (Figure 3.1) kindly provided by Dr. Valentino Ruggieri (CRAG Centre for Research in Agricultural Genomics Campus UAB - Edifici CRAG | 08193 Cerdanyola | BARCELONA). The SRA files (RNA-seq and RAD-seq) were converted to FASTQ files using FASTQ-DUMP. FASTQ files were checked for quality using FASTQC. Trimming and merging were done using the Trimmomatic software. Then, RNA-seq data were aligned against the S. lycopersicum reference genome sequence (SL3.2 release) and S. pennellii genome
40 (annotation release ID:100) using STAR aligner (version 2.4.2a), and the variant calling of RNA-seq and RAD-seq data were performed using the SUPER W pipeline (Sanseverino et al., 2015). Then, variants were filtered and the ILs definition and assembly were carried out.
3.1.5 Molecular marker analysis
SCAR and CAPS markers were defined in order to estimate the size of the wild region present in one IL sub-line (R182). Genomic DNA was extracted from young leaves using the PureLinkTM Genomic DNAKit. Primers for the PCR amplification were designed based on polymorphisms detected in the IL7-3 introgression region between the S. lycopersicum (SL3.0 assembly and iTAG3.2 annotation) and the S. pennellii (v2 Assembly) genomes, by investigating the Genome Browser available in the Sol Genomics Network database (http://www.tomatogenome.net/VariantBrowser). PCR amplification was carried out in 50 µl reaction volume containing 50 ng DNA, 1X reaction buffer, 0.2mM each dNTP, 1.0 mM primer and 1.25 U GoTaq polymerase (Promega). For designing CAPS markers, restriction enzymes suitable to detect polymorphic SNPs between the amplified fragments of the two species were found using the tool CAPS Designer available at the Sol Genomics Network (https://solgenomics.net/). Amplified and restricted fragments were visualized on agarose gel at different concentrations depending on their expected size.
3.1.6 RNA-seq analysis
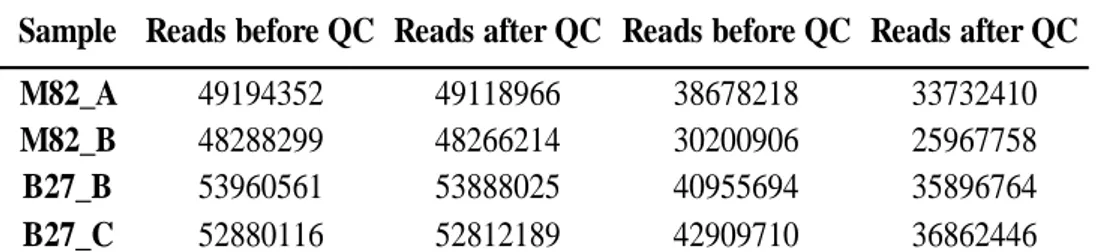
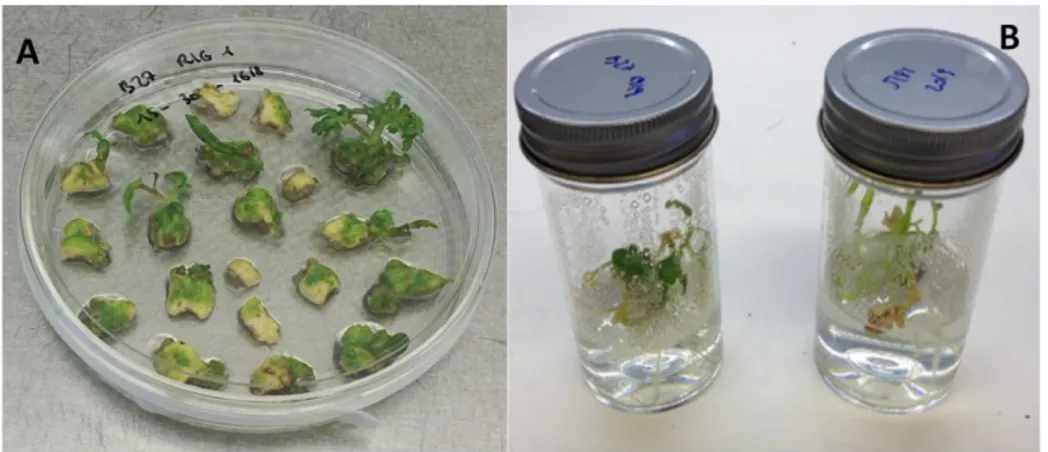
RNA extraction was performed on B27, M82 and R182 mature red fruits and M82 and R182 breaker fruits cultivated in Acerra field using the Trizol reagent (Thermo Fischer Scientific) and following the manufacturer's guidelines. RNA sequencing experiment was performed using the "TrueSeq mRNA" protocol for preparing libraries and a pair-end strategy was chosen for sequencing. The RNA-seq analysis was carried out using the new Sequentia Biotech data analysis software “AIR” (https://transcriptomics.sequentiabiotech.com/) and the S. lycopersicum reference genome sequence (SL3.20 release). The differential expression analysis was performed using edgeR.
41 Figure 3.1-IL check pipeline kindly provided by Dr. Valentino Ruggieri, showing all the steps related to pre-processing data, variant calling and introgression definition.
42
3.2 Results
3.2.1 S. lycopersicum cv M82 genome reconstruction
The S. lycopersicum M82 genome assembly was obtained using a Reconstruction pipeline (Figure 3.2). As for the first step (Table 3.2), six iteractions were performed. For each iteraction all the variants were filtered and added to the reference genome to get an intermediate genome. In the Iteration 1, 1,188,034 variants were found with deletion (del) and insertion (ins) size of 96,403 bp and 111,813 bp respectively, a mean coverage of 39.58 and a genome size of 828.092 Mb and a genome size variation respect to Heinz of 0.002%. As for the Iteration 2, 65,929 variants were detected with a M82 intermediate genome size of 828.091 Mb and a size variation between M82 and Heinz of -0.0001%, whereas the Iteration 3 showed 12,405 variants with a genome size of 828.090 Mb and a genome size variation of M82 respect Heinz of 0.0017%. As for Iteration 4, 4,385 variations were found and a genome size variation between M82 and Heinz of -0.000018%, whereas the Iterations 5 and 6 exhibited only 1,943 and 643 variations respectively and a genome size variation of -0.20% for the interaction 6. As for the Step 1, 1,273,341 variants were identified with a del and ins size of 1,799,145 bp and 185,818 bp, respectively, and a total genome size variation of -0.20% among M82 and Heinz (826.444 Mb M82 vs 828.077 Mb Heinz). However, most of the variations were in the intergenic regions and only 10% of these were identified in coding regions. As for the Step 2, no mapped reads were assembled in contigs in order to add them to the new genome, indeed the Reconstruction pipeline kept 212 contigs with minimum length of 400 bp, thought only 1 contig with length of 450 bp was added to chromosome 10 of M82 genome in the Step 3. As for the Step 4 the new M82 genome with a size of 826,444 Mb was assembled.
43 Figure 3.2- Flow chart of the Reconstruction pipeline kindly provided by Dr. Walter Sanseverino. Step 1) calling variant in the common regions between reference and resequencing experiment; Step 2) de novo assembly of private regions of resequencing experiment; Step 3) merging data of common and private regions; Step 4) new genome annotation.
44 Table 3.2- Step 1 of the Reconstructor pipeline.
For each iteration the variants were added to the reference genome to get an intermediate genome. The variation percentage represents the variation of the genome size for each iteration.
45 The M82 genome annotation was carried out using the tomato annotations SGN SL 3.1 and NCBI v.102. As for the Tomato Annotation SGN SL 3.1, 37,768 transcripts were considered, whereas for the Tomato Annotation NCBI v.102 35,921 transcripts (Table 3.3).
As the first liftover (SGN SL3.1), 35,364 transcripts passed the quality filter and were correctly assigned to each chromosome, whereas only 404 transcripts were excluded as they did not pass the quality filter. As for the second liftover (NCBI v.102), 32,921 transcripts passed the quality filter and were correctly assigned to each chromosome and 3,459 were excluded. As for the transcripts passed for each annotation, almost 99.8% were in common and among these, SGN SL 3.1 transcripts were preferred, whereas only 2,675 NCBI transcripts, not in common between the annotations, were added to the M82 genome annotation for a total of 38,443 transcripts. Furthermore, the quantitative measures for the assessment of the assembled genome and transcriptome completeness using Busco v3 (Figure 3.3) showed 1,323 (91.88%) recovered genes found in single copy and only 29 (2.09%) recovered genes found in more than one copy. As for fragmented and missing genes, only 42 (2.92%) were considered fragmented genes as partially recovered and 46 (3.19%) considered missing genes as not recovered.
Table 3.3- Results of SGN SL3.1 and NCBI v.102 liftovers using the Maker software.
SGN SL3.2 NCBI v.102
Transcripts
35768
35921
Passed
35364
32462
Excluded
404
3459
Used
35364
2675
38443
M82
Ttanscripts
46 Figure 3.3- Quantitative measures for the assessment of the assembled genome and transcriptome completeness using Busco v3.
A) percentage of: complete and single copy genes (S); complete and duplicated copy genes (D); fragmented genes (F) and missing genes (M). B) results of BUSCO v3 analysis considering 37, 010 proteins.
47
3.2.2 IL12-4 assembly
Break points and introgression size of IL12-4 were defined by mapping the reads coming from RNA-Seq data on both the parental genomes (S. pennellii and the reconstructed M82). By doing this, we identified an exhaustive set of markers that allowed precisely defining both the break points on the parent M82 and the extension of the introgression of the donor parent S. pennellii. Finally, the introgression was re-assembled. The line IL12-4 (Figure 3.4) was built by replacing on chr12 of M82 a region of 3.088 Mbp and harbouring 485 genes (447 in Heinz) by a region of 3.398 Mbp derived from chr12 of S. pennellii and harbouring 433 genes. The introgression size was identified looking at the variation pattern of chr12 of IL12-4 respect to chr12 of M82, whereas break points were found considering the variation pattern of chr12 of IL12-4 respect to chr12 of S. pennellii. In Figure 3.5, comparing the variation of chr12 of IL12-4 with the same chromosome of both the parental genotypes, it was possible to identify exactly the introgression fragment. Furthermore, in order to verify the borders reliability of the introgression fragment, the break points were compared with the genetic expression score. The comparison (Figure 3.6) showed that Solyc12g088840 is the upper border of the introgression and Solyc12g100357, which is the last gene of chr12, was the lowest border, whereas the comparison among the S. pennellii material (Supplemental figure S3.1) evidenced that Sopen12g030710 was the first and the Sopen12g035030 the last gene of the introgression fragment.
48 Figure 3.4- IL 12-4 genome assembly.
A) Chromosome 12 of IL12-4 assembly; B) number of M82 genes removed, S. pennellii genes added and the fragments size removed and added.
49 Figure 3.5- Comparison of variants among the chromosome 12 of IL12-4 and of the parental genotypes.
A) and B) Identification of the introgression break points. The introgression fragment showed no variations compared with S. pennellii C) and D) Identification of the introgression size. The introgression fragment exhibited variations compared with S. lycopersicum cv. M82.
50 Figure 3.6- Borders reliability check of the introgression fragment to identify the exact upper introgression border.
The red cycle shows the first gene removed from M82. A) Number of normalized variations for each gene found using the IL check pipeline; B) Expression score of each gene. The value 1 indicates that the genes were expressed whereas the value 0 genes that they were not expressed, considering a threshold expression value of 0.05.