Index I Abstract 1 Chapter 1 1.1 Introduction 2 1.2 Estrogens 3 1.2.1 Estrogen receptor α 4
1.2.2 The G protein-coupled estrogen receptor (GPER) 7
1.3 Breast tumor 10
1.4 Tumor microenviroment 13
1.4.1 Cancer-associated fibroblasts (CAFs) 14
1.5 Insulin and Insulin-like growth factor-I 16 1.5.1 The IR/IGF-IR signaling pathway and its involvement in cancer 17
1.6 Cross-talk between Insulin/IGF system and estrogen signaling in cancer 19 1.7 Aim of the study 22 Chapter 2 Materials and Methods 23 2.1 Reagents 23 2.2 Cell cultures 23 2.3 Isolation and characterization of CAFs 24 2.4 Western blotting 25 2.5 Transient transfection 25 2.5.1 Plasmids 26 2.5.2 Luciferase assays 26
2.6 RT-PCR 27 2.7 Chromatin immunoprecipitation (ChIP) 28
Index
II
2.9 Proliferation assays 28
2.10 Immunostaining assay 29
2.11 Glucose uptake assay 29
2.12 Cell Cycle Analysis 29
2.13 Statistical analysis 30 Chapter 3 Results 31 3.1 IGF-I induces GPER expression 31 3.2 GPER is involved in the migration and proliferation promoted by IGF-I 34
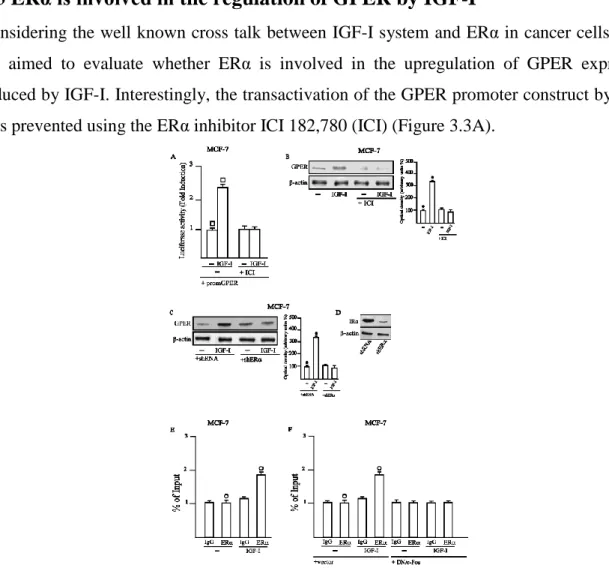
3.3 ERα is involved in the regulation of GPER by IGF-I 37
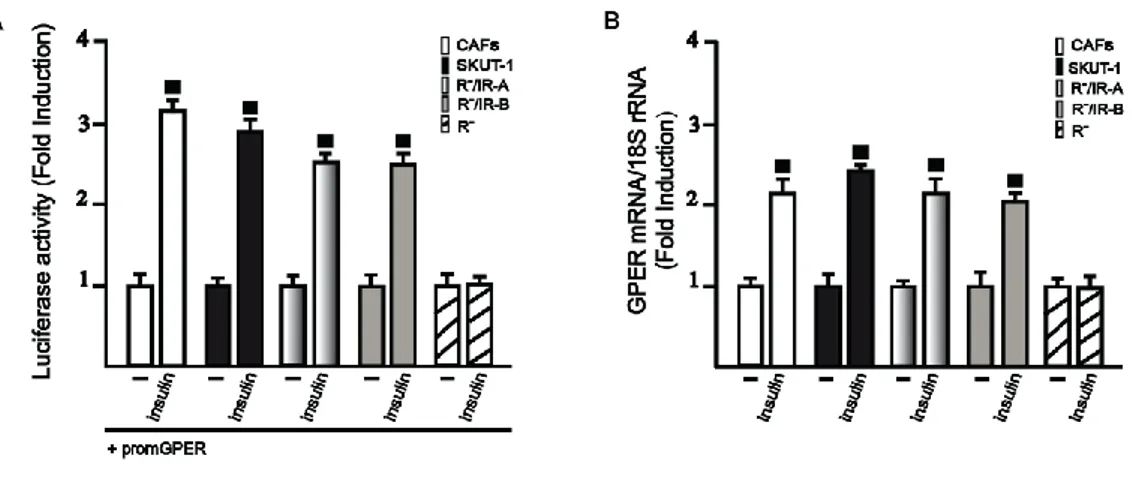
3.4 Insulin induces GPER expression 38
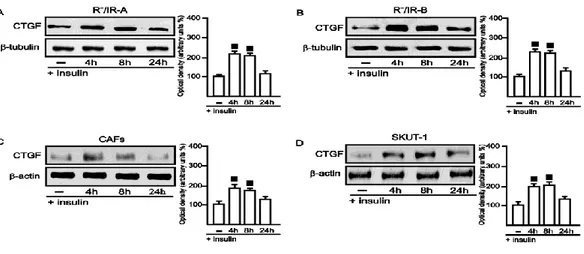
3.5 GPER mediates CTGF expression and cell migration induced by insulin 43
3.6 GPER is involved in the glucose uptake and cell-cycle progression 44 stimulated by insulin
Chapter 4
Discussion 47
References 50
1 α
2
1.1
Introduction
Breast cancer is the most frequent malignancy and the leading cause of cancer death among females (1). The elevated incidence of breast cancer in women has been associated with prolonged exposure to high levels of estrogens (2) and environmental contaminants (3). Estrogens act mainly through the classical estrogen receptor (ER)α and ERβ (4), however, the identification of GPER as a novel estrogen receptor, has suggested new possibilities by which estrogenic compounds might cause biological effects in different cell types (5) and cancer-associated fibroblasts (CAFs) which are main players of the tumor microenvironment (6). Moreover, a characteristic signature elicited by estrogenic GPER signaling was reported in SKBR3 breast cancer cells together with the identification of a network of transcription factors like c-fos, the early growth response protein 1 (EGR1) and the connective tissue growth factor (CTGF) that are involved in important biological responses (7). There is increasing alertness that estrogens may regulate certain cell functions through the integration with a network of signaling pathways. For instance, the relationship of estrogens with the IGFs system has been well established (8, 9). Many tumors are characterized not only by profound dysregulation of the IGF axis (10), but also by deregulated expression and trafficking of the classical and non-classical estrogen receptors (3). Moreover, aside from its important contribution to maintain the metabolic activity and glucose homeostasis, insulin shows mitogenic potential which can lead to an increased risk of numerous types of cancer. Accordingly, it has suggested that a direct insulin receptor (IR) stimulation activates diverse transduction mechanisms involved in tumor development (3). Moreover, in cancer patients affected by insulin resistance, increased insulin levels combine with frequent IR overexpression in tumor cells, leading to abnormal stimulation of non-metabolic effects such as cell survival, proliferation, and migration (3). In particular, high insulin levels have been associated with an augmented risk of breast cancer and breast cancer relapse in diabetic and non-diabetic women (11,12,13).
3
1.2
Estrogens
Estrogens are sex steroid hormones which exhibit a broad spectrum of physiological functions ranging from regulation of the menstrual cycle and reproduction to modulation of bone density, brain function, and cholesterol mobilization (14). Despite the normal and beneficial physiological actions of endogenous estrogen in women, abnormally high estrogen levels are associated with the increased incidence of certain types of cancer, especially those of the breast and endometrium. The predominant intracellular estrogen is 17β-estradiol (E2). Other types of estrogen include estrone (E1) and estriol (E3) (Figure 1.1). In premenopausal women, E1 and E2 are secreted primarily by the ovaries during the menstrual cycle, with minor levels derived from adipose tissue and the adrenal glands. The placenta also produces E3 during pregnancy (16).
Fig.1.1. Chemical structures of estrogens
In the ovaries, granulosa cells synthesize estrogen from androgen (17). Ovarian production of estrogen is regulated by the hypothalamic-pituitary-ovarian (HPO) axis and begins by anterior pituitary release of luteinizing hormone (LH) and follicle-stimulating hormone (FSH) in response to the hypothalamic peptide gonadotropin-releasing hormone (GnRH). Acting in concert, LH stimulates androgen production, whereas FSH up-regulates aromatase, which catalyzes the rate-limiting and final step of estrogen biosynthesis: the aromatization of androgen to estrogen (Figure 1.2). During ovulation, E2 production rises dramatically by eight- to ten-fold. High levels of estrogen in turn act via negative feedback to dampen estrogen production to inhibit the release of GnRH, LH, and FSH (18). The primary mediator of estrogen biosynthesis in postmenopausal women is aromatase, which is found in adipose tissue as well as in the ovaries, placenta, bone, skin, and brain (19). After menopause, ovarian estrogen biosynthesis is minimal, and circulating estrogen is derived principally from peripheral aromatization of adrenal androgen. As such, for obese postmenopausal women, adipose tissue becomes the main source of estrogen biosynthesis; this biosynthetic route is far less significant for non-obese postmenopausal women (20).
4
Fig.1.2. Ovarian production of estrogens.
Numerous studies have demonstrated the association of estrogen with the development and/or progression of various types of cancer, including cancers of the breast, endometrium, ovary, prostate, lung, and colon (15,21).
1.2.1 Estrogen receptors (ER)α
Estrogen mediates its biological effects in target tissues primarily by binding to specific intracellular receptors named ERα and ERβ (Fig.1.3). These receptors are encoded respectively by ESR1 and ESR2 wich are located on different chromosomes (22). Like all other members of the nuclear receptors super-family, human ERα and ERβ, are ligand-activated receptors with high degree of sequence homology and similar three-dimensional structure. The ERs are modular proteins composed of four functional domains (Fig.1.3):
the N-terminal transactivation domain which is involved in protein protein interactions and in transcriptional activation of target-gene expression (23).
Fig.1.3. Schematic diagram showing the domain organization of human ERα and ERβ.
the DNA binding domain (DBD) (Fig.1.4) which plays the most important role in receptor dimerization and in the binding of specific DNA sequences (i.e.EREs) (23).
5
Fig.1.4. Schematic representation of DBD. Amino acid residues forming the P and D box are shown in red and blue,
respectively. Lower: DBD forms ‘head to head’ dimer and complexed with DNA.
The hinge region which is the most variable region within ERs.
the C-terminal E/F region encompassing the LBD, the AF-2 domain, the homo- and/or hetero-dimerization domain, and part of the nuclear localization region.
It has been demonstrated that ERα acts by multiple mechanisms. In classical genomic mechanism, ligand-activated ERs dimerize and translocate in the nucleus where they recognize specific estrogen response elements (ERE) located in the promoter region of DNA of the target genes (24) (Figure 1.5).
Fig.1.5.Illustration of the classic genomic mechanism by which estrogens activate gene transcription
Besides, E2 can also modulate gene expression by a second indirect mechanism involving the interaction of ER with other transcription factors such as the activator protein (AP)-1, nuclear factor-kB (NF-kB), stimulating protein-1 (Sp-1) which, in turn, binds their specific DNA elements (25,26) (Figure 1.6 ).
6
Fig.1.6.Model representing the various modes through which estrogen receptors (ERs) can modulate
transcription of genes. ERs-DNA indirect association occurs through protein–protein interactions with the Sp1 (A), AP-1 (B), and NFκB (C) proteins.
In addition to the classical mechanism of estrogen signal transduction, which implies the binding of the receptor to DNA, there are a number of non-genomic signaling through which estrogen may exert their biological effects (Figure 1.7). Indeed, it is now well accepted that ER function can be modulated by extra-cellular signals even in the absence of E2. These findings focus primarily on the ability of polypeptide growth factors such as epidermal growth factors (EGF) and insulin like growth factor-I/II (IGF-I/II) to activate ER and increase the expression of E2 target genes (4). Moreover, E2 exerts its non-genomic actions, which are too rapid to be accounted for by the activation of RNA and protein synthesis, through the activation of four main signaling cascade: phospholipase C (PLC)/protein kinase C (PKCs), Ras/Raf/MAPK, phosphatidyl inositol 3 kinase (PI3K)/AKT, and cAMP/ protein kinase A (PKA) (22). A rapid activation of the cAMP/PKA pathway has been demonstrated in many different cell types (27). Phospholipase C (PLC) dependent IP3 production, calcium influx, and PKC activation have also been reported in many different cultured cell types. Moreover, E2 rapidly stimulates the activation of MAPK pathways in MCF-7 cell-line, endothelial, bone and HepG2 cells. E2 can also down regulates MAPK phosphatase-1 activity, leading to the up regulation of extracellular regulated kinase (ERK) activity in breast cancer cells (28,29).
7
Fig.1.7.Representation which summarizes the possible mechanisms of estrogen signal transduction.
The E2-induced rapid signals indicate its localization at the plasma membrane. Some authors have suggested that the non genomic actions of estrogen are mediated through a subpopulation of ERα and ERβ located to the plasma membrane (28). However, in the last few years, a member of the 7-transmembrane G protein-coupled receptor family, GPR30/GPER, has been implicated in mediating both rapid and transcriptional events in response to estrogen under certain circumstances (30).
1.2.2 The G protein-coupled estrogen receptor (GPER)
In recent years, the identification of GPER as a novel estrogen receptor has opened a new scenario regarding a further mechanism trough which estrogenic compounds can trigger relevant biological actions in different cell contexts. GPER was first identified as an orphan member of the 7-transmembrane receptor family by multiple groups in the late 1990s (31,32). GPER belongs to the rhodopsin-like receptor superfamily (31) and its gene is mapped to chromosome 7p22.3 (33). Several studies have reported the presence of GPER at the plasma membrane, in the endoplasmic reticulum and in the Golgi apparatus as well as in the nucleus of CAFs extracted from mammary biopsies (34,35,36). As it concerns signaling pathways, it has been demonstrated that GPER ligands may bind to the receptor and activate heterotrimeric G proteins, which then activate Src and adenylyl cyclase (AC) resulting in intracellular cAMP production. Src is involved in matrix metalloproteinases (MMP) activation, which cleave pro-heparan-bound epidermal growth factor (pro-HB-EGF) and release free HB-EGF. The latter activates EGF receptor (EGFR), leading to multiple downstream events; for example,
8
activation of phospholipase C (PLC), PI3K, and MAPK (30). Activated PLC produces inositol triphosphate (IP3), which further binds to IP3 receptor and leads to intracellular calcium mobilization (37). The downstream signal of PI3K is AKT pathway. Main biological consequence of AKT activation is closely related to cancer cell growth; catalogued loosely into three aspects: survival, proliferation and growth (38). The activation of MAPK and PI3K results in activation of numerous cytosolic pathways and nuclear proteins, which further regulate transcription factors such as SRF, CREB, and members of the E26 transformation specific (ETS) family by direct phosphorylation (7,39). This promotes the expression of a second wave of transcription factors such as FOS, JUN, EGR1, ATF3, C/EBPδ, and NR4A2. Cells are then reprogrammed under the effect of this network of transcription factors and a series of GPER target genes, like CTGF, are up-regulated (7) (Figure 1.8).
Fig.1.8. Classical “genomic” and rapid “non-genomic” estrogen-mediated actions.
Superimposed on these responses, there may be a variety of signaling crosstalk pathways and both negative and positive feedback loops. For example, it has been demonstrated that EGF up-regulates GPER expression through the EGFR/MAPK pathway in ER-negative breast cancer cells, most likely by promoting the recruitment of the c-FOS-containing transcription factor AP-1 to the GPER promoter (33). Considering that GPER signaling uses the EGFR/MAPK pathway, a positive feedback loop is conceivable. This mechanism is also operational for EGF and the related growth factor TGFα in ERα-positive breast cancer cells (40). GPER gene expression has been detected in at least four kinds of human tumor specimens or cell lines, including breast cancer (7,41,42,43,44), endometrial cancer (45,46,47,48), ovarian cancer (33,49), thyroid cancer (50), and a rat pheochromocytoma cell
9
line PC-12. (51). In addition, there is a growing body of evidence supporting that GPER is strongly associated with cancer proliferation (33,45,48,50,52,53,54,55), migration (7,56), invasion (45), metastasis (43,44), differentiation (45), and drug resistance (57,58). Indeed, as estrogen stimulates the progression of breast cancer in approximately two-thirds of patients who are ER + (59,60), some selective estrogen receptor modulators (SERMs), such as tamoxifen, have been clinically used to antagonize the binding of estrogen to its classic ERs, which is an effective therapeutic strategy in attenuating the growth of ER+ breast cancers. However, there are around 25% of ER + breast cancer patients who do not respond to anti-estrogen therapy (Early Breast Cancer Trialists Collaborative Group 2005). It implies that blockade of classic ERs alone may not be enough to completely abolish estrogen-induced breast cancer cell growth, since estrogen may promote cell growth through other receptor besides classic ERs. Such hypothesis is further supported by the discovery of GPER as the third specific ER with different structure and function to ERα and ERβ. GPER has a high binding affinity to not only estrogen, but also some SERMs, such as tamoxifen and ICI 182,780. Estrogen and SERMs stimulate GPER action without any antagonist effects (42). These important findings provide a new possible mechanism for the progression of estrogen-related cancers, and raise a new potential target for anti-estrogen therapy. As it concerns clinical findings, GPER overexpression was associated with lower survival rates in endometrial and ovarian cancer patients (47) as well as with a higher risk of developing metastatic disease in breast cancer patients (43). Moreover, in a previous extensive survey, GPER was found to be highly expressed and significantly associated with tumor size (>2 cm), with the presence of distant metastases and increased human EGFR-2 (HER-2)/neu expression (43). Likewise, in a recent study performed in the aggressive inflammatory breast cancer, the majority of tumors were GPER positive (61), suggesting that GPER expression may be considered a predictor of an aggressive disease. In addition to the aforementioned studies on the potential functions of GPER in cancer and possibly other pathological conditions, this receptor was implicated in a broad range of physiological functions regarding the reproduction, the metabolism, the bone, the cardiovascular, the nervous and immune systems (62). Estrogen binds to GPER with a high affinity of a reported Kd 2.7 nM (42) or 6 nM (63), through which alternative estrogen signaling pathways are activated. Moreover, two different synthetic compounds,G-1 (64) and G-15 (65), which were identified using virtual and bio-molecular screening, are respectively a specific agonist and antagonist of GPER. Recently, a novel inhibitors of both GPER and ERα has been identified and named MIBE
10
(66). In addition, different studies show that ICI 182,780 (41, 42), tamoxifen (41), and 4-hydroxytamoxifen (OHT) (7,48,50) are also able to bind GPER and mimic estrogen effects. It has been reported that a variety of xenoestrogens, including bisphenol A, can bind and activate GPER leading to important biological responses (67).
1.3 Breast tumors
Breast cancer is the most common malignancy and the leading cause of cancer-related death in women worldwide. Whereas localized disease is largely curable, metastatic or recurrent disease carries an unfavorable prognosis (1). As a greater percentage of breast cancers are being diagnosed at an earlier stage, the medical community has been challenged to develop diagnostic and treatment modalities that maximize benefit from therapy while reducing the morbidity associated with treatment (68). The management of breast cancer has changed considerably in the last two decades with improvements in systemic therapy and advances in surgical techniques (69). There are two main types of breast cancer:
Ductal carcinoma starts in the ducts that move milk from the breast to the nipple. Most breast cancers are of this type.
Lobular carcinoma starts in the parts of the breast, called lobules that produce milk. In rare cases, breast cancer can start in other areas of the breast.
Breast cancer may be invasive or non-invasive. Non-invasive breast cancer is also called "in situ."
Ductal carcinoma in situ (DCIS), or intraductal carcinoma, is breast cancer in the lining of the milk ducts that has not yet invaded nearby tissues. It may progress to invasive cancer if untreated.
Lobular carcinoma in situ (LCIS) is a marker for an increased risk of invasive cancer in the same or both breasts (Fig. 1.9).
11
Fig.1.9. Representation of the anatomy of the Lobular Carcinoma and Mammary Ductal Carcinoma.
There are many risk factors that to bring to development to tumors:
Age and gender. The risk of developing breast cancer increases with age. Most
advanced breast cancer cases are found in women over age 50 (70). Women are 100 times more likely to get breast cancer than men.
Family history of breast cancer. You may also have a higher risk for breast cancer if
you have a close relative who has had breast, uterine, ovarian, or colon cancer. About 20-30% of women with breast cancer have a family history of the disease.
Genes. Some people have genes that make them more likely to develop breast cancer.
The most common gene defects are found in the BRCA1 and BRCA2 genes. These genes normally produce proteins that protect you from cancer. If a parent passes you a defective gene, you have an increased risk for breast cancer. Women with one of these defects have up to an 80% chance of getting breast cancer sometime during their life (71).
Menstrual cycle. Women who got their periods early (before age 12) or went through
menopause late (after age 55) have an increased risk for breast cancer (72). Other risk factors include:
Alcohol use. Drinking more than 1-2 glasses of alcohol a day may increase your risk
for breast cancer (73).
Childbirth. Women who have never had children or who had them only after age 30
have an increased risk for breast cancer. Being pregnant more than once or becoming pregnant at an early age reduces your risk of breast cancer (74).
12
Hormone replacement therapy (HRT). You have a higher risk for breast cancer if you
have received hormone replacement therapy with estrogen for several years or more (75). Obesity. Obesity has been linked to breast cancer, although this link is controversial.
The theory is that obese women produce more estrogen, which can fuel the development of breast cancer (10).
Radiation. The radiation therapy to treat cancer of the chest area, increase higher risk
to develop breast cancer (11).
Treatment is based on many factors, including: type and stage of the cancer, whether them cancer is sensitive to certain hormones, whether the cancer over-expresses a gene called HER2/neu. In general, cancer treatments may include: chemotherapy medicines to kill cancer cells, radiation therapy to destroy cancerous tissue, surgery to remove cancerous tissue, lumpectomy removes the breast lump; mastectomy removes all or part of the breast; hormonal therapy. Most women receive a combination of treatments. For women with stage I, II, or III breast cancer, the main aim is to treat the cancer and prevent it from returning. For women with stage IV cancer, the objective is to improve symptoms and help them live longer. In most cases, stage IV breast cancer cannot be cured.
Stage 0 and DCIS Lumpectomy plus radiation or mastectomy is the standard treatment. There is some controversy on how best to treat DCIS.
Stage I and II Lumpectomy plus radiation or mastectomy with some sort of lymph node removal is the standard treatment. Hormone therapy, chemotherapy, and biologic therapy may also be recommended following surgery.
Stage III Treatment involves surgery, possibly followed by chemotherapy, hormone therapy, and biologic therapy.
Stage IV Treatment may involve surgery, radiation, chemotherapy, hormonal therapy or a combination of these treatments.
After treatment, some women will continue to take medications such as tamoxifen for a period of time. All women will continue to have blood tests, mammograms, and other tests after treatment. Women who have had a mastectomy may have reconstructive breast surgery, either at the same time as the mastectomy or later.
13
1.4 Tumor microenvironment
The breast cancer microenvironment is a complex combination of several different cell types and molecules and is a key contributor to malignant progression (83). The role of tumor microenvironment is becoming more and more important in breast cancer. Several stromal cell types are implicated in promoting the ‘hallmarks’ of cancer cells (84). Tumor microenvironment includes fibroblasts, macrophages, immune cells, adipocytes, endothelial cells, and antigenic vascular cells. Stromal cells surround and interact with tumor cells. Over the last years, a robust body of evidence has highlighted the importance of the crosstalk between tumor and stoma. Tumor microenvironment has been shown to play a crucial role in tumorigenesis, from initiation to progression. Stromal cells promote cancer growth and invasion through the chemokine–chemokine receptor axis (85, 86). Infiltrating immune cells energize the immune effectors and vascular cells permit nutrients and oxygen uptake by tumors. In a normal mammary duct, there are luminal epithelial cells internally and my epithelial cells externally delimited by a basement membrane, which maintains the luminal cell polarity (87). The extracellular matrix (ECM) allows communication with the surrounding stroma. Genetic and epigenetic alterations lead to luminal cell proliferation, loss of epithelial polarity and decrease of myoepithelial cells, and changes in the ECM/basal membrane, finally resulting in mammary tumor development (88). As opposed to normal fibroblasts, cancer-associated fibroblasts (CAFs) (89) improve tumor growth and metastasis by producing growth factors and ECM proteins, as well as by modulating immune polarization (90). Also, the number of CAFs is increased during tumor progression (91). Accordingly, growth factors, cytokines, chemokines, and matrix metalloproteinases secreted by stromal cells lead to the recruitment of macrophages, endothelial precursor cells, and regulatory lymphocytes, which sustain tumor progression (92). It is worth noting that stroma has been correlated with clinical outcomes and response to therapy in breast cancer (93). The expression of ECM genes, uniformly expressed in both neoplastic and adjacent stromal cells, may divide breast cancers into different subgroups with different clinical outcomes (94,95). A study performing hierarchical clustering of the gene-expression profile of ECM-related genes classified breast cancer samples into four groups associated with different clinical outcomes (96). Stromal signatures are highly informative for patients with breast cancer. A serum-activated gene-expression signature from serum-activated fibroblasts was identified as a negative prognostic factor in patients with breast cancer (97). Also, a 26-gene signature called the stroma-derived prognostic predictor was generated by tumor-associated stroma and matched
14
normal stroma from breast cancer samples (98). This signature was found to be an independent prognostic factor (97). So tumor microenvironment influences patient outcomes and stromal gene expression signatures represent a strong prognostic value recapitulating the immune, angiogenic, and hypoxic responses (97). The stromal cells can be divided into three general classes:
Infiltrating immune cells Angiogenic vascular cells
Cancer-associated fibroblastic cells
Fig.1.10.Tumor formation involves the co-evolution of neoplastic cells together with extracellular matrix and vascular endothelial, stromal and immune cells. The tumor niche is a dynamic physical topography in which structural support, access
to growth factors, vascular supply and immune cell interactions can vary drastically even within the same lesion. The immune infiltrate can include multiple cell types, these cell populations can have both pro- and anti-tumor functions and can vary in their activation status and their localization within the tumor. The vascular network can differ in regard to the vessel's tissue of origin, maturity (extent of pericyte coverage), interstitial pressure and functionality. Cancer-associated fibroblasts can have significant plasticity and diverge with regard to activation status, localization within the tissue, stress response and
origin.
1.4.1 Cancer-associated fibroblasts (CAFs)
In the process of tumor formation, the normal microenvironment ‘niche’ changes to an altered (ie, reactive or desmoplastic) stroma which is composed of non-malignant supporting cells (ie, blood vessels, infiltrating inflammatory cells and blast-like cells) (98,99) This altered microenvironment functions as a collaborative partner in the process of tumourigenesis by influencing the homeostasis of cancer cells via paracrine regulators (eg, growth factors, cytokines and chemokines) and exosomes containing nucleic acids (98,100-102) Cancer associated fibroblasts (CAFs), prominent stromal elements in most types of human carcinomas, are α-smooth muscle actin positive, spindle-shaped, blast-like cells. Differentiation of CAFs from other cell types, such as local fibroblasts, hepatic stellate cells, mesenchymal stem cells, endothelial and epithelial cells, is mainly mediated by transforming
15
growth factor-β1 (TGF-β1), but other factors, such as growth hormones (ie, epidermal growth factor (EGF), fibroblast growth factor (FGF) and platelet-derived growth factor (PDGF)), chemokines, epigenetic regulators and oxidative stress also may play a role in CAF differentiation. (101,103,104). CAFs, phenotypically, closely resemble normal myofibroblasts, but they express specific markers (ie, fibroblast activation protein (FAP), fibroblast-specific protein 1, neuronglial antigen-2, vimentin, Thy-1, tenascin (TN)-C, periostin (POSTN), palladin or podoplanin (PDPN)) and display an increased proliferation and migratory behaviour in vitro (105,106). CAFs produce and secrete various extracellular matrix (ECM) proteins (ie, collagens I, III, IV), proteoglycans (ie, fibronectin, laminin, TN), chemokines (eg, CXCL and CCL), cytokines (eg, interleukin (IL)-6 and IL-8) and other tumor-promoting factors which affect vascularization (ie, PDGF, vascular endothelial growth factor (VEGF), stromal-derived factor-1 (SDF-1), matrix metalloproteinase (MMPs)), proliferation capacity, tumor cell invasiveness and survival (ie, TGF-β, EGF, hepatocyte growth factor (HGF) or FGF) (98,107-109). Regarding anticancer therapy, the frequency of genetic mutations in CAFs is one of the most important issues. Cells with genetic stability may be less prone to escape or resistance to chemotherapy than those with genomic instability (110) Several studies demonstrated that high percentage of CAFs undergo genetic alterations, such as loss of heterozygosis or mutation of tumor suppressor genes (ie, phosphatase and tensin homolog and P53) (111-114). The theory of genetic coevolution of CAF and the neighbouring cells (ie, random mutation of CAF generated independently from neoplastic epithelial cells that may support tumor progression) is under debate due to the potential artefacts caused by the analytical methods used for the identification of these genetic alterations (115). Other groups described that the somatic mutations of CAFs are found to be extremely rare and are unlikely to be responsible for their stable cancer-promoting attributes (116,117). Interestingly, CAF derived proteins which (98) may have an important role in the development of environment-mediated drug resistance, (99) may act as powerful prognostic markers and (100) may be promising targets of anticancer therapy (115).
16
Fig.1.11. A) Normal fibroblasts are embedded within the fibrillar extracellular matrix (ECM) of connective tissue, which
consists largely of type I collagen and fibronectin. Fibroblasts interact with their surrounding microenvironment through integrins such as the α1 and β1 integrin. Typically, fibroblasts appear as fusiform cells with a prominent actin cytoskeleton and vimentin intermediate filaments. B) fibroblasts can acquire an activated phenotype, which is associated with an increased proliferative activity and enhanced secretion of ECM proteins such as type I collagen and tenascin C, and also fibronectin that contains the extra domain a (EDA-fibronectin) and SPARC (secreted protein acidic and rich in cysteine). Phenotypically, activated fibroblasts are often characterized as expressing α-smooth-muscle actin. Numerous growth factors such as TGFβ, chemokines such as MCP1, and ECM-degrading proteases have been shown to mediate the activation of fibroblasts.
1.5 Insulin and insulin-like growth factor-I
Insulin and IGF are peptides having 40–80 % homology making it challenging, although not impossible, to explain insulin and IGF-I ligand receptor interaction. Insulin/IGF signaling system mainly comprises of three ligands-IGF-I, IGF-II, and insulin, which in turn interact with at least six receptors as represented in the Fig. 1.12: the type I IGF receptor (IGF-IR), the IRA (IR-A), the IRB (IR-B), hybrid receptors of IGF and IR-A, hybrid receptors of IGF and IR-B, and hybrid receptors of IR-A and IR-B. Insulin when in blood circulation, called insulin ligand, is a monomer consisting of two chains, an a-chain of 21 amino acids and a β-chain of 30 amino acids linked by two disulfide bridges (117). IGFs are small, single-chain polypeptide ligands (7–8 kD) with an intact C-domain derived from prepropeptides in a manner similar to insulin (118). The mature IGF-I and IGF-II peptides consist of α and β domains that are homologous to β- and a chains of insulin. Furthermore, in the cellular microenvironment, six IGF-binding proteins (IGFBP1–6) are present, which are not only crucial in regulating the bioavailability of IGFs by competing with IGFR and IGFBP proteases but also modulate the balance between IGFs and IGFBPs (116). IGFBPs and IGFs comprise a major superfamily of protein hormones that regulate mitogenesis, differentiation, survival, and other IGF-stimulated events in both normal and cancerous cells (119).
17
Fig.1.11. IGF axis is comprised of three ligands: IGF-I, IGF-II, and insulin itself, which interacts with at least six receptors:
the type I IGF receptor (IGF-IR), the IRA (IR-A), the IRB (IR-B), hybrid receptors of IGF and IR-A, hybrid receptors of IGF and IR-B, hybrid receptors of IR-A and IR-B. Structurally, all IR and the IGFR have two extracellular α-subunits and two transmembrane β-subunits that are joined to each other by disulfide bonds. Insulin binds with high affinity to IR-A, IR-B, and 1R, and 1 binds to the 1R and to the hybrid receptor IR/IR-A or IR/IR-B. 2 binds to IR-A, IGF-1R or to IGF-IGF-1R/IR-A hybrid receptor. Insulin and insulin growth factor ligand bind to IGF-IR, IR-A, and hybrid receptors of IGF and IR-A, mediate the mitogenic signaling pathway, while ligands binding to IR-B activate metabolic signaling. Binding to the hybrid receptors, leading to mitogenic or metabolic signaling, is determined by the IR isoform that formed the hybrid receptors.
An in vivo study indicated that IGFBP3 inhibits the tumor growth of HER2 overexpressing human breast cancer cells (120). Furthermore, it was reported that high expression IGFBP2 was not associated with reduced cell proliferation in breast cancer, glioblastoma, prostate, and ovarian cancer suggesting that IGFBP can affect cell function in an independent manner, although their role in cancer is not yet clear (121)
1.5.1 The IR/IGF-IR signaling pathway and its involvement in cancer
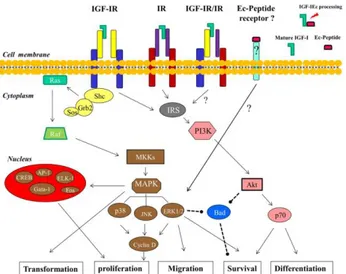
The insulin and the insulin-like growth factors I (IGF-I) signaling are mediated by hormone interaction with cognate tyrosine kinase receptors, IR and IGF-IR. Although these two receptors are highly homologous and are coupled to very similar intracellular substrate networks, in normal adult tissues insulin and IGFs stimulate specific functions, such as glucose metabolism for insulin and cell growth and proliferation for IGFs. However, in particular conditions, such as cancer, this signaling specificity is partially lost and both receptors may share similar biological functions. As the shared signaling pathway has an important role in cancer development and progression, both receptors have emerged as targets for cancer therapy. The two IR isoforms are usually co-expressed and their relative abundance is regulated by several factors, including developmental stage and tissue-specific factors (122). However, IR-A is predominantly expressed in fetal tissues and cancer cells, whereas the IR-B is preferentially expressed in differentiated (Figure) insulin-responsive tissues (123). Insulin receptor and IGF-IR are protein tyrosine kinases that belong to the IGF system and
18
regulate many crucial aspects of cellular physiology (122). Both receptors are products of two distinct genes, which are believed to derive from a common ancestral gene through a duplication event. Reflecting this common heritage, IR and IGF-IR share a high degree of homology (122). Indeed, both receptors are expressed at the cellular surface. As a consequence of the high level of homology of the two receptors, hybrid receptors (HRs) formed by an IR (IR-A or IR-B) αβ-hemireceptor and an IGF-IR αβ-hemireceptor (HR-A and HR-B, respectively) are also expressed in all tissues co-expressing IR and IGF-IR (124). Insulin receptor, IGF-IR, and HRs bind the same ligands (insulin, IGF-I, and IGF-II), although with very different affinities. Upon ligand binding, receptors become auto-phosphorylated on conserved tyrosine residues and activate similar intracellular signaling events. Tyrosine kinase domains with in the β-subunit of both IR and IGF-IR catalyze the phosphorylation of specific substrates, such as the members of IR substrates family (IRS-1 to IRS-4), Gab-1, Cbl, and Shc. Following tyrosine phosphorylation, IRS proteins interact with GRB2 (growth factor receptor binding protein 2) and with the p85 regulatory subunit of phosphoinositide3-kinase (PI3K). PI3K, in turn, regulates the activation of Akt which is crucial in mediating metabolic effects by regulating metabolic enzymes, but also in mediating cell growth, proliferation, and survival (125). The major signaling pathway downstream to IR and IGF-IR involves through the Ras/Raf/MEK/ERK cascade the regulation of important cellular processes including gene expression, cell motility, cell proliferation, cell survival, differentiation, and death (124).
Fig.1.12 Insulin and IGF-I share similar and overlapping signal transduction pathways. The insulin receptor isoforms, the
IGF receptors and the insulin-IGF-I hybrid receptor might be stimulated by related ligands, as shown. The end result of activating these signaling pathways is cellular end points that favor tumor development and progression.
19
In cancer, IR/IGF-IR signaling is often deregulated with consequent loss of signaling specificity and overlap between IR and IGF-IR actions. The stimulation of two main intracellular cascades common to both receptors (the PI3K/mTOR and the MAPK cascades) may also become unbalanced with the consequent amplification of mitogenic signals. Various mechanisms may account for the disruption of the physiological specificity in IR and IGF-IR signaling. Cancer cells often overexpress both IGF-IR and IR, the latter being predominantly expressed as IR-A. IR-A contributes to the amplification of IGFs signaling by directly binding IGF-II and, to a lesser extent, IGF-I (126), and also by increasing the formation of HRs, which bind both IGF-I and IGF-II with high affinity (127). Moreover, cancer cells produce IGFs in an autocrine/paracrine manner (11). Lastly, a chronic increase in circulating insulin levels resulting from insulin resistance may affect cancer growth and progression through a prevalent activation of IR signaling along the mitogenic pathway and by increasing IGF-I bioavailability (128). Therefore, in cancer cells, the IR may stimulate more strongly the pro-tumoral responses rather than the metabolic effects thus contributing to induce resistance to various anti-cancer therapies.
Figure 1.13.Signaling pathways and the cellular
processes downstream of IGF-I and insulin.
The action of insulin is investigated in particular in leiomyosarcomas, which are malignant tumors arising from smooth muscle cells, and rhabdomyosarcomas, arising from striated muscle cells. These cells are aggressive malignancies that respond poorly to chemotherapy.
20
1.6 Cross-talk between Insulin/IGF system and estrogen signaling in cancer
Estrogens and insulin/IGF system act as mitogens promoting cell proliferation in normal breast tissue as well as in breast carcinomas (135). Both hormones have been shown to play a role in the development of breast cancer and were found to activate multiple signaling pathways leading to proliferation of human breast cancer cell lines (Figure 1.15) (136). Originally, it was considered that these agents manifest their mitogenic actions through separate pathways, but a growing body of evidence suggests that the insulin/IGF system and estrogen-mediated signaling pathways are intertwined. E2 has been shown to enhance IGF signaling at multiple levels (137) E2 treatment of breast cancer cells alters expression of nearly all of the IGF family members including IGF-I, IGF-II, IGF-binding proteins, IGF-IR, and IRS-1 (138,139) while decreasing expression of other genes, such as IGFBP3 (140) and IGF-IIR (140). IGF-IR is one of the target genes of ER, and upon binding of estradiol to ER, transcription and translation of IGF-IR can be induced (141). Also, estradiol can stimulate cytosolic ER, which can directly cause phosphorylation of IGF-IR, which results in activation of downstream pathways (142). In particular, IGF/insulin signaling activates Erα via PI3K/AKT and/or MAPK pathways respectively by phosphorylating ERα serine167 and/or Erα serine118 (136,143). Noteworthy, IGF-IR and IR, after translocation to the nucleus, function as transcriptional regulators of IGF-IR promoter activity only in cells with reduced ER levels (144). Indeed, in ER depleted C4.12.5 breast cancer cells but not in ER positive MCF-7 cells, both IGF-IR and IR were able to translocate to the nucleus and bind the IGF-IR promoter. However, whereas IGF-IR enhanced the activity of its own promoter, IR acted as a negative regulator of IGF-IR promoter activity. Furthermore, this ER dependent regulation of IGF-IR promoter activity has been explained by ER interaction with Sp1, a zing-finger protein that is a major transactivator of IGF-IR gene. ERα enhances IGF-IR promoter activity via binding to Sp1, therefore, IGF-IR or IR competes with ERα for Sp1 binding to IGF-IR promoter sequences. This mechanism may explain the observation that IGF-IR and IR are able to bind IGF-IR promoter only in cells with low levels of ER (145).
21
Fig.1.15. Interaction between insulin-like growth factor-1 (IGF-1) and estrogen receptors (ER)s
Recently, it has been shown that a direct mechanism may contribute to insulin resistance in hyperestrogenemias: E2 may bind directly to insulin and/or the IR at pathophysiologically high concentrations of E2 (146). A microarray data suggest that a gene signature co-regulated by IGF-I and estrogen is correlated with poor prognosis in human breast cancer (147), which also implies dual inhibition of IGF-IR and ER pathway may be necessary in certain breast cancer subtypes. Importantly, expression of these co-regulated genes is correlated with poor prognosis of human breast cancer. In particular, a number of potential tumor suppressors, for example, β-cell linker (BLNK), were down-regulated by IGF-I and E2. Analysis of three down-regulated genes showed that E2-mediated repression occurred independently of IGF-IR, and IGF-I-mediated repression occurred independently of ERα. However, repression by IGF-I or E2 required common kinases, such as PI3K and MEK, suggesting downstream convergence of the two pathways (147). In addition, it has been shown that tamoxifen-resistant (TamR) cells had diminished levels of IGF-IR while unchanged levels of IR (148) as suggest also by current study on the dynamics of IGF-IR expression in ER positive breast cancer xenografts and human tumors upon endocrine treatment, using 111In-R1507 immunoSPECT/CT (149). These findings suggest that IGF-IR is a poor target in TamR tumors and IR might be an alternative option in treating TamR breast cancer (146). Patients with TamR tumors also show loss of IGF-IR at the time of progression on tamoxifen (150). Thus, endocrine resistant patients might not be the best candidates for anti-IGF-IR therapies. To this end, both the IGF system and the ER signals as well as newly identified key gene expression modulators of these pathways may represent a rational and novel strategy to prevent or delay endocrine dependent tumor growth, progression and the onset of endocrine resistance. Of note, it has been shown that serum levels of estrogen, insulin, C-reactive protein (CRP), and adiponectin are independent risk factors for BPBD and suggest that the estrogen, insulin, and
22
inflammation pathways are associated with the early stages of breast cancer development (134).
1.6 Aim of the study
The aim of this study was to ascertain the potential role elicited by the insulin/IGF system on GPER expression and function in different model systems. In particular, we evaluated whether IGF-I may induce GPER expression in breast and endometrial cancer cells, while the action of insulin was ascertained in leiomyosarcoma SKUT-1 cells and CAFs. Next, we sought to determine whether GPER expression induced by both IGF-I and insulin could be followed by the up-regulation of GPER target genes, like CTGF. Considering the important role of GPER in relevant biological effects like migration and proliferation, we asked whether these biological responses induced by IGF-I require GPER in breast and endometrial cancer cells. As estrogens have been reported to increase glucose uptake and cell cycle progression in breast cancer cells through a mechanism which involves ER, we investigated whether the aforementioned events could be stimulated by estrogens through GPER. Altogether, our data provide novel insights on the action exerted by the insulin/IGF system through GPER.
23
Chapter 2
Materials and Methods
2.1 Reagents
IGF-I, bovine insulin, 17β-Estradiol (E2), H89, LY294,002 (LY),were purchased from Sigma-Aldrich Corp. (Milan, Italy). 3-bromo-5-t-butyl-4-hydroxybenzylidenemalonitrile (AG1024), bisindolylmaleimide I (GF109203X), PD98059 (PD), Rottlerin, Tyrphostin AG1478 were bought from Calbiochem (Milan, Italy). ICI 182,780 (ICI) and (3aS,4R,9bR)-4-(6-Bromo-1,3-benzodioxol-5-yl)-3a,4,5,9b-3H-cyclopenta[c]quinolone (G15) were obtained from Tocris Bioscience (Bristol, UK). Insulin was solubilized in HEPES 25 mM. IGF-I was dissolved in water, PD, E2 were dissolved in ethanol, GFX, Rottlerin and AG1478 and AG1024 were solubilized in dimethylsulfoxide.
2.2 Cell cultures
R− mouse fibroblasts (kindly provided by Renato Baserga, Philadelphia, PA) are mouse 3T3-like cells derived from animals with a targeted disruption of the IGF-IR gene. R− cells, which express low endogenous IR (approximately 5×10³ receptors per cell) (151), were cotransfected with the pNTK2 expression vector containing the cDNA for the human IR-A (Ex11−) or IR-B (EX 11+) and with the pPDV61 plasmid encoding the puromicin resistance gene, by using the Lipofectamine reagent (Life Technologies, Inc./BRL, Bethesda, MD), as previously described (152). Cell clones obtained (R−/IR-A and R−/IR-B cells) express approximately 3 × 10⁵ to 5 × 10⁵ receptors per cell (153). All cell types were grown in DMEM (4.5 g/liter glucose) supplemented with 10% fetal bovine serum, 1% penicillin-streptomycin and 2µg/ml of puromycin. Leiomyosarcoma SKUT-1 cells were kindly provided by Dr. Colombatti (Aviano, Italy). Cells were grown in DMEM supplemented with 10% fetal bovine serum and 1 mM Na Pyruvate. MCF-7 breast cancer cells were maintained in DMEM/F-12 (Invitrogen, Gibco, Milan, Italy) supplemented with 10% fetal bovine serum, 100 mg/ml penicillin/streptomycin and 2mM L-glutamine (Sigma, Milan, Italy). Ishikawa
24
endometrial cancer cells were maintained in DMEM (Invitrogen, Gibco) without phenol red supplemented with 10% fetal bovine serum 100 mg/ml penicillin/streptomycin and 2mM L-glutamine (Sigma). Cells were switched to medium without serum the day before experiments; thereafter cells were treated as indicated.
2.3 Isolation, cultivation, and characterization of CAFs
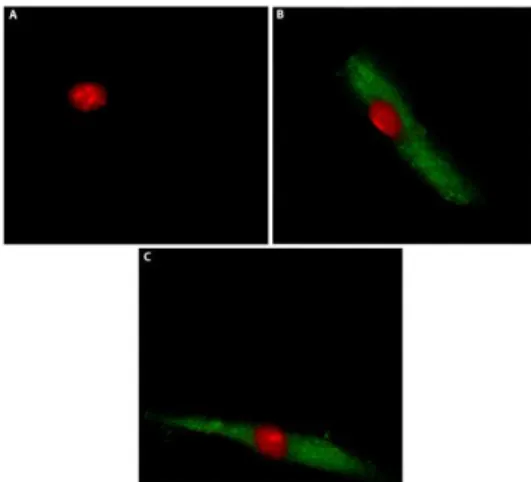
CAFs were obtained from surgical specimens of breast cancer tissues of 47 patients who underwent mastectomy at the Regional Hospital in Cosenza (Italy). Samples were immediately incised in 5 ml of medium and incubated over-night in digestion solution (400 IU collagenase, 100 IU hyaluronidase and 10% FBS, containing antibiotic and antimycotic solutions). Cells were then separated by differential centrifugation at 90×g for 2 min. The supernatant containing fibroblasts were centrifuged at 485×g for 8 min, the pellet obtained was suspended in fibroblasts growth medium (Medium 199 and Ham’s F12 mixed 1:1 and supplemented with 10% FBS and 1% penicillin) and cultured at 37°C, 5% CO2. At 80% of confluence fibroblasts were stored at -80°C for the next isolation of RNA. Primary cell cultures of breast fibroblasts were characterized by immunofluorescence. Briefly cells were incubated with human anti-vimentin (V9) and human anti-cytokeratin 14 (LL001) (Santa Cruz Biotechnology, DBA, Milan, Italy). In order to assess fibroblasts activation, anti-fibroblast activated protein α (FAPα) antibody (H-56, Santa Cruz Biotechnology, DBA, Milan, Italy) was used (Figure 2.1). All experiments were performed in a mixed population of CAFs obtained from 5 patients with low serum insulin levels. Signed informed consent from all the patients was obtained and all samples were collected, identified and used in accordance with approval by the Institutional Ethical Committee Board (Regional Hospital of Cosenza, Italy).
Figure 2.1 Characterization of CAFs. CAFs were immunostained by anti-cytokeratin 14 (A), anti-vimentin (B) and anti FAPα (C)antibody.
25
2.4 Western blotting
Cells were grown in 10-cm dishes and exposed to ligands before lysis in 500μl of lysis buffer containing: 50mM HEPES pH 7.5, 150mM NaCl, 1.5mM MgCl2, 1mM EGTA, 10% glycerol, 1% Triton X-100, 1% sodium dodecyl sulfate (SDS), a mixture of protease inhibitors (Aprotinin, PMSF and Na-orthovanadate). Protein concentrations were determinated according to the Bradford method (Sigma-Aldrich). Equal amount of whole protein extracts were electrophoresed through a reducing SDS/10% (w/v) polyacrilamide gel and transferred to a nitrocellulose membrane (Amersham Biosciences Milan, Italy). Membranes were blocked and probed with primary antibodies against GPER (N-15), CTGF (L-20), c-Fos (H-125), phosphorylated ERK ½ (E-4), ERK2 (C-14), phosphorylated PKCδ (Thr 507), PKCδ (C-20), β-actin (C2) and β-tubulin (sc-9104) purchased from Santa Cruz Biotechnology (DBA, Milan, Italy); insulin receptor α (IRα) from BD bioscience, cyclin D1 (M-20), ERα (F-10), IGF-IR (7G11), and β-actin (C2) purchased from Santa Cruz Biotechnology (DBA), and p-ERα Ser118(16J4) purchased from Cell Signaling Technology. The levels of protein and phosphoproteins were detected with appropriate secondary HRP-conjugated antibodies and the ECL (enhanced chemiluminescence) System (GE Healthcare, Milan, Italy). All experiments were performed in triplicate and blots shown are representative.
2.5 Transient transfections
The transfections allow to insert exogenous biological material, such as nucleic acids, into the eukaryotic cell. The transfection is defined "transient" when the inserted genetic material remains in the cell as an extrachromosomal fragment and does not integrate into the cellular genome; in this case the features induced by transfection persist for a short time, usually disappear prior to 72 hours. The main problem in the transfer of nucleic acids is provided by the presence of negative charges, due to phosphate groups, in the skeleton of the molecules. Because of these charges, the exogenous material is not able to overcome the cell membrane, as electrostatic forces of repulsion occur. One of the methods of transfection more employed to mask the anionic groups of the DNA is represented by the use of cationic lipids. This method is included in the field of chemical techniques of transfection and requires the use of amphipathic lipid molecules which associate to form liposomes. These, being constituted by amphipathic lipids, in contact with the aqueous environment form a phospholipid bilayer very similar to cell membranes. Moreover, the liposomes may contain within them charged molecules, such as DNA, as their polar heads are turned towards the inner of the vesicle. This complex lipid/DNA can fuse with the plasma membrane and carry the exogenous material
26
within the cell. The cationic lipids most commonly used have characteristics such as high efficiency, low cytotoxicity, quick and simple protocol for usage and some can be used also in the presence of serum.
2.5.1 Plasmids
The GPER luciferase expression vector promGPER was previously described (154). The CTGF luciferase reporter plasmid promCTGF (-1999/þ36)-luc was a gift from Dr B Chaqour. The luciferase reporter plasmid for AP-1-responsive collagen promoter was a kind gift from H van Dam (Department of Molecular Cell Biology, Leiden University, Leiden, Netherlands). As an internal transfection control, we cotransfected the plasmid pRL-TK (Promega, Milan, Italy) that expresses RenillaLuciferase. The plasmid DN/cfos, which encodes a c-fos mutant that heterodimerizes with c-fos dimerization partners but does not allow DNA biding,54 was a kind gift from Dr C Vinson (NIH, Bethesda, MD, USA). The Sure Silencing (sh) IGF-IR, (sh) ERa and the respective control plasmids (shRNA), generated in pGeneClip Puromycin Vector, were purchased from SA Bioscience Corp. (Frederick, MD, USA) and used according to the manufacturer’s recommendations (more information is available at www.sabiosciences.com). Short hairpin constructs against human GPER (shGPER) and CTGF (shCTGF) were obtained and used as previously described.12,14 In brief, they were generated in lentiviral expression vector pLKO.1 purchased by Euroclone, Milan, Italy. The targeting strand generated from the GPER shRNA construct is 50-CGCTCCCTGCAAGCAGTCTTT-30 . The targeting strand generated from the CTGF shRNA construct is 50-TAGTACAGCGATTCAAAGATG-30. The shIR was purchased from SABiosciences (Qiagen).
2.5.2 Luciferase assays
To perform the luciferase assay two "reporter" enzymes are simultaneously expressed in a single system and their activities are measured. The activity of the experimental reporter is correlated to the specific conditions of treatment, while the basal cell activity is compared to that of the co-transfected control reporter (pRL-CMV). Comparing the activity of the experimental and control reporters, it is possible to normalize experimental variability which generally is caused by the differences between the number of cells and effectiveness of the transfection. In this assay in one sample are measured sequentially the activities of two luciferase: the firefly or firely luciferase (Photius pyralis) and the Renilla luciferase (Renilla reniformis). These enzymes have different structures and requires different substrates, so that it is possible to discriminate selectively the respective bioluminescent reactions. The activity
27
of firefly luciferase is measured initially adding the LAR II (Luciferase Assay Reagent II) to the cell lysate. This generates a light signal that is appropriately quantified using a luminometer (Lumat model LB 9507, Berthold Technology). Then, adding in the same tube the Stop & Glo reagent, the first enzymatic reaction is stopped and and simultaneously start the second reaction catalyzed by Renilla which also generates a light signal. Finally, the values of the Luciferase activity are compared with the corresponding values of Renilla and expressed as " relative Luciferase units ". In this study for the luciferase assays, cells (1x10⁵) were plated into 24-well dishes with 500 µl/well of regular growth medium the day before transfection. The medium was replaced with DMEM lacking serum and phenol red on the day of transfection, which was performed using X-tremeGene9 reagent, as recommended by the manufacturer (Roche Molecular Biochemical, Milan, Italy), with a mixture containing 0.5 mg of reporter plasmid and 2ng of pRL-TK. After 6h the medium was replaced again with DMEM lacking serum and phenol red, treatments were added and cells were incubated for an additional 24h. Luciferase activity was then measured with the Dual Luciferase Kit (Promega Italia, Milan, Italy) according to the manufacturer’s recommendations. Firefly luciferase activity was normalized to the internal transfection control provided by the Renilla luciferase activity. The normalized relative light unit values obtained from cells treated with vehicle were set as one fold induction upon which the activity induced by treatments was calculated. before transfection.
2.6 RT-PCR and real-time PCR
Total RNA was extracted from cells manteined for 24 hours in medium without serum and treated with ligand for indicated times using Trizol commercial kit (Invitrogen, Milan, Italy) according to the manufacturer’s protocol. RNA was quantified spectrophotometrically, and cDNA was synthesized from the RNA by reverse transcription using murine leukemia virus reverse transcriptase (Invitrogen). We quantified the expression of selected genes by real-time PCR. This method is based on the use of intercalating agents which bind to double stranded DNA. These molecules, when excited by laser beams, emit fluorescence and allow to follow in real-time the progress of the reaction and the increase of the amount of nucleic acid. In this study we used SYBR Green as the detection method and the Step One sequence detection system (Applied Biosystems Inc., Milan, Italy). For GPER (mouse) the primers used were: 5-TGGTGGTGAACATCAGTCTC-3’ (GPER forward); 5-AAGCTCATCCAGCTGAGGAA-3’. For GPER (human) the primers used were: 5-ACACACCTGGGTGGACACAA-3’ (GPER forward); 5-GGAGCCAGAAGCCACATCTG-3’ (GPER reverse). For the ribosomal protein
28
18S (human and mouse), which was used as a control gene to obtain normalized values, the primers used were: 5-GGCGTCCCCCAACTTCTTA-3’ (18S forward) and 5-GGGCATCACAGACCTGTTATT-3’ (18S reverse). Assays were performed in triplicate and the results were normalized for 18S expression and then calculated as fold induction of RNA expression.
2.7 Chromatin immunoprecipitation
The cells grown on 10-cm plates were shifted and treated for 24 h in a medium lacking serum and then with vehicle or insulin (10 nM). Chromatin immunoprecipitation (Chip) assay was carried out as described previously (40). The immune-cleared chromatin was immunoprecipitated with anti c-Fos (H-125) or nonspecific IgG (Santa Cruz Biotechnology, DBA). A 4 ml volume of each immunoprecipitated DNA sample and input were used as a template to amplify by PCR the region containing an AP-1 site located in the
GPER promoter region. The primers used to amplify this fragment were as follows: 50CGTGCCCATACCTTCATTGCTTCC- 30 (forward) and 50-CCTGGCCGGGTGTCTGTG- 30 (reverse).
2.8 Migration assay
Migration assays were performed using Boyden Chambers (Costar Transwell, 8 mm polycarbonate membrane). For knock-down experiments, cancer-associated fibroblasts (CAFs) leiomyosarcoma SKUT-1, MCF-7 and Ishikawa cells were transfected with shRNA constructs directed against GPER or CTGF or ERα and with an unrelated shRNA construct (500ng DNA/well transfected with X-tremeGene9 reagent in medium without serum). After 24h, cells were seeded in the upper chambers. 10nM insulin alone and together with 10µM ICI or 10µM G15 was added to the medium without serum in the bottom wells. After 6h, cells on the bottom side of the membrane were fixed and counted.
2.9 Proliferation assays
For quantitative proliferation assay, MCF-7 and Ishikawa (1x10⁵) were seeded in 12-well plates in regular growth medium. Cells were washed once they had attached and then incubated in medium containing 2.5% charcoal stripped fetal bovine serum; when used, 500 ng of the indicated shRNA were added to cells using X-tremeGene9 reagent as recommended by the manufacturer and then renewed every 2 days before counting; treatments were added every day. Evaluation of cell growth was performed after 4 days using automatic counter (Countess - Invitrogen). Data shown are representative of three independent experiments performed in triplicate.
29
2.10 Immunostaining assay
Fifty percent confluent cultured cancer-associated fibroblasts (CAFs) leiomyosarcoma SKUT-1, MCF-7, Ishikawa cells grown on coverslips were serum deprived and transfected for 12h with a control shRNA or a shRNA specific for GPER (shGPER), using X-tremeGene9 reagent (Roche Molecular Biochemical, Milan, Italy), as recommended by the manufacturer, and then treated for 24h with vehicle or 10nM insulin or IGF-I 100ng/ml. Thereafter, cells were fixed in 4% paraformaldehyde, permeabilized with 0.2% TritonX-100, washed three times with PBS, blocked and incubated overnight with primary antibody human GPER (N-15). After incubation, the slides were extensively washed with PBS and incubated with donkey anti-rabbit IgG-FITC (1:500, from Santa Cruz Biotechnology) and propidium iodide (1:1000, Sigma-Aldrich). Leica AF6000 Advanced Fluorescence Imaging System supported by quantification and image processing software Leica Application Suite Advanced Fluorescence (Leica Microsystems CMS, GbH Mannheim, Germany) were used for experiments evaluation.
2.11 Glucose uptake assay
The fluorescent analog of glucose 2-[N-(7 NITROBEZEN-2-OXA-1,3-DIAZOL-4-YL)-2-deoxy-d-glucose (2-NBDG; Life Technologies, Milan, Italy) was used to measure glucose uptake. Around 1x10⁵ cells per well were seeded in 12well plates and maintained in medium for 24h. For knock-down experiments, cancer-associated fibroblasts (CAFs) and leiomyosarcoma (SKUT-1) were transfected for 48h with shRNA constructs directed against GPER or CTGF and with an unrelated shRNA construct (3µg DNA/well transfected with X-tremeGene9 reagent in medium without serum). Cells were then treated with 10nM insulin for 8h, thereafter the medium was removed and replaced with medium without serum containing 10nM E2 and 10µM ICI or 10µM G15 along with 40µM of the glucose analog 2-NBDG for 30 minutes. Subsequently, the fluorescence was measured in an FLX-800 micro plate fluorimeter (Bio-Tek Instruments, Inc, Winooski, Vermont) with an excitation wavelength of 465nm and emission wavelength of 540nm (152).
2.12 Cell Cycle Analysis
Around 1x10⁵ cells per well were seeded in 12well plates and maintained in medium for 24h. For knock-down experiments, cancer-associated fibroblasts (CAFs) and leiomyosarcoma SKUT-1 were transfected for 48h with shRNA constructs directed against GPER or CTGF and with an unrelated shRNA construct (3µg DNA/well transfected with X-tremeGene9 reagent in medium without serum). Cells were then treated with 10nM insulin for 8h,
30
thereafter the medium was removed and replaced by medium without serum containing 10nM E2. After 8h, cells were pelleted, washed once with phosphate buffered saline, and resuspended in 0.5mL of a 50µg/mL propidium iodide in 1xPBS (PI) solution containing 20U/mL RNAse-A and 0.1% triton and incubated for 1h (Sigma-Aldrich). Cells were analyzed for DNA content by fluorescence-activated cell sorting (BD, FACS JAZZ, Milan, Italy). Cell phases were estimated as a percentage of a total of 10,000 events.
2.13 Statistical analysis
Statistical analysis was performed using ANOVA followed by Newman-Keuls’ testing to determine differences in means. P<0.05 was considered as statistically significant. Relationships between variables were assessed with the Spearman’s correlation coefficient. Differences and relationships were considered statistically significant when P<0.05
31
Results
Chapter 3
3.1 IGF-I induces GPER expression
In order to provide novel insights into the cross talk between the IGF-I system and estrogen signaling, we sought to evaluate the ability of IGF-I to regulate GPER expression in breast MCF-7 and endometrial Ishikawa cancer cells.
Fig.3.1. (A,B) IGF-I induces GPER mRNA expression, as evaluated by realtime PCR. The mRNA expression of GPER was
normalized to 18S expression. (C,D) GPER protein levels were evaluated by immunoblotting in cells treated for 24h with 100 ng/ml IGF-I. (E,F) GPER protein expression was evaluated by immunoblotting in cells treated for 24h with vehicle (-) or 100 ng/ml IGF-I alone and in combination with 10μM AG, 10μM GF, 10μM Rot, 10μM PD, 10μM H89, 10μM LY, as indicated. (G-J) The upregulation of GPER protein levels by 100 ng/ml IGF-I was abrogated in the presence of shIGF-IR. Side panels show densitometric analysis of the blots normalized to β-actin. Each column represents the mean±s.d. of three independent experiments. , , , Indicate P<0.05 for cells receiving vehicle (-) versus treatments.
32
Interestingly, we found that IGF-I upregulates the mRNA and protein levels of GPER in both cell types (Figures 3.1A-D). Next, we determined that the GPER protein induction is abrogated in the presence of the IGF-IR inhibitor AG1024 (AG), the MEK inhibitor PD98059 (PD), the PKC inhibitor GF109203X (GF) and the PKCδ inhibitor Rottlerin (Rot), but it still persists using the PKA and phosphoinositide3-kinase inhibitors, H89 and LY294,002 (LY), respectively (Figures 3.1E-F). Corroborating the aforementioned findings, the upregulation of GPER was also prevented by silencing IGF-IR expression (Figures 3.1G-J).
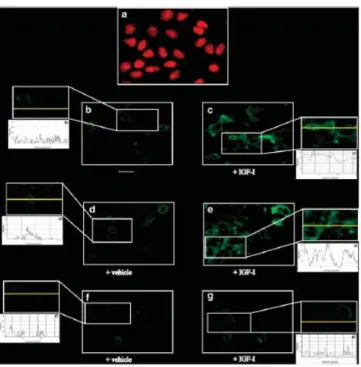
In immunofluorescence studies performed in MCF-7 cells, IGF-I further confirmed the ability to upregulate GPER expression, an effect that was no longer observed transfecting cells with a shGPER (Figure 3.1.1).
Fig. 3.1.1. MCF-7 cells were fixed, permeabilized and stained with anti-GPER antibody. (A) Nuclei (red) were stained by
propidium iodide. (B,C) Cells were treated for 24 h with vehicle (-) or 100 ng/ml IGF-I (as indicated), GPER accumulation was evidenced by the green signal. MCF-7 cells were transfected with a control shRNA (D,E) or with a shGPER (F,G) and treated as described above, then stained with GPER antibody. For descriptive purposes, Figures 1b-g, show the plot profiles obtained at the level of the yellow line of the corresponding inset using the program WCIF Image J for Windows. Note the higher values indicating zones of intense labeling. Each experiment shown is representative of 10 random fields. Data are representative of three independent experiments.
As the inhibitors of PKC and MEK transduction pathways prevented the upregulation of GPER induced by IGF-I, we then evaluated the activation of PKC and ERK in MCF-7 cells. IGF-I promoted rapid PKCδ phosphorylation, which was no longer evident in the presence of the GF and Rot, while it was still present using PD (Figure 3.1.2A). Moreover, IGF-I also induced a rapid phosphorylation of ERK1/2, which was abolished by PD as well as by GF and