SAPIENZA University of Rome
Faculty of Pharmacy and Medicine
PhD in
MORPHOGENESIS AND TISSUE ENGINEERING XXXI cycle
(A.Y. 2017/2018)
Regulation of the spermatogonial niche factor GDNF by retinoic acid
PhD student Rossana Saracino
Tutor Coordinator
3 INDEX
THE THESIS EXPLAINED ... 5
INTRODUCTION ... 7
1. Overview on Spermatogenesis ... 7
1.1 Sertoli cells and the niche for the SSCs ... 10
2. Glial Cell Line-Derived Neurotrophic Factor (Gdnf) ... 13
2.1 Gdnf expression in the testis ... 14
2.2 Gdnf regulation ... 17
3. Retinoic acid ... 19
3.1 Retinoic acid and spermatogenesis ... 21
AIM ... 25
RESULTS ... 27
4. Retinoic acid down-regulates gdnf in immature testis ... 27
5. RA-dependent gdnf inhibition is quite rapid and does not involve neo-synthesis of a repressor ... 30
6. RARα inhibition impinges gdnf down-regulation ... 32
7. Gdnf regulation depends on its promoter ... 36
8. RAR binds on Gdnf promoter ... 39
9. RA-dependent gdnf inhibition is prevented by HDACi ... 40
10. RA-dependent gdnf inhibition is based on promoter de- acetylation ... 42
11. gdnf RA-mediated regulation is conserved in adult mouse and is stage-dependent ... 43
12. RA could act as an indirect regulator of gdnf ... 45
13. Gdnf RA-dependent regulation in human testis ... 47
DISCUSSION ... 51
MATERIALS AND METHODS ... 57
4
Sertoli cells treatments ... 57
Testicular organ culture ... 58
Seminiferous tubules isolation ... 58
RNA extraction and Real-Time PCR ... 59
Short interference RNA (siRNA) ... 61
Plasmid mutation ... 61
Luciferase assay and protein normalization ... 62
ChiP assay ... 62
Human organ cultures ... 64
Statistical analysis ... 64
REFERENCES ... 65
5
THE THESIS EXPLAINED
Spermatogenesis in mammals is a high efficient process which results in a daily production of millions of mature spermatozoa (Johnson et al., 1980) and relies on a stem cell pool of spermatogonial stem cells (SSCs).
Sertoli cell, the unique somatic cell within the seminiferous tubules of testis, constitutes a specialized microenvironment called “SSCs niche” and directly controls SSCs behaviour. Sertoli cells secrete the niche factor GDNF, which acts on stem cells and is known to be crucial for their survival and self-renewal, in vitro and in vivo. On the other side, the key to commitment for SSCs is represented by retinoic acid (RA), the active metabolite of vitamin A, which is released within the testicular microenvironment. GDNF and RA are both essential for spermatogenesis, in fact in the absence both of GDNF or RA, the spermatogenic process is blocked (Meng et al., 2000; Wolbach & Howe, 1925).
In this work we demonstrated that RA negatively regulates GDNF in immature murine Sertoli cells, affecting both mRNA and secreted protein, confirming previous evidence in literature (Hasegawa et al., 2013). RARα is the nuclear receptor involved in this regulation acting through a novel-identified Retinoic Acid Responsive Element (RARE) on Gdnf murine promoter. Data obtained with HDACi suggested that the underlying molecular mechanism involved an epigenetic repression mediated by HDAC enzymes. These results were confirmed by ChIP-qPCR experiments, that indicated that Gdnf promoter undergoes a de-acetylation after RA treatment. We then focused our attention on adult mouse, where
gdnf regulation is conserved. Finally, we investigated this regulation
in human testis, and we found that in our culture conditions testis tissue positively responds to RA stimulation while RA effect on
7
INTRODUCTION
1. Overview on Spermatogenesis
In mammals, spermatogenesis is a complex, efficient and highly regulated process that starts from puberty and guarantees a continuous formation of spermatozoa, the male gametes responsible for the transmission of the genetic makeup to subsequent generations.
Spermatogenesis takes place in the testis. Testes are two oval-shaped organs covered by a fibrous multi-layered tunica, properly named vasculosa, albuginea and vaginalis. Within the testis, septa of connective tissue create lobules that hold highly convoluted seminiferous tubules. This last are tubular structures enclosed by a thick basal lamina and smooth muscle cells, that hold germ cells and somatic Sertoli cells.
The continuous production of mature spermatozoa depends on the activity of an adult, rare, unipotent stem cell: the spermatogonial stem cell (SSC), that in mice constitutes only 0.03% of total germ cells (Tegelenbosch & de Rooij, 1993).
The complex process of spermatogenesis can be divided into three phases: proliferative phase, meiotic phase and spermiogenesis, that will be described below.
In the first phase, cells in the spermatogonial compartment begin a series of mitotic divisions aimed at the production of new spermatogonia and at the replacement of SSCs that periodically get lost. In the mouse, the spermatogonial compartment has been traditionally divided into two categories: the undifferentiated (which contains the SSCs) and the differentiating spermatogonia, both located on the basal membrane of the seminiferous tubule. The first category include the A-single (As); A-pair (Apr) which are two
daughter cells remained connected by an intracellular bridge due to an incomplete cytodieresis; A-aligned (Aal) spermatogonia which
are chains of 4, 8, 16 or occasionaly 32 clone cells connected by intercellular bridges.
Differentiating spermatogonia comprise A1, A2, A3, A4, Intermediate and B spermatogonia. All these cells are characterized
8
by the expression of KIT, SOHLH1 and SOHLH2 (Barrios et al., 2012; Suzuki et al., 2012). The last mitotic division of the B spermatogonia generates the preleptotene spermatocytes, the cells entering in meiosis.
Human spermatogonial subpopulation is less characterized with respect to the murine counterpart. It can be divided into three categories: A dark (Ad), A pale (Ap) and B spermatogonia. Ad and
Ap can be distinguished on the basis of nuclear morphology and
intensity of staining with hematoxylin (Clermont & Leblond, 1959; Clermont & Antar, 1973; Clermont, 1966). Ad and Ap
spermatogonia are considered as the counterpart for murine undifferentiated spermatogonia, while type B represents the differentiating cells, that divide to produce primary spermatocytes, secondary spermatocytes and spermatids (Boitani et al., 2016). It was commonly accepted that Ad constitute a pool of quiescent
spermatogonia which can give rise to Ap when needed, and were
thought to be the human „true‟ SSCs (Amann, 2008; Boitani et al., 2016). Recently, a new classification of the human spermatogonial subsets based on spermatogonial kinetics and marker expression have questioned the classical view of Ad and Ap (Di Persio et al.,
2017). Clearly, the identification of the human SSCs deserve further studies.
Spermatogonia differentiate into primary spermatocytes and enter the second phase of spermatogenesis, the meiotic phase. The first meiotic division is characterized by a long prophase, including leptotene, zygotene, pachytene and diplotene spermatocytes. Diplotene spermatocytes undergo two rapid subsequent divisions producing four haploid round spermatids from each germ cell, which undergo the spermiogenesis phase. In this last phase haploid spermatids get mature and differentiate into spermatozoa, cells characterized by elongated shape, compact nucleus and flagellum At the end, spermatozoa can be released into the lumen of the seminiferous tubule in a controlled process named spermiation. During their maturation, germ cells gradually move in an organized and coordinated movement from the basement membrane towards the lumen of the tubule, where spermatozoa will be released. In the mouse, the time required to form a sperm from a A1 spermatogonia, hence the total duration of spermatogenesis, is 35 days, while in
9
human is approximately 74 days (Heller & Clermont, 1963) (Heller & Clermont, 1964).
In mammals, within the seminiferous tubule it is possible to recognize different cellular associations called stages of the seminiferous epithelium, that succeed each other in time in any given area (Leblond & Clermont, 1952). “A complete series of the successive cell associations found along a seminiferous tubule” was described by Clermont as “the wave of the seminiferous epithelium”, while “a complete series of the successive cellular associations appearing in any one given area of the seminiferous tubule” is known as the cycle of the seminiferous epithelium (Leblond & Clermont, 1952).
In mouse, the time required for a stage to reappear in the same area is 8,6 days (Oakberg, 1956 b) while in human the duration of one cycle of the seminiferous epithelium is 16 days (Clermont, 1963). This highly complex tissue organization guarantees a continuous release of mature spermatozoa into the epididymis, that occurs in each area once every 8,6 days in mouse (Oakberg, 1956 a) every 16 days in humans (Clermont, 1963).
Spermatogenesis in rodents has been widely characterized and its study represents a model for the comprehension of the human spermatogenesis. In mouse, twelve different cell associations or stages have been described, indicated by Roman numerals I-XII (Oakberg, 1956 a). In human, for a long time six stages have been defined. More recently, in order to better parallel human and murine cycle of the seminiferous epithelium (Amann, 2008), twelve stages have been characterized also in human, based on spermatids acrosome development (Muciaccia et al., 2013). Spermatids, cells that undergo the most prominent cytological changes among cellular elements of the tubule (Clermont, 1960), make stages easily recognizable through the developmental step of their acrosome (Clermont & Leblond, 1955).
However, while in the mouse the twelve stages are distributed in a linear sequence as small segments of the seminiferous tubule, in human, a tubule cross-section typically contains 2-4 stages. So it was proposed that the human cellular associations are organized as “intertwined helical bands” along the seminiferous tubules (Schulze & Rehder, 1984), and this explains why the isolation of staged
10
seminiferous tubules based on transillumination is possible for rodents seminiferous epithelium but not for the human (Parvinen et
al., 1972).
Spermatogenesis is controlled by local molecules acting in autocrine or paracrine fashion, and by circulating hormones of the hypothalamic–pituitary-gonadal axis, through an endocrine level. Hypothalamus releases the gonadotropin releasing hormone GnRH, that in turn stimulates adenohypophysis to secrete follicle
stimulating hormone FSH and luteinizing hormone LH. FSH
hormone binds to its receptor FSHR on Sertoli cells, regulating the gene expression to support spermatogenesis (Walker & Cheng, 2005). The FSH signaling also promotes the production of Inhibin B by Sertoli cells, which acts as a negative feedback on the production of FSH (de Kretser et al., 2001).
LH on the contrary stimulates Leydig cells to produce testosterone which in turn acts as a negative feedback on the pituitary gland to block LH production (Ewing, 1993).
1.1 Sertoli cells and the niche for the SSCs
Like other adult self-renewing tissues, the seminiferous epithelium function relies on stem cells, more precisely spermatogonial stem cells (SSCs), which are subject to various extrinsic signals provided by the "stem niche". The stem cell niche is the microenvironment in which stem cells reside, and which provides stimuli able to influence the fate decisions: self-renewal or differentiation. Stimuli include cellular, cell-cell and cell-matrix interactions, and signal molecules able to affect the transcriptional program (Voog & Jones, 2010). The SSCs niche is the space comprised by the basal lamina of seminiferous tubules and the somatic Sertoli cells, which establish a close contact with germ cells. Also peritubular myoid cells, Leydig cells, macrophages and nerves (Caires et al., 2010) may be contributors of the niche. Interestingly, some Authors reported that the majority of Aundiff were clustered in regions of the
11
provide an adequate support to SSCs (Chiarini-Garcia & Russell, 2001; Yoshida et al., 2007).
However, it is well known that Sertoli cells are the main protagonists of the spermatogonial niche (de Rooij, 2017) (Figure 1). Sertoli appears as a large, columnar, arborized “nurse” cell (Griswold, 1995) which interacts with a well-defined number of germ cells, that vary among species (Russell & Peterson, 1984). The most evident morphologic feature in Sertoli cell, used for cellular recognition, is its euchromatic nucleus and the large nucleolus inside it. Interestingly, the nuclear shape changes during the seminiferous epithelium cycle.
Figure 1 Sertoli cell observed using light microscopy (LM), transmission electron microscopy (TEM) and immunofluorescence microscopy (IF) (França et al., 2016)
Most important markers for Sertoli cells are nuclear: SOX9 (SRY-box containing gene 9) (Frojdman et al., 2000), androgen receptor (AR) (Sar et al., 1990), GATA-binding protein 1 (GATA1) (Viger
et al., 1998); Wilms tumor protein-1 (WT1) (Sharpe et al., 2003;
Wang et al., 2013); cyclin-dependent kinase inhibitor 1B (p27kip1) (Sharpe et al., 2003).
Sertoli cells are the primary regulators of the sex determination: in the developing urogenital ridge, they establish the male sex of the gonad by expressing the Sex-determining Region Y (Sry) gene (Lovell-Badge, 1993) and by inhibiting the development of female
12
structures through the Anti-Müllerian Hormone (AMH) (Josso et
al., 1993). Sertoli cells actively proliferate during the fetal
development and keep proliferating in the prepubertal period. In men two proliferation peaks occur during the first three months of life and then during puberty (Cortes et al., 1987). Proliferation is regulated by many factors such as FSH and Thyroid hormone (TH), paracrine factors as TGFβ, androgens and autocrine factors like IL-1 (Tarulli et al., 20IL-12). However, at puberty Sertoli cells stop proliferating, undergo terminal differentiation and the established Sertoli cell number determines the testicular size (França et al., 2000).
Sertoli cells play an important structural role in the seminiferous tubule, dividing the basal compartment from the adluminal compartment of the seminiferous epithelium through the blood-testicular barrier (BTB), which is a structure formed by Sertoli cells tight junctions and composed by occludin, claudins and junctional adhesion molecules (Mruk & Cheng, 2010). During the cycle of the seminiferous epithelium, this structure, following retinoic acid pulse, faces dramatic restructuring (Hasegawa & Saga, 2012) allowing the transit of preleptotene spermatocytes from the basal to the adluminal compartment of the seminiferous epithelium.
In the basal compartment, Sertoli cells, with their cytoplasmic branches, embrace SSCs confining them in a highly isolated microenvironment enriched of factors secreted by Sertoli themselves, interstitial cells and molecules brought by the blood (Oatley & Brinster, 2012). The main factors controlling the balance between self-renewal and differentiation are: GDNF, FGF2, which increase the proliferation activity of SSCs and SCF, Activin A, CSF-1 and BMP4 that stimulate differentiation. Some of these factors are under hormonal control (Boitani et al., 2016).
Another important function of Sertoli cell is its phagocytic activity, aimed at the clearance of residual body of leftover spermatid cytoplasm and apoptotic cells. The phagocytic activity relies on class B scavenger receptor type I (SR-BI) of Sertoli cells and phosphatidylserine exposed at the membranes of target cells (Nakagawa et al., 2005).
Sertoli cells are also key regulators of androgen production, in fact they control Leydig cell population in the neonatal (Rebourcet et
13
al., 2014) and adult testis (Rebourcet et al., 2014b). Since the
Sertoli cells and the Leydig in the interstitial tissue do not establish a direct contact, it is possible that the action of the Sertoli on them is mediated by secreted factors, or indirectly through peritubular myoid cells (Rebourcet et al., 2014b). Interestingly, in humans, Sertoli cell number, as well as Leydig cell number and function, decreases with aging (Johnson et al., 1984). In this context, the reduction of Sertoli cell number in men could be at the base of testosterone decrease associated with aging (Rebourcet et al., 2014 b).
Sertoli cells make testis an immune privileged organ. In fact, their immuno-regulatory properties create a microenvironment that suppresses immune reactions against spermatocytes and spermatids, that normally express proteins not recognized by the immunological self-tolerance (O‟Rand & Romrell, 1977; Tung & Fritz, 1978). This action is exerted physically by the BTB that impinges the transit of leukocytes and molecules in the seminiferous epithelium and by the secretion of a variety of molecules such as apoptosis inhibitors, complement inhibitors and immunoregulatory factors like TGFβ1, CCL27, IDO and galectin-1 (Guazzone et al., 2009; Meinhardt & Hedger, 2011; Doyle et al., 2012).
2. Glial Cell Line-Derived Neurotrophic Factor (Gdnf) The glial cell line-derived neurotrophic factor (Gdnf) was originally isolated in rat embryo midbrain cultures and identified as a crucial factor for midbrain dopaminergic neurons survival (Schubert, 1974). GDNF, is one of the four neurotrophic factors of the GDNF family (GFLs), together with neurturin (NRTN),
persephin (PSPN), artemin (ARTN) (Takahashi, 2001). GFLs
constitute a subgroup of the TGF-β superfamily, with whom they share conformational features, like the “cysteine knot” structure (Lin et al., 1993).
The murine Gdnf gene is located on chromosome 15 and consists of about 27 kb. It consists of three exons interspersed with two introns of 4.1Kb and approximately 18.5Kb. In the mouse, the presence of
14
alternative intronic promoters that generate transcripts with different 5'-UTR ends was then described (Tanaka et al., 2000a; Tanaka et
al., 2000b; Tanaka et al., 2001). The organization of the human
gene encoding GDNF is similar to the murine, and also in this case the transcripts undergo alternative splicing to the 5'UTR region, thus generating multiple isoforms in the 5'UTR region (Airavaara et
al., 2011).
GDNF is synthesized as 211 amino acid precursor protein, converted into the 134 amino acid active form and then secreted (Lin et al., 1993). Differently from TGF-β family members, GFLs, bind to the glycosylphosphatidylinositol (GPI)-anchored GDNF family receptor α, GFRα-1, on the membrane surface (Jing et al., 1996; Treanor et al., 1996). This binding raises GDNF affinity for the co-receptor c-RET, a tyrosine kinase transmembrane receptor, so that the GDNF-RET-GFRα-1 complex triggers the intracellular cascade.
2.1 Gdnf expression in the testis
The comprehension of the in vivo function of GDNF in mammalian testis dates back to 2000 when Meng and colleagues created a murine model which overexpressed GDNF or carried one GDNF-null allele in the testis (Meng et al., 2000). In the first case, transgenic mice exhibited an increased number of spermatogonial stem cells (SSCs) organized in clusters, that degenerated over time into non-metastatic tumours. On the contrary, mice holding a single functioning Gdnf allele showed a progressive depletion of stem cells reserve resulting in Sertoli-cell-only phenotype and long-term impaired spermatogenesis. These results suggested the requirement of an optimum range of GDNF concentration for SSCs self- renewal (Chen et al., 2014). Later, GDNF was shown to be a crucial molecule for the expansion of SSCs in vitro (Kanatsu-Shinohara et
al., 2005; 2003; Kubota et al., 2004).
Within the testis, the main source of GDNF is Sertoli cell (Trupp et
al., 1995, Golden et al., 1999). More recently, peritubular myoid
15
testis (Spinnler et al., 2010, Chen et al., 2014). PM cells are smooth-muscle-like cells that surround the external basal lamina of seminiferous tubules and were traditionally thought related to structural support and contractility of seminiferous tubules. This finding raised the hypothesis that also PM cells could influence SSCs behaviour and could actively take part in the SSCs niche. GDNF responsive cells are As and Apr which mostly expressed the
GFRα-1 receptor. GFRα-1 is expressed at lower levels also in Aal
(Nakagawa et al., 2010; Grasso et al., 2012).
In human testis, the source of GDNF comprises Sertoli cells (Davidoff et al., 2001) and myoid peritubular cells (Spinnler et al., 2010, Chen et al., 2014; Chen et al., 2016).
Both Apale and Adark spermatogonia express the GDNF receptor GFRα-1 (Grisanti et al., 2009), which in complex results expressed by 54 ± 8% of the cells in the spermatogonial compartment (Di Persio et al., 2017).
The role of GDNF in human testis is still poorly understood, even if a similar function to that in rodents has been hypothesized. In 2012 the expression of GDNF mRNA and protein was analyzed in Sertoli cells from non obstructive azoospermia (NOA) patients, which are characterized by the loss of germ cells and impaired spermatogenesis. This study showed that NOA patients exhibited remarkably lower levels of GDNF mRNA and protein respect to the normal counterpart (Ma et al., 2013). The same conclusions were drawn by Singh and colleagues which analysed GDNF expression in Sertoli cells from Sertoli cell-only (SCO) patients (Singh et al., 2017). They showed a 3,4 fold less production of GDNF and a 10 fold reduction of GFR-1 expression in SCO testes compared to the normal.
In target cells, GDNF downstream signalling leads to a wide gene expression modulation. In particular, by microarray analysis, 1124 genes were found differentially modulated after GDNF exposure. Among these, N-Myc and L-Myc, as well as cyclins D3 and B were found up-regulated. On the contrary, cell cycle inhibitors p21, p19 and p15 resulted down-regulated (Hofmann et al., 2005).
GDNF also positively regulates a series of genes proved to be crucial to spermatogonial self-renewal, such as (Oatley et al., 2006; Oatley et al., 2007) Bcl6b (B cell CLL/lymphoma 6 member B),
16
Erm (Ets variant 5), Lhx1 (LIM homeobox 1). Moreover GDNF stimulates spermatogonia expression of its own receptor GFR-1 (Grasso et al., 2012) and Fibroblast Growth Factor 2 receptor, FGFR2, increasing the responsiveness to this molecule that in turn stimulates SSCs self-renewal (Hofmann et al., 2005).
Although Gdnf role as promoting SSCs self-renewal has been well established, a role in influencing SSCs differentiation was also hypothesized. In fact the activation of ERK1/2 in GFRα-1 positive spermatogonia, under the control of GDNF, prevents them from differentiation (Hasegawa et al., 2013). In the same direction are data from Ikami and colleagues, that discriminate spermatogonia in two subsets: GFRα-1+, that appeared to be resistant from the differentiating stimulus of retinoic acid, and the NGN3+ that showed a rapid tendency to differentiate into KIT+ differentiating spermatogonia (Ikami et al., 2015). Concerning this last point, recently, Sharma and Braun revisited the commonly accepted role of GDNF. The Authors created a murine model in which the typical cyclical pattern of gdnf expression was disrupted so that it resulted constitutively expressed in all stages of spermatogenesis. An increased number of SSCs was detected, however, it did not match with a proportional increase in their Edu labelling index. This evidence suggested that GDNF could drive spermatogonial self-renewal by blocking the differentiation in particular of LIN28- As
cells into LIN28+ As Apr Aal, rather than directly promoting
proliferation (Sharma & Braun, 2018). On the contrary, Grasso and colleagues found that in murine seminiferous tubules Kit mRNA - a known marker of differentiating spermatogonia - was significantly up-regulated by GDNF at stages II-VIII, suggesting that GDNF could have a role in the differentiation of GFRα-1+ spermatogonia (Grasso et al., 2012).
GDNF was also described as a chemoattractant molecule in enteric neural cells (Young et al., 2001), in neuronal precursor cells in the rostral migratory stream (Paratcha et al., 2006), in epithelial cells (Tang et al., 1998), in transformed cells (Okada et al., 1999) and in seminoma (Ferranti et al., 2012).
It is known from literature the non-static nature of SSCs, as well as their not stochastic localization on the basal lamina (Chiarini Garcia
17
turnover and a migratory activity of SSCs along the tubule has been considered functional to the replacement of SSCs that get lost, from neighbouring SSCs (Klein et al., 2010). Dovere and colleagues for the first time demonstrated the direct capacity of the GDNF to induce undifferentiated spermatogonia migration in vitro. Intriguingly, the more undifferentiated (PLZF-positive) spermatogonia were shown to highly express VASP, a member of the ENA/VASP protein family that interacts with the actin cytoskeleton. The expression of VASP is high in As and Ap and
decreases to almost undetectable levels in Aal and differentiated
spermatogonia. In intact seminiferous tubules and germline stem cell cultures, GDNF treatment up-regulates VASP in a dose-dependent fashion. These data suggest that GDNF may impinge on the stem/progenitor compartment, affecting the actin cytoskeleton and cell migration (Dovere et al., 2013).
2.2 Gdnf regulation
GDNF function is crucial for SSCs self-renewal and for whole spermatogenesis maintenance, thus it has to be finely regulated. GDNF levels are not constant during the seminiferous epithelium cycle. In the mouse, both GDNF mRNA and secreted protein swing during the 12 stages of seminiferous epithelium, reaching a peak around stages II-VI, a decrease at VII-VIII and a minimum at stages IX-XI (Grasso et al., 2012). A similar trend was found in rat (Johnston et al., 2011) and hamster (Sato et al., 2011). Undifferentiated spermatogonia behaviour during the cycle of the seminiferous epithelium parallels GDNF fluctuations: from stage XI to stage IV they undergo proliferation and become arrested in phase G0/G1 at stages III-VI to prepare themselves for differentiationat stages VII-VIII. However, the number of As and Apr do not
significantly vary among the different stages, unlike Aal which
increase from stage XI to III before going to differentiation at stage VII (Tegelenbosch & de Rooij, 1993).
As the entire spermatogenesis is under the hypothalamic- pituitary axis control, the niche factor GDNF is controlled by systemic
18
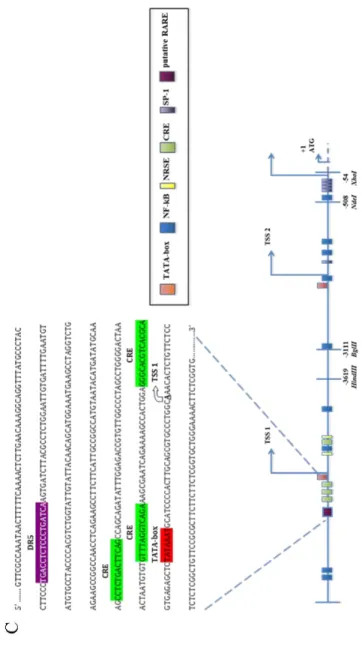
endocrine factors as well. In particular, GDNF is positively regulated by FSH hormone (Tadokoro et al., 2002) on Sertoli cells, as they express FSH receptor, FSHR. Because FSHR is not present on peritubular cells, GDNF production in peritubular cells does not seem to be directly regulated by this hormone (Albrecht et al., 2006). However, FSH pathway might be dispensable for GDNF production in vivo, given that FSHR- null mice are still fertile (Dierich et al., 1998; Krishnamurthy et al., 2000). Maximal Sertoli cell responsiveness to FSH occurs at stages II-VI (Parvinen et al., 1980), indeed, gdnf mRNA results induced by FSH in stage II–VI and not in other stages (Lamberti & Vicini, 2014). Recently, Lamberti and Vicini characterized three cAMP responsive element (CRE) implicated in the FSH-induced response of gdnf. These regions were localized just upstream the TATA box and Transcriptional Start Site 1 (TSS1) and were found to be highly conserved among human, mouse and rat (Lamberti & Vicini, 2014) (Figure 2).
Figure 2 Schematic structure of the murine Gdnf gene showing the evolutionarily conserved binding sites in the flanking regions of the TSS1 (Lamberti & Vicini, 2014).
Recently, Hasegawa and colleagues still shed light on cyclical activation of MEK/ERK in Sertoli cells, that determines oscillating levels of gdnf and promotes the undifferentiated state by inducing the expression of GFRα-1/RET. Moreover they identified in a
19
transient pulse of retinoic acid from stage VII an antagonist of gdnf expression levels (Hasegawa et al., 2013).
Testosterone was also demonstrated to stimulate both GDNF mRNA and protein in PM cells in vitro (Chen et al., 2014). Moreover the loss of Gdnf in PM cells caused a progressive depletion of undifferentiated spermatogonia over the long term in mice (Chen et al., 2016). On the contrary, is not clear the effect of testosterone on gdnf expression in Sertoli cells, even if is well established that they respond to testosterone, due to the expression of androgen receptor (AR). An androgen-responsive element (AR) highly conserved in mouse, rat and human was found on the promoter region of gdnf (Figure 2), suggesting a direct effect of testosterone on the expression level of gdnf (Lamberti & Vicini, 2014).
3. Retinoic acid
Retinoic acid (RA) is a small lipophilic molecule, the active metabolite of Vitamin A. It can rightly be considered a morphogen, according to the definition as “a secreted molecule that diffuses from local sources to form concentration gradients, which specifies multiple cell fates” (Schilling et al., 2016). In fact RA signalling is a crucial regulator of the primary body axis of the embryo (di Masi
et al., 2015).
RA is formed from circulating retinol (ROL) or from local storage of retinyl esters by two sequential oxidative steps: first ROL is converted into retinaldehyde by alcohol dehydrogenases (ADH); then retinaldehyde dehydrogenases (RALDH) convert retinaldehyde in RA. RA controls the gene expression through the binding of a heterodimer constituted of the nuclear receptors RAR/RXR (in the form of three different isoforms RARα,β,γ and RXRα,β,γ), which are located on conserved regions named Retinoic Acid Responsive Element (RARE) on the promoter of target genes. RARE elements are composed of two hexameric DR (direct repeats) - (A / G) G (T / G) TCA - spaced by 5pb (DR5) or 2pb (DR2). For both DR5 and DR2, the 5‟ of the sequence is bound by RXR and the 3‟ by RAR
20
(Cunningham & Duester, 2015). RARs receptors act as a molecular platform to recruit numerous factors that regulate gene transcription. In the classical model, the RA-dependent transcriptional activation requires that the RAR / RXR heterodimer in the absence of retinoic acid binds to the RARE sequence and represses the transcription of the target genes also through epigenetic modifiers. RAR / RXR in the repressive state recruits co-repressors such as NCOR-1 (Kumar et al., 2016), the histone deacetylases HDACs and the repressive chromatin-remodeling complex PRC2 (Polycomb repressive complex 2) (Figure 3 A). This leads to an increase in trimethylation of the lysine 27 of histone H3 (H3K27me3) which induces chromatin condensation and gene silencing. When retinoic acid is present, it binds to RAR and induces a conformational change of the RAR/RXR heterodimer that promotes the release of repressors and the recruitment of factors that activate transcription such as NCOA1 or SRC1, NCOA2 and NCOA3. In turn, the co-activators recruits the HATs histoneacetylases and the Tritorax complex that remove the negative epigenetic modifications (H3K27me3) and add histone activating transcription modifications: histone H4 acetylations and the histone H3 lysine 4 trimethylation. These modifications induce relaxation of the chromatin, allowing access on the promoter of the transcription factor target gene and the RNA polymerase.
The effect of RA on transcription is not always activatory. There are examples, in fact, where the RA leads to the repression of the transcription, recalling the Polycomb complex and the deposition of repressive changes. Some retinoic acid-regulated genes known in the literature are fibroblast growth factor (Fgf8), homeobox gene B1 (Hoxb1), pou5f3 in zebrafish and Wnt8a in mouse (Cunningham & Duester, 2015).
The retinoic acid-dependent pathways also include a non-transcriptional signalling pathway that activates a kinase cascade that will be integrated into the nucleus. Retinoic acid regulates the pathway of MAP kinases and ERK kinases by activating p42 / p44 and p38MAPK (Chung et al., 2010; Dey et al., 2007; Gianni et al., 2002). In this case the RA is bound by the cytoplasmic portion of the RARs that will transmit the signal through the GTPase Rho and PI3K. The cascade of phosphorylations converges in the nucleus,
21
with the translocation of the MAPKs, which will activate further targets. In the nucleus the protein kinase MSK1 is activated, which in turn phosphorylates numerous factors involved in the transcription such as histones, RAR receptors and their cofactors (Masi et al., 2015)
Figure 3 A) RA-mediated control mechanism of gene expression. RA mediated transcriptional activation B) RA mediated transcriptional repression (Cunningham & Duester, 2015).
3.1 Retinoic acid and spermatogenesis
In the testis, nuclear receptors and the enzymes involved in RA metabolism are widely expressed, so that the synthesis of RA seems to be a synergic process mediated by many cell types. ADH (alcohol dehydrogenase) 1 and 3 isoforms in Sertoli cells convert ROL into retinaldehyde; ADH4 in late spermatids catalizes the same reaction (Deltour et al., 1997; Molotkov et al., 2002). Retinaldehyde is converted in retinoic acid by ALDH1A (aldehyde dehydrogenase 1A) in Sertoli cells and by ALDH1A2 in germ cells
22
(Arnold et al., 2015). However, the main sources of RA seem to be Sertoli cells and pachytene spermatocytes (Endo et al., 2017). RA degradation is also important and is mainly controlled by peritubular cells which express three cytochrome P450 hydrolase CYP26A1, CYP26B1, CYP26C1 (Vernet et al., 2006 B), but also within the seminiferous tubules by Sertoli cells and germ cells which also express CYP26 enzymes (Hogarth et al., 2015 B). The critical role of retinoids in the spermatogenic process was strikingly demonstrated by the rodent model fed with Vitamin- A-deficient diet (VAD) (Wolbach & Howe, 1925). In VAD animals only Sertoli cells, undifferentiated spermatogonia and some preleptotene were left in the seminiferous epithelium. Then, when animals were injected with RA, a massive differentiation of Aal into
A1 spermatogonia was restored and the blocked spermatocytes could initiate meiosis (van Pelt & de Rooij, 1991).
RA pleiotropic functions could be summarized as follows: promotion of Sertoli cell maturation at puberty by suppressing proliferation; spermatogonial differentiation (van Pelt & de Rooij, 1991); induction of meiosis (Koubova et al., 2006); controlling blood-testis barrier (BTB) integrity (Morales & Cavicchia 2002); spermiation (Vernet et al., 2008); coordinating the adult spermatogenic cycle (Sugimoto et al., 2012; Endo et al., 2015). In particular, RARγ is the RAR isoform involved in spermatogonia differentiation and it is typically expressed in Aal spermatogonia.
RARγ ablation has demonstrated to not affect meiosis or spermiogenesis but to impair Aal transition into A1 (Gely-Pernot et al., 2012).
In germ cells, RA can promote meiotic progression by directly stimulating Stra8 transcription, which is a critical gene for meiosis, even if its function is still not clarified (Raverdeau et al., 2012). Because all the events triggered by RA occur in a synchronized fashion around stages VII-VIII, RA was thought to reach a peak in that stages. This hypothesis was demonstrated by Hogarth and colleagues that for the first time quantified RA local concentration in postnatal seminiferous epithelium of the testis (Figure 3 C). The Authors used a murine model in which spermatogenesis was disrupted through the administration of bisdichloroacetyldiamine (WIN18,446), a strong inhibitor of RALDH enzymes, and then
23
spermatogenesis was synchronized with a RA injection (Hogarth et
al., 2015 A).
Figure 3 C) Schematic representation of RA levels in relation to the stages of the seminiferous epithelium (modified by Hogarth et al., 2015 A)
A cyclical metabolism of RA during the cycle of the seminiferous epithelium is the basis for oscillating RA levels: in fact, in the first part of the cycle, storage of RA seems to be predominant; RA synthesis, catalyzed by RALDH enzymes, occurs at stages VII-XII ; RA degradation by CYP26 cytochromes takes place after spermatogonia differentiation, at stages VIII-XI (Vernet et al., 2006 B; Sugimoto et al., 2012). In particular, Hogarth and colleagues in 2015 underlined the stage-specific expression of two enzymes responsible for the reversible conversion of retinol into retinaldehyde, properly RDH10 (retinol dehydrogenase 10) and DHRS4 (dehydrogenase/reductase SDR family member 4) (Hogarth
24
In Sertoli cells, the most abundant isoform of retinoids nuclear receptors is RARα (Vernet et al., 2006 B). The importance of this receptor was attested by KO mice models, which are sterile (Lufkin
et al., 1993). Moreover, RARα deficient germ cells hardly colonize
a recipient testis (Doyle et al., 2007). On the contrary, RARβ, RARγ and RXRγ null mutants show a normal spermatogenesis (Lohnes et al., 1993; Luo et al., 1995; Krezel et al., 1996), RXRβ KO mice displayed defects in spermatids maturation and spermiation (Kastner et al., 1996), while the effect of RXRα absence has not been investigated because RXRα-/-animals die in
utero (Sukov et al., 1994; Kastner et al., 1994).
While the role of Vitamin A in rodents has been largely investigated, the role in human testis is still unknown. For this reason, a VAD study in nonhuman primates would be helpful to determine the effect of RA depletion in primate testis (Hogarth et
al., 2011).
Since the role of RA is crucial in rodents spermatogenesis, inhibition of the endogenous biosynthesis of this molecule has also been proposed as a contraceptive strategy in men, through the inhibition of ALDH1a2 enzymes by the pharmacological compound WIN 18, 446 (Heller et al., 1961). However, nowadays, an ideal molecule has still to be optimized to reversibly block spermatogenesis, without interfering with the metabolism of RA in other organs and without generating a disulfiram reaction (Hogarth
et al., 2011), which is a toxic reaction that causes a reddening of the
face when consuming alcohol, due to an incomplete metabolism of this molecule.
25
AIM
This study arises in the context of the research activity carried out in my laboratory, aimed for years at the study of SSC and its niche, both in mouse and in human.
GDNF is a crucial factor for the self-renewal of spermatogonial stem cells (SSCs) which, starting from puberty in the mammal, support the continued production of mature germ cells, spermatozoa (Meng et al., 2000). In both mouse and human, GDNF is produced and secreted by somatic Sertoli cells and peritubular myoid cells. Sertoli cells are the main contributors to the formation of SSCs niche, a highly specialized micro-environment in which SSC takes the so-called "fate decision" i.e. to undertake the differentiation process ("commitment") or to maintain the "stemness" (de Rooij, 2017). In this context, GDNF represents a molecule-paradigm for the understanding of the spermatogonial niche. In particular, we have shown that the production of GDNF in the seminiferous tubules is stage-specific and therefore in a given area of the seminiferous tubule its concentration varies cyclically (Grasso et
al., 2012). Later, we demonstrated that GDNF acts in vitro as a
chemoattractant for undifferentiated spermatogonia (Dovere et al., 2013). Since GDNF promotes SSC self-renewal, these data suggest that GDNF could facilitate the homing and maintenance of SSCs in their niche. The niche is influenced by paracrine factors released by different cell types in the testis and endocrine factors such as hormones of the hypothalamic-pituitary axis, which therefore control the process of spermatogenesis at several levels. We then cloned and characterized the murine gene promoter region for active GDNF in Sertoli cells. The TSS has been identified, several evolutionarily conserved transcription factor binding sites and three CRE sites (cAMP-responsive elements) demonstrating the direct involvement in FSH-dependent endocrine regulation (Lamberti & Vicini, 2014). In recent years, further mechanisms of regulation of GDNF expression have been highlighted that make it a finely regulated molecule (Garcia et al., 2017). An inhibition of RA-mediated GDNF levels was described by Saga and colleagues in 2013. Retinoic acid is an active metabolite of vitamin A with an
26
almost ubiquitous role in cell differentiation and embryonic development, as well as in the testis. Retinoic acid is fundamental for the differentiation of spermatogonia and, as GDNF, it is produced cyclically and in a stage-specific manner in the seminiferous tubules. GDNF levels are low in those stages of the seminiferous epithelium where retinoic acid levels are high and vice versa. This evidence suggests that in vivo GDNF and retinoic acid are antagonists in the regulation of the spermatogonial stem compartment. Because the molecular mechanism underlying this negative regulation is not described, in this thesis we have focused our attention on the molecular mechanism by which RA negatively affects the expression of GDNF. Primary cultures of Sertoli cells from immature mice (Vicini & Conti, 1997) and cultures of seminiferous tubules from adult mice were used as experimental models (Kotaja et al., 2004).
27
RESULTS
4. Retinoic acid down-regulates gdnf in immature testis
In order to confirm the evidence reported in the literature by Hasegawa (Hasegawa et al., 2013), which describes the down-regulation of gdnf mediated by retinoic acid in the mouse, we set up primary cultures of Sertoli cells, obtained from CD1 mice of 17 days, according to the protocol described by Vicini & Conti (Vicini & Conti, 1997).
Sertoli cells were treated for 24 hours in the presence of increasing concentrations of retinoic acid (RA) from 0,01 M to 10 M. Subsequently gdnf mRNA levels were evaluated by Real-Time PCR.
The results showed a negative modulation of the transcript in a dose-dependent manner with a significant effect at the concentration of 1 M RA (Figure 4 A).
Moreover, as an internal control of treatment efficacy, we in parallel evaluated by Real-Time PCR the induction of stra6 transcript, a well-known responsive gene of RA (Bouillet et al., 1997). We observed a dose-response increase of stra6 with maximum induction with 1 M RA, confirming the efficacy of retinoic acid treatment (Figure 4 B).
To evaluate if gdnf RA-dependent regulation was recapitulated in testis organ culture, 1 mm3 fragments of testicular tissue obtained from 17 day-old CD1 mice were cultured for 8 hours in presence of 1 or 10 M RA. Subsequently gdnf and stra6 mRNA levels were evaluated by Real-Time PCR. Gdnf resulted significantly down-modulated at both concentrations respect to untreated fragments (Figure 4 C) as well as stra6 mRNA that was induced with both treatments (Figure 4 D). Data suggest that the RA-mediated regulation of gdnf in Sertoli cells is still detectable in the immature organ culture.
Because GDNF is a soluble molecule, we then asked if also secreted levels were affected by RA. Therefore, GDNF protein levels in the conditioned media of Sertoli cells were quantified after 24 hours
28
exposure with 1 M RA or left untreated. The ELISA assay performed on three cultures, showed that in the presence of RA GDNF levels were lower compared to the control (Figure 4 E).
A
29
Figure 4 A) Histograms show the regulation of gdnf transcript after 24 hours treatment with increasing concentrations of retinoic acid (RA). mRNA levels were measured by Real-Time PCR, normalized on β-actin and expressed in fold change with respect to the control. Data are shown as mean ± SEM of 3 cultures. ** p <0.01 with Student-Newman-Keuls Method B) Histograms showing the regulation of stra6 transcript in the same conditions. Data are shown as mean ± SEM of 2 cultures. * p <0.05 ANOVA with Dunn's Method. C) Histograms show the regulation in murine testicular organ culture of gdnf transcript after 8 hours treatment with increasing concentrations of retinoic acid (RA). mRNA levels were measured by Real-Time PCR, normalized on β-actin and expressed in fold change
with respect to the control. Data are shown as mean ± SEM of 3 cultures. * p<0,05 *** p <0,001 with Student-Newman-Keuls Method. D) Histograms
show the regulation in murine testicular organ culture of stra6 transcript in the same conditions. Data are shown as mean ± SEM of 2 cultures. * p <0,05 **p <0,01 with Student-Newman-Keuls Method. E) The histogram shows the effect of
24 hours RA treatment on secreted GDNF protein in Sertoli cells conditioned medium. Data are presented as the mean ± standard error of the mean (SEM) from n= 3 cultures.
30
5. RA-dependent gdnf inhibition is quite rapid and does not involve neo-synthesis of a repressor
In order to deepen the kinetic of the RA action on gdnf mRNA, time-course analysis on RA-mediated regulation was performed on Sertoli cells.
Gdnf mRNA levels after RA treatment were evaluated by
Real-Time PCR at different time points: 20 minutes, 1 hour, 2, 4, 8, 16, 24 hours. A significant reduction of gdnf mRNA (40%) was appreciable not earlier than 2 hours and was maintained for 24 hours (Figure 5 A).
To evaluate whether the inhibition of gdnf depended on transcriptional stability or required protein synthesis, Sertoli cells were treated for 2 hours in the presence of actinomycin D, impinging ongoing transcription (actD, 5 μg / ml), or cycloheximide, a powerful inhibitor of protein synthesis (CHX, 10 μg / ml), with or without RA.
Interestingly, actD treatment alone induced a reduction of about 80% of gdnf mRNA levels compared to the control, indicating an extremely low stability of the mRNA and suggesting that active transcription is essential for gdnf mRNA half-life. On the contrary, RA and actD co-treatment did not give rise to further appreciable lowering of gdnf mRNA compared to actD per se.
In contrast, treatment with CHX increased mRNA levels, making plausible that the ongoing synthesis of a repressor controls basal
gdnf levels. However, in cells treated with CHX, RA was still able
to significantly inhibiting mRNA levels. This data suggests that RA mechanism of action on gdnf transcript does not require protein synthesis (Figure 5 B).
31
Figure 5 A) The histogram shows the effect of different time treatment with 1 uM RA on gdnf mRNA in primary cultures of murine Sertoli cells. The mRNA levels were quantified by Real-Time PCR, normalized on β-actin and expressed as mean ± SEM from 2 cultures and expressed in fold change compared to the untreated
control. *** p <0,001 with t-test 5 B) Histogram shows the regulation in Sertoli cells of gdnf transcript after 2 hours treatment with actinomycinD (actD) or cycloheximide (CHX) in the presence or absence of RA. The mRNA levels were quantified by Real-Time PCR, normalized on β-actin and expressed as mean ± SEM from 2 cultures and expressed in fold change compared to the untreated control. * p <0.05 with ANOVA (Dunn's Method) on Ranks.
32
6. RARα inhibition impinges gdnf down-regulation
To determine whether the down-regulation of gdnf involved the nuclear retinoic acid receptors RARs, Sertoli cells were treated with BMS-204493, inverse agonist inhibitor of all three RARs isoforms (RARα, RARβ and RARγ) (Raverdeau et al., 2012). Cells were pre-treated for 2 hours in the presence of 10 M BMS-204493, and thereafter, 1 M RA was added to the culture medium for 24 hours. At the end, gdnf mRNA levels were measured. Real-Time PCR results show the statistically significant reduction of gdnf levels after retinoic acid treatment compared to controls. Treatment with BMS-204493 alone did not modulate gdnf baseline levels but when retinoic acid was added, a significant down-regulation was no longer appreciable (Figure 6 A).
As an internal control of the effectiveness of the pharmacological inhibitor, the levels of stra6 mRNA were measured. The treatment with BMS-204493 negatively affects basal levels of stra6 and significantly blocks the induction of stra6 by RA (Figure 6 B) Since RARα is the most expressed isoform in Sertoli cells (Vernet
et al., 2006 B), we investigated the involvement of this specific
isoform, treating Sertoli cells in the presence of RO41-5253, a selective pharmacological antagonist of RARα (Ertesvag et al., 2007). Cells were pre-treated for 2 hours with 3,5 M RO41-5253, and then 1 M RA was added to the culture medium for the next 24 hours, then the levels of gdnf and stra6 were analyzed by Real-Time PCR. In the presence of RO41-5253, the inhibitory effect of RA on
gdnf mRNA was reversed, while the basal levels were not affected
(Figure 6 C). Regarding stra6 mRNA, both basal and induced levels were strongly reduced (Figure 6 D). These data suggest that the effect of RA on gdnf expression depends on the RARα nuclear receptor activity.
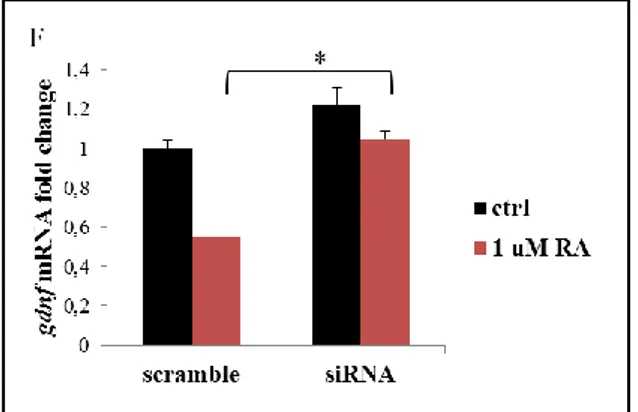
We then examined the effect of RARα ablation performed by RNA interference (RNAi) using small interfering RNA (siRNA) against RAR mRNA. Sertoli cells were transfected for 5 hours with 250 picomoles / well anti RAR siRNA or with a scrambled siRNA, conveyed by 5 l / well Lipofectamine2000. At the end, cells were
33
treated for 24 hours in the presence or absence of 1 M RA and levels of gdnf were measured by Real-Time PCR.
The administration of anti RAR siRNA lowered RAR mRNA levels by around 70% respect to the scramble sequence (Figure 6 E). As expected, RA was able to down-regulate gdnf mRNA in Sertoli cells transfected with the scramble RNA. Conversely, in cells where RAR was interfered, RA did not lower gdnf levels (Figure 6 F). This approach confirmed the RAR involvement in
gdnf regulation and strengthened previous conclusions obtained
35
Figure 6 Effect of treatment with BMS-204493 on the levels of gdnf mRNA A) and stra6 B) in the presence or absence of RA. A) Data are represented as mean ± SEM from 4 cultures * P <0,05 with Dunn's Method. B) Data are represented as mean ± SEM from 3 cultures * p <0,05 with Dunn's Method.
Effect of the treatment of Sertoli cells with 3,5 M RO41-5253 for 24 hours on the levels of gdnf C) and stra6 D) in the presence or absence of RA, measured by Real- Time PCR. Data are represented as mean ± SEM from 3 cultures. C) *p <0,05 *** p <0,001 with All Pairwise Multiple Comparison Procedures Tukey Test) D) * p <0,05 with All Pairwise Multiple Comparison Procedures ( Tukey Test) on Ranks.
E) Effect of the anti-RARα siRNA on rarα transcript F) Effect of the treatment with scramble or anti-RARα siRNA on gdnf levels in the presence or absence of RA, measured by Real- Time PCR. Data are represented as mean ± SEM from 2 cultures * P <0,05 with Dunn's Method.
36
7. Gdnf regulation depends on its promoter
We asked, therefore, whether the action of RA on gdnf mRNA levels involved the 5'-flanking regulatory region of the gene. To clarify the role of the promoter in the regulation of gdnf, we investigated the activity of the promoter by luciferase assays.
Sertoli cells were transiently transfected with a plasmid vector containing the 5'-flanking region of the gene Gdnf (-1857 / + 109) upstream of the luciferase gene (Lamberti & Vicini, 2014) and treated in the presence or absence of 1 M RA for 24 hours. At the end of the treatment, luciferase activity was measured in cell extracts. The activity is expressed as RLU (Relative Light Units) corrected for g of proteins. Retinoic acid reduces of about 40% of the luciferase activity compared to the control. These results indicate that the 5'-flanking region of the gene (-1857 / + 109) contains gene sequences implicated in the negative regulation of the levels of mRNA exerted by RA (Figure 7).
Since the presence of a Retinoic Acid Responsive Element on the 5'-flanking of the murine Gdnf gene is not known from the literature, we performed an in-silico analysis using the Softberry software, detecting the presence of a RARE DR5 5'-TGACCTCTCCCTGATCA-3‟ sequence on the murine Gdnf promoter (mus musculus), just upstream of the 3 CRE regions (Cyclic AMP Responsive Element) evolutionarily conserved in mouse, rat and man, previously identified by our group (Lamberti & Vicini, 2014). In order to demonstrate the involvement of this region, we performed a site-specific mutation of the DR5 in the genomic fragment (-1857 / + 109). With this mutated construct we transfected cells and measured luciferase activity, in the presence or absence of RA. The results show that the mutation of the putative DR5 binding site reverts the inhibition of RA treatment on luciferase activity (Figure 7 B). This suggests that the DR5 sequence identified in-silico is critical in RA mediated regulation confirming the involvement of RAR nuclear receptors (Figure 7 C) .
38
Figure 7 A) Schematic representation of the GDNF promoter with the RARE putative site (modified by Lamberti & Vicini,, 2014) B) Effect of treatment with retinoic acid on the luciferase activity carried by wild-type and mut-DR5 RARE constructs transiently transfected in Sertoli murine cells. Luciferase activity was
39
expressed as Relative Light Units (RLU) and normalized for micrograms of cell lysates proteins. In the graph, the histograms show a representative experiment expressed as mean± SD. C) Schematic representation of the GDNF promoter with the RARE putative site (modified by Lamberti et al., 2014)
8. RAR binds on Gdnf promoter
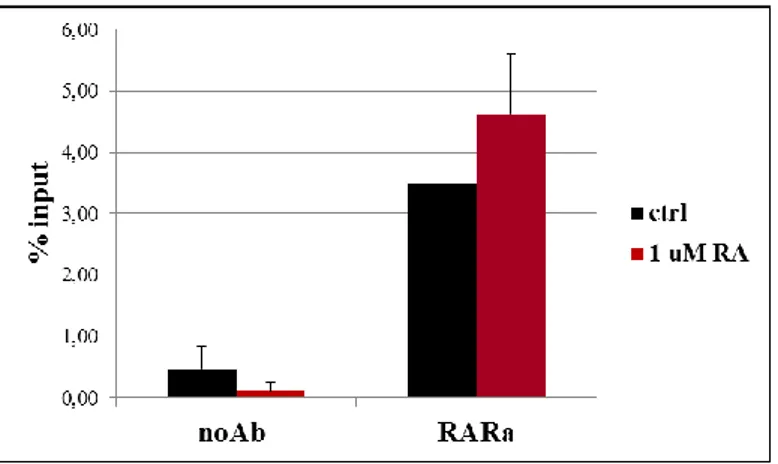
To directly demonstrate RAR occupancy on the putative DR5 RARE, we performed ChIP-qPCR experiments.
Sertoli cells were cultured with or without RA for 2 hours, and the enrichment mediated by the RAR antibody was measured to evaluate the recruitment at the DR5 RARE (Figure 8). The results demonstrate that both in basal and RA treatment conditions RAR occupy the DR5 RARE.
Figure 8) Real-time PCR amplification of the promoter region of Gdnf in the
DNA derived from Sertoli cells untreated or treated with 1 M RA for 2 hours, immune-precipitated using the RAR antibodies or with beads without antibody as negative control (noAb). Data are reported as increase relative to the percentage of input.
40
9. RA-dependent gdnf inhibition is prevented by HDACi
The RA classical genomic effect on target genes transcription is more often stimulatory. In the few documented cases of direct genomic repressive action mediated by RA, recruitment of HDACs enzymes seems to be involved (Cunningham & Duester, 2015). We then tested the hypothesis of the involvement of this class of enzymes in RA mechanism of action on the Gdnf gene. To this purpose, we tested the effect of two different inhibitors of class I and II histone deacetylases (HDACs), SAHA and Valproic acid (VPA) (Dokmanovic et al., 2007).
Sertoli cells were treated for 2 hour with 1,25 M SAHA or 1 mM VPA in the presence or absence of 1 M RA. The expression of the transcript of gdnf was analyzed by Real-Time PCR.
The treatment with SAHA significantly reversed the RA-mediated inhibitory effect on gdnf (Figure 9 A). The treatment with VPA also had the effect to inhibit gdnf basal levels and the inhibitory effect of RA was no longer appreciable (Figure 9 B). These data suggested that histone deacetylases could be involved in this regulation.
41
Figure 9) Effect of HDACi on the transcription levels of gdnf, in the presence or absence of RA, measured by Real-Time PCR. A) Effect of SAHA and B) Valproic Acid administration .
Values are expressed as mean ± SEM of 3 independent experiments * p <0.05 with Dunn's Method.
42
10. RA-dependent gdnf inhibition is based on promoter de- acetylation
The previously obtained results suggest the presence of an epigenetic mechanism at the base of the RA negative regulation on the Gdnf promoter.
To directly verify this hypothesis, we performed ChIP-qPCR experiments to evaluate the acetylation levels of histone H4 in a 105 bp region straddling the transcriptional start site 1 (TSS1) of the Gdnf promoter, in the presence or absence of RA.
Sertoli cells were cultured with or without RA for 2 hours, and at the end the enrichment mediated by the anti-H4 acetylated antibody (H4Ac) was measured to evaluate the acetylation status of a promoter fragment around the 105 bp long (Figure 10). The results demonstrate that RA treatment induces a significant reduction of histone H4 acetylation levels in the region around the TSS1, suggesting that the RA-mediated negative regulation is based on epigenetic mechanisms.
Figure 10 Real-time PCR amplification of the promoter region of Gdnf in the DNA derived from Sertoli cells untreated or treated with 1 M RA for 2 hours, immune-precipitated using the anti-H4-Ac antibodies or with beads without antibody as negative control (noAb). Data are reported as increase relative to the percentage of input.
43
11. gdnf RA-mediated regulation is conserved in adult mouse and is stage-dependent
To assess whether RA-mediated gdnf regulation was conserved in the sexually mature mouse, and since it is impossible to obtain pure Sertoli cultures from the adult testis, we cultured for 8 hours 1 mm3 fragments of testicular tissue obtained from 3 month old mice in presence of 1 or 10 M RA. Subsequently gdnf and stra6 mRNA levels were evaluated by Real-Time PCR. However, in those culture conditions, neither of the two RA concentrations lowered gdnf mRNA levels (Figure 11 A) or significantly affected stra6 mRNA (Figure 11 B).
Because in adult testis the concomitant presence of multiple germ cell associations and cellular subtypes could hide a subtle gene regulation, we decided to put in culture isolated and staged seminiferous tubules from 3 month old CD1 mice. Seminiferous tubules were divided into three groups of stages (stages II-VI, VII-VIII and IX-XI) and for each group 3 cm total length were isolated. Tubules were kept in culture for 4 hours, in the presence or absence of 1 M RA, and mRNA levels assessed by Real-Time PCR. In line with data already published by our laboratory, the gdnf baseline levels were found oscillating, high in stages II-VI, and lowered in stages VII-VIII and IX-XI (Grasso et al., 2012). The negative regulation mediated by RA was significant detected only in stages II-VI (Figure 11 C). We measured stra6 levels which were also showily stage-dependent, lower at stages II-VI and IX-XI and very high at stages VII-VIII. Again, RA stimulation induced stra6 expression only in stages II-VI (Figure 11 D). These data suggest that the RA-mediated regulation of gdnf and stra6 transcripts are detectable in isolated seminiferous tubules from adult testis.
45
Figure 11) Histograms show the regulation in murine testicular organ culture of
gdnf transcript A), and stra6 transcript B) after 8 hours treatment with 1 or 10 RA. mRNA levels were measured by Real-Time PCR, normalized on β-actin and expressed in fold change with respect to the control.
Expression of gdnf C) stra6 D) in staged seminiferous tubules cultured for 4 hours in the presence or absence of RA. The mRNA levels were evaluated by Real-Time PCR , normalized on β-actin levels and expressed as fold changes on the II-VI stage controls. Data are represented as means ± SEM of three experiments. The statistical analysis used the T test to compare the RA treatment with respect to its control, for each group of stages. * p <0.05 ** p <0.01
12. RA could act as an indirect regulator of gdnf
We then asked if RA could exert an indirect effect on gdnf cyclical regulation in the seminiferous epithelium. Because the expression profile of gdnf during the cycle of the seminiferous epithelium parallels the profile of the FSH response in rat, which is high in stages XIII–V and decreases subsequently (Parvinen et al., 1980; Parvinen, 1982), we asked if the variations in FSH response, which contributes to gdnf levels oscillations, were linked to RA. With this aim, we examined FSH receptor (fshR) mRNA expression in primary Sertoli cells (Figure 12 A) treated for 24 hours with RA, and we found lowered FshR mRNA levels. Then, we evaluated the same effect on staged seminiferous tubules, with or without 4 hours
46
1 M RA stimulation. We found that fshR basal levels higher at stages II-VI and lower at VII-VIII and IX-XI stages, confirming similar evidences in literature (Heckert & Griswold, 1993) and that the addiction of 1 M RA significantly reduced fshR mRNA at stages II-VI but not in other stages.
Figure 12 A) Effect of 24 hours treatment with 1 uM RA on fshR mRNA in primary Sertoli cells. Data are expressed as mean ± SEM of two cultures and The mRNA levels were evaluated by Real-Time PCR, normalized on β-actin levels and expressed as fold change on the untreated. The statistical analysis used the T test to compare the RA treatment with respect to its control **p<0.01 B) Expression of fshR in staged seminiferous tubules cultured for 4 hours in the presence or absence of RA. The mRNA levels were evaluated by Real-Time PCR, normalized on β-actin levels and expressed as fold change on the II-VI stage controls. Data are represented as means ± SEM of three experiments. The statistical analysis
47
used the T test to compare the RA treatment with respect to its control, for each group of stages. *** p <0.001
13. Gdnf RA-dependent regulation in human testis
We next asked whether RA could be a regulator of gdnf also in human testis.
With this aim, we prepared human testicular organ cultures according to the “hanging drop” protocol (Jørgensen et al., 2014). Fragments from testicular biopsies obtained from heart-beating organ donors (19y-85y) were cultured for 8 hours in αMEM medium containing 1 or 10 M RA.
Sertoli cell responsivity to RA was assessed measuring stra6 induction by Real-Time PCR. Stra6 was found up-regulated in a significant manner at 1 M RA (Figure 13 A and B).
Overall, gdnf expression was not affected by RA treatment at both 1 and 10 M (Figure 13 C). However, analysis of single donors revealed that a negative trend was appreciable in 6 out of 10 donors while 4 donors exhibited an opposite behavior with a strong up-regulation of gdnf (Figure 13 D). Taken together these results, indicate that RA-mediated gdnf regulation in human testis is heterogeneous.
49
Figure 13 The graphs show boxplot (A, C) or single donors behavior (B, D) about the expression of stra6 (A, B) and gdnf mRNA (C, D) in human testicular hanging drop cultures. The mRNA levels were evaluated by Real-Time PCR, normalized on rps29 mRNA levels and expressed as fold change on the controls. Data are represented as medians ± SEM. *p<0.05 with Dunn’s Method.