UNIVERSITA’ DEGLI STUDI DI VERONA
Dipartimento di Scienze Biomediche e Chirurgiche
Scuola di Dottorato in Scienze della Vita e della Salute
Corso di Dottorato in Scienze Mediche Cliniche e Sperimentali
CICLO XXII
TITOLO DELLA TESI DI DOTTORATO
Influence of genetic factors in newly diagnosed type 2 diabetic
patients: the TCF7L2 and GENETIC LOAD studies.
S.S.D. MED/13
Coordinatore: Prof. Corrado Vassanelli
Tutor: Prof. Enzo Bonora
Prof. Riccardo Bonadonna
Index
ABSTRACT ... - 1 -
ABSTRACT ... - 3 -
INTRODUCTION ... - 6 -
PATHOPHYSIOLOGY OF TYPE 2 DIABETES MELLITUS.... - 8 -
β-cell function and insulin action. ... - 8 -
Biphasic insulin secretion ... - 10 -
Insulin action. ... - 11 -
- Insulin and carbohydrate metabolism ... - 11 -
- Insulin and lipid metabolism. ... - 11 -
Beta-cell function in T2DM. ... - 12 -
Insulin sensitivity... - 13 -
GENETIC FACTORS INVOLVED IN TYPE 2 DIABETES.... - 17 -
Linkage analysis. ... - 17 -
Candidate gene approach. ... - 18 -
GWAS (Genome Wide Association Scan)... - 19 -
TCF7L2... - 23 -
“GENETIC LOAD”... - 27 -
PATIENTS AND METHODS ... - 30 -
Patients.... - 30 -
Verona Newly Diagnosed Type 2 Diabetes Study... - 30 -
Analytical procedures ... - 31 -
Calculations ... - 32 -
Modeling of Beta-Cell Function... - 32 -
Genotyping.... - 34 -
RFLP-PCR (Restrinction Fragment Length Polymorphism – Polymerase Chain Reaction) ... - 34 -
SNAPSHOT METHOD (ABI Prism Genetic Analyzer 310) ... - 35 -
TAQMAN. ... - 37 -
Statistical analysis.... - 38 -
TCF7L2: RESULTS ... - 41 -
Clinical Features of the Study Population... - 41 -
Effects of TCF7L2 Haplotypes... - 44 -
TCF7L2: DISCUSSION... - 47 -
GENETIC LOAD: RESULTS ... - 52 -
Effects of genetic load on clinical and phatophysiological T2DM phenotypes.. - 53 -
GENETIC LOAD: DISCUSSION... - 55 -
CONCLUSIONS... - 58 -
APPENDIX ... - 60 -
ABSTRACT
Background. Genome wide association studies (GWAS) have played a primary
role in demonstrating that genetic variation in a number of loci, as assessed by single nucleotide polymorphisms (SNPs), affects the risk of type 2 diabetes mellitus (T2DM). Among these, rs7903146, an intronic variant of the TCF7L2 (Transcription Factor 7 Like 2) gene, is possibly the strongest known genetic risk factor for T2DM (O.R.=1.37). Each risk variant, however, per se contributes quantitatively little to the overall risk and is often of questionable biological significance in affecting the determinants of glucose regulation.
Aim(s). To elucidate the effects of several T2DM risk genetic loci on clinical and
pathophysiological (beta-cell function and insulin sensitivity) phenotypes of patients with newly diagnosed T2DM.
Methods. We studied 464 patients of Italian ancestry with newly diagnosed,
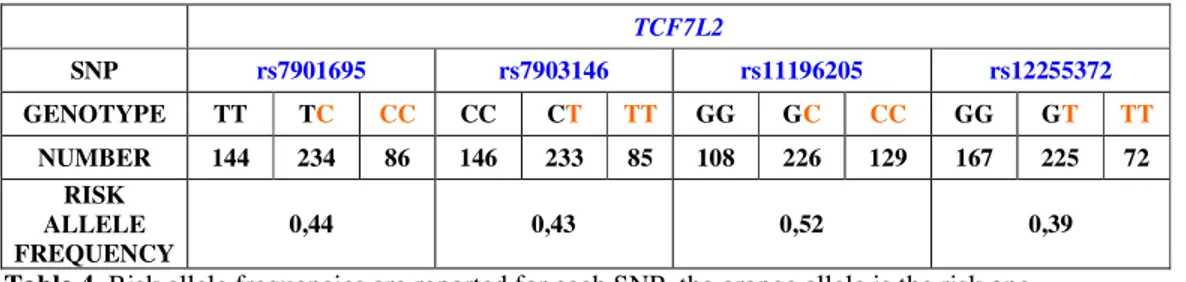
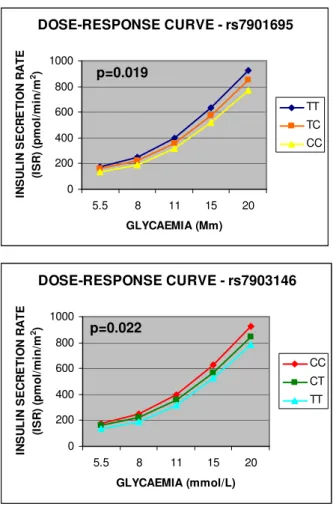
GAD-antibody negative, type 2 diabetes mellitus. Standard clinical phenotyping was carried out by classical methods. Beta-cell function and insulin sensitivity were assessed by mathematical modeling of glucose and C-peptide curves during a 240’ frequently sampled OGTT and by euglycemic insulin clamp, respectively. Beta-cell function is described as the sum of two components: i. first phase of insulin secretion or derivative control (DC), presented as the pulse secretory response to a unit rate of change in glucose concentration; ii. second phase of insulin secretion or proportional control (PC), presented as the insulin secretion rate at glucose concentrations of 5.5, 8.0, 11.0, 15.0 and 20.0 mM, respectively. Insulin sensitivity is presented as the amount of glucose infused which is metabolized in the last 60’ of the euglycemic clamp (M value). The following SNPs (related gene in brackets), already known to be risk loci of T2DM, were genotyped: rs7901695 (TCF7L2), rs7903146 (TCF7L2), rs11196205 (TCF7L2), rs12255372 (TCF7L2), rs679931 (CACNA1E), rs1801282 (PPARG), rs1044498 (ENPP1), rs10946398 (CDKAL1), rs1111875 (HHEX/IDE) rs10010131 (WFS1), rs4430796 (TCF2), rs4402960 (IGF2BP2).
Results.
TCF7L2. The risk alleles of 3 (rs7901695, rs7903146, rs11196205) out of
4 TCF7L2 SNPs were associated with higher fasting plasma glucose (p<0.01, p<0.03 and p<0.01 respectively). The risk alleles of the first two SNPs
(rs7901695, rs7903146) were associated to a decrease in the proportional control of beta-cell function (p<0.02 and p<0.03 respectively). Four TCF7L2 haplotypes were detected, two of which (haplo4, frequency: 0.038; and haplo9, frequency: 0.086) had a strong impact on beta-cell function. Haplo4 was associated with the lowest proportional control of beta-cell function while haplo9 showed the highest.
Other genetic variants. None of the 8 remaining SNPs (rs679931,
rs1801282, rs1044498, rs10946398, rs1111875, rs10010131, rs4430796, rs4402960) showed any significant independent association with insulin sensitivity or beta-cell function. We computed a genetic risk score of this variants, by summing the number of the T2DM risk alleles present in each patient (excluding TCF7L2). The patients were divided into three groups: 6 or less risk alleles (group A, n=76), 7-9 risk alleles (group B, n=226), 10 or more risk alleles (group C, n=69). The porportional control of beta-cell function was significantly impaired (P=0.05) in group C than in the other two groups, i.e. the higher the number of T2DM risk variants the lower beta cell function.
Conclusions. These data show that several genetic variants play a significant role
in determining the pathophysiological phenotype of patients with newly diagnosed type 2 diabetes, with most of the influence exerted on beta-cell function. Thus, assessment of T2DM risk genotype may turn to be useful for diagnostic, prognostic and therapeutic purposes in patients with newly diagnosed T2DM.
ABSTRACT
Introduzione. Negli ultimi anni sono stati individuati molti nuovi polimorfismi
(SNP, Single Nucleotide Polymorphisms) associati allo sviluppo di diabete di tipo 2 (T2DM), soprattutto grazie all’avvento di nuove tecniche di genotipizzazione su larga scala, GWAS (Genome Wide Association Scan).
Ogni SNP però contribuisce da solo in modo marginale al rischio di sviluppare la malattia e spesso è poco chiara la funzione biologica di queste varianti geniche nella regolazione dell’omeostasi del glucosio. Tra questi polimorfismi, la variante intronica rs7903146 del gene TCF7L2 (Transcription Factor 7 Like 2) è al momento il più forte fattore di rischio per il diabete di tipo 2 (O.R.= 1.37).
Scopo dello studio. Chiarire l’effetto di diversi loci associati allo sviluppo di
T2DM su fenotipi clinici e patofisiologici (funzione beta-cellulare e sensibilità insulinica) in pazienti con T2DM neo-diagnosticato.
Metodi. Abbiamo analizzato 464 pazienti di discendenza italiana con T2DM
neo-diagnosticato, anti-GAD negativi. La caratterizzazione clinica standard è stata effettuata mediante metodi classici.
La funzione beta-cellulare è stata valutata applicando un modello matematico alle curve di glucosio e di C-peptide derivanti da prelievi eseguiti durante OGTT, ed è differenziabile in due componenti: prima fase di secrezione insulinica o controllo derivativo, rappresentato dalla quantità di insulina secreta in risposta all’incremento unitario della concentrazione di glucosio, e la seconda fase di secrezione o controllo proporzionale, rappresentato come la velocità di secrezione insulinica a concentrazioni crescenti di glucosio (5.5, 8.0, 11.0, 15.0 and 20.0 mM ). La misura della sensibilità insulinica deriva dalla quantità di glucosio infuso che viene metabolizzato negli ultimi 60 minuti del clamp euglicemica, tale valore è detto M.
Sono stati genotipizzati i seguenti SNP, già visti essere associati allo sviluppo di T2DM: rs7901695 (TCF7L2), rs7903146 (TCF7L2), rs11196205 (TCF7L2), rs12255372 (TCF7L2), rs679931 (CACNA1E), rs1801282 (PPARG), rs1044498 (ENPP1), rs10946398 (CDKAL1), rs1111875 (HHEX/IDE) rs10010131 (WFS1), rs4430796 (TCF2), rs4402960 (IGF2BP2).
Risultati.
TCF7L2. Gli alleli di rischio di 3 su 4 polimorfismi di TCF7L2
(rs7901695, rs7903146, rs11196205) sono associati a più alti valori plasmatici di glucosio a digiuno (p<0.001, p<0.03 e p<0.01 rispettivamente). Gli allele di rischio dei primi due SNP (rs7901695 e rs7903146) sono associati ad un aumento del controllo proporzionale della funzione beta cellulare (p<0.02 e p<0.03 rispettivamente). Tramite l’analisi degli aplotipi sono stati individuati 4 aplotipi rappresentati nella popolazione in esame e due di questi (haplo4, frequenza: 0.038 e haplo9, frequenza: 0.086) hanno un forte impatto sulla funzione beta-cellulare.
Altre varianti geniche. Nessuno dei rimanenti 8 polimorfismi (rs679931,
rs1801282, rs1044498, rs10946398, rs1111875, rs10010131, rs4430796, rs4402960) ha mostrato associazione indipendente con alterazioni della funzione beta-cellulare o della sensibilità insulinica. Abbiamo calcolato uno score genetico di queste varianti sommando il numero di alleli di rischio presenti in ogni paziente (escludendo TCF7L2). I pazienti sono stati divisi in tre gruppi: portatori di un numero di alleli di rischio ≤ 6 (gruppo A, n=76), pazienti con un numero di alleli di rischio compresa tra 7 e 9 (gruppo B, n=226) e soggetti con un numero di alleli di rischio ≥ 10 (gruppo C, n=69). Il controllo proporzionale della funzione beta-cellulare risultava alterato in modo statisticamente significativo (p=0.05) nel gruppo C rispetto agli altri due gruppi. Maggiore è il numero di alleli di rischio associato a T2DM, peggiore è la funzione beta-cellulare.
Conclusioni. Questi dati mostrano come diverse varianti geniche giocano un
ruolo significativo nel determinare il fenotipo patofisiologico dei pazienti con T2DM neo-diagnosticato, influenzando soprattutto la funzione beta-cellulare. Perciò, la valutazione dei genotipi di rischio per il T2DM potrebbe tornare utile per scopi diagnostici, prognostici e terapeutici in pazienti con T2DM neo-diagnosticato.
INTRODUCTION
Diabetes mellitus affects approximately 200 million people around the world and it is forecasted that by 2025 this number would be doubled. Because of its widespread distribution and increasing prevalence in modern society, great efforts have been made to understand the underlying causes of the disease.
Approximately 95-98% of patients with diabetes mellitus are affected by either type 1 (3-7%) or type 2 diabetes (T1DM and T2DM respectively). By definition, they are both characterised by raised plasma glucose levels.
Normal glucose homeostasis depends on the balance between glucose production by the liver and glucose absorption by the gut, on one side, and glucose uptake by the brain, kidney, liver itself, muscle, and adipose tissue, on the other side. Insulin, the predominant anabolic hormone involved, increases the uptake of glucose from the blood, enhances its conversion to glycogen and triglycerides, and also increases glucose oxidation. Plasma glucose levels are normally kept within a small range (4 to 6 mmol/l) by multiple mechanisms. After a meal, a small increase in plasma glucose will lead to an increased insulin secretion by the pancreatic β-cells. This is associated with a decrease in glucose production by the liver and enhanced glucose uptake in muscle and adipose tissue. These actions result from a combination of short term rapid effects and longer term slow effects, which involve changes in gene transcription and in the rate of translation of enzymes involved in glycogen synthesis, the glycolytic pathway, and lipid metabolism. There are a number of glucose counterregulatory hormones, the main one is glucagon, and the balance between the insulin action and the effects of the counterregulatory hormones ensures normal glucose homeostasis.
Both type 1 and type 2 diabetes mellitus show a familial predisposition, which is a strong indication for the involvement of genes in people’s susceptibility to the disease. However, the aetiology underlying types 1 and 2 is different and different genes are likely to be involved in each type of diabetes mellitus.
As the major cause of Type 1 diabetes mellitus is the autoimmune destruction of the pancreatic β cells, this form of diabetes usually appears or is first diagnosed in young people and was known as “juvenile diabetes”. Type 2 diabetes, which accounts for around 90% of all cases of diabetes mellitus, usually develops after
the age of 40, and it was referred to as "adult onset diabetes mellitus". Unlike Type 1, Type 2 diabetes is not caused by autoimmune destruction of the pancreatic β-cells, but appears to be caused by a number of different defects in both insulin action and insulin secretion.
There are many long term complications associated to diabetes mellitus, generally divided into micro- and macrovascular complications. These long term chronic complications have a severe impact on health and quality of life of patients and represent a quite important problem for the entire society. Microvascular complications include retinopathy, neuropathy, and nephropathy, with type 2 diabetes mellitus being one of the main causes of blindness, lower limb amputations, and renal failure in adults. As to macrovascular complications, suffice it to say that type 2 diabetes mellitus is a major risk factor for cardiovascular morbidity and mortality. These chronic complications have a high socioeconomic cost and put a heavy burden on public health services [1].
Since type 2 diabetes mellitus (T2DM) is a complex disease, both environmental and genetic factors are involved in the development of the disease. Environmental factors of particular importance include overweight/obesity, increased amount of body fat, hypertension, dyslipidemia, lack of physical exercise. Regarding the genetic factors, there is ample evidence that T2DM has a strong genetic component, as long appreciated by physicians because of the role as risk indicators of family history of diabetes and of ethnicity.
Despite strenuous efforts over the past two decades to identify the genetic variants that contribute to individual differences in predisposition to T2DM, slow progress and limited success have been obtained until recently. Two different methods have been used to discover genes that are related to a disease: analysis of genomic regions shared by relatives more often than expected (so called linkage analysis using polymorphic markers such as microsatellites or tandem repeats) and candidate gene studies, particularly by attempts to correlate biological variation (phenotype) with variation in DNA sequences (genotype) in the form of a single nucleotide polymorphism (SNP) [2]. The advent of genome-wide association (GWA) analysis has allowed researchers to uncover variants influencing complex, common phenotypes – including T2DM – and has resulted in the identification of a growing number of trait susceptibility loci [3].
PATHOPHYSIOLOGY OF TYPE 2 DIABETES MELLITUS.
The main pathophysiologic factors in type 2 diabetes are defects in both β cell function and insulin sensitivity.
β-cell function and insulin action.
Insulin is produced by β-cells located in the pancreatic islets. A human pancreas contains ~1 million pancreatic islets that are distributed throughout the exocrine parenchyma of the gland. Every pancreatic islet contains ~1,000 endocrine cells of which 75% are insulin-producing β-cells. Insulin is synthesised as pro-insulin in the endoplasmic reticulum and is processed to the biologically active form inside the secretory granules. The granules are small membrane-bound secretory granules with a diameter of ~0.35 µm. Insulin can be stored within the granules for several days prior to its release. Within the granules, insulin is present as a Zn2+-insulin crystal, the stability of which depends on an acidic intragranular pH. Upon fusion of the secretory granule with the plasma membrane, the pH within the granule equilibrates with that in the exterior resulting in the dissolution of the crystal and the liberation of insulin. The β-cells receive a rich vascular supply which empties into the portal vein and the liver is the first organ to be exposed to the newly-released insulin.
The β-cell is electrically excitable and uses changes in membrane potential to couple variations in blood glucose to changes in insulin secretion. Stimulation-secretion coupling in β-cells is different from other cell types because, instead of being mediated by receptor binding, glucose needs to be transported (GLUT2-glucose transporter 2) into the cytoplasm and metabolized to stimulate exocytosis. The β-cell contains many different ion channel proteins (each present in 100– 5,000 copies per β-cell) but two types of ion channels are particularly important for the initiation of insulin secretion, KATP-channels and Ca2+-channels.
The Kir6.2-SUR1 complex, now known as the KATP channel, acts as a regulated K+channel, binding ATP. KATP-channels are active at low glucose concentrations, presumably because of the high intracellular ADP levels, which stimulate channel activity. During fasting, basal glucose levels are ~4-5 mM, and the β-cell membrane is polarized at resting potential. The resting potential in β-cells is mainly due to the activity of ATP-sensitive potassium (KATP) channels and an
electrogenic Na+-K+-ATPase pump that preserves the cationic gradient. When glucose is low or absent in the extracellular medium, the resting potential of isolated β-cells is around -70 to -80 mV.
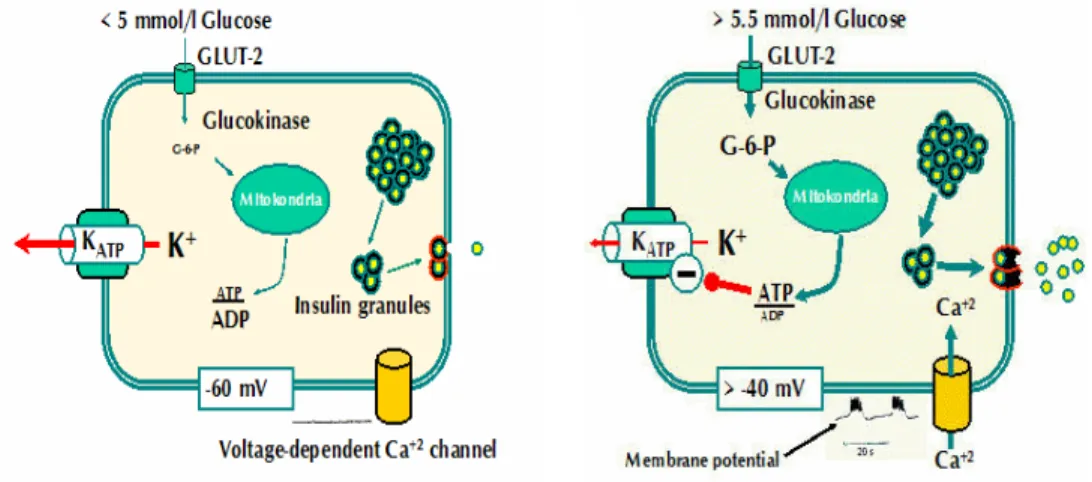
It is well accepted that when glucose concentration rises a first phase of coupling is observed, where glucose enters the cell and is metabolized, leading to a rise in the ratio of ATP to ADP and closure of KATP channels. These channels act as metabolic sensors, because they close in response to changes in the nucleotide concentration (ATP/ADP) that result from glucose metabolism. KATP closure initiates a slow depolarization of the membrane potential that, when it reaches around -40 mV, increases the open probability of Na+ and Ca2+ voltage-dependent channels, increasing Na+ and Ca2+ entry into the cells and causing further depolarization. Around -20 mV, high-voltage Ca2+-dependent channels open, and this leads to a larger increase in [Ca2+]i and subsequent insulin exocytosis (Fig. 1).
Fig. 1 At low glucose concentrations, ATP-sensitive potassium (KATP) channels are open and are responsible for the membrane potential. At high glucose concentration KATP channels are close and calcium arises inside the cell, causing membrane depolarization and consequently insulin release from the granules.
Biphasic insulin secretion
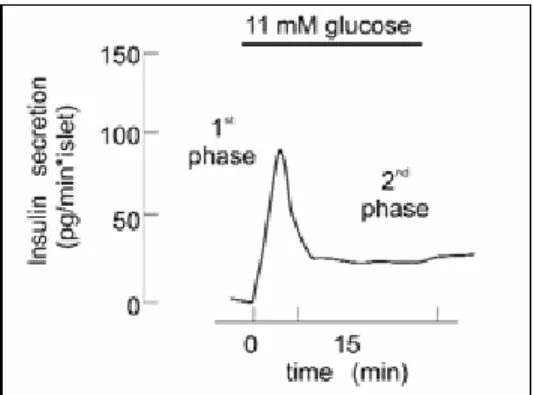
Insulin secretion in response to changes in extracellular glucose concentrations is biphasic both in vitro (Fig.2) and in vivo.
The first phase results from exocytose of granules from the "Readily Released Pool” (RRP). This glucose-induced first-phase insulin release is considered to be due to the fact that the KATP channel–dependent elevation of [Ca2+]ic (intracellular) promotes fusion of the β-granules already in the RRP. This phase of insulin secretion accounts for only about 5-10% of the total released after a meal. The second phase, characterized by a gradual increase of insulin release following the initial peak, requires ATP and leads to the movement of the granules from the Reserve Pool (RP) to the RRP. β-granules in the cell do not constitute a uniform population. A majority of them remain inside the cell and cannot immediately be releasable, thus forming a reserve pool, whereas a small portion of them constitute the RRP, which is available for immediate secretion. This slow phase is the major contributor to insulin release. Maximal quantities of insulin are released after about 60 minutes.
Upon elevation of extracellular glucose, Ca2+-induced fusion of granules already in the RRP occurs within minutes, and expansion and/or replenishment of the RRP from the RP is in progress several minutes later [4].
Fig. 2 Profile of glucose-induced insulin secretion. Glucose was elevated to 11 mM as indicated
Insulin action.
After being secreted by the pancreas, insulin is released in to the bloodstream, it is delivered to its target cells throughout the body, and it binds to specific receptors to elicit insulin-dependent biological responses.
The insulin receptor is a tyrosine kinase. It functions as an enzyme that transfers phosphate groups from ATP to tyrosine residues on intracellular target proteins. Binding of insulin to the alpha subunits of the receptor causes the beta subunits to phosphorylate themselves (autophosphorylation), thus activating the catalytic activity of the receptor. The activated receptor then phosphorylates a number of intracellular proteins, which in turn alter their activity, thereby generating a biological response.
- Insulin and carbohydrate metabolism
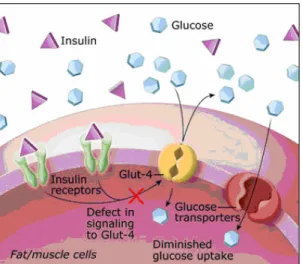
Insulin facilitates entry of glucose into muscle, adipose and several other tissues. When insulin concentrations are low, the glucose transporters GLUT4 are located in cytoplasmic vesicles, where they are useless for transporting glucose. Binding of insulin to receptors on such cells leads rapidly to fusion of those vesicles with the plasma membrane and insertion of the glucose transporters, thereby giving the cell an ability to efficiently take up glucose, which can be used as a source of energy for the cells. When blood levels of insulin decrease and insulin receptors are no longer occupied, the glucose transporters are recycled back into the cytoplasm.
There are some tissues that do not require insulin for efficient uptake of glucose: important examples are brain, liver, red blood cells ad kidney. This is because these cells do not use GLUT4 for importing glucose, but rather, other transporters which are not insulin-dependent.
Insulin also stimulates liver and muscle to store glucose in the form of glycogen. So when the supply of glucose is abundant, insulin "tells" the liver and the muscle to bank as much of it as possible in order to use it later.
- Insulin and lipid metabolism.
Insulin promotes synthesis of fatty acids in the liver. Indeed when the liver is saturated with glycogen, any additional glucose taken up by hepatocytes is
shunted into pathways leading to synthesis of fatty acids, which are exported from the liver as lipoproteins. These lipoproteins, after being released in the circulation, provide free fatty acids for use in other tissues, including adipocytes, which use them to synthesize triglyceride.
Insulin also inhibits breakdown of fat in adipose tissue by inhibiting the intracellular hormone sensitive lipase which hydrolyzes triglycerides to release fatty acids and glycerol. It also facilitates entry of glucose into adipocytes, and within those cells, glucose can be used to synthesize glycerol. Glycerol, along with the fatty acids delivered from the liver, is used to synthesize triglycerides within the adipocyte. By these mechanisms, insulin is involved in further accumulation of triglycerides in fat cells.
Beta-cell function in T2DM.
Type 2 diabetes involves defects of insulin secretion, manifested as a loss of first phase and a reduction of second phase. The insulin secretory defect could result from either defects of β-cell function or a reduction in β-cell mass or both.
It is well known that patients with type 2 diabetes and those with impaired glucose tolerance exhibit a delayed response to a glucose load. While these patients produce apparently sufficient quantities of insulin in response to a challenge, secretion is not properly timed. The initial rapid rise in blood glucose does not elicit the usual "insulin spike"; the rapid first phase is reduced or lacking. Because of the lack of correlation between carbohydrate uptake from meals and timing of insulin secretion, these patients experience hyperglycemic periods after meals. Type 2 diabetes has been proposed to result from a combination of a genetic predisposition, aging, lifestyle and obesity. The gene variants predisposing to type 2 diabetes may be expected to have mild effects on β-cell function and even in the case several negative polymorphisms are present simultaneously, they may not influence β-cell function sufficiently to produce type 2 diabetes unless other factors come into play.
Elevated plasma levels of both FFAs (Free Fatty Acid) and glucose represent hallmarks of type 2 diabetes. Both have been postulated to contribute to the insulin secretion defect. Chronic exposure of islets to an excess of either glucose
or lipids impairs insulin secretion. There is a strong negative correlation between plasma glucose levels and insulin secretion.
This complex relationship between glucose and beta-cell function may be underlied also by a dedifferentiation of the β-cell so that key regulatory genes become either down- or up-regulated. Once insulin secretion show initial impairments, a vicious cycle comprising a slight increase in plasma glucose levels with subsequent progressive impairment of glucose-induced insulin secretion results.
The molecular mechanisms by which high FFAs interfere with glucose-induced insulin secretion remain obscure. It is important to emphasise that obesity and elevated FFA levels do not result in type 2 diabetes by default. It is therefore evident that other factors must be important, including a strong genetic component (see the section Genetics of type 2 diabetes). A very significant observation in this context is that a sustained increase in plasma FFAs (by lipid infusion) resulted in marked suppression (1st phase insulin secretion reduced by 60%) of insulin secretion only in individuals with a family history of type 2 diabetes [6].
Insulin sensitivity.
Insulin sensitivity could be defined as the systemic response of the body to the glucose lowering action of insulin. It represents the ability of endogenous insulin to reduce glucose in extracellular fluids by inhibiting glucose release from the liver and stimulating the uptake of glucose from peripheral tissues.
As I mentioned above, insulin acts at the surface of insulin-dependent cells to cause the insertion in the plasma membrane, from within the cell, of special protein molecules – the so-called GLUT-4 transporters. The GLUT-4 transporters rise to the cells' outer membranes where they grab hold of the glucose molecule and transport it into the interior of the cell. Here the glucose is used to produce energy and any excess is converted into fat.
This process functions perfectly in non-diabetic persons resulting in a steady glucose level in the blood stream usually between 60 and 115 mg/dL with an average of 85 mg/dL. Patients with type 2 diabetes usually produce an adequate amount of insulin, but for some reason the mechanism whereby the insulin
summons the GLUT-4 transporters does not function. This state is called insulin resistance and is characterized by an inability of insulin to lower plasma glucose levels through suppression of hepatic glucose production and stimulation of glucose utilization in skeletal muscle and adipose tissue. The result is that both glucose and insulin levels in the blood remain high (Fig. 3).
In diabetics glucose levels are not under control and can reach levels of 250 mg/dL or higher. Up to 75% of insulin-dependent glucose disposal occurs in skeletal muscle, whereas adipose tissue accounts for only a small fraction.
Fig. 3 Defects in insulin signaling to GLUT4 could cause insulin resistance.
Both obesity and lipoatrophy also cause insulin resistance and predisposition to type 2 diabetes, demonstrating that adipose tissue is crucial in regulating metabolism beyond its ability to take up glucose. In the liver, insulin blocks glycogenolysis and gluconeogenesis, and stimulates glycogen synthesis, thereby regulating fasting glucose levels.
Obesity is clearly a major risk factor, but in some cases of extreme obesity in humans and animals, insulin sensitivity is normal.
Adipose tissue has a special role in insulin resistance. Circulating FFAs derived from adipocytes are elevated in many insulin-resistant states and have been suggested to contribute to the insulin resistance of diabetes and obesity by inhibiting glucose uptake, glycogen synthesis and glucose oxidation, and by increasing hepatic glucose output. Elevated FFAs are also associated with a
reduction in insulin-stimulated IRS-1 phosphorylation and IRS-1-associated PI(3)K (phosphatidylinositol-3-OH kinase) activity [7].
Not long ago, it seemed plausible that insulin resistance resulted from a defect inherent in the insulin signaling pathway, indeed there is only a single insulin receptor, and individuals who lack it or have antibodies against it develop severe insulin resistance. However intrinsic receptor defect does not explain the link between obesity and insulin resistance; indeed, as insulin enhances fat storage, insulin resistance in adipose tissue might be expected to mitigate obesity.
An alternative theory postulates that insulin resistance arises when pathological levels of humoral factors disrupt insulin signaling in responsive tissues. This humoral theory emerged from the recently recognized role of adipose tissue as a secretory organ, and provided an obvious link between obesity and insulin resistance. It now seems that the adipose tissue secretes many factors— collectively termed ‘adipokines’—that include adiponectin, resistin, retinol binding protein 4 and numerous classical cytokines including interleukin IL-6. In obesity, secretion of these factors is dysregulated in a way that is generally detrimental to insulin action on peripheral tissues. Some adipokines are involved in innate immunity and are also produced by macrophages. Remarkably, bone marrow–derived macrophages home to adipose tissue in obesity. Increased secretion of resistin and cytokines by adipocytes and macrophages in adipose tissue, together with decreased adipocyte secretion of the insulin-sensitizing hormone adiponectin, all contribute to the development of insulin resistance in muscle and liver.
Another hypothesis is that inflammation can cause insulin resistance. In fact it has been reported that increased NF-κB (a transcription factor involved in inflammatory events) activity is associated with increased expression of the genes that encode several cytokines and causes insulin resistance. These observations strongly support the idea that the inflamed liver can be the primary source of humoral factors that cause systemic insulin resistance. So the liver, in addition to adipose tissue, can be the primary source of factors that cause insulin resistance [8].
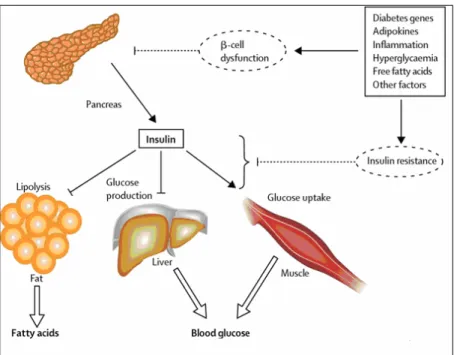
In figure 4 it is shown how β-cell dysfunction and insulin resistance could lead to hyperglycaemia and increased circulating fatty acid in type 2 diabetes.
Fig. 4 Decreased insulin secretion will reduce insulin signalling in its target tissues. Insulin
resistance pathways affect the action of insulin in each of the major target tissues, leading to increased circulating fatty acids and hyperglycaemia of diabetes. In turn, the raised concentrations of glucose and fatty acids in the bloodstream will feed back to worsen both insulin secretion and insulin resistance
GENETIC FACTORS INVOLVED IN TYPE 2 DIABETES.
The field of type 2 diabetes genetics had until recently succeeded in identifying few genuine disease susceptibility variants. A susceptibility locus is a genomic fragment of DNA that could be considered a genetic factor involved in the development of a complex and multigenic disease like T2DM. The presence of a susceptibility variant in this locus, together with environmental factors, increases the risk of T2DM.
There is ample evidence that T2DM has a strong genetic component. The concordance of T2DM in monozygotic twins is approximately 70% compared with 20–30% in dizygotic twins. The life-time risk of developing the disease is about 40% in offspring of one parent with T2DM the risk approaching 70% if both parents have diabetes. Large ethnic differences in the prevalence of T2DM have also been ascribed to a genetic component [2].
Traditionally, two different methods have been used to discover genes that are related to a disease: analysis of genomic regions shared by relatives more often than expected, the so called linkage analysis, and the candidate gene studies, but, as to T2DM, little results have been obtained from the use of both of them. The advent of genome-wide association (GWA) scans has transformed the situation, leading to an expansion in the number of established, robustly replicated T2DM loci to almost 30 [9, 10].
Linkage analysis.
Genetic linkage occurs when particular genetic loci or alleles for genes are inherited jointly. Genetic loci on the same chromosome which are physically close to one another tend to stay together during meiosis, and are thus genetically linked. Because there is some crossing over of DNA when the chromosomes segregate, alleles on the same chromosome can be separated and go to different daughter cells. There is a greater probability of this happening if the alleles are far apart on the chromosome, as it is more likely that a cross-over will occur between them. By working out the number of recombinants it is possible to obtain a measure for the distance between the genes. This distance is called a genetic map unit (m.u.), or a centimorgan, and is defined as the distance between genes for
which one product of meiosis in 100 is recombinant. A recombinant frequency (RF) of 1 % is equivalent to 1 m.u.
A linkage map is created by finding the map distances between a number of traits that are present on the same chromosome. Linkage mapping is critical for identifying the location of genes that cause genetic diseases. The success of identifying T2DM susceptibility genes by linkage has been restricted to the story of one single gene: CAPN10, which was found to be associated with type 2 diabetes mellitus in Mexican Americans, in the NIDDM1 region.The mechanisms by which calpain10 is involved in the development of T2DM is not yet clear, but it could be possible that polymorphisms located in this gene alter the calpain-regulated gene expression [11, 12]
Second to CAPN10, TCF7L2 (Trascription Factor 7 Like 2) is one of the earliest examples of a gene discovered to be associated with T2DM without prior knowledge of its function as a basis for its candidacy. TCF7L2 was identified in a follow-up analysis of a region on chromosome 10q identified through linkage analysis. TCF7L2 is involved in Wnt signaling and in the transcription of a number of genes. [2, 13]
TCF7L2 variants and their association with T2DM will be discuss later in this section.
Candidate gene approach.
The starting point for the candidate gene approach is the potential implications that either altered expression and/or function of a particular gene product (conferred by intronic or exonic genetic variants) may have on a biological function or disease. Defects in genes encoding proteins that play a role in pathways involved in insulin control and glucose homeostasis are excellent candidates for type 2 diabetes mellitus. To date, many candidate genes have been studied for their role in type 2 diabetes. The majority of these studies have failed to uncover any association [1-3, 9]. The first two genes identified through this approach that have been confirmed to be associated with T2DM are PPARG (Peroxisome Proliferator-Activated Receptor Gamma) [14] and KCNJ11 (Potassium Channel, Inwardly Rectifying, Subfamily J, Member 11) [15].
More recently other few genes have been demonstrated to be associated with T2DM through the gene-candidate approach: WFS1 (Wolfram Syndrome 1, involved in the Wolfram Syndrome) [16], TCF2 (Transcription Factor 2, involved in the Maturity-Onset Diabetes of the Young (MODY) 5) [17] and ENPP1 (Ectonucleotide Pyrophosphatase/Phosphodiesterase1, the product of which is known to modulate insulin-receptor function) [18].
GWAS (Genome Wide Association Scan)
The last few years have seen substantial changes in the way genetic association studies are conducted. The advent of the GWA approach was the result of at least three components. The first was delivery of a catalogue of patterns of human genome-sequence variation through the efforts of the International HapMap Consortium (http://www.hapmap.org) [19].
In the Hapmap website all the SNPs identified until now are collected and also information is provided about them, such as allele frequency in 4 different population (Yoruba, Chinese, Japanese and individuals with ancestry from Northern and western Europe) and Linkage Disequilibrium (LD) values between different SNPs. The presence of LD among SNPs allows to reduce the number of independent genetic tests required to survey the genome, such that about 80% of all common variation could be sampled with as few as 500,000 carefully chosen SNPs.
The second important factor is represented by the new genotyping methods that allow to perform massively parallel SNP-typing at high accuracy and low cost. Finally the availability of large sample collections has led to increased power in both discovery and replication studies.
In addition to TCF7L2, PPARG, KCJN11 and WSF1 the first GWAS have identified at least six novel genes/loci for T2DM: CDKN2A and CDKN2B encoding the tumor suppressors cyclin-dependent kinase inhibitor-2A and -2B which may play a role in pancreatic islet regenerative capacity through inhibition of CDK4 and CDK6 (cyclindependent kinase 4 and 6), respectively; IGF2BP2 which encodes insulin-like growth factor 2 binding protein 2, an mRNA binding protein implicated in transport of RNA targets to enable protein synthesis
important for pancreas development as judged by studies in Xenopus and transgenic mice; CDKAL1 which is homologous to CDK5RAP1, an inhibitor of cyclin-dependent kinase CDK5 which transduces glucotoxicity signals in pancreatic beta- cells; SLC30A8 (solute carrier family 30,member 8) encoding a pancreatic beta-cell specific zinc transporter which may affect insulin stability, storage, or secretion; and the HHEX (hematopoietically expressed homeobox) region which also harbors IDE, encoding insulin-degrading enzyme which has been implicated in both insulin signal and islet function. Both HHEX, critical for ventral pancreas development, and IDE are powerful biological candidates for T2DM. Moreover FTO (Fat Mass- and Obesity-Associated Gene), already seen to be associated with obesity, has been confirmed to be also a T2D-associated locus [20-25].
GWAS First scan Replication Confirmed T2DM associated loci
Cases Controls Population Cases Controls Population
Sladek et al [20] 661 614 French 2617 1894 French TCF7L2, SLC30A8, HHEX/IDE
WTCCC [21] 1924 2938 UK Zeggini et al [22] 3757 5346 UK TCF7L2, CDKAL1, CDKN2A/B,HHEX/IDE, SLC30A8, FTO, PPARG, KCNJ11
Scott et al [23] 1161 1174 Finnish 1215 1258 Finnish
TCF7L2, CDKAL1, CDKN2A/B,HHEX/IDE, SLC30A8, FTO, PPARG, KCNJ11 DGI [24] 1467 1464 Finnish Swedish 5065 5758 European TCF7L2, CDKAL1, CDKN2A/B,HHEX/IDE, SLC30A8, FTO, PPARG, KCNJ11 3826 12562 European 1457 986 Hong Kong Steinthorsdottir et al [25] 1399 5275 Icelandic 865 1106 West Africa TCF7L2, CDKAL1, CDKN2A/B, HHEX/IDE, SLC30A8
Table 1 T2DM associated loci identified in 2007 by GWAS.
Recent meta-analysis [26] efforts such as DIAGRAM have identified 6 further candidate SNPs: JAZF1 (juxtaposed with another zinc finger gene 1) encodes a transcriptional repressor of NR2C2 (nuclear receptor subfamily 2, group C, member 2); CDC123 (cell division cycle 123 homolog) and CAMK1D (calcium/calmodulin-dependent protein kinase 1D), both involved in the cell cycle; TSPAN8 (tetraspanin 8) which encodes a cell-surface glycoprotein
expressed in carcinomas of the colon, liver and pancreas; THADA (thyroid adenoma associated) gene; ADAMTS9 (ADAM metallopeptidase with thrombospondin type 1 motif, 9), encoding a widely expressed and secreted metalloprotease that cleaves the proteoglycans versican and aggrecan; NOTCH2 (Notch homolog 2 Drosophila) encoding a type 1 transmembrane receptor expressed in embryonic ductal cells of branching pancreatic buds during pancreatic organogenesis in mice and ADAM30 (ADAM metallopeptidase domain 30) that represents the same signal [2].
Between the end of 2008 and the beginning of 2009 other two loci have been identified to be associated with T2DM: KCNQ1 (Potassium channel, voltage-gated, KQT-like, member 1) identified in the Japanese population and confirmed in European, encoding the pore-forming subunit of a voltage-gated K+ channel (KvLQT1) that is essential for the repolarization phase of the action potential in cardiac muscle and involved in the onset of T2DM, but through yet unknown mechanism [27, 28]; MTNR1B (Melatonin Receptor 1 B), involved in the regulation of the circadian rhythms, it has also a role in the regulation of glucose homeostasis [29-32].
A recent meta-analysis [10], focused on loci implicated in fasting glucose homeostasis, identified other 5 new loci associated with higher levels of fasting glucose and also with increased risk of T2DM: ADCY5 (adenylate cyclase 5) catalyzes the generation of cAMP, important for the activation of protein kinase A (PKA) and for the insulin secretion process; PROX1 (prospero homeobox protein 1) encodes a novel co-repressor of hepatocyte nuclear factor 4 (HNF4A) that plays a crucial role in beta-cell development; The DGKB-TMEM195 locus, DGKB (diacylglycerol kinase catalytic domain β) regulates the intracellular concentration of the second messenger diacylglycerol and TMEM195 (transmembrane protein 195) encodes an integral membrane phosphoprotein highly expressed in liver;
GCK (glukokinase 4) catalyzes the initial step in utilization of glucose by the beta-cell and liver at physiological glucose concentration; GCKR (glucokinase 4 regulator) is a regulatory protein that inhibits glucokinase in liver and pancreatic islet cells by binding non-covalently to form an inactive complex with the enzyme.
Until now about 30 genes have been identified, but this is an in-progress field and other new T2DM associated loci will be found out in the future.
TCF7L2
TCF7L2 has been an important topic of my doctorate studies, so in the following chapter I will stop a little bit on it.
TCF7L2 (Transcription Factor 7 Like 2), also known as TCF-4, is a transcription factor involved in the Wnt pathway (Fig. 5) and regulates the transcription of a large number of genes.
There are three known pathways of Wnt signalling; the Wnt/β-catenin (canonical), the Wnt/Ca2+ and the Wnt/polarity pathway, which activate distinct intracellular signaling pathways, but I will focus just on the first one. In the absence of Wnt signaling, glycogen synthase kinase 3β (GSK3b), adenomatous polyposis coli protein (APC), axin and β-catenin form components of the ‘destruction complex’, enabling GSK3β to phosphorylate β-catenin at serine and threonine residues, targeting β-catenin for ubiquitination and degradation by the proteosome. When Wnt ligands bind to their receptors (the Frizzled receptors and the LDL receptor-related protein 5/6 (LRP5/6) co-receptors) Wnt signals are transmitted by the association of Wnt receptors with Dishevelled protein (Dvl). This event triggers the disruption of the destructive complex, preventing the phosphorylation-dependent degradation of β-cat, which then enters the nucleus and interacts with a member of the TCF family, the protein product deriving from TCF7L2, to form a complex that stimulates the β-cat/TCF (or WNT) downstream target genes [33, 34].
Fig. 5 Wnt/β-catenin signalling pathway [34].
Wnt signaling is a key pathway in cell proliferation and embryogenesis, and it also regulates myogenesis and adipogenesis. Defects in this pathway are involved also in tumorigenesis.
Wnt signaling has also been reported to be critical for development of pancreas and islets during the embryonic growth, but these findings are quite controversial. Indeed, while it is well-known now that this pathway is very important in exocrine pancreas development, it is still uncertain its role in the islets development, and different studies have been performed in order to point it out. At first it seems that Wnt signaling would not be involved in the endocrine pancreas development, while other studies showed that the absence of beta-catenin causes defects in endocrine pancreas development [34]. Finally a more recent study [35] suggested that the conflicting results could be resolved if we assumed that β-cat and β -cat/TCF exert different functions in a very precise dose-dependent manner at different developmental stages. So regulation of Wnt signaling’s timing and stimulus is crucial for effects on pancreas development.
On the basis of these findings it may be less surprising than it was at the time that in 2006 a linkage analysis study by Grant and colleagues [13], who were
searching for microsatellite associations across a large region of chromosome 10 previously implicated in T2DM susceptibility, led to the identification of 5 variants associated with T2DM. This result has been then replicated in many different populations [36-41] and also the GWAS published in 2007 [22-24] confirmed TCF7L2 association with T2DM.
Among all the T2D-associated loci discovered until now TCF7L2 is still the one
with the highest OR (~1,4) and its intronic variant rs7903146, located in exon 3, is
still the most informative SNP and the one with the strongest association signal.
Since this variant is intronic it seems that there is no obvious mechanism by which
it affects the activity of TCF7L2 and there is the possibility that the causal variant
acts by affecting expression of TCF7L2 rather than altering the structure of the
expressed protein [42]
Several potential mechanisms have been proposed to underlie the association
between TCF7L2 variants and T2DM, including decreased β-cell mass, impaired
insulin processing or release, impaired GLP1 (Glucagon Like Peptide 1, involved
in the glucose-stimulated insulin secretion) signalling in β-cells, liver insulin
resistance and altered chromatin state in T carriers [43-45].
Notably, most of the evidence linking TCF7L2 variation to diabetes-related
intermediate phenotypes in humans has been obtained in nondiabetic individuals.
Furthermore, with few exceptions [46-49], surrogate markers of beta-cell function
and/or insulin sensitivity have been used in these human studies. Since both
insulin sensitivity and β-cell function traits display a significant spread in patients
with T2DM, the question arises whether TCF7L2 variants may affect beta-cell
function and/or insulin sensitivity also in diabetic patients, thereby potentially
being a determinant of T2DM heterogeneity, and/or a marker of the metabolic
Part of my thesis will focus on the studies performed in order to test whether risk polymorphisms and/or haplotypes of TCF7L2 are associated with the clinical and metabolic (beta-cell function and/or insulin sensitivity) phenotypes of patients with newly diagnosed T2DM.
To achieve this goal we used the database of the Verona Newly Diagnosed Type 2 Diabetes Study (Verona NDDS), an ongoing investigation which aims at building a biobank of patients with newly diagnosed T2DM. This cohort was deemed useful for our purposes because of the absence of the potentially confounding effects of long-lasting antidiabetic treatments and of the limited impact of duration and severity of hyperglycemia per se on the metabolic phenotypes.
“GENETIC LOAD”
The second part of my thesis will focus on the combined analysis of several T2DM-associated loci and follows the footprints of previous studies dealing with the additive role played by gene risk variants in shaping T2DM risk.
As I said above until now TCF7L2 is the locus with the highest OR and its variant rs7903146 has the strongest association signal, but by itself it can explain only a small part of the phenotypic and metabolic impairments which characterize T2DM. And this observation is even more true for all the other identified T2D-associated polymorphisms with ORs lower than the TCF7L2's one. However, it has been demonstrated that these variants are at least additive in determining T2DM susceptibility. These studies, indeed, have been conducted in order to test whether considering several T2D-associated variants together could explain the role of the genetic variants in determining the risk of T2DM [50-54]. It seems that genetic information improve very little the knowledge coming from common phenotypic and clinical risk factors and they provide only a slightly better prediction of risk. However, they could be more helpful if we consider the T2DM pathophysiological traits, such as impaired β-cell function and insulin sensitivity, instead of the risk of disease. A study by Pascoe and colleagues [47] has showed that in nondiabetic subjects, while individual susceptibility alleles only moderately alter pancreatic β-cell function, their effect is additively increased when they are combined together.
From these considerations comes the idea to assess the joint gene influence of several T2D-associated SNPs on pathophysiological T2DM traits, like β-cell function and insulin sensitivity. In agreement with previous studies of T2DM genetic epidemiology, we named this putative joint gene influence “genetic load”. In the second part of my thesis, therefore, I will describe the results that we obtained considering the combined effect of 8 T2D-associated variants (table 2), each of which per se devoid of any detectable effect, in determining impairments in β-cell function and/or insulin sensitivity in patients with newly diagnosed T2DM.
SNP NEAREST GENE (chr) ACRONYM FUNCTION
rs679931 CACNA1E (1)
Calcium channel, voltage-dependent, alpha 1E
subunit
Voltage-dependent Ca2+ channel
rs1801282 PPARG (3) Peroxisome proliferator-activated receptor-gamma
The heterodimer PPARG/RXRA is a nuclear
receptor that regulates glucose and lipid
homeostasis rs1044498 ENPP1 (6) Ectonucleotide pyrophosphatase/ phosphodiesterase 1 It modulates insulin-receptor function
rs10946398 CDKAL1 (6) CDK5 Regulatory subunit
associated protein 1-like 1 Unknown
rs1111875 HHEX (10) Haematopoietically expressed homeobox Involved in Wnt/β-catenin pathway, regulation of pancreas organogenesis rs10010131 WFS1 (4) Wolfram syndrome 1 Putative transmembrane protein highly expressed in pancreatic islets,with loss of
function by mutations in Wolfram syndrome
rs4430796 TCF2 (17) Transcription factor 2 Nuclear transcription factor
rs4402960 IGF2BP2 (3) Insulin-like growth factor 2 mRNA binding protein 2
It binds to the 5'-UTR of the insulin-like growth factor 2
(IGF2) mRNAs
PATIENTS AND METHODS
Patients.Verona Newly Diagnosed Type 2 Diabetes Study (Verona NDDS)
The Verona NDDS is an ongoing study aiming at building a biobank of patients with newly diagnosed T2DM. As of Jan 1 2002, all patients referred to the Division of Endocrinology and Metabolic Diseases of University of Verona School of Medicine, whose diabetes has been diagnosed in the last six months, are asked to participate in this research. The clinical evidence on which the diagnosis of type 2 diabetes has been made is reviewed and the diagnosis confirmed [55]. Patients already treated with antidiabetic drugs are put on therapy washout for at least one week before metabolic tests are performed. Among the exclusion criteria are age>75 years, non-Italian ancestry, insulin treatment, presence of GAD antibodies, malignancies, and any condition severely impairing liver and/or kidney function. The clinical features of the population considered in the two studies (TCF7L2 and GENETIC LOAD studies) are reported in table 3 and 9 in the RESULTS section.
Verona Newly Diagnosed Type 2 Diabetes Study
All subjects consumed a weight-maintaining diet containing 200-250 g of carbohydrate/day for at least three days before studies. Body weight was stable in all subjects for at least 1 month before studies. No subject participated in any heavy exercise. Each subject gave informed written consent before participating in the research, which was approved by the Human Investigation Committee of the Verona City Hospital. Measurements of standard clinical phenotypes were collected in all patients. Metabolic tests were carried out on two separate days in random order. On both days, patients were admitted to the Metabolic Clinic Research Center at 07:30 after an overnight fast. All studies were carried out in a quiet, temperature controlled (22° C) room.
On one day an OGTT (75 g) was performed to assess beta-cell function. During the entire test patients were sitting in a comfortable cardiac chair. One teflon (21 g) venous catheter was inserted into an antecubital vein for blood sampling and kept patent with heparinized normal saline solution. After a 30’ rest to establish
baseline and after collecting a 20 cc blood sample for leukocyte DNA extraction, at time = 0’ subjects ingested 75 g of glucose in 300 ml of water over 5 min. Blood samples to measure glucose, C-peptide and insulin concentrations were collected at times -10’, 0’, +15’, +30’, +45’, +60’, +90’, +120’, +150’, +180’, +210’ and +240’. In some patients further blood samples were collected at +270’ and +300’. Urines were collected to measure glycosuria.
On a separate day, an euglycemic insulin clamp was performed to assess insulin sensitivity [56].During the entire test patients were lying in bed. One teflon catheter was introduced into an antecubital vein for the infusion of test substances. Another teflon catheter was placed retrogradely into a wrist vein for sampling arterialized venous blood, according to the “hot box” technique. After a 30’ rest in bed to establish baseline, indirect calorimetry (at least 40’) was performed as previously described, for a companion study [57].At the end of calorimetric measures, baseline blood samples were collected and a standard euglycemic insulin (intravenous prime: 4.8 nmol.min-1.m-2 BSA; continuous infusion: 240 pmol.min-1.m-2 BSA) clamp was performed [56]. Plasma glucose was allowed to decline until it reached 5.5 mmol/l, after which glucose clamping started with a glucose concentration goal of 5 mmol/l. The duration of the glucose clamp was at least of 120’, but it was prolonged, if and as needed, to ensure at least 60’ of insulin clamp at euglycemia in each patient. Timed blood samples were collected to measure hormone and substrate levels. In the last 45’ of the clamp indirect calorimetry was repeated to assess substrate oxidation and energy production rates for a companion study. Urines were collected to measure urea excretion rate. In both metabolic tests, all blood samples were collected in pre-chilled tubes and readily spun at 1,500 g. Plasma and serum specimens were stored at –80° C.
Analytical procedures
Plasma glucose concentration was measured in duplicate on a Beckman Glucose Analyzer II (Beckman Instruments, Fullerton, CA, USA) at bedside. Serum C-peptide and insulin concentrations were measured by chemiluminescence as previously described [58]. Glycated hemoglobin and serum lipids were measured by standard in-house methods.
Calculations
The amount of glucose metabolized during the last 60 min of the clamp (M value, reference insulin sensitivity) was computed with standard formulae [56].
The following classical indexes of beta-cell function were computed [59]:
• Insulinogenic Index: (Insulin30’ – Insulin0’)/(Glucose30’ - Glucose0’), units: mU/mmol;
• CIR120’: Insulin120’/[Glucose120’*(Glucose120’ - 3.89)]; units: mU*L/mmol2. Further insights in beta-cell function were sought by mathematical modeling (see below).
Substrate oxidation rates and energy production rate were computed by standard formulae as previously described [57].
Modeling of Beta-Cell Function
The analysis of the glucose and C-peptide curves during the OGTTs of the Verona NDDS follows the general strategy described in previous publications [60, 61] with some modifications and builds upon previous works from other laboratories [62, 63]. The kinetics of C-peptide is described with a two-compartment model, in which the two pools (1 and 2) exchange with each other and the irreversible loss of the hormone is from pool 1, the same where C-peptide concentration is measured. C-peptide kinetic parameters are computed according to the equations by Van Cauter et al.[64].
Herein are the equations describing the model of glucose induced insulin secretion during an OGTT:
dcp1(t)/dt = ISR(t) + cp2. k12 – (k01 + k21) . cp1 (Eq.1)
where ISR = insulin secretion rate, cp1 = C-peptide mass in the sampling (accessible) compartment, cp2 = C-peptide mass in the remote compartment, k12 and k21 = rate constants of the exchange between the two C-peptide compartments, and k01 = rate constant of the irreversible loss of C-peptide from the accessible compartment. Note that the values of the volume of distribution of C-peptide pool 1 (accessible compartment), k12, k21, and k01 are computed according to the equations by Van Cauter et al.[64]
where BSR = basal insulin secretion rate, DSR = insulin secretion rate due to the derivative (or dynamic) component, and PSR = insulin secretion rate due the proportional (or static) component.
BSR = CPss. V1. k01 (Eq. 3)
where CPss is basal C-peptide concentration and V1 is the volume of the accessible compartment of C-peptide.
From the modeling viewpoint, DSR(t) and PSR(t) are the components which in intravenous glucose tolerance tests or hyperglycemic clamps describe classical first phase insulin secretion and second phase insulin secretion, respectively. Furthermore, from a physiological viewpoint, the sum of BSR and PSR(t) describes the relationship linking glucose concentration and insulin secretion rate, in the absence of the derivative component (DSR).
DSR(t) and PSR(t) are mathematically defined as follows: DSR (t) = X1 (t) .τ-1 (Eq. 4)
dX1 (t) / dt = σ1 . [dG(t)/dt]/[log(1.1+ t)] - X1(t) .τ-1 if dG(t)/dt > 0 (Eq. 5) dX1(t) / dt = - X1(t) .τ-1 if dG(t)/dt ≤ 0 (Eq. 6)
where σ1 = glucose sensitivity of derivative control of insulin secretion, G = plasma glucose concentration, X1 = C-peptide (insulin) mass made available for the derivative component of insulin secretion, τ = time constant of the derivative component of insulin secretion, and the term log(1.1 + t) accomodates the time-associated decline of σ1 documented in humans during a hyperglycemic stimulus [65].
PSR(t) = X2(t) .δ-1 (Eq. 7)
dX2(t) / dt = σ2 . [G(t) – θ] - X2(t) .δ-1 (Eq. 8)
where σ2 = glucose sensitivity of the proportional component of insulin secretion, X2 = C-peptide (insulin) mass made available for the proportional component of insulin secretion, δ = time constant of the proportional component of insulin secretion, θ = glucose threshold above which the beta-cell responds with the proportional component of insulin secretion to plasma glucose concentration. This model was implemented in the SAAM 1.2 software (SAAM Institute, Seattle, WA) [66] to estimate its unknown parameters. Numerical values of the unknown parameters were estimated by using nonlinear least squares. Weights were chosen optimally, i.e., equal to the inverse of the variance of the
measurement errors, which were assumed to be additive, uncorrelated, with zero mean, and a coefficient of variation (CV) of 6-8%. The unknown parameters of the model are: CPss, σ1, τ, σ2, θ, and δ.
There are two main physiological outputs of the model:
1. derivative control [pmol.m-2 BSA] . [mmol.l-1.min-1] -1: it is presented as the amount of insulin secreted in response to a rate of glucose increase of 1 mmol/l per min which lasts for 1 minute;
2. stimulus-response curve linking glucose concentration (x axis) to insulin secretion rate (ISR; y axis), when the derivative control is absent: as explained above, ISR is the sum of BSR and PSR, and it depends on the following three parameters estimated by the model: CPss, σ2, and θ. With the purpose of avoiding artifactual increases in the power of statistical analyses, we used the stimulus-response curve at the pre-selected glucose concentrations of 5.5, 8.0, 11.0, 15.0 and 20.0 mM.
Genotyping.
A leukocyte DNA sample was collected for each patient and the DNA extraction was made through standard salting out method. Different genotyping methods have been used. All the DNA extraction and the genotyping have been performed at the Department of Mother and Child, Biology and Genetics – Section of Biology and Genetics – University of Verona, directed by Prof. Pinatti.
RFLP-PCR (Restrinction Fragment Length Polymorphism – Polymerase Chain Reaction)
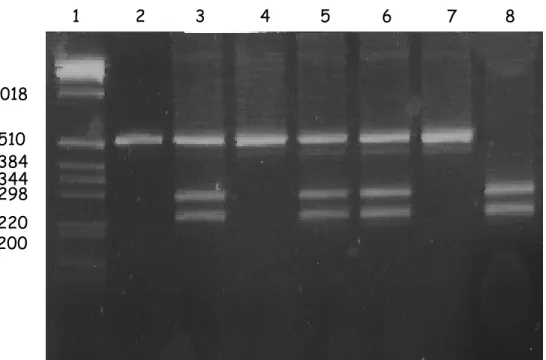
The genomic DNA fragment containing the SNP of interest is amplified through PCR. The PCR product is then processed with a properly chosen restriction enzyme recognizing a specific binding site, including only one of the two allelic variants of the SNP. In this way it is possible to discriminate the genotype (Fig 6).
Fig. 6. RFLP. The restriction enzyme identified only one of the two allelelic variants of the SNP.
In lane 3, 5 and 6 both the variants are present (heterozygous NM); in lane 8 only the allele not recognized by the enzyme is present and the PCR product is completely cut (homozygous NN); in lane 2 and 7 the enzyme did not identify its specific binding site and it did not cut (homozygous MM). On the Y axis the molecular weights references are reported.
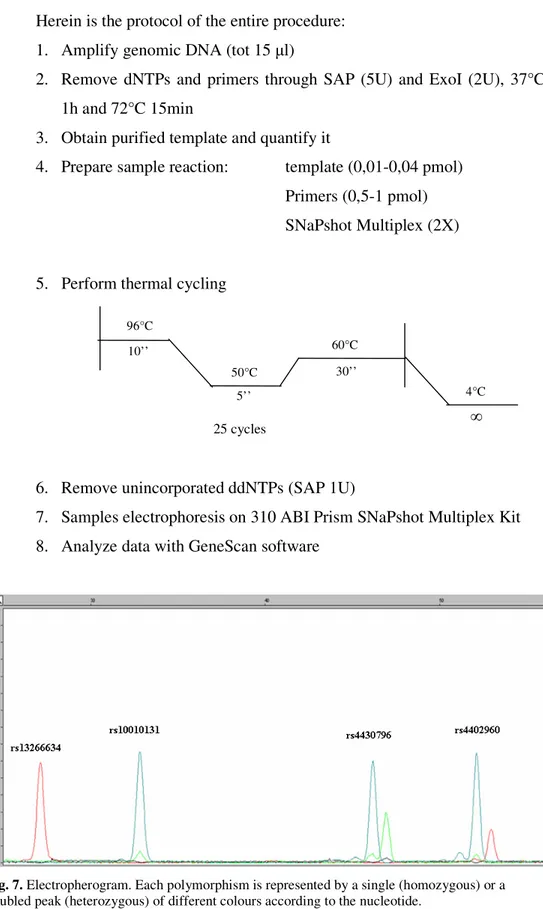
SNAPSHOT METHOD (ABI Prism Genetic Analyzer 310)
This method is based on the single nucleotide primer extension technique and it allows to genotype up to 10 SNPs together.
The genomic region bearing the SNP of interest is amplified through PCR followed by purification of the PCR product (see below steps 1-2). After that a mini-sequencing reaction is performed using fluorescent ddNTPs and a special primer, complementary to the region of the amplified DNA located just before the polymorphism (step 3). In this way only one single nucleotide, the one in correspondence to the SNP of interest, can be add to the primers. After another purification step, the reaction is loaded on a ABI Prism Genetic Analyzer 310 and a capillary electrophoresis is performed (Fig.7). The different alleles of the SNPs are characterized by a slightly different weight, which can be detected by the instrument. Moreover the probes have been designed of different length for the different contemporary analyzed polymorphisms in order to easily recognize them on the basis of the size of the fragment.
220 1018 200 298 344 384 510 1 2 3 4 5 6 7 8
Herein is the protocol of the entire procedure: 1. Amplify genomic DNA (tot 15 µl)
2. Remove dNTPs and primers through SAP (5U) and ExoI (2U), 37°C 1h and 72°C 15min
3. Obtain purified template and quantify it
4. Prepare sample reaction: template (0,01-0,04 pmol) Primers (0,5-1 pmol) SNaPshot Multiplex (2X)
5. Perform thermal cycling
6. Remove unincorporated ddNTPs (SAP 1U)
7. Samples electrophoresis on 310 ABI Prism SNaPshot Multiplex Kit 8. Analyze data with GeneScan software
Fig. 7. Electropherogram. Each polymorphism is represented by a single (homozygous) or a
doubled peak (heterozygous) of different colours according to the nucleotide. 25 cycles 96°C 10’’ 50°C 5’’ 30’’ 60°C 4°C ∞
TAQMAN.
This method is the most commonly used for genotyping because it is reliable, reproducible and quick.
A commercial assay is used for TaqMan genotyping and it contains both primers and fluorescent probes. There are two probes with two different fluorescent molecule, one for each alleles, at one side and a quencher at the other side for every SNP and they are complementary to the region surrounding the SNP, the polymorphism lays in the middle of the probe. According to the genotype of the SNP the probes could perfectly match or not. During the elongation phase the polymerase will find the probes on its way. If the probe perfectly matches, the enzyme will disrupt it, the fluorophore will be moved away from the quencher and it will emit fluorescence. However, if the matching is not perfect the whole probe will be moved away from the DNA strand but no fluorescence will be released. (fig.8).
Herein is the protocol of the procedure and the PCR programme.
- 6-30 ng of genomic DNA
- Master mix (Applied Biosystem) 2X
- TaqMan Assay (Applied Biosystem) 40X
- Water
- Perform the following thermal cycling
Statistical analysis.
Data are presented as medians and interquartile range, unless otherwise indicated. Before performing statistical contrasts, skewed variables were log-transformed to improve the approximation to the Gaussian distribution and reported p-values are two-sided.
The associations of TCF7L2 single variants with phenotypic traits have been explored by ANOVA generalized linear models (GLM) as implemented in SPSS. Since the logarithmic transformation was insufficient to improve the distribution of derivative control of beta-cell function, the latter was analyzed by Kruskal-Wallis test. These statistical analyses were carried out with the software SPSS 12.0.
Haplotype association analysis was performed by generalized linear models (GLM) as implemented in the library haplo.stats [67] of the R package [68]. Associations between traits and haplotypes, allowing for ambiguous haplotypes, were investigated also by including relevant covariates such as age, gender and BMI. The statistical significance of global test and of single haplotype effects was ascertained by a Monte Carlo procedure in which the value of the trait was permuted among individuals and studied for association with the genetic factor in 1000 replicates.11.0. 50°C 95°C 95°C 4°C 62°C 15’’ 1’ ∞ 10’ 2’ 40 cycles
![Fig. 5 Wnt/β-catenin signalling pathway [34].](https://thumb-eu.123doks.com/thumbv2/123dokorg/8247968.129420/28.918.179.713.119.502/fig-wnt-β-catenin-signalling-pathway.webp)
![Table 3. Clinical characterization of TCF7L2 study population. The values are reported as median [interquartile range]](https://thumb-eu.123doks.com/thumbv2/123dokorg/8247968.129420/45.918.176.754.467.785/table-clinical-characterization-population-values-reported-median-interquartile.webp)