POLITECNICO DI MILANO
School of Industrial and Information Engineering
Master of Science in Nuclear Engineering
ABSOLUTE STATISTICAL EQUILIBRIA
OF TWO-DIMENSIONAL GYROKINETIC
TURBULENCE IN MAGNETIZED PLASMA
Advisor:
Candidate:
Prof. Matteo Passoni
Andrea Tancetti
820268
Co-Advisor:
Dr. Plunk Gabriel G.
Winning is great, sure
but if you are really going to do something in life,
the secret is learning how to lose.
Nobody goes undefeated all the time.
If you can pick up after a crushing defeat,
and go on to win again,
you are going to be a champion,
someday.
Contents
Contents ________________________________________________________________ 5
Abstract _______________________________________________________________ 11
Sommario ______________________________________________________________ 12
Preface ________________________________________________________________ 13
Estratto ________________________________________________________________ 15
Chapter 1 The Energy Issue ________________________________________________ 22
1.1. An Overview on Energy _________________________________________________ 23
1.1.1. Energy Value Added, Services and Development _________________________________ 23 1.1.2. HOW we do produce energy _________________________________________________ 27 1.1.3. Energy and Electricity in the EU, 2015 __________________________________________ 30
1.2. Nuclear Power ________________________________________________________ 33
1.2.1. Chemical vs Nuclear: the MEGA Factor _________________________________________ 34 1.2.2. Mass Defect and Binding Energy per Nucleon ____________________________________ 36 1.2.3. Nuclear Fission ____________________________________________________________ 38 1.2.4. Nuclear Fusion _____________________________________________________________ 39
Chapter 2 Turbulence ____________________________________________________ 43
2.1. Introduction to turbulence ______________________________________________ 44 2.1.1. A taste of turbulence _______________________________________________________ 45 2.1.2. Equations _________________________________________________________________ 472.2. Chaotic behavior from deterministic non-linear systems ______________________ 49
2.2.1. Logistic map _______________________________________________________________ 50
2.3. Scales and Richardson Cascade ___________________________________________ 54
2.3.1. Scales ____________________________________________________________________ 55 2.3.2. Energy Balance and Enstrophy ________________________________________________ 56 2.3.3. Richardson Cascade ________________________________________________________ 57
2.4. 2D Turbulence ________________________________________________________ 59
2.4.1. Peculiar features of 2D turbulence_____________________________________________ 60 2.4.2. Statistical Hydrodynamics ____________________________________________________ 62
Chapter 3 Toward Plasma Turbulence _______________________________________ 66
3.1. Introduction to Plasma _________________________________________________ 67
3.1.2. Kinetic model _____________________________________________________________ 68
3.2. Confinement _________________________________________________________ 73
3.2.1. Energy Balance and Lawson Criterion __________________________________________ 73 3.2.2. A Star in a (Magnetic) Bottle__________________________________________________ 75
3.3. Orbit Theory __________________________________________________________ 78
3.3.1. Helical motion and drift velocity ______________________________________________ 78 3.3.2. Mirror Effect and Magnetic Bottle _____________________________________________ 81
3.4. Plasma Turbulence ____________________________________________________ 83
3.4.1. Why Turbulence in Magnetic confined Plasma ___________________________________ 83 3.4.2. Gyrokinetic model __________________________________________________________ 84 3.4.3. Two-dimensional statistical absolute equilibrium in electrostatic ion-scale gyrokinetic turbulence _________________________________________________________________________ 92
Chapter 4 Two-dimensional Electromagnetic Gyrokinetics ______________________ 98
4.1. Assumptions, Equations and Invariants ____________________________________ 99
4.1.1. Electron-Scale Turbulence ___________________________________________________ 99 4.1.2. Field Equations ___________________________________________________________ 101 4.1.3. Invariants ________________________________________________________________ 103 4.2. Statistical Equilibrium _________________________________________________ 107 4.2.1. Spectral Densities _________________________________________________________ 107 4.2.2. Discussion _______________________________________________________________ 110
4.3. Alternative Choice of Invariants _________________________________________ 114
4.3.1. Alternative choice of invariants ______________________________________________ 114 4.3.2. Two different approaches to obtain the spectral densities ________________________ 116
CONCLUSIONS _________________________________________________________ 124
Bibliography ___________________________________________________________ 127
List of Figures
FIGURE 1HUMAN DEVELOPMENT INDEX AS A FUNCTION OF PRO CAPITA ENERGY CONSUMPTION ... 26
FIGURE 2GROSS INLAND CONSUMPTION,EU-28,1990-2015(% OF TOTAL CONSUMPTION) ... 30
FIGURE 3GLOBAL ANNUAL MEAN TEMPERATURE DEVIATIONS,1850-2015 ... 32
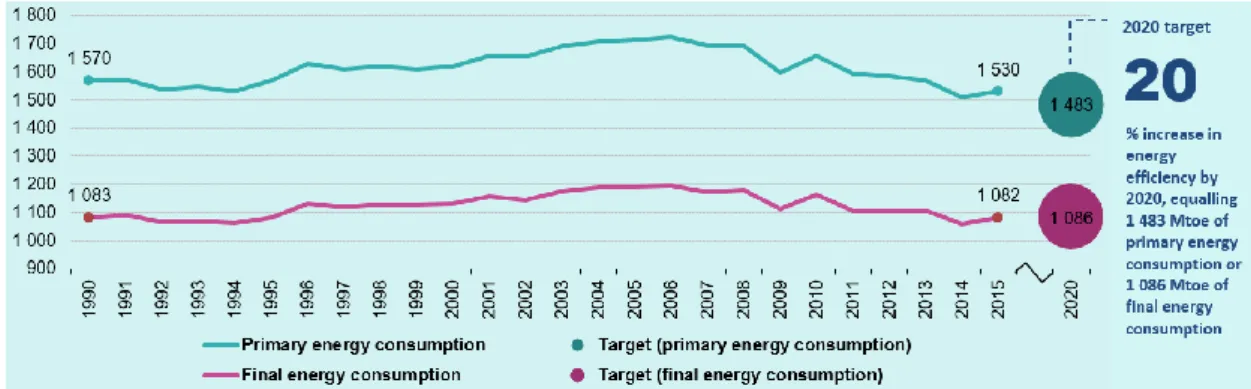
FIGURE 4PRIMARY ENERGY CONSUMPTION AND FINAL ENERGY CONSUMPTION,EU-28,1990-2015 ... 33
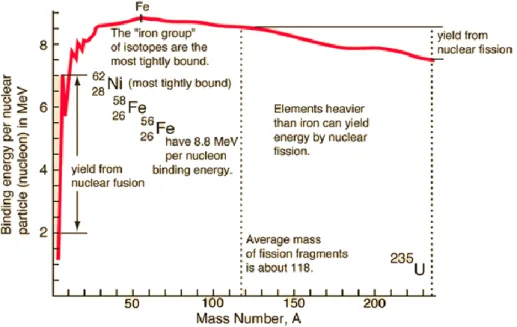
FIGURE 5AVERAGE BINDING ENERGY PER NUCLEON ... 37
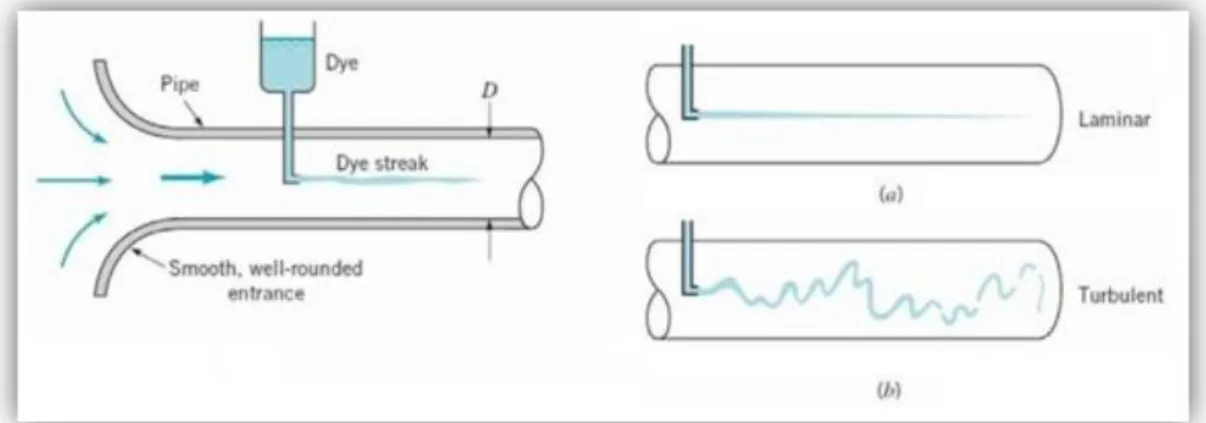
FIGURE 6OSBORNE REYNOLD’S EXPERIMENT: GIVEN THE PROPERTIES OF THE FLUID AND THE GEOMETRY OF THE PIPE, THERE IS A THRESHOLD PRESSURE GRADIENT, BEYOND WHICH THE DYE DENOTES THE TRIGGERING OF A TURBULENT FLOW ... 45
FIGURE 7REPRESENTATION OF DYNAMIC VISCOSITY ... 46
FIGURE 8 VELOCITY PROFILES IN TWO NOMINALLY IDENTICALLY REALIZATIONS ... 47
FIGURE 9PLOT OF AS A FUNCTION OF FOR TWO DIFFERENT VALUES OF THE CONTROL PARAMETER : AND .THE DASHED LINES INDICATE THE SLOPES AT THE FIXED POINTS: FOR THE CASE THE SLOPE IS LESS THAN -45° AND THE FIXED POINT IS STABLE; FOR THE SLOPE IS STEEPER THAN -45° AND THE POINT IS UNSTABLE ... 50
FIGURE 10THE STABILITY OF A FIXED POINT IS RELATED TO THE SLOPE OF THE CURVE : THE DASHED LINE IS THE 45° LINE WHILE THE OTHER ONE REPRESENTS THE MAP.CASE A.: THE FIXED POINT IS AN ATTRACTOR;.CASE B.: THE FIXED POINT IS SAID “NEUTRALLY STABLE”;.CASE C.: THE FIXED POINT IS A REPELLOR. ... 51
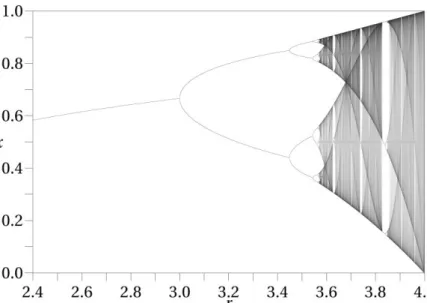
FIGURE 11FIXED POINTS FOR THE LOGISTIC MAP FOR VALUES OF THE CONTROL PARAMETER INCLUDED BETWEEN 2.4 AND 4 ... 54
FIGURE 12 A) EXPANSION OF A PERIODIC FUNCTION IN SERIES OF HARMONICS WHOSE PERIOD IS A SUBMULTIPLE OF THE PERIOD OF THE SIGNAL; B)SIGNAL SUBJECT TO LOW-PASS FILTERING (SECOND ROW) AND HIGH -PASS FILTERING (THIRD ROW). ... 56
FIGURE 13ENERGY CASCADE IN TURBULENT FLOW: INJECTION OF ENERGY OCCURS AT LARGE SCALES,L; SCALE-INTERACTION (MATHEMATICALLY DESCRIBED BY THE NON-LINEAR TERM) ALLOWS ENERGY TRANSFER TO SMALLER SCALES; DISSIPATION OF ENERGY OCCURS AT A SPECIFIC SCALE, DETERMINED BY THE INJECTION SCALE AND THE LARGE-SCALE-RE. ... 58
FIGURE 14–STRETCHING OF A VORTEX TUBE ... 59
FIGURE 15 DRIFT: GIVEN AN ELECTRIC FIELD POINTING UPWARD AND A MAGNETIC FIELD DIRECTED TOWARD THE READER, THE DRIFT VELOCITY PULLS THE GYRO-CENTRE TO THE RIGHT OF THE PAPER, INDEPENDENT OF THE SIGN OF THE CHARGE: THE ION AND ELECTRON TRAJECTORIES ARE SHOWN IN CASE THE TWO PARTICLES ENTER THE FIELD WITH SAME PERPENDICULAR VELOCITY ... 80
FIGURE 16LOSS CONE IN THE VELOCITY SPACE ... 82
FIGURE 17MAGNETIC BOTTLE: TRAPPED CHARGED PARTICLES BOUNCE BACK AND FORTH ... 83
FIGURE 18APPROXIMATE TREND OF THE MAGNETIC TERM (205) AS A FUNCTION OF FOR .THE RED CURVE IS THE PLOT OF FOR NEGATIVE , WHILE THE BLUE CURVE REPRODUCES FOR POSITIVE .NOTE THE SINGULARITY OF (205) IN : FOR , THE STATISTICAL SOLUTION IS ACCEPTABLE SINCE (205) IS POSITIVE LIKE , BUT FOR , THE STATISTICAL SOLUTION MUST BE REJECTED SINCE (205) IS NEGATIVE WHILE POSITIVE.MOREOVER, THE RED CURVE WOULD CORRESPOND TO AN ACCEPTABLE RANGE (SINCE BOTH SINCE (205) AND ARE NEGATIVE) BUT IT IS FORBIDDEN FROM THE CONDITION ... 113
FIGURE 19APPROXIMATE TREND OF THE MAGNETIC TERM (208) AS A FUNCTION OF FOR .THE RED CURVE IS THE PLOT OF FOR NEGATIVE , WHILE THE BLUE CURVE REPRODUCES FOR POSITIVE .NOTE THE SINGULARITY OF (208) IN . ... 114
List of Tables
TABLE 1MASLOW HIERARCHY OF NEEDS AND ENERGY LADDER ... 25
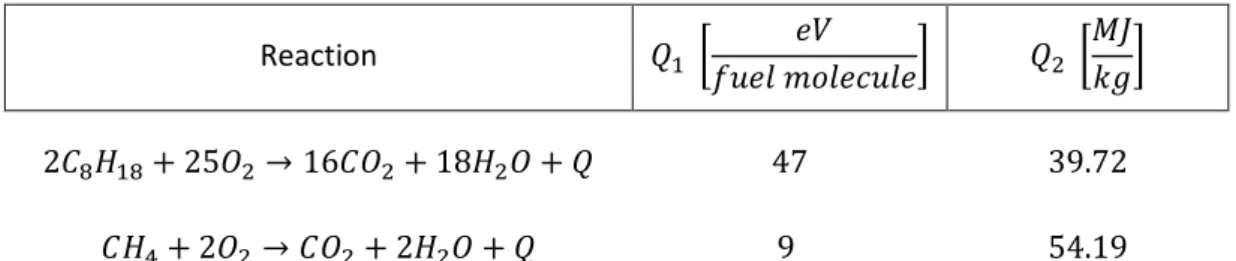
TABLE 2GASOLINE AND METHANE COMBUSTION REACTIONS WITH RELATIVE Q VALUES EXPRESSED IN EV FOR EACH MOLECULE OF FUEL IN THE REACTION (I.E. IN THE FIRST ROW, THE Q VALUE FOR THE COMPLETE REACTION IS 94 EV SINCE TWO MOLECULES OF GASOLINE REACT) AND IN MJ FOR KG OF FUEL... 34
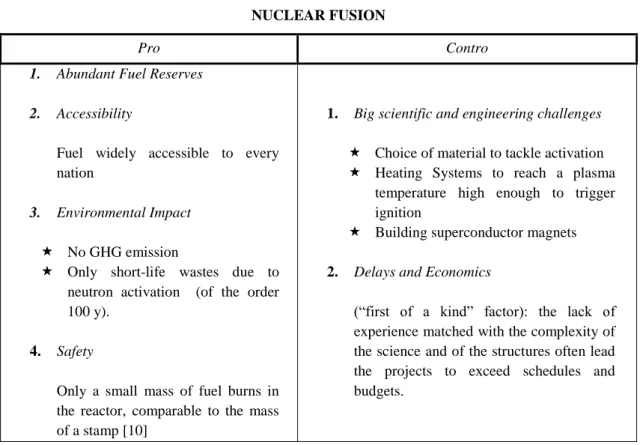
TABLE 3ADVANTEGES AND DISADVANTAGES OF NUCLEAR FUSION ... 41
TABLE 4 AND FOR DIFFERENT VALUES OF THE CONTROL VALUES ... 52
TABLE 5COMPARISON OF DENSITY AND CONFINEMENT TIME FOR THE TWO METHODS OF CONFINEMENT ... 75
TABLE 6COMPARISON BETWEEN THE TWO MAIN DEVICES DESIGNED TO FULFIL MAGNETIC CONFINEMENT FUSION: A) TOKAMAK AND B) STELLARATOR.IN THE UPPER GRID THE DESIGNS ARE SHOWN; IN THE MIDDLE LINE, THE VARIOUS MAGNETIC FIELDS CONTRIBUTING TO REALIZE A ROTATIONAL TRANSFORM ARE LISTED FOR BOTH MACHINES; FINALLY, THE MAIN DIFFERENCES BETWEEN THE TWO CONCEPTS ARE POINTED OUT ... 77
TABLE 7INVARIANTS OF MOTION FOR A CHARGED PARTICLE TRAVELLING IN A UNIFORM AND CONSTANT MAGNETIC FIELD... 79
TABLE 8MIRROR EFFECT: INVARIANT OF THE MOTION AND CONSEQUENT RELATIONSHIPS BETWEEN THE MAGNETIC FIELD INTENSITY, THE VELOCITY COMPONENTS AND THE QUANTITY CHARACTERISTIC OF THE GYRATION MOTION. ... 81
TABLE 9LENGTH AND TIME SCALE SEPARATION IN GYROKINETIC THEORY ... 85
TABLE 10ORDERING ASSUMPTIONS ... 86
TABLE 11SPATIAL AVERAGES ... 86
TABLE 12DEFINITION OF THE SPECTRAL ENERGY DENSITY AND OF THE SPECTRAL DENSITY OF PERTURBED ENTROPY, AND CORRESPONDING EXPRESSIONS IN THE CASE OF ELECTROSTATIC TWO-DIMENSIONAL TURBULENCE ... 96
TABLE 13GYROKINETIC SYSTEM OF EQUATIONS FOR PARTIAL ELECTROMAGNETIC TURBULENCE, I.E. FOR A GYROKINETIC POTENTIAL IF THE KIND: : THE THREE UNKNOWNS ARE THE GYROKINETIC DENSITY OF GYRO-CENTRES, THE ELECTROSTATIC POTENTIAL , AND THE PARALLEL COMPONENT OF THE VECTOR POTENTIAL ... 103
TABLE 14ASYMPTOTIC BEHAVIOUR OF THE MAIN FUNCTIONS OF THE MODEL ... 105
TABLE 15 AND AS FUNCTIONS OF : ... 105
TABLE 16N+1 INVARIANTS OF THE MOTION FOR THE SYSTEM OF EQUATIONS SUMMARIZED IN TABLE 13; THE INVARIANTS AS SHOWN HERE ARE OBTAINED FROM (172) AND (173) AFTER:FOURIER TRANSFORM; GALERKIN TRUNCATION; VELOCITY SPACE DISCRETIZATION; REDUCTION OF THE SUM IN DUE TO THE REALITY CONDITION ... 107
TABLE 17SUMMARY OF COVARIANCES AND SPECTRAL DENSITIES FOR THE 2-INVARIANT PROBLEM, FOR THE CASE OF EXPANSION OF THE COEFFICIENTS IN SERIES OF POLYNOMIALS ... 120
TABLE 18SUMMARY OF COVARIANCES AND SPECTRAL DENSITIES FOR THE 2-INVARIANT PROBLEM, FOR THE CASE OF VELOCITY DISCRETISATION FOLLOWED BY DOUBLE ITERATION OF SHERMAN MORRISON FORMULA... 121
Abstract
Energy is an open issue of the twenty-first century: several different solutions exist, but each one brings with it important technological limitations or an outstanding environmental impact that limit its exploitation. In this context, thermonuclear controlled fusion is, scientifically and technically, a demanding challenge toward a safe, clean, abundant and reliable source of energy.In magnetic confinement fusion, the fuel in the state of plasma is heated up to millions of degrees Kelvin and confined in toroidal devices using suitably designed magnetic fields, with the goal of establishing the required conditions to reach ignition.
Plasma turbulence is nowadays a topic of great relevance for thermonuclear fusion since it is assumed to prevent confinement through the production of an unexpected and still not understood contribution to transport of particles and heat, hence named anomalous. Conversely, experimental evidence reveals spontaneous saturation of turbulence characterized by the presence of poloidal flows known as zonal flows, which, in turn, quench the effect of anomalous transport.
In applying the methods of statistical mechanics to the survey of two-dimensional fluid turbulence, similar flows indeed arise by the process of inverse cascade, whereby energy organizes at large scales; this behavior was attributed to negative temperature states.
This thesis presents a statistical investigation of two-dimensional, partially electromagnetic turbulence in magnetized plasma, with the purpose of verifying the occurrence and studying the properties of such negative temperature states. The survey proceeds through the costruction of a gyrokinetic model of turbulence and the application of a statistical approach based on the absolute equilibrium of Galerkin-truncated inviscid systems, and enriched with the discretisation of velocity space: negative temperature states, corresponding to energy condensing to large scales are found, confirming the existence of an inverse energy cascade.
Sommario
L’energia è un problema aperto del ventunesimo secolo: numerose soluzioni sono tutt’oggi esistenti , ma ciascuna è inficiata da importanti vincoli tecnologici o da un significativo impatto ambientale che ne limitano lo sfruttamento. In questo contesto, la fusione termonucleare controllata rappresenta una sfida impegnativa sia nel campo scientifico che ingegneristico, verso il conseguimento di una fonte di energia pulita, sicura, abbondante e affidabile.
Nella fusione a confinamento magnetico, il combustibile in stato di plasma è scaldato a temperature di milioni di gradi Kelvin e confinato in dispositivi a geometria toroidale ricorrendo a campi magnetici opportunamente sagomati, con l’obiettivo di realizzare le condizioni ottimali per l’ignizione.
La presenza di turbolenza nel plasma costituisce un importante ostacolo al suo confinamento in quanto produce un contributo al trasporto di particelle e calore teoricamente ancora non compreso e perciò definito anomalo. D’altro canto, l’evidenza sperimentale ha mostrato una naturale tendenza della turbolenza a raggiungere uno stato di saturazione caratterizzato dalla presenza di flussi poloidali detti zonal flows, che, a loro volta, attenuano l’effetto del trasporto anomalo.
Analizzando la turbolenza in fluidi bidimensionali mediante metodi statistici, fenomeni analoghi si osservano a seguito di un processo noto come cascata inversa, per cui l’energia della turbolenza converge a grandi scale; questa dinamica è tipica di stati a temperatura negativa.
In questa tesi è presentato uno studio statistico della turbolenza bidimensionale parzialmente elettromagnetica in un plasma magnetizzato, con l’obiettivo di verificare l’occorrenza e studiare le proprietà di tali stati a temperatura negativa. L’indagine ha inizio con la messa a punto di un modello di turbolenza girocinetico, e procede con la sua analisi tramite tecniche statistiche basate sull’equilibrio assoluto di sistemi discretizzati mediante il metodo di Galerkin, e affiancate da un’ulteriore discretizzazione dello spazio delle velocità.
Gli stati a temperatura negativa, corrispondenti a condensazione di energia a grandi scale sono effettivamente individuati, riscontrando l’esistenza del fenomeno di cascata inversa.
Preface
The search for a clean, safe, abundant and reliable energy source is the engine of thermonuclear fusion research, which aims to realize a system where fuel composed by light nuclei, in the state of plasma, is brought to such temperatures and densities that nuclear fusion reactions guarantee a power outcome much bigger than power income and power losses. Magnetic confinement is nowadays the most advanced and studied technology toward big-scale thermonuclear reactors and it resorts to suitably designed magnetic fields to keep charged particles away from the reactor walls, which would slow them down, cooling down the plasma.
In tokamaks and stellarators, the most promising machines for Magnetic Confinement Fusion (MCF), transport of particles and energy strongly affects confinement: classical theories of transport still fail to reproduce the experimental results within an order of magnitude or more. Such unexpected contribution to transport, labelled as anomalous, remains not understood and a systematic theory has not yet been developed; it is assumed to be generated by micro-turbulence which, in turn, is driven by micro-instabilities such as those triggered by temperature or density gradients. Nontheless, turbulence is often controlled by the presence of spontaneously generated mechanism of saturation, known as zonal flows, which could importantly reduce the contribution of the anomalous transport in preventing confinement.
The main focus of this thesis is the survey of turbulence in magnetized plasma in order to shed light on the mechanisms of turbulence saturation, that could control and limit anomalous transport. As Onsager [33] and Kraichnan [29] showed, applying statistical mechanics to the investigation of turbulence in an inviscid neutral fluid confined in a two-dimensional box, such mechanisms arise spontaneously by the process of “inverse cascade”, whereby energy naturally organises at large scales. This striking phenomenon is not unknown to statistical mechanics: historically, this behaviour was attributed to “negative temperature” states.
The model believed to control the performance of plasma turbulence is called gyrokinetics.
Gyrokinetic equation was first investigated using the methods of statistic mechanics by Hammett and Zhu [34] and a solution has been found that could be adapted to explain the turbulence saturation mechanisms.
The work described in this thesis is part of this framework: the goal is to apply gyrokinetics to the survey of two-dimensional, electron-scale, “partially electromagnetic” turbulence in a magnetized plasma, trying to identifying negative temperature states corresponding to the condensation of energy to large scales.
The thesis consists of 4 chapters:
The first chapter is a reflection about the key themes concerning the energy issue: it studies the relationships between energy efficiency and energy quantity; it proposes a schematic analysis of fossil fuels and renewable energies, pointing out advantages and disadvantages of each one; it
describes the main features of EU energetic policy. In such context, the nuclear alternative is discussed with more detail: despite many open issues about nuclear fission, nuclear fusion boasts amazing advantages and it looks like an ideal source of energy for the future... but apparently still pretty far!
Chapter 2 is an introduction to the physics of turbulence, with particular care to the topics treated in this work.
Chapter 3 is dedicated to plasma turbulence: it first describes the tools, like plasma kinetic theory, magnetic confinement and orbit theory, necessary to understand and work with turbulence, then it moves to delineate gyrokinetic model.
Finally, Chapter 4 presents the motivation, the method and the result of the work, starting from the derivation of the model for electron-scale, quasi-electromagnetic turbulence to the discussion of spectral distributions for the electromagnetic field energy.
This work was carried out during a ten months working period at the Max-Planck-Institut für Plasmaphysik, Greifswald, Germany.
Estratto
In questa tesi viene presentata l’analisi degli stati di equilibrio statistico della turbolenza “parzialmente elettromagnetica” e su scala elettronica in un plasma di due popolazioni (ioni ed elettroni), non-collisionale, magnetizzato e confinato ad una lastra bidimensionale. Benché tale problematica presenti un carattere del tutto generale in fisica dei plasmi, risultando di grande interesse, per esempio, nello studio del vento solare, questo lavoro si colloca nell’ambito dello studio di plasmi magneticamente confinati per la realizzazione di reattori a fusione nucleare. In particolare, a partire dalla trattazione girocinetica della turbolenza, è stato ricavato un modello analitico per lo studio della dinamica dei vari modi turbolenti. Il sistema è affrontato con metodi statistici con l’obiettivo di ricavare e studiare le distribuzioni spettrali per gli invarianti del problema, in special modo per l’energia del campo elettromagnetico, e verificare l’esistenza di stati a temperatura negativa, corrispondenti a fenomeni di condensazione di energia a larghe scale. Questi stati motiverebbero la formazione di flussi macroscopici, detti zonal flows, che potrebbero notevolmente smorzare il fenomeno di trasporto anomalo osservato nelle moderne macchine a geometria toroidale, tokamak e stellarator, e, intimamente connesso all’esistenza di moti turbolenti nel plasma termonucleare.
Due nuclei con numero di massa, A, inferiore a quello del Fe (56), possono assumere una quantità di energia cinetica sufficiente a sopraffare la repulsione coulombiana, dovuta alla carica elettrica dello stesso segno, e fondersi a produrre un sistema più legato e più stabile, ottenuto mediante la conversione di una frazione della massa iniziale in energia cinetica dei prodotti. Tale reazione avviene regolarmente nelle stelle, dove enormi quantità di materia sottoforma di gas altamente ionizzato, detto plasma, sono confinate ad opera dell’interazione gravitazionale e mantenute a temperatura e densità tali da sostenere la reazione. L’interesse per l’astrofisica non si è limitato alla contemplazione di plasmi stellari, ma ha anche motivato lo studio e la costruzione di esperimenti in tutto il mondo, con l’obiettivo di verificare la possibilità di sfruttare tale reazione per la produzione di corrente elettrica.
La fusione a confinamento magnetico rappresenta l’alternativa più promettente: in questo caso, il combustibile per la reazione (deuterio e trizio nei reattori di prima generazione), viene scaldato fino alla temperatura di fusione e confinato mediante campi magnetici di specifiche geometrie: l’obiettivo è raggiungere la condizione di ignizione, in cui la potenza prodotta dal plasma supera la perdite dovute al trasporto di calore e all’irraggiamento, in assenza di potenza fornita dall’esterno. I principali meccanismi di degrado del confinamento sono il trasporto classico e neoclassico, collisionali, e il trasporto dovuto alla turbolenza, definito anomalo perché rilevato sperimentalmente ma inatteso e ancora incompreso teoricamente; i primi due fenomeni risultano, invece, attualmente chiari e sistematizzati ma, sfortunatamente, spesso molto meno rilevanti dell’ultimo. Nei modelli classico e neoclassico del trasporto, le collisioni Coulombiane tra particelle determinano la diffusione di particelle e calore: mentre, però, nel primo caso la
trattazione si svolge in geometria cilindrica, il problema neoclassico include gli effetti prodotti dalla geometria toroidale, prendendo in considerazione, così, scale spaziali e temporali differenti dal caso classico, ma formulando sempre previsioni troppo ottimistiche rispetto ai risultati sperimentali.
Il consistente contributo mancante al trasporto neoclassico per formulare previsioni più attendibili è prodotto dalla turbolenza nel plasma: fluttuazioni del campo elettrico e del campo magnetico inducono, infatti, perturbazioni nel moto delle particelle equivalenti ad un fenomeno di diffusione non-collisionale, detto trasporto anomalo. Il trasporto anomalo è, ad oggi, poco compreso e, sebbene esistano diversi modelli teorici per giustificarne i meccanismi, una trattazione completa e sistematica è ancora inesistente mentre nella pratica si ricorre spesso a relazioni di scaling ottenute da misurazioni compiute in vari esperimenti.
Lo studio della turbolenza rimane, quindi, di importanza capitale per la comprensione del trasporto anomalo. La turbolenza, detta anche micro-turbolenza in quanto si verifica alle scale del raggio di Larmor ionico o elettronico (e per questo va distinta dalla turbolenza MHD che coinvolge scale macroscopiche) è indotta da una vasta zoologia di micro-instabilità innescate, a loro volta, da gradienti di natura termica ed elettromagnetica nel plasma; esempi rilevanti sono le instabilità indotte da gradienti di temperatura su scala ionica o elettronica, indicate con l’acronimo ITG ed ETG.
La formazione di flussi quasi-bidimensionali poloidali, detti zonal flows in esperimenti di fusione a confinamento magnetico, è in grado di controllare la turbolenza e limitare l’ampiezza delle fluttuazioni elettriche e magnetiche, moderando così nettamente l’effetto del trasporto anomalo. Anche per quanto concerne la formazione di zonal flows, la nostra comprensione è ancora molto lacunosa: alcuni modelli applicati allo studio di fluidi non carichi bidimensionali, rivelano la produzione di fenomeni simili in seguito al processo di cascata inversa, per cui l’energia della turbolenza condensa a larghe scale. Anche se queste dinamiche potrebbero apparentemente sembrare in contrasto con l’intuito statistico, che suggerirebbe una distribuzione equa di energia tra i vari gradi di libertà del sistema, la meccanica statistica, qualora applicata in specifiche situazioni, predice tali fenomeni di condensazione, in genere corrispondenti a stati di temperatura negativa. Il primo ad applicare un’analisi di tipo statistico allo studio della turbolenza di fluidi in due dimensioni non carichi e non viscosi, fu Onsager Lars, nel 1949, mettendo in evidenza l’esistenza di stati di equilibrio a temperatura negativa, caratterizzati dalla tendenza dei vortici dello stesso segno a raggrupparsi e fondersi, producendo pochi vortici di grandi dimensioni. In seguito, i lavori di Bachelor e Kraichnan ampliarono notevolmente i confini della conoscenza della turbolenza bidimensionale, arrivando a chiarire e sistematizzare le dinamiche caratteristiche della cascata inversa. Lo studio dell’equazione di Eulero mediante il metodo di Galerkin, ad opera di Kraichnan, confermò la correttezza dei risultati ottenuti da Onsager anni primi, con un approccio hamiltoniano. Il modello teorico generalmente applicato allo studio della turbolenza nei plasmi si chiama teoria girocinetica: essa fornisce un set di equazioni per la dinamica della funzione di distribuzione dei centri di girazione e l’evoluzione nel tempo delle fluttuazioni elettrica e magnetica. Il modello è stato recentemente ispezionato nel caso puramente elettrostatico con i metodi della meccanica statistica da Hammett e Zhu, trovando una soluzione che potrebbe essere adattata alla spiegazione della generazione degli zonal flows.
Il lavoro esposto nella presente tesi si colloca in questo ambito. Il sistema studiato è un plasma di ioni ed elettroni, non-collisionale, magnetizzato e confinato in un lastra bidimensionale: ipotizziamo una sorgente di energia per la turbolenza, (che, in genere, coincide con instabilità tipo ITG o ETG ma che, nel nostro caso, non ci interessa specificare) e ci chiediamo che forma abbia la distribuzione spettrale di energia del campo elettromagnetico all’equilibrio statistico. In particolare,
siamo interessati a individuare e analizzare stati a temperatura negativa, che evidenzierebbero, appunto, l’occorrenza di una cascata inversa alla Kraichnan. La turbolenza considerata è denominata parzialmente elettromagnetica, in quanto, a differenza del problema elettrostatico, precedentemente menzionato, sono prese in considerazione anche le fluttuazioni relative alla componente del potenziale vettore parallela al campo magnetico di fondo, (corrispondente a ); tuttavia, il problema è ancora incompleto perché si trascura la componente perpendicolare. Un’altra importante differenza rispetto al problema di Hammett e Zhu consiste nella scala a cui si studia la turbolenza: nel lavoro di seguito presentato, ci si focalizza su turbolenza a scala elettronica. Questa ipotesi consente di semplificare la trattazione considerando un’unica specie girocinetica, quella elettronica, trattando la popolazione ionica mediante un’ approssimazione adiabatica, che consente di ricondurre l’equazione girocinetica ionica ad una semplice perturbazione alla Boltzmann della funzione di distribuzione.
La tesi consta di 4 capitoli e una conclusione. Il primo capitolo costituisce una riflessione sui temi fondamentali legati al quadro energetico attuale, in cui si colloca la ricerca sulla fusione termonucleare; il secondo e il terzo capitolo presentano il background teorico necessario ad un’adeguata comprensione del calcolo riportato in questa tesi: le tematiche relative alla turbolenza di maggiore interesse per questo lavoro sono riportate nel capitolo 2, mentre il capitolo 3 contiene una trattazione introduttiva ad argomenti di fisica dei plasmi, con particolare enfasi alla turbolenza e al modello girocinetico. Infine, il capitolo 4 presenta il risultato del lavoro, a partire dalla derivazione delle equazioni del modello girocinetico per la turbolenza elettronica fino alla discussione delle distribuzioni spettrali per l’energia del campo elettromagnetico.
Il capitolo 1 è diviso in due parti: la prima metà è finalizzata a presentare tematiche generali riguardanti l’energia nel ventunesimo secolo in riferimento alle tre domande, “cosa?”, “come?”, “quanto?”.
Il primo punto ci guida a riflettere sul dilemma quantità/qualità di energia consumata in relazione ai concetti di comfort, bisogni e sviluppo. Sono introdotti strumenti ed esempi al fine di dimostrare la priorità dell’efficienza di una fonte energetica rispetto alla quantità disponibile: l’indice che, in questo campo, consente di definire e quantificare l’efficienza di una fonte energetica si chiama REVA Index (Real Energy Value Added) che misura il servizio reale fornito da una specifica fonte di energia, al netto del lavoro complessivamente connesso allo sfruttamento di tale risorsa. Tale analisi è inserita nell’elaborato al fine di dimostrare che la questione energetica non è solo un problema di quantità di risorse, ma, è in primo luogo connessa alla possibilità di produrre energia in modo pulito, sicuro, abbondante e affidabile.
Il capitolo procede con una schematica presentazione di vantaggi e svantaggi connessi allo sfruttamento di combustibili fossili ed energie rinnovabili (“come?”) allo scopo di presentare in modo semplice e chiaro le attuali alternative e i limiti di natura tecnologica e/o ambientale che su di essi gravano. L’attenzione si sposta, poi, alle politiche energetiche dell’EU (“quanto?”): l’Unione Europea, sulla base di dati sperimentali, prende atto di un preoccupante incremento della temperatura media della superficie del pianeta, avennuto negli ultimi cento anni. Le scelte europee in ambito energetico sono perciò principalmente dirette a limitare tale tendenza nei decenni a venire mediante la riduzione di emissioni di gas serra, l’aumento dello sfruttamento di energie rinnovabili e un miglioramento dell’efficienza, intesa come rapporto tra consumo di energia finale (presso gli end-users) e consumo di energia primario (ossia della risorsa “fresca” appena estratta dal deposito naturale).
In questo quadro, si apre la seconda metà del capitolo, dedicata prevalentemente all’energia nucleare: prima di passare a tematiche prettamente nucleari, è impostato un confronto tra l’ordine
di grandezza dell’energia prodotta nei processi nucleari e chimici, introducendo il concetto di fattore mega.
Le reazioni nucleari di maggior interesse in ambito energetico sono introdotte con un breve cappello riguardante il concetto di difetto di massa ed energia di legame media per nucleone: quest’ultima è discussa e analizzata ricorrendo in primis al celebre grafico in funzione del numero di massa dei nuclei, A, e, in secundis, alla formula semi-empirica delle masse. La discussione verte allora spontaneamente verso fissione e fusione nucleare.
In primo luogo è affrontata la fissione nucleare: vengono descritte la dinamica e l’energetica della reazione, ponendo attenzione alla distinzione tra fissione spontanea e indotta da neutroni. Riflettendo su questa ultima circostanza si arriva a delineare il meccanismo della reazione a catena, essenziale al sostentamento della reazione nei moderni reattori nucleari. La sessione si chiude commentando l’andamento mondiale ed europeo dell’energia nucleare da fissione.
Dulcis in fundo, è servita la fusione nucleare: oltre al ruolo centrale che la fusione nucleare svolge nella vita elle stelle, questa reazione rappresenta una sorgente di energia “ideale” , ad elevato REVA, usufruibile nell’arco di pochi decenni. Tuttavia, esistono ancora numerose questioni irrisolte sia a livello scientifico che ingegneristico che portano a posticipare continuamente l’alba di questa interessantissima tecnologia.
Il Capitolo 2 è dedicato alla trattazione degli argomenti relativi alla turbolenza in fluidi non carichi di maggiore interesse per la discussione del lavoro di tesi. La prima metà del capitolo consta di una introduzione ai temi più rilevanti e caratteristici del fenomeno, mentre nei paragrafi conclusivi si passa alla turbolenza bidimensionale e alla presentazione dell’approccio statistico finalizzato allo studio degli invarianti negli stati di equilibrio.
Il capitolo si apre con il rinomato esperimento eseguito da Reynolds nel 1883, da cui segue la distinzione tra flusso laminare e turbolento; l’attenzione si volge, quindi, alla definizione del numero di Reynolds, parametro di importanza capitale nello studio della turbolenza.
Si procede allora, allo studio delle equazioni che costituiscono il substrato matematico del complicato e intricato percorso verso la comprensione del moto turbolento: si riporta e si descrive l’equazione di Navier Stokes, abbinata, nel nostro caso, all’equazione di in comprimibilità, presentando anche l’interessante formulazione adimensionale dell’equazione, dove appare il numero di Reynolds come parametro di controllo per la transizione tra moto laminare e turbolento. È, inoltre illustrata e discussa l’equazione di vorticità, mettendo in evidenza un fenomeno peculiare della dinamica 3D, il vortex stretching.
Sin dall’inizio della trattazione è però messa in risalto l’apparente contraddizione tra la natura deterministica del problema matematico e quella randomica della soluzione turbolenta: per sciogliere ogni perplessità e fare luce su questo emozionante argomento, viene discusso il caso della mappa logistica, modello discreto di legge deterministica non lineare, in cui la transizione da una soluzione semplice e riproducibile, ad una caotica e disordinata è interpretata ricorrendo all’esistenza di un parametro di controllo, che stabilisce l’importanza del termine non lineare nell’equazione.
La trattazione si sposta quindi allo studio della cascata di energia dalle scale di iniezione a quelle di dissipazione: per prima cosa, facendo ricorso all’operazione di filtraggio proposta da U.Frisch, viene fornita la definizione di “scala”, che corrisponde, fisicamente al concetto di vortice nella turbolenza. Si discute allora il bilancio di energia in un volume finito di fluido, sottolineando il ruolo poco appariscente ma decisamente fondamentale del termine lineare dell’equazione di Navier Stokes: interazione tra scale e trasferimento di energia dalle più larghe elle più piccole. Tale dinamica è quindi analizzata in maggior dettaglio utilizzando il modello proposto da Richardson della cascata di energia.
La seconda parte del capitolo è dedicata alla turbolenza in 2 dimensioni, rilevante nel lavoro di tesi. Sono illustrate le differenze più importanti rispetto al caso 3D: assenza di vortex stretching e cascata inversa di energia dalle piccole alle grandi scale. Il primo punto è messo in evidenza in quanto determina la conservazione dell’enstrofia per un fluido limitato ad una regione di piano finita; tale osservazione è ripresa nella seconda discussione poiché è proprio l’esistenza di due invarianti (energia ed enstrofia) a indurre una fenomenologia inversa nel trasferimento di energia. Il capitolo si chiude descrivendo l’approccio statistico di Kraichnan all’equazione di Eulero: sono riportate sinteticamente il procedimento per ottenere i valori medi dei due invarianti del moto e l’analisi del risultato che conduce a ritrovare (dopo la scoperta di Onsager) stati a temperatura negativa, caratterizzati dall’accumulo di energia a grandi scale.
Il capitolo 3 si articola nella presentazione di 3 macroargomenti di ampio respiro, propedeutici per la comprensione della micro turbolenza nei plasmi, e si chiude con una sezione interamente dedicata a quest’ultimo argomento.
Inizialmente, si delinea la definizione e si illustrano le grandezze caratteristiche del quarto stato della materia, ossia la lunghezza di Debye, la frequenza di plasma e il parametro di plasma, enfatizzando le condizioni che distinguono un plasma da un gas ionizzato qualunque. Segue quindi, la presentazione del modello cinetico per la dinamica del plasma; tale descrizione è ottenuta dall’equazione di Boltzmann, completata con l’aggiunta delle interazioni a lungo a raggio e corredata con le 4 equazioni di Maxwell. Il sistema così ottenuto, necessita ancora un’adeguata chiusura: in questo lavoro sono presentate tre possibili alternative: chiusura non-collisionale o alla Vlasov, chiusura BTG o approssimazione di tempo di rilassamento e la chiusura alla Fokker-Planck.
Dopodiché si compie il primo passo verso lo studio di plasmi per reattori a fusione termonucleare e si apre il capitolo confinamento: dopo aver fornito le definizioni di fattore Q, break-even point e ignition point, il problema è introdotto impostando il bilancio di energia sul plasma con lo scopo di ottenere il criterio di Lawson per entrambe le condizioni, break-even e ignizione. Sono, quindi, delineate le due tecniche di confinamento ad oggi più studiate e promettenti: inerziale, con tempi di confinamento legati all’inerzia del combustibile e densità molto elevate, e magnetico, con tempi di confinamento nell’ordine del secondo e densità molto inferiori.
Per quanto riguarda la scuola del confinamento inerziale ci si limita solamente ad un breve approfondimento dato che non risulta di alcun interesse per l’argomento dell’elaborato, mentre il confinamento magnetico è studiato più dettagliatamente, descrivendo e confrontando le due configurazioni di maggior interesse, tokamak e stellarator.
Per sviluppare una maggiore comprensione della fenomenologia di plasmi confinati con campi magnetici, si discutono alcuni argomenti elementari della teoria delle orbite. In particolare, si tratta il moto di particella carica in campo magnetico costante e uniforme, osservando la classica dinamica elicoidale indotta dalla forza di Lorentz, e il caso ottenuto sovrapponendo al campo una forza costante ed uniforme: in questa ultima circostanza ci si sofferma ad analizzare le varie derive del centro di guida.
Tali nozioni convergono, infine, nella spiegazione del fenomeno della riflessione di particelle cariche in campi magnetici e nella discussione di opportune configurazioni di campo, note come bottiglie magnetiche, che consentono di confinare il moto a volumi di spazio finiti.
La sezione finale del capitolo è interamente dedicata alla turbolenza nei plasmi. La trattazione si apre motivando lo studio della turbolenza con la necessità di comprendere il fenomeno del trasporto anomalo di particelle e calore, che grava pesantemente sul confinamento di plasmi nei dispositivi per la fusione termonucleare controllata.
Successivamente, la discussione si fa più tecnica e si arriva a parlare del modello girocinetico per la turbolenza. Il modello si fonda su opportune assunzioni riguardanti le scale spaziali e temporali del problema, su uno specifico ordinamento di tali grandezze e su una coppia di operazioni di media che consentono di selezionare la dinamica a specifiche scale.
Il modello girocinetico per la turbolenza è costituito da un’equazione girocinetica per ogni popolazione del plasma, dalla condizione di quasi neutralità e dalle leggi di Ampere parallela e perpendicolare e costituisce l’approccio utilizzato nel lavoro esposto in questo elaborato.
Una prima applicazione di tale modello è discussa in riferimento alla turbolenza elettrostatica, in due dimensioni.
Il capitolo 4 riassume il procedimento, il modello e i risultati ottenuti durante il progetto.
Il capitolo si apre con le ipotesi cardine del procedimento per la costruzione del modello girocinetico della turbolenza: l’assunzione di turbolenza su scala elettronica, l’assunzione di piccola , che giustifica l’esclusione della componente perpendicolare del potenziale vettore, , e l’assunzione relativa all’ordine “sussidiario”. Mentre la prima condizione consente di semplificare il problema riducendo la trattazione della popolazione ionica da girocinetica ad adiabatica, ed eliminando quindi l’equazione girocinetica per gli ioni, la terza fonda la bidimensionalità del problema.
Successivamente è ricavato il modello analitico per lo studio della turbolenza in plasma magnetizzato composto dall’equazione girocinetica elettronica, la condizione di quasi-neutralità e la legge di Ampere parallela, nelle incognite: , funzione di distribuzione per i centri di girazione elettronici, ed fluttuazioni turbolente del campo elettromagnetico.
Dopodiché ci si concentra sul calcolo degli invarianti del moto: l’energia del campo elettromagnetico e l’entropia perturbata, nello spazio reale e nel dominio di Fourier.
Arrivati a questo punto, viene impostato il procedimento per il calcolo delle densità spettrali degli invarianti all’equilibrio statistico: si procede, per prima cosa, mediante una doppia discretizzazione: nello spazio dei vettori d’onda (troncamento o metodo di Galerkin) e nello spazio delle velocità. Dopo aver stabilito l’esistenza di un teorema di Liouville per il sistema così ottenuto, si costruisce la statistica canonica mediante il metodo dei moltiplicatori di Lagrange e si procede al calcolo della matrice di covarianza, da cui seguono immediatamente le densità spettrali degli invarianti.
L’analisi della densità spettrale del’energia di campo elettromagnetico è impostata distinguendo lo studio degli stati a temperatura positiva da quelli a temperatura negativa e, lo studio del termine elettrico da quello del termine magnetico: entrambe i contributi, elettrico e magnetico, mostrano condensazione di energia a grandi scale per temperature negative, confermando l’occorrenza di una cascata inversa.
Un passo matematicamente interessante nella trattazione è il calcolo della matrice di covarianza, per cui sono stati individuati tre metodi: il metodo mediante la formula di Woodbury è illustrato nelle sezioni iniziali del capitolo; i due metodi rimanenti sono la doppia iterazione della formula di Sherman-Morrison (DSB) e il metodo delle basi in velocità (VB), riportati nelle due sezioni finali, in cui le N+1 entropie perturbate del problema statistico precedente sono ricondotte ad un unico invariante (energia libera generalizzata) mediante integrazione nella variabile velocità. Pur non mostrando novità sul piano fisico, il confronto tra i metodi rivela un’interessante proprietà matematica: la discretizzazione impiegata dal metodo VB non implica perdita di informazione rispetto al caso non discretizzato. Il metodo VB, parzialmente elaborato durante in questo lavoro, potrebbe quindi, fornire uno strumento di analisi più efficiente in occasioni future.
L’elaborato si chiude con le conclusioni, in cui si ribadiscono le motivazioni, il metodo e gli obiettivi della presente tesi e si propongono alcuni possibili sviluppi futuri del lavoro.
Chapter 1
The Energy Issue
Chapter one is divided into two parts: the first half is intended to present general topics relating to energy in the 21st century with reference to the three questions: “what?”, “how?”, “ How much?”. The first point leads us to reflect on the dilemma quantity/quality of energy consumed in relation to the concepts of comfort, needs and development. Tools and examples are introduced to demonstrate the priority of the efficiency of an energy source over the available quantity: the index that, in this field, allows to define and quantify efficiency is called REVA Index (Real Energy Value Added) that measures the actual service provided by a specific source of energy, net of the total work associated with the source exploitation. The analysis is included in the this work in order to demonstrate that the energy issue is not only about the amount of resources available but mostly about the ability to produce energy in a clean, safe, abundant and reliable way.The chapter proceeds with a schematic presentation of advantages and disadvantages associated with the exploitation of fossil fuels and renewable energies (“how?”), with the goal of illustrating in a simple and clear way the current alternatives and their technological and/or environmental limitations. The focus then moves to the EU energy policies (“how much?”): the European Union, on the basis of experimental data, confirms a worrying increase in the average temperature of the surface of the planet, occurred in the last century. Energy choices in Europe are therefore mainly aimed at limiting this trend over the coming decades by reducing greenhouse gases emissions, increases renewable energy share and improving efficiency, defined as the ratio of final over primary energy consumption.
In this framework, the second half of the chapter is dedicated to nuclear energy: first, a comparison is made between the order of magnitude of energy produced in nuclear and chemical processes, introducing the concept of mega factor.
A short introduction to the concepts of mass defect and average binding energy per nucleon is thus presented: the latter is discussed and analyzed using primarily the famous graph according to the mass number of nuclei, A, and, in secundis, to the semi-empirical mass formula. The discussion then spontaneously turns to nuclear fission and nuclear fusion. First, nuclear fission is dealt with: the dynamics and energy of the reaction are described, paying attention to the distinction between spontaneous and neutron-induced fission. Reflecting on this last circumstance, it is possible to outline the mechanism of chain reaction, essential to sustaining reaction in modern nuclear reactors. The session closes commenting on the global and European trends in nuclear fission.
Dulcis in fundo, nuclear fusion is served: in addition to the central role that nuclear fusion plays in star life, this reaction represents an "ideal" energy source, high REVA, usable within a few decades. However, there are still many unresolved issues at both the scientific and engineering level that continually lead to the postponement of the dawn of this very interesting technology.
1
1
.
.
1
1
.
.
A
A
n
n
O
O
v
v
e
e
r
r
v
v
i
i
e
e
w
w
o
o
n
n
E
E
n
n
e
e
r
r
g
g
y
y
“Modern humans need energy and a lot of it to live a life of comfort”
With these words, P.K.Kaw and I. Bandyopadhyay open chapter 1, “The case for Fusion”, in the book “Fusion Physics”, published by IAEA in 2012 [1]. Even though it sounds like a simple and agreeable observation that needs no further explanations, it may represent the start point for many interesting and far from trivial considerations. Since the first time I read it, I couldn’t help to feed some doubt about it:
1. Is energy a need only for “modern” people? 2. What does “comfort” mean?
3. How much energy does comfort require? Does “comfort” imply limitless abundance or there is an upper bound?
In section 1.1.1., we will address these questions and ponder on the meaning of important concepts and quantities, like comfort, needs, energy value added and development, which stand behind the energy issue. We will trace an intimate connection between the quality of the source exploited for energy production, well expressed by the REVA (Real Energy Value Added) Index, and the concepts of development, growth, and comfort of the population. “How much energy we use” could, indeed, be of little account for life-style improvement every time we resort to resources more harmful than useful, like the well-known case of fire-wood in Sub-Saharan Africa.
Afterwards we turn to analyze advantages and disadvantages of our present-day energy sources and a collection of data about energy production and consumption in the UE.
I chose to include this material in my work because I strongly believe that research must not remain limited to sectoral reasonings and isolated from the worldwide framework, but it must keep an eye on the global dynamics in order to be always aware and preserve an objective and up-to-date point of view on the studied topic.
1.1.1. Energy Value Added, Services and Development
The first evidence of a tiny wood-powered controlled plasma dates back to 800000 years ago, in Israel [2]. The mastery of fire induced many sweeping changes in human life: it didn’t only improve technique (like in the case of hunting), but it brought our ancestors to develop completely new skills (like clay baking).
We can identify three parameters that underwent a significant improvement: Longevity: cooking (meat and plants), protection against animals
Education (Culture, emergence of creativity) : clay baking (Venus statuettes), enhancing social life
Despite the considerable number of services that fire provided to humanity, if we wondered how efficient this young energy source was, we would soon reach the conclusion that “modern humans” need way less energy than hominids to satisfy the same services: indeed, the 2000 World Energy Assessment conducted by the United Nation Development Programme and the World Energy Council estimates the efficiency of fuel-wood at 15% as compared to kerosene at 50% and gas at 65% efficiency [3][4]. This means that 85 parts over one hundred consumed are actually wasted every time we resort to fuel-wood. Hence, the mastery of fire clearly represents a turning point in human history, but just because it was the first accessible energy source exploited and had no “competitors”: nowadays, the broad choice of resources at our disposal allows us to opt for more efficient solutions, which guarantee the same services at a lower energy expense.
A similar result is obtained studying the 2005 energy consumption in rural and urban India [3]: since rural India primarily relies on low-efficiency biomass, it requires much more total energy than urban areas, even if these consume more end-use energy. This means that rural regions are unable to convert energy into services, while urban India offers more services consuming less energy, thanks to the choice of “modern” energy sources (kerosene, LPG, electricity) and the availability of reliable infrastructures.
The key to growth and development hides behind the concept of energy value added, that measures the net improvement experienced by consumers using a specific resource, estimated as the difference between services practically supplied by the resource and “work” it requires to be wholly exploited. The REVA index was defined by Ben Ebenhack in 2007 [5]: “This is a term (REVA) that addresses the practical reality that consumers do not use Joules, they use services provided by the energy [...]. It (REVA) forces us to consider energy within the context of the needs it meets, the services itprovides, and the impact it has on our way of life”.
For instance, in many low-income countries, fuel-wood and diesel fuel sell for similar prices: these reflect the costs of acquiring the fuel, transporting it and distributing it to the consumer. Despite the same economic value, fuel-wood has an extremely low REVA: it furnishes some services, like heating and cooking, but at a high price: it contributes to deforestation and it induces severe respiratory system pathologies in users inhaling the smokes of combustion (being indeed the second “top killers in Sub-Saharan Africa” in 2012 [6]).
Besides considerations on the energy value added, energy is even a matter of services: which services do we need to live a “comfortable” life? How can we utilize energy in the best way in order to supply these services?
Cambridge Dictionary defines “comfort” as:
“the state of having a pleasant life with enough money for everything that you need” while Merriam-Webster dictionary goes like:
“A state or situation in which you are relaxed and do not have any physically unpleasant feeling caused by pain, heat, cold, etc.”
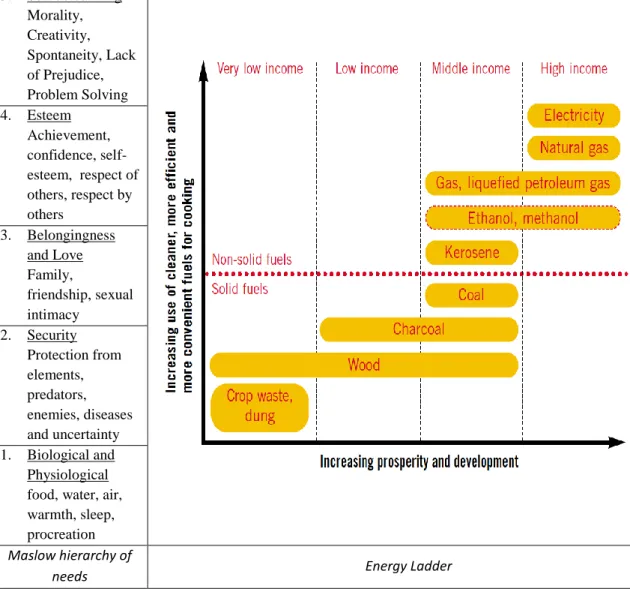
Both definitions connect comfort to freedom from needs: actually basic needs are not easy to identify for they vary with climate, culture, period in time, sex and age and, moreover, they may have different priorities. To keep in mind a simple scheme let us consider Maslow hierarchy of needs [7]: this is a model in 5 rungs proposed by Abraham Maslow in 1943 to describe the priority of human needs, each individual turns to higher rungs, only once the lower ones are accomplished.
5. Self-actualizing Morality, Creativity, Spontaneity, Lack of Prejudice, Problem Solving 4. Esteem Achievement, confidence, self-esteem, respect of others, respect by others 3. Belongingness and Love Family, friendship, sexual intimacy 2. Security Protection from elements, predators, enemies, diseases and uncertainty 1. Biological and Physiological food, water, air, warmth, sleep, procreation
Maslow hierarchy of
needs Energy Ladder
Table 1 Maslow hierarchy of needs and Energy Ladder
Along with the Maslow hierarchy, we introduce the Energy ladder model [4][7][8]: the energy ladder model was developed in 1987 by Hosier and Dowd’s to describe the relationship between energy sources used by households and their economic status: it foresees that, as income rises, households resort to fuels that occupy higher rungs in the ladder, i.e. cleaner, safer, healthier and more efficient ways to satisfy their needs. In other words, households with higher incomes prefer fuels with better Real Energy Value Added.
So far we have identified three tools which relate human needs, energy value added and income: let us try to delineate the relationship between them. Consider Table 1: we observe that climbing towards higher rungs of the Energy ladder, we meet higher-REVA energy sources which aligned with higher-level needs. Indeed, higher REVA fuels are efficient and clean resources that free individuals from a wider set of needs.
Hence, the key to progress is an effective energy plan based on high energy value added fuels. Nonetheless, comparing the energy consumption of developed countries (USA, Germany, France, England) and developing countries (India, China) with consumption of Sub-Saharan countries (e.g. Mozambique, Zimbabwe) we can clearly notice a substantial imbalance of per capita primary
energy consumption1; therefore we could suspect that “well being” effectively requires a lot of energy.
Then, how much energy is necessary for “a life of comfort”? Can we establish a conventional, indicative threshold for energy consumption corresponding to a suitable life-style?
To answer this questions we refer to the Human Development Index, HDI, as an indicator of “well-being” of a country [9]. It accounts for:
Longevity (Long and healthy life): life expectancy at birth;
Education: mean years of schooling and expected years of schooling; A decent standard of life: GNI (Gross National Income) per capita.
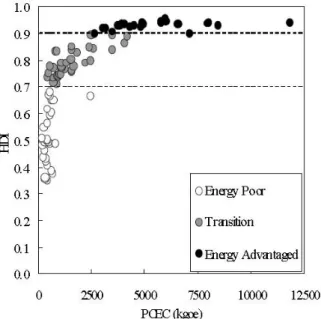
The HDI is mathematically defined as the geometric average of three indices, each coupled with one of the listed parameters (see the Technical Notes in reference [9] for the complete calculation). To improve our understanding of the link between energy and development, let us observe the HDI as a function of Per Capita Energy Consumption (PCEC), expressed in kilograms of oil equivalent, kgoe2, in Figure 1. Three regions are discernible:
a first, low-HDI steeply-rising region (until 0.7): short life expectancy, lack of a proper, well-structured education system and low incomes. The striking feature is the ease to move toward better standards of life from here; indeed, very small increments in PCEC are sufficient to drag these nations to the upper region;
a second, transition region, located next to the point of inflection (HDI 0.7 – 0.9)
a third, high HDI, flat region, where HDI seems to lose any dependence on the PCEC: it corresponds to a long life expectancy, a sturdy and variegated education system and high incomes. Conventionally, the threshold denoting the beginning of this region is set at 4000 kgoe per capita (most of the nations on the right, have HDI around or bigger than 0.9).
Figure 1 Human Development Index as a function of Pro Capita Energy Consumption
1
“Primary energy consumption measures the total energy demand of a country. It covers consumption of the energy sector itself, losses during transformation (for example from oil to electricity) and distribution of energy, and the final consumption by end-users. It excludes energy carriers used for non-energy purposes (such as petroleum not used for combustion but for producing plastic)” [63]
Despite HDI is a simple heuristic model, it outlines pretty reliably the global situation: comfort” require a finite amount of energy: it would be sufficient for each country to set a PCEC between 3000 and 5000 kgoe per capita to guarantee an adequate life expectancy, education and standard of life to the larger part of the population. It is impressive how much excess energy is spent by the energy-advantaged nations for a little improvement in quality of life.
In conclusion, our brief analysis shows that energy is actually a matter of REVA and services (that is comfort, needs):
low REVA energy sources don’t promote development: 1 J of such energy doesn’t provide an effective service and doesn’t induce a net improvement in consumers’ life style;
there is a threshold to comfort, i.e. basic human needs are sufficiently satisfied by a finite energy consumption, which, according to the HDI model is around 4000 kgoe per capita, and guarantees a long life expectancy, a sturdy and variegated education and high incomes.
1.1.2. HOW we do produce energy
Let us now dedicate some time to more technical issues: we will present two kinds of primary natural sources [10], Fossil fuels and Renewable Energy, (Nuclear Energy will be treated later in this chapter) discussing advantages and disadvantages of each.
Talking about possible alternatives that our planets (and our star) supplies to produce energy, the speech can easily become lengthy and prolix making comparisons uselessly complex and mazy. Hence, since my goal is to delineate a simple and clear landscape of the subject, I prefer to present the problem schematically, through the following tables.
Coal
Pros Cons
1. Abundance Substantial reserves
2. Affordability
Among the lowest-cost producers of electricity
3. Know-how
Well-developed technology
1. Low efficiency in conversion heat to electricity due to steam cycle: 35-40%
2. GREENHOUSE gas emission Large production of
3. Combustion-produced impurity emission (mostly filtered but still significant; moreover, filtering raises prices of current) harmful to humans + acid rains
4. Generation of millions of tons of waste (waste disposal problem)
11,4% of global Total Final Consumption 3
40% of global electricity is produced from Coal (mainly in China, USA and India) to which is related 28% of global carbon dioxide emission
Oil
Pros Cons
1. High Energy density
Perfect fuel for transportation
2. Availability
3. Price
Inexpensive compared to other liquids
1. GREENHOUSE gas emission Large Production of
2. Combustion-produced impurities emission Sulfure Dioxide and Trioxide, Carbon Monoxide, harmful to humans + acid rains
3. Limited reserves
At present rate of usage, current estimate for few decades
40% global Total final Consumption
4,3% of global electricity is produced from Oil
Natural Gas (mainly Methane)
Pros Cons
1. High efficiency in conversion heat to electricity: 50%-60% (combined cycles: steam + gas)
2. Possibility of building small units (100 MW): smaller initial investment + more rapid construction time
1. GREENHOUSE gas emission
Large Production of (even if less than Oil and Coal)
2. Limited reserves
At present rate of usage, current estimate for less than 100 years
15,1% of the Global Total Final Consumption
21% of global electricity is produced from Natural Gas (in USA, Russia and Islamic Rep. Of Iran)
33
Global end energy use, i.e. energy directly consumed by the final consumers (households, industry and agricolture), for instance through electricity, natural gas or gasoline, and excludes the energy used by the energy sector itself. [64]
References for the table above Fossil Fuels are [10] and [11]. In leaving fossil fuels, a couple of remarks are mandatory: a very weak point of such sources is the greenhouse gas emission, that, according to European statistics (shown in the next section) represents a significant contribution to climate change, hence, must be reduced as much as possible in the next decades. Moreover, most of the times the uneven distribution of fossil fuels around the world makes it a delicate and dangerous political question, often reason of unbalanced and unhealthy international relationships.
Let us now turn to renewable energies; in this case we can summarize the main advantages shared between hydroelectric, solar and wind power:
1. Clean Energy, no emission
2. High conversion efficiency: absence of thermal steam cycle 3. Infinite fuel reserves!
Hydroelectric
Pros Cons
1. Except in periods of severe drought, power is supplied continuously for base load electricity
2. Low cost (for operating and mantenance)
3. Reliability
(very little fluctuations in terms of electric power)
1. Most of suitable sites already used
2. Environment (Especially for local fauna)
3. High costs of construction for the dam (till 20 billion $)
16,4% of global electricity is produced from Hydropower (2016) [12]
Cons
Wind Solar
1. Fluctuations in wind strength
Blades shall be stopped both in case of weak wind and too strong wind to prevent mechanical damages. Actually a modern windmill produces about 35% of its maximum rated power [10]
2. Very low power intensity of wind
Need of a huge amount of windmills spread over very vast territories
1. Low efficiency of conversion
Quickly growing but still very low, 2. Low power density
It needs very vast areas (even if way smaller than wind power)
3. Expensive
mining, transporting and manufacturing
Very important for wind and solar
Still very challenging storing energy during optimal production times in order to compensate for scarce – productivity periods
1.1.3. Energy and Electricity in the EU, 2015
The European Union is a political and economic union of 28 countries (last accession was Croatia on July 1st, 2013) with a population of approximately 511.8 million citizens, i.e. 6.8% of the global population estimated at January, 1st, 2017.
The aim of this section is to set the scene of the choices made by the EU concerning energy: we will first discuss EU energy consumption and production, underlining the necessity of the union to import a significant slice of its energy needs.
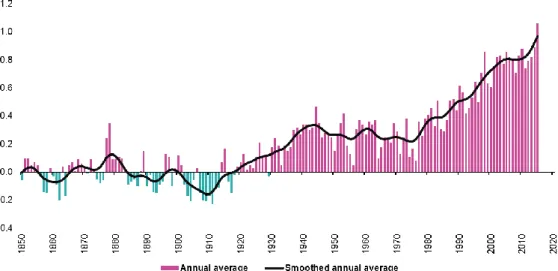
After a brief interlude about electricity, we then move to describe the future goals that the EU has set for the next decades related to the issue of the climate change, with a particular attention to the deadlines established for the 2020.
Data used in this section come from the Eurostat – Statistics Explained web page that is reference number [13].
Consumption
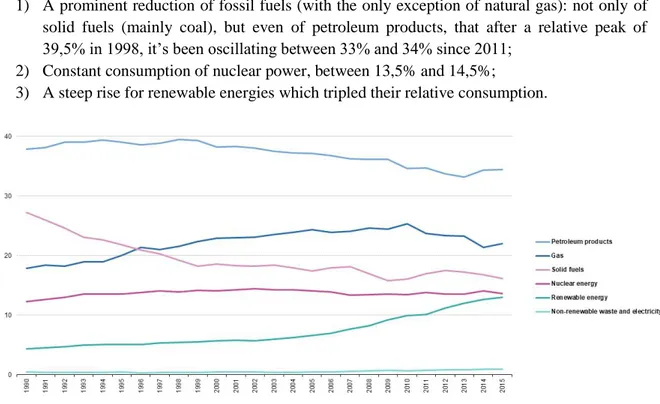
The Eurostat Glossary defines the gross inland consumption as “the quantity of energy necessary to satisfy inland consumption of the geographical entity under consideration. It covers: consumption by the energy sector itself; distribution and transformation losses; final energy consumption by end- users”. The gross inland energy consumption in the European Union in 2015 is 1627 Mtoe, that equals 12.4% of the global primary energy consumption. Germany has the highest level of gross inland energy consumption, 19.3% share of the total, followed by France (15.5%), UK (11.7%) and Italy (9.6%): these four countries together account for 56.1% of the whole European contribution [13].
The gross inland consumption per fuel is shown in Figure 2: three main trends clearly emerge: 1) A prominent reduction of fossil fuels (with the only exception of natural gas): not only of
solid fuels (mainly coal), but even of petroleum products, that after a relative peak of 39,5% in 1998, it’s been oscillating between 33% and 34% since 2011;
2) Constant consumption of nuclear power, between 13,5% and 14,5%;
3) A steep rise for renewable energies which tripled their relative consumption.