Image: Map of the World 2010 by Clemens Hasengschwandtner (https://www.saatchiart.com/Evilpainter) Graphic by Ing. Silvia Filz
Healthcare and disaster management:
a geographical approach
Doctoral dissertation presented by Martina Calovi
To
The Class of Social Sciences
For the degree of Doctor of Philosophy in the subject of Management: Innovation, Sustainability and Health Care
Curriculum: Change and Complexity Management
Supervisor: Chiara Seghieri Co-supervisor: Guido Cervone
Healthcare and disaster management:
a geographical approach
Martina Calovi
Supervisor: _____________________
Co-supervisor:__________________
Acknowledgment
I want to thank all the amazing people that have travelled with me, supporting, believing and encouraging me in this adventure.
Thanks to my supervisor Chiara Seghieri. The first day you have “chosen” me, hope you do not regret doing it. We have built up the path together, crossing all the difficulties and barriers that always tried to stop us. Thanks for your support, your understanding and thank you for always trusting me. I would like to express my special thanks to Prof. Cervone, who hosted me in his lab at the Pennsylvania State University. Thanks for all your support and the time you spent with me in discussing and thinking, guiding me through my doubts and fears.
I would also express my gratitude to Prof. Nuti for accepting and supporting me in these years. Thanks to all the members of the Management and Healthcare Laboratory of the Institute of Management at Scuola Superiore Sant’Anna. Thank you to Olga Wilhelmi for supporting me with suggestions and insights, for your patience and help in guiding me. Thank you to Luca Delle Monache e Stefano Alessandrini for your time and help. I want to express my heartfelt thanks to Prof. Francesca Chiaromonte for all what you did for me. Your academic and friendly support made me a stronger person. The last special thanks is for Prof. Michela Lazzeroni: you encouraged me since the first day of this adventure, supporting me academically and personally, as a special mentor, and I will always be grateful for all what you did for me.
I would like to thank my cohorts Giuseppe, Silvia, Ester, Emmanuel, Stefania, Jonathan, Chiara O., Chiara B., Gianluca, and Shanshan. I want to give special thanks to Chiara E.D.M. and Maral, for being able to understand and support me every time I need it, making me laughing and being objective and honest when I was losing my way. Big thanks to the GeoLab members, Laura, Yanan, Liping, Carolynne, Weiming, and Mehdi. Thanks for all your sincere support in one of my harder moments. Elena, thank you so much for being an amazing friend, always and over everything. Francesco, your smile has been my medicine and your big heart enlightened me every day we spent together. Sangeun, real friendship can cross all the world, thank you. Roberto, probably nobody helped me as you did when I really
needed it. I am grateful to have you as a friend. Cecilia thank you so much, without you this would have never happened. Thanks to Leonardo and Silvia for being always here for me. Many thanks to Benedetta, Alessandro, Cinzia, Paola, Michele, Chiara, Roberto, Silvia, Federico, Micol, Manuel, Paola, Elisa, Luca, Giulio, Michele, Alessandra, Beatrice, Adriano, and Alessandro for your never ending friendship. Thanks to Claudia, Riccardo, Beatrice, and Agata, our enlarged family is an anchor. Thanks to zia Lucia, zio Fulvio and Matteo, you are the best family I could ever deserve. Zio Gianpaolo, thank you for being always on my side, for teaching me to be curious and develop a critical mind.
Finally, I dedicate this dissertation to my parents and to Nicola. You three are my strength. Nicola, thanks for your endless love and encouragement, you are my rock and thanks to your unconditioned love and support that survived all the difficulties and the distances. Mom, Dad thanks for being so special and amazing parents, friends and guides; thanks for being always on my side in any challenge.
Martina Calovi
Table of Contents
List of Tables ... 4
List of Figures ... 5
Table of Abbreviations ... 7
1 Chapter 1. Introduction ... 10
1.1. What is the role of geography and Geographic Information System (GIS) in healthcare management and disaster management? ... 10
1.2. The concepts of accessibility and vulnerability in healthcare and disaster management ... 13
1.3. Summary of empirical papers... 20
1.4. Contribution of the dissertation... 23
1.5. Limitations and Future research ... 25
1.6. References ... 28
2 Chapter 2. Using GIS to support the spatial reorganization of Tuscan outpatient care services delivery ... 33
2.1 Introduction ... 33
2.2 Background ... 34
2.3 Methodology... 37
2.3.1 Data ... 38
2.3.2 Two-step floating catchment area method ... 41
2.3.3 Reorganization simulation ... 42
2.4 Results ... 43
2.5 Discussion ... 60
2.6 Conclusions... 63
2.7 Availability of Data and Materials ... 64
2.8 References ... 66
3 Chapter 3. Patient choice and proximity: outpatient cardiology visits in Tuscany, Italy ... 71
3.1 Introduction ... 71
3.2 Background ... 74
3.3 Materials and Methods ... 76
3.4 Results ... 80
3.5 Discussion ... 87
3.6 Acknowledgment ... 90
3.7 References ... 91
4 Chapter 4. Dynamic Downscaling of Extreme Temperature to better respond extreme heat events ... 96
4.1 Introduction ... 96
4.3 Data and study area ... 103
4.3.1 Past forecast ... 104
4.3.2 Past observation ... 105
4.3.3 Socio-demographic and economic ... 105
4.4 Method ... 106
4.4.1 Analog Ensemble ... 106
4.4.2 Downscaled Analog Ensemble ... 109
4.5 Results ... 112
4.5.1 Downscaled AnEn ... 112
4.5.2 Heat index ... 117
4.5.3 Socio-demographic simulation output ... 119
4.5.4 Accessibility to the cooling centers ... 123
4.5.5 Verification: statistical consistency ... 126
4.6 Discussion. ... 130
4.7 Conclusion ... 132
List of Tables
Table 2.1 Descriptive statistics ... 40
Table 2.2 Descriptive statistics: Spatial Accessibility Index ... 46
Table 3.1 Travel time and waiting time ... 81
Table 3.2 Patient characteristics ... 82
List of Figures
Figure 2.1 Standard deviational ellipse ... 45
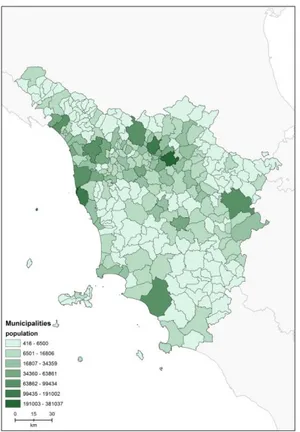
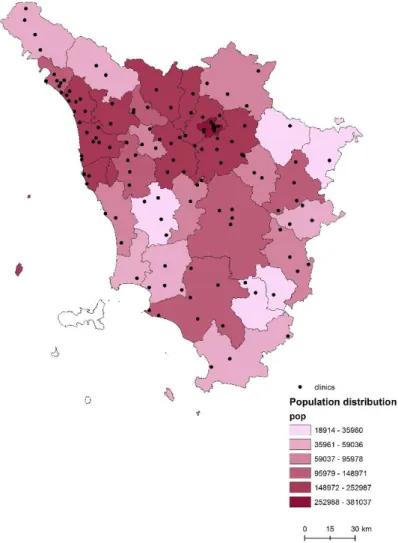
Figure 2.2 Population distribution ... 45
Figure 2.3 2015 outpatient visit coverage ... 45
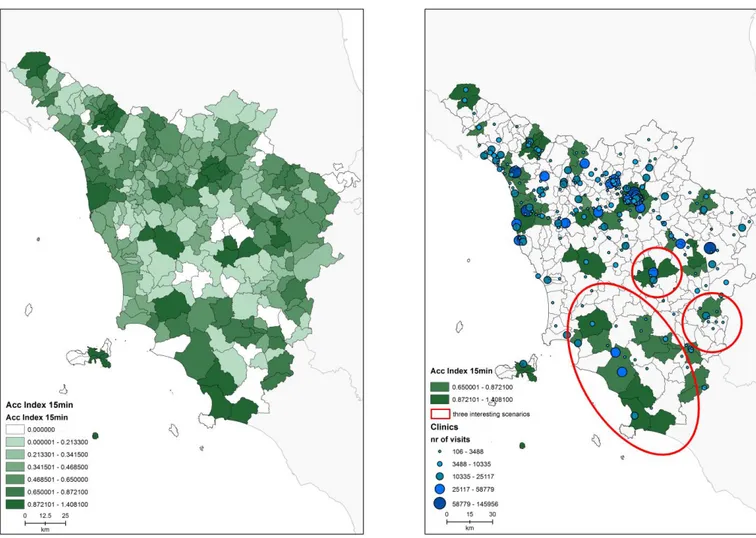
Figure 2.4 Potential spatial accessibility index within 15 minutes ... 47
Figure 2.5 Areas with a potential spatial accessibility index >= .65 ... 47
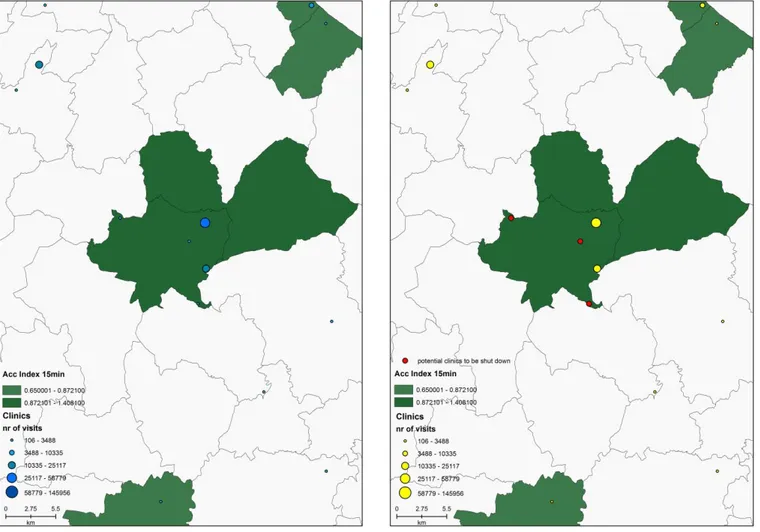
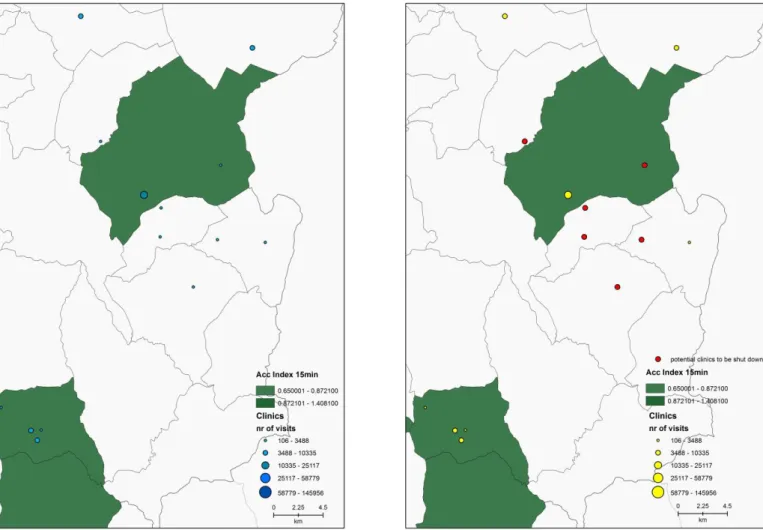
Figure 2.6 First scenario ... 49
Figure 2.7 Clinics involved in the simulation ... 49
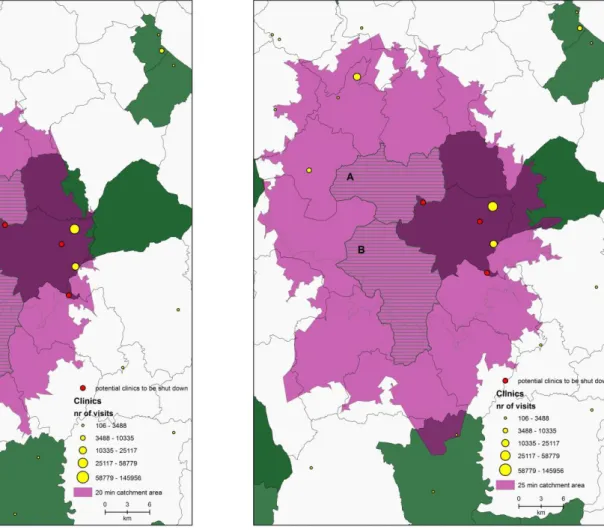
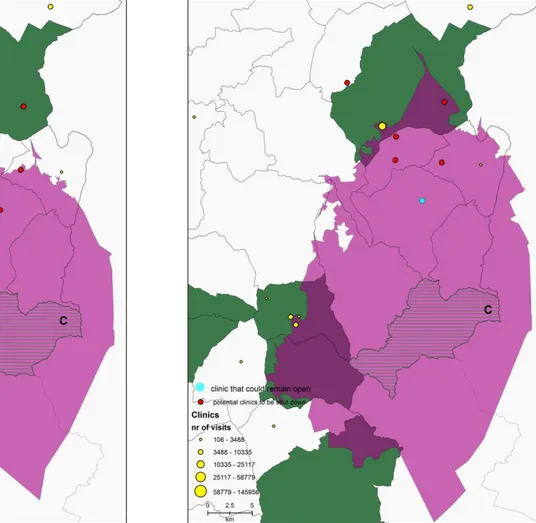
Figure 2.8 20 minutes catchment area ... 51
Figure 2.9 25 minutes catchment area ... 51
Figure 2.10 Second scenario ... 53
Figure 2.11 Clinics involved in the simulation ... 53
Figure 2.12 20 minutes catchment area ... 55
Figure 2.13 25 minutes catchment area ... 55
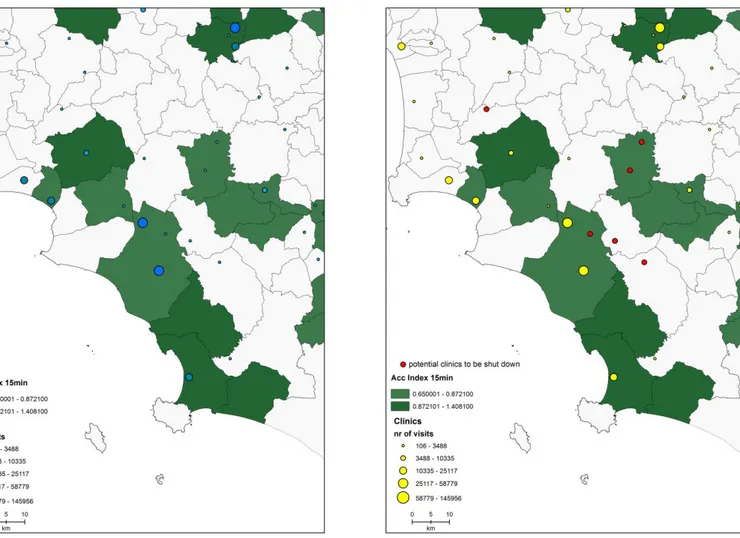
Figure 2.14 Third scenario ... 57
Figure 2.15 Clinics involved in the simulation ... 57
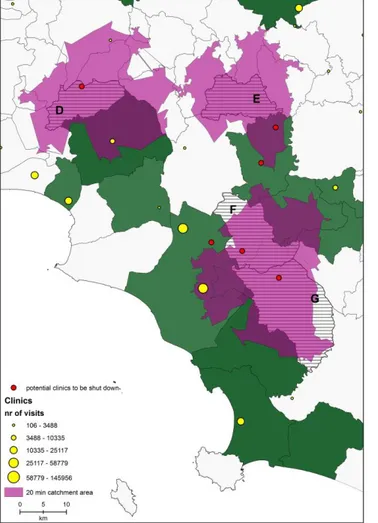
Figure 2.16 20 minutes catchment area ... 58
Figure 2.17 25 minutes catchment area ... 58
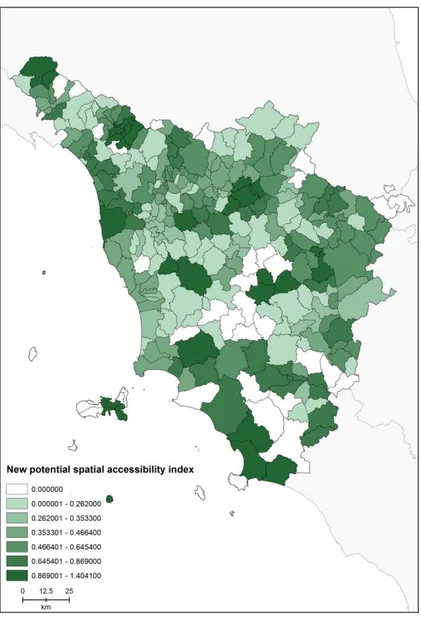
Figure 2.18 New potential spatial accessibility index within 15 minutes ... 60
Figure 3.1 Distribution of population and public providers (outpatient clinics) by health districts in Tuscany. Year 2015. ... 73
Figure 3.2 Patients over 65 years old ... 83
Figure 3.3 Median travel time (min) ... 83
Figure 3.4 Median waiting time (dd) ... 84
Figure 3.5 Coverage ... 84
Figure 3.6 Accessibility index ... 85
Figure 4.1 Schematic representation of the AnEn process at one forecast lead time ... 108
Figure 4.2 Examples of most matching ensemble given a current forecast
temperature and relative humidity ... 111
Figure 4.4 Bias correction for rare events ... 112
Figure 4.5 2016-08-10 AnEn forecast of the temperature of 2016-08-12 ... 115
Figure 4.6 2016-08-11 AnEn forecast of the temperature of 2016-08-12 ... 115
Figure 4.7 2016-08-12 AnEn forecast of the temperature of 2016-08-12 ... 116
Figure 4.8 Anen forecast of Heat Index ... 118
Figure 4.9 NOAA Heat Index chart ... 119
Figure 4.10 Temperature forecast ... 121
Figure 4.11 Population: 65 year old and older ... 121
Figure 4.12 Population: below poverty ... 121
Figure 4.13 Overlap: AnEn temperature and pop 65 years old and older ... 122
Figure 4.14 Overlap 2: AnEn temperature and pop below poverty ... 122
Figure 4.15 25% of the public libraries of Manhattan ... 125
Figure 4.16 5 mins walking distance ... 125
Figure 4.17 10 mins walking distance ... 125
Figure 4.18 Rank histograms: before and after the bias correction for rare events 127 Figure 4.19 Bias analysis ... 128
Figure 4.20 Correlation analysis ... 128
Figure 4.21 Spread-skill ... 129
Table of Abbreviations
2SFCA Two-step Floating Catchment Area AnEn Analog Ensemble
ATSDR Agency for Toxic Substances & Diseases Registry EHE Extreme Heat Event
EPA Environmental Protection Agency
ER Emergency Room
ESRI Environmental Systems Research Institute FLT Forecast Lead Time
GCM General Circulation Model GFS Global Forecast System
GIS Geographic Information System GP General Practioner
HI Heat Index
MAUP Modifiable Areal Unit Problem
NCAR National Center of Atmospheric Research NHS National Health Service
NIOSH National Institute for Occupational and Health NWP Numerical Weather Prediction
NWS National Weather Service NYC New York City
OD matrix Origin - Destination matrix PDF Probability Distribution Function PSU Pennsylvania State University PWS Private Weather Station
SVI Social Vulnerability index UHI Urban Heat Island
USGCRP U.S. Global Change Research Program VGI Volunteered Geographic Information WHO World Health Organization
WHO World Health Organization WU Weather Underground
1
Chapter 1. Introduction
“People often say that I'm curious about too many things at once... But can you really forbid a manfrom harboring a desire to know and embrace everything that surrounds him?”
Alexander Von Humboldt
1.1. What is the role of geography and Geographic Information System (GIS) in healthcare management and disaster management?
“Geography is the study of places and relationships between people and their environments.” The main goal of geographers is to explore and study both the physical properties of Earth’s surface and the human societies disseminate across it. Geographers are also interested in examine how human culture interacts with the natural environment, and the way that locations and places impact people (National Geographic1). Geography is a spatial way of thinking (Esri, 2008), that has as main
goal to understanding people and places, how they interact in the real world and their spatial distribution. Jerome E. Dobson, in his contribution to the essay on geography and GIS of ESRI, defined geography as “a dimensional science and humanity based on spatial logic in which locations, flows, and spatial associations are considered to be primary evidence of earth processes, both physical and cultural. Its hallmarks are spatial analysis, place based research (e.g., regional studies, area studies, urban studies), and scientific integration” (Esri, 2008).
Understanding the geography and the relationships between people and location, can help to make informed decisions about the way to live the planet (Esri, 2008). This understanding is nowadays an easier achievable goal, thanks to the technological progress advanced within geography as spatial science. Collecting, comparing, displaying big amount of data are becoming common actions thanks to the speed and power of technologies that have increased exponentially in the last
decades, increasing the efficiency of research endeavors (Esri, 2008; Johnston, 1999). Geographic Information system (GIS) are the “technological tools for comprehending geography and making intelligent decisions” (Esri, 2008). GIS allow to explore these dynamic connections between people, their health and well-being, and changing physical and social environments, through digital lenses (Cromley, Ellen J.; McLafferty, 2012). Computerized systems that allow for precise calculations of how things are distributed and relate to one another have made the study of geographic information systems an increasingly important specialty within geography (National Geographic1).
Geography makes place matter. Where people live and work have a great impact on their well-being. Understanding populations’ healthcare needs has become fundamental for National and regional Health Services, in order to be able to plan, manage and delivery appropriate and efficient care.
By the late 1960s (Musa et al., 2013), computer-mapping software started to revolutionize the discipline, catalyzing the development of modern automated mapping procedures, which allowed for information to be more readily and efficiently updated. Since that moment, GIS have been used in public health analyses in order to model where people live and the environments they experience or face throughout their lives (Cromley, Ellen J.; McLafferty, 2012). Traditionally, GIS have been also used to understand epidemiological pattern in spreading diseases, allowing the monitoring of their diffusion over space and time (Clarke et al., 1996). In this context, the use of GIS has becoming extremely useful in mapping and analyzing the geographical distribution of populations at risk, health outcomes, and risk factors, to explore their associations, and to address health problems. GIS are essential tools in targeting public health interventions to populations and places with greatest need and in designing effective strategies to improve population health (Cromley, Ellen J.; McLafferty, 2012; Dipti, n.d.; Fischer and Getis, 2010).
Higgs outlines some examples of the use of GIS in public health, including examining spatial patterns of disease, analyzing the potential impacts of noxious
facilities on trends in morbidity and mortality in local neighborhoods and the use of such tools in emergency planning and ambulance routing (Higgs, 2004). More in general, the increasing availability of GIS in health care organizations, together with the diffusion of spatially healthcare disaggregated data, has increased the number of research studies that have been concerned with developing measures of access to health care services in order to support decision making in health care and planning health services (Higgs, 2004).
Since the 90s, GIS are also used in disaster and emergency management, with the goal of reducing, or avoiding, the potential losses from hazards, assuring a prompt and appropriate assistance to the victims, and achieving a rapid and effective recovery. The disaster management cycle draws the ongoing process by which governments and civil (or military) society plan for and reduce the impacts of disasters, react during and immediately following a disaster, and take steps to recover after a disaster has occurred. The appropriate actions put in practice at all points of the cycle lead to a greater preparedness, to better warnings, to a reduced vulnerability or to the prevention of disasters. A complete disaster management cycle includes the specification of public policies and plans that mitigate the effects on people, property, and infrastructure2.
GIS represent key instruments in disaster and emergency planning, enabling managers and policy makers to model the events, understanding the potential incident effects, locate people or areas at-risk, identify natural and/or technological hazards, understand the geographic distribution of the incidents and plan mitigation actions (ESRI, 2006).
The disaster management process, composed by these four phases (mitigation, preparedness, response, and recovery), is known as the ‘life cycle’ of emergency management. The four phases do not always occur one at the time, or in this precise order. Often, the phases overlap and the duration of each phase depends on the
severity of the disaster. When a disaster strikes, key factors that can save lives are knowing what is needed and how to find it.
“Disaster management refers to social processes for designing, implementing, and evaluating strategies, policies, and measures that promote and improve disaster preparedness, response, and recovery practices at different organizational and societal levels” (IPCC, 2012).
The disaster management processes start when the immediacy of a disaster event is evident, and the need of resources and capacities to respond have to be put in place. Early warning system, contingency planning, emergency response and recovery are part of these processes. Disaster management processes are necessary because, even though prevention and mitigation actions have been applied, "residual" risks continuously damage and affect the society (IPCC, 2012).
Given these premises, the main objective of this contribution is to provide evidence on how GIS can support health care management and disaster emergency management in the organization of care service supply. The topic will be developed through the lenses of accessibility to outpatient services, simulating a reorganization of the system and analyzing the choices of the patients; and accessibility to the cooling centers that can be considered as first aid services that are open during an extreme heat emergency wave.
1.2. The concepts of accessibility and vulnerability in healthcare and disaster management
Spatial accessibility to healthcare services is the central theme of the thesis. The dissertation presents three different cases in which accessibility has been measured, applied and planned. Two of the three papers focus on accessibility to outpatient services and one to the care services that are open during extreme weather emergencies. The choice to focus on these type of care services is given by the will
of analyze care services at a level that can better meet the spatial needs of people and patients in both situations of emergency or not.
Looking at the concept of accessibility, it is already known that one of the still opened issue is the definition of access. The confusion, as stated by Guagliardo in 2004, is that the term refers both to the “potential for healthcare use” and “the act of using or receiving healthcare”, creating confusion between getting care, seeking care and actual delivery of care (Guagliardo, 2004).
The literature presents different scholars' interpretations of the term, the impedances referred to and the measure methods. In 1974, Aday and Andersen gave a political interpretation of the concept. They highlighted the power of evaluate the success of a health policy, or to predict the potentiality of a future one, considering together the economic and the organizational aspects (Aday and Andersen, 1974). According to them, a basic framework for the study of access starts from the understanding of the health policy objectives, through the characteristics of the healthcare delivery system and the characteristics of population at risk to end with an overview of the utilization of health services and the consumer satisfaction (Aday and Andersen, 1974). They referred to a geographic accessibility as “the friction of space, function of the time and physical distance that must be traversed to get care”.
Penchansky and Thomas defined access as the degree of “fit” between the needs of the patients and the ability of the system to meet those needs (Penchansky and Thomas, 1981). Their model focused on five dimension of access (availability, accessibility, accommodation, affordability and acceptability) that influence the use of health services. They argued that accessibility is “the relationship between the supply and demand locations that took into account patients transportation resources and travel time, distance and cost” (Penchansky and Thomas, 1981). To stress this idea, Penchansky and Thomas recalled Donebian definition of access (1973), that pointed out as the geographical accessibility deals with the location of services and the impact of consumer travel time, distance, cost and effort on use (Penchansky and Thomas, 1981).
Extending Penchansky and Thomas and quoting Donebian’s frameworks, in 1992 Frenk suggested that a fit adjustment between resources, population need and demand was needed (Ricketts and Goldsmith, 2005). He re-conceptualized the domain of the terms access, availability and accessibility, defining access as the “ability of a person to utilize healthcare given a need and/or desire to obtain it”, while availability as “the existence of healthcare resources while taking into account their productivity, or ability to produce healthcare services” (Ricketts and Goldsmith, 2005). Accessibility means to Frenk “the degree of adjustment between the characteristics of healthcare resources and those of the population within the process of seeking and obtaining care” (Levesque et al., 2013).
Measuring the access to healthcare services is a major concern for the NHSs and an important concern for this thesis. Khan stressed a lot the question of measuring the access to healthcare services. He argued that a measure of potential access has to have the focus on evaluating and monitoring of “the performances of a regional healthcare service system” (Khan, 1992). Within Khan’s framework, access is the “outcome of a process, determined by an interplay between the characteristics of the healthcare service system and the characteristics of the population at risk, moderated by healthcare related public policy planning efforts (Khan, 1992)”. He introduced the concept of potential and realized access and more, integrating spatial (geographic) and aspatial (social) factors. His attention was focused on potential spatial access, that “should reflect the relative availability of pertinent healthcare services to it, as moderated by the distance variable and subarea population size” (Khan, 1992). Thanks to this framework it is possible to categorize accessibility in potential spatial accessibility, potential non-spatial accessibility, revealed spatial accessibility, revealed non-spatial accessibility (Luo and Whippo, 2012).
In 2002 M. Gulliford et al., suggested that access should be measured by taking into account at least four dimensions, distinguishing among ‘having access’ and ‘gaining access’. ‘Having access’ requires an adequate supply of health services available, and it is handled when patient wants and needs to obtain care (Gulliford et al., 2002).
‘Gaining access’ indicate the start into the healthcare process of using a service and it depends on barriers that limit its use, like financial, organizational, social and cultural barriers (Gulliford et al., 2002).
In 2004, Guagliardo recalled the concepts of potential and realized access, stating that the first exists when population needs coexist in space and time with the ability of the healthcare system to deliver the services, and the latter take place when all the provision barriers have overcome (Guagliardo, 2004).
Scholars have committed to determining healthcare access, and have recognized the importance of the spatial dimension. Gautam et al., in 2014, talking about US said that “effectively evaluating spatial healthcare disparity is crucial to improve health care access” (Gautam et al., 2014).
Nowadays, the importance of measuring the spatial access to care services is well known and recognized. Guatam et al. claimed out that this kind of measures are important tools that can help healthcare managers in the provision of the services and in the reduction of the spatial inequalities (Gautam et al., 2014).
As healthcare systems have become more complex, so have the issues of access to healthcare services (Phillips et al., n.d.). Making decisions based also on spatial information, become basic knowledge to manage and plan correctly efficient healthcare systems. The use of GIS applied specifically to the knowledge of accessibility, are particularly useful to inform policy makers about where population needs are not covered by the local supply (Ngui and Apparicio, 2011), or where there might be an oversupply.
The third paper, beyond introducing accessibility simulation to cooling centers during extreme heat events in Manhattan, New York, it also introduces the concept of vulnerability. The World Health Organization defines vulnerability as “the degree to which a population, individual or organization is unable to anticipate, cope with, resist and recover from the impacts of disasters” (WHO, 2002).
The power role of GIS is visualization; allow everybody to see where phenomena truly happen in the real space. According to this, GIS help in visualize where vulnerable populations are, identify the location of community resources, enable disease surveillance and connect community stakeholders. Poverty and hazard vulnerability are often closely related, as the poor often lack assets and entitlements that could allow them to be resilient as other groups (Kasperson and Kirstin, 2005).
There is a large literature on natural and human made hazards, but they do not directly engage with this dissertation. In this thesis, I will focus on urban vulnerability to extreme weather events and specifically heat waves. Vulnerability to climate change is the result of a complicated interconnection that exists between socio-economic and climatic dynamics. The uncertainty and the changing conditions that characterize the present world because of the climate changes affect the vulnerability and pose continuous challenges to the societies and to the environments they live. Reduce and mitigate the effects, improve the awareness and the resilience of the population to extreme weather disaster are the key actions that can help to avoid the most harmful outcomes of an hazard (Boero et al., 2015; Ebi, 2011; IPCC, 2012).
Thomalla et al in 2006 well drawn the four research and policy communities that has been taken the challenge of reducing socio-economic vulnerability to climate and weather-related hazards. These are I. disaster risk reduction; II. Climate change adaptation; III. Environmental management; and IV. Poverty reduction (Thomalla et al., 2006). Climate change and the frequency of extreme events threaten to weaken the efforts made so far in development assistance, poverty reduction and disaster risk management, undermining many societies that are not well prepared to cope with this conditions (Thomalla et al., 2006).
Social vulnerability and social ability of individuals and communities to be prepared, to be able to cope with, and be able to recover from a disaster, are directly conditioned by the complex interactions of social, economic and environmental factors at all given spatial and temporal scales (Thomalla et al., 2006). Many of the
people that live at the margins of the society or in poverty are strictly dependent on ecosystem services for their survival. For this reason, they are completely vulnerable to these environmental changes and to the factors that can affect and limit their access to essential resources. Also their access to financial resources, information and technology, as well as by the effectiveness of institutions could determine their level of vulnerability (Author et al., 2000; IPCC, 2012; Smit and Pilifosova, 2001; Thomalla et al., 2006).
The most vulnerable have been recognized in specific groups: women, elderly, children, ethnic and religious minorities, single-headed households, people engaged in marginal livelihoods, socially excluded groups, those with inadequate access to economic and social capital, and if related specifically to extreme heat events, to these we should add also outdoor workers and people with chronic medical conditions. Experts in disasters have focused their efforts on technological advances in climate monitoring and short-term forecasts in order to improve warning-response-relief models able to efficiently disseminate hazard information and saving lives (Thomalla et al., 2006).
Many different actors are involved and have responsibilities in the prevention of climate related health risks, among which single individuals, communities, governments and national agencies. To improve the resilience of all the actors, top-down and bottom-up actions are need, such as disaster risk management programs able to identify the risks produced by climate change, the underlying socioeconomic consequences, the geographic areas and all the vulnerabilities that affect the extent and magnitude of impacts (Ebi, 2011).
In the Special Report of the Intergovernmental Panel on Climate Change of 2012, the disaster risk management has been defined as “the processes for designing, implementing, and evaluating strategies, policies, and measures to improve the understanding of disaster risk, foster disaster risk reduction and transfer, and promote continuous improvement in disaster preparedness, response, and recovery practices, with the explicit purpose of increasing human security, well-being, quality
of life, and sustainable development” (IPCC, 2012). Resilience instead, is “the ability of a system and its component parts to anticipate, absorb, accommodate, or recover from the effects of a hazardous event in a timely and efficient manner, including through ensuring the preservation, restoration, or improvement of its essential basic structures and functions” (IPCC, 2012).
In the Report (IPCC, 2012), is stated that when there is the presence of deeply uncertain long-term climate changes and vulnerability, disaster risk management and adaptation may be advanced by dealing adequately with the present conditions, anticipating the future potential climate changes, and promoting effective ‘no-regrets’ approaches. A well-prepared and robust risk plan that encompasses and looks beyond the current situation with respect to hazards and vulnerability will perform over a wide range of plausible climate changes.
It is well known that nowadays climate changes increase the frequency and the intensity of weather events at all the scales (Boero et al., 2015), affecting the uncertainty levels and the possibility of the cities to grow healthy and safe environments. The study presented in chapter 4 presumes that an enhancement in extreme weather events forecast could entail improvements of the resilience of urban populations to extreme temperature events. This thesis bases on the assumption that social inequalities highly affect the vulnerability and the resilience, attacking the ability to cope with the impacts of an extreme weather event when there are social inequalities (Neher and Miola, 2015).
To build a community able to cope with weather related disasters, it is needed to recognize and identify both the risks and the vulnerabilities, in order to help decision makers, public health community, and the population to manage the situation, avoiding the worst-case scenarios.
1.3. Summary of empirical papers
This section provides a brief overview of the three papers and the respective research questions they address. The aim of each papers presented is to descend the concepts of healthcare, health and disaster management through the geography's lenses and instruments.
Paper 1: Using GIS to support the spatial reorganization of outpatient care services delivery
The first paper is my earliest approach to the theme of access to healthcare services. Studying and measuring accessibility to care services has become a major concern for healthcare management, in particular during the financial crisis, with the objective of increasing the service efficiency, while keeping the central attention on patients and their needs. This study focuses on Tuscany a region in central Italy that is re-organizing its inpatient and outpatient systems in line with new government regulations. The principal aim of the paper is to illustrate the usefulness of GIS methods with real-world scenarios in order to provide support to evidence-based planning and resource allocation in healthcare.
Spatial statistics and geographical analyses were used to provide healthcare policy makers with a real scenario of the accessibility to outpatient clinics. Measures of geographical potential spatial accessibility index using the two-step floating catchment area method for outpatient services in 2015 were calculated and used to simulate the rationalization and reorganization of outpatient services. Various parameters, including distance to outpatient clinics and volumes of activity, were taken into account. The study addresses the question of “How can GIS support the healthcare management in the reorganization, redesign and planning of healthcare services?”.
A spatial accessibility index and a simulation of the reorganization of outpatient care delivery are presented through three cases, which highlight three interesting scenarios from the managerial point of view. The findings provide support for the regional healthcare managers in re-defining a more equitable geographical distribution of care providers, reducing costs and minimizing oversupply by maintaining the same level of quality.
A GIS-based approach was designed to provide support to healthcare management and policy makers in defining evidence-based actions to guide the reorganization of a regional healthcare delivery system. The results revealed those municipalities where health policy makers could consider a new spatial location, a shutdown or a fusion of selected outpatient clinics while ensuring equity access to services. The analysis provides an example of the use of GIS as a valuable instrument enabling decision-makers to examine questions of healthcare needs, access, and availability.
Paper 2: Patient choice and proximity: the case of outpatient cardiologist visit in a large Italian region
The second paper, rethinks the accessibility in terms of patients’ choice, investigating the role of proximity. A rational investigation of the choices taken by the patients will allow the care managers to operate on the basis of reliable observations in order to better allocate the resources and make the system more efficient.
Most of the literature focuses on inpatient system studying hospitals’ choices in competitive contests, while this study focuses on outpatient clinic system of Tuscany Region (Italy), characterized by a non-competition system, addressing the research question: “What are the clinics and socio-demographic characteristics' that explain patients’ choice of outpatient services?”.
The dataset used is the 2015 individual-level administrative care outpatient. The study uses conditional logistic regression to investigate patients' choice to visit
non-emergency outpatient cardiovascular specialists in Tuscany. We concentrate on the effects of travel time, accessibility, waiting time and patient characteristics. Results reveal that patients give importance to proximity, and prefer clinics with a lower accessibility index despite the longer waiting times. Differences in patient choice depend on sex, age and socioeconomic conditions, thus highlighting gaps in the access of non-acute services. Our results could be used to optimize the allocation of resources, reduce inequities and increase the efficiency and responsiveness of outpatient systems.
Paper 3: Dynamic Downscaling of Extreme Temperature to better respond extreme heat events
The third paper, look at the accessibility to the cooling centers, opened when an extreme heat wave occurs in Manhattan, New York City.
According to the World Health Organization, heatwaves are among the most dangerous natural hazards affecting millions of people worldwide. In the United States, heatwaves (a.k.a. extreme heat events) have the highest average mortality rate of all weather related events. Despite this, heatwaves do not receive widespread preparedness as other weather related hazards such as hurricanes or flash flood. This is particularly true for increasingly urbanized cities where the population is most at risk because of the lack of natural cooling area.
This study investigates the use of satellite remote sensing data and volunteered geographic information to develop a framework to improve the resilience of the urban population to extreme heat events. The goal is to develop a dynamic downscaling algorithm based on the Analog Ensemble (AnEn) method to generate accurate, well calibrated, high spatial and temporal resolution probabilistic forecast of extreme temperature events. Given a single current deterministic atmospheric forecast, a set of historical forecasts and their associated observed values from personal weather
stations, a new probabilistic prediction is made by creating analogs of past observations at multiple locations.
Specifically this work will generate daily forecasts of temperature at high spatial and temporal resolutions for Manhattan area, New York City using two datasets. The first is the Global Forecast System, used to obtain a coarse resolution deterministic atmospheric forecast of the study region. The second is a series of personal weather station observation data obtained from Weather Underground. The result is a high resolution probabilistic forecast at each of the available weather stations. Lastly, the output is combined with socioeconomic and healthcare data to better understand population vulnerability patterns, health risks related to exposure to extreme heat conditions, and address the knowledge gap in urban vulnerability. An accessibility simulation to the cooling centers has been run, in order to understand the spatial distribution pattern of these services. This understanding will allow to support and improve current operational risk management techniques, and propose new practical solutions to better prepare for extreme heat events.
1.4. Contribution of the dissertation
This section outlines the key findings of the dissertation, summarizing the contributions of the three papers. The dissertation contributed to the healthcare management literature in exploring the accessibility to outpatient services of Tuscany Region, Italy; and to the disaster management literature implementing a downscaling algorithm based on the Analog Ensemble method and subsequently studying the accessibility to the cooling center in Manhattan, New York City, US.
In chapter 2, the 2 step-floating catchment area (2SFCA) method has been used to measure the accessibility to the regional outpatient healthcare services at the municipality level. To my knowledge, it is the first example of this measurement applied to a regional outpatient system in Italy. The project was born within the context of the Italian healthcare reform, which had the goal of returning an inpatient
and outpatient more efficient delivery system that reflected the real needs of the population and guaranteed equal access to quality care for the whole population. The study is built on the certainty that a reform should be based on solid evidence based prior assessments, demonstrating the advantages of the application of GIS within the decision making process, helping healthcare planners in taking into account the impacts of health policy from a geographical point of view.
Chapter 3, analyzes the outpatient care delivery system through the choices of the patients that need a cardiological specialized visit. The study uses the 2SFCA method, analyzed and well learned in chapter 2, to measure the potential accessibility index of each health districts to the outpatient services that delivers cardiological visits. The innovative idea of this study is to use the index as one of the variable that can affect the choices of the patients. No other research studies have taken the challenge to understand if the accessibility, as an index that identifies if in the health district there is a lack of supply, could affect patients’ choice.
Chapter 4, draws an innovative framework that revise the Analog Ensemble (AnEn) method in order to downscale the GFS model measurements to a more finest scale, using Volunteer Geographic Information data obtained directly from the web, in order to forecast at a higher spatial and temporal resolution extreme weather events. The high-resolution maps obtained from the AnEn, are used in combination with socio-demographic data, to understand where the most vulnerable groups of people live and simulate the accessibility to the cooling centers. The entire study is a novelty. Findings of this study contribute to the weather forecast science and to the disaster management science, enriching the knowledge in the operational risk management techniques, generating improvements in the preparedness and respond phases to an extreme weather hazard.
These findings advance the geographical knowledge-based, helping in respond to the main goal of the thesis of demonstrating the role of geography in the two research fields here discussed. Jack Dangermond, the co-founder of Environmental Systems Research Institute (ESRI), well summarizes the key role of GIS, that this
thesis wants to highlight claiming, “GIS is the only technology that actually integrates many different subjects using geography as its common framework”.
1.5. Limitations and Future research
This dissertation has some limitations that also create opportunity for further future research.
The first limitation is attributable to the geographical limitation of the three cases presented. Both the first and the second paper analyze the outpatient services system of Tuscany Region, limiting the studies to only one regional case. The third study analyzes the suburb of Manhattan, focusing only on this area of the city of New York.
Enlarging the study areas of the three case, could offer the possibility to further researches, expanding even more the knowledge about healthcare and disaster management. The two cases that present the reorganization of the outpatient services and the patients’ choices of cardiological specialized clinics could be compared with other Italian regional systems. Italian Regions are in charge of managing their health sector, creating a differentiation among the systems; in this context, comparison could allow to understand similarities and differences, underlining which strategies have been put in place to respond to the patients’ needs.
Chapter 3 focuses only on Manhattan. The choice of using the Global Forecast System, also if it is not the model with the highest resolution is given by the fact that GFS model, as suggested by his name, is a global model and its forecasts cover all the world. The same thought has been made in the choice of the non-authoritative data. Weather Underground stations are spread all over the world, and their diffusion is enormously increasing day after day, allowing the sharing and freely downloading of data across the world.
Dealing with geographical data means also having issues related to the scale of the data and especially with public health analyses, an important consideration that need to be evaluate is the Modifiable Areal Unit Problem (MAUP) (Openshaw, 1984). In this context, limitations for the first two papers, gather also from the administratively derived nature of the public health data used. The MAUP is “a problem arising from the imposition of artificial units of spatial reporting on continuous geographical phenomena resulting in the generation of artificial spatial patterns” (Heywood et al., 1998). It relates to the geographical concern that results change as the boundaries of units of analysis change and to the aggregation of data. In the first paper, the analyses have been run at the municipality’s level, which is the smallest administrative level of the Region. The second paper has been analyzed at health district level, considerate as the optimal geographical area to assess the health and social needs of the community taking into account the organization and delivery of health services branch networks, integrated health and social partner.
In both the cases, it has been used the finer scale area units possible to the study purposes. The validity and credibility of the data used and the valuable findings achieved, allow to control and overcome this unit problem.
The climate change adaptation community stresses how improvements in the ability of predict the magnitude, the frequency of extreme and severe events will enable to provide communities with more effective adaptation strategies, and how improving current forecasts, coping better with present climatic risks, could help the communities in being better prepared to reduce the impacts in the future. In this context, research and development in hazard forecast and early warning system are more important than ever. Despite this, in part I agree with the group of scientific community that critically comment these dissertations, because it is still not clear how better information can reduce vulnerability (Bharwani et al., 2005; Thomalla et al., 2006), but the robustness of the obtained results in the third paper, highlights the importance of high resolution forecasts in saving lives.
The call for future healthcare research and disaster management research through the geographical lenses is renovated, knowing that the strong interconnections of these sciences cannot allow them to be studied separated anymore.
1.6. References
1. Aday, L.A., Andersen, R., 1974. A Framework for the Study of Access to Medical Care. Health Serv. Res. 9, 208–220.
2. Author, C., Cutter, S.L., Mitchell, J.T., Scott, M.S., 2000. Revealing the Vulnerability of People and Places: A Case Study of Georgetown County, South. Source Ann. Assoc. Am. Geogr. 90, 713–737. doi:10.1111/0004-5608.00219
3. Bharwani, S., Bithell, M., Downing, T.E., New, M., Washington, R., Ziervogel, G., 2005. Multi-agent modelling of climate outlooks and food security on a community garden scheme in Limpopo, South Africa. Philos. Trans. R. Soc. B Biol. Sci. 360, 2183–2194. doi:10.1098/rstb.2005.1742
4. Boero, R., Bianchini, L., Pasqualini, D., 2015. Vulnerability and adaptation to severe weather events in the American southwest. Weather Clim. Extrem. 8, 12–25. doi:10.1016/j.wace.2015.04.002
5. Clarke, K.C., McLafferty, S.L., Tempalski, B.J., 1996. On Epidemiology and Geographic Information Systems: A Review and Discussion of Future Directions. Emerg. Infect. Dis. 2, 85–92. doi:10.3201/eid0202.960202
6. Cromley, Ellen J.; McLafferty, S.L., 2012. GIS and Public Health, 2nd editio. ed.
7. Dipti, M., n.d. Role of GIS in Healthcare Management. Dept.of Geography, University of Mumbai, Mumbai.
8. Ebi, K.L., 2011. Resilience to the health risks of extreme weather events in a changing climate in the United States. Int. J. Environ. Res. Public Health 8, 4582–4595. doi:10.3390/ijerph8124582
9. Esri, 2008. Essays on Geography and GIS. Esri Press 5, 82.
10. ESRI, 2006. The Role of GIS Services , Data and Portals in Disaster Management – Planning , Response and Recovery, in: Seventeenth United Nations Regional Cartographic Conference for Asia and the Pacific Bangkok,
18-22 September 2006 Item. United Nations.
11. Fischer, M.M., Getis, A., 2010. Handbook of applied spatial analysis: Software tools, methods and applications. doi:10.1007/978-3-642-03647-7
12. Gautam, S., Li, Y., Johnson, T.G., 2014. Do alternative spatial healthcare access measures tell the same story? GeoJournal 79, 223–235. doi:10.1007/s10708-013-9483-0
13. Guagliardo, M.F., 2004. Spatial accessibility of primary care: concepts, methods and challenges. Int. J. Health Geogr. 3, 3. doi:10.1186/1476-072X-3-3
14. Gulliford, M., Figueroa-Munoz, J., Morgan, M., Hughes, D., Gibson, B., Beech, R., Hudson, M., 2002. What does “access to health care” mean? J. Health Serv. Res. Policy 7, 186–188. doi:10.1258/135581902760082517
15. Higgs, G., 2004. A Literature Review of the Use of GIS-Based Measures of Access to Health Care Services. Health Serv. Outcomes Res. Methodol. 5, 119–139. doi:10.1007/s10742-005-4304-7
16. IPCC, 2012. Managing the Risks of Extreme Events and Disasters to Advance Climate Change Adaptation. doi:10.1017/CBO9781139177245
17. Johnston, R.J., 1999. Geography and GIS. Geogr. Inf. Syst. Vol. 1 Princ. Tech. Issues 39–48.
18. Kasperson, R., Kirstin, D., 2005. Vulnerable peoples and places, in: Richard Norgaard, D.R. (Ed.), Ecosystems and Human Well-Being: Current State and Trends : Findings of the Condition and Trends Working Group. pp. 143–164. doi:10.1016/j.fm.2010.10.016
19. Khan, A.A., 1992. An integrated approach to measuring potential spatial access to health care services. Socioecon. Plann. Sci. 26, 275–287. doi:http://dx.doi.org/10.1016/0038-0121(92)90004-O
20. Levesque, J.-F., Harris, M.F., Russell, G., 2013. Patient-centred access to health care: conceptualising access at the interface of health systems and
populations. Int. J. Equity Health 12, 18. doi:10.1186/1475-9276-12-18
21. Luo, W., Whippo, T., 2012. Variable catchment sizes for the two-step floating catchment area (2SFCA) method. Heal. Place 18, 789–795. doi:10.1016/j.healthplace.2012.04.002
22. Musa, G.J., Chiang, P.-H., Sylk, T., Bavley, R., Keating, W., Lakew, B., Tsou, H.-C., Hoven, C.W., 2013. Use of GIS Mapping as a Public Health Tool - From Cholera to Cancer. Heal. Serv. Insights 6, 111–116. doi:10.4137/HSI.S10471.TYPE
23. Neher, F., Miola, A., 2015. The role of social inequalities for the vulnerability to climate related extreme weather events. doi:10.2788/267540
24. Ngui, A.N., Apparicio, P., 2011. Optimizing the two-step floating catchment area method for measuring spatial accessibility to medical clinics in Montreal. BMC Health Serv. Res. 11, 166. doi:10.1186/1472-6963-11-166
25. Openshaw, S., 1984. The Modifiable Areal Unit Problem, Geobooks. ed. Norwich, England.
26. Penchansky, R., Thomas, J.W., 1981. The concept of access: definition and relationship to consumer satisfaction. Med. Care 19, 127–140. doi:10.2307/3764310
27. Phillips, D.R., Rosenberg, M.W., Wilson, K., n.d. The Geography of Health Care Systems. Med. Sci. ©Encyclopedia Life Support Syst. 1.
28. Ricketts, T.C., Goldsmith, L.J., 2005. Access in health services research: The battle of the frameworks. Nurs. Outlook 53, 274–280. doi:10.1016/j.outlook.2005.06.007
29. Smit, B., Pilifosova, O., 2001. Adaptation to Climate Change in the Context of Sustainable Development and Equity, in: McCarthy, J.J., O Canziani, N A Leary, D.J.D. and K.S.W., Press), (Cambridge: Cambridge University (Eds.), Climate Change 2001: Impacts, Adaptation and Vulnerability. Contribution of
the Working Group II to the Third Assessment Report of the Intergovernmental Panel on Climate Change. pp. 877–912.
30. Thomalla, F., Downing, T., Spanger-Siegfried, E., Han, G., ..., 2006. Reducing human vulnerability to climate-related hazards: Towards a common approach between disaster risk reduction and climate adaptation. Disasters 30, 39–48. 31. WHO, 2002. Environmental health in emergencies and disasters. A practical
2
Chapter 2. Using GIS to support the spatial reorganization of
Tuscan outpatient care services delivery
2.1 Introduction
Studying and measuring accessibility to care services has become a major concern for health care management, in particular during the financial crisis. This study focuses on Tuscany a region in central Italy that is re-organizing its inpatient and outpatient systems in line with new government regulations. The principal aim of the paper is to illustrate the usefulness of GIS methods with real-world scenarios in order to provide support to evidence-based planning and resource allocation in healthcare.
Spatial statistics and geographical analyses were used to provide health care policy makers with a real scenario of the accessibility to outpatient clinics. Measures of geographical potential spatial accessibility index using the two-step floating catchment area method for outpatient services in 2015 were calculated and used to simulate the rationalization and reorganization of outpatient services. Various parameters, including distance to outpatient clinics and volumes of activity, were taken into account.
The spatial accessibility index and the simulation of the reorganization of outpatient care delivery are presented through three cases, which highlight three interesting scenarios from the managerial point of view. The findings provide support for the regional health care managers in re-defining a more equitable geographical distribution of care providers, reducing costs and minimizing oversupply by maintaining the same level of quality.
A GIS-based approach was designed to provide support to healthcare management and policy makers in defining evidence-based actions to guide the reorganization of a regional health care delivery system.
The results revealed those municipalities where health policy makers could consider a new spatial location, a shutdown or a fusion of selected outpatient clinics while ensuring equity access to services. The analysis provides an example of the use of GIS as a valuable instrument enabling decision-makers to examine questions of health care needs, access, and availability.
2.2 Background
In order to tackle the financial pressure stemming from the economic crisis in Europe (2008-date), and with the growing proportion of the elderly population (24% aged 60 or over) (Melorose et al., 2015), policy makers are increasingly focusing on finding an acceptable balance between adequate cost control measures and ensuring that the population continues to receive high-quality, appropriate and efficient care (Mladovsky et al., 2012).
The European Observatory suggested that policy makers need to examine which tools respond best, and to consider the impact of the reforms they propose to achieve better health system goals (Mladovsky et al., 2012) including financial protection, efficiency, equity, quality, responsiveness, transparency, and accountability (Clemens et al., 2014),(Mladovsky et al., 2012).
The Italian national health system follows the Beveridge model [(Beveridge, 1942; Musgrove, 2000)] and provides universal coverage for comprehensive and essential health services through general taxation, recognizing health as the fundamental right of individuals and a collective interest of society. In the early 1990s, national reforms began transferring several key administrative and organizational responsibilities from central government to the 20 Italian regional administrations in order to make regional authorities more sensitive to controlling expenditure and promoting efficiency, quality, and patient satisfaction. The regional administrations are now responsible for organizing and delivering health services through local health units (G. Palmisano and G. Nastasi, 2015).
Like other EU countries, Italy has taken legislative measures and implemented a set of policy initiatives to respond to the economic crisis, through agreements between the national and regional governments, health pacts, and through annual finance acts and other legislative measures to control public spending (G. Palmisano and G. Nastasi, 2015). The overall aim is rationalize and reorganize the health services by defining the quality, structural, and technological standards including the expected catchments area for each care discipline, and volume thresholds for specific surgical procedures (Health Minister Decree 20 April 2015). Regional governments are therefore attempting to balance the need for national standards, while providing an equitable geographical resource distribution.
Given these premises, the main objective of this research is to provide evidence on how a geographical information system (GIS) can be used to support health care management in the reorganization of care service delivery, by computing and analyzing spatial access to outpatient services relative to the demand.
Esri, the international supplier of GIS software, offer a new geographical approach to management3, which is fundamental in understanding what the current situation and
what might happen in the future. Most phenomena can be described spatially. GIS can be effectively used as a decision support system, above all in urban planning, transportation, energy and resource analyses. GIS technology highlights the relationships that exist between different kinds of data, enabling complex data to be interpreted in an easy and more realistic manner (Valentin Petru Măzăreanu, 2013). Over the last few decades, GIS has also become essential for healthcare management, where understanding the spatial distribution of services is important for the efficiency of the care delivery organization, whist providing citizens with healthcare services that best respond to their needs.
There is an abundant literature on the use of GIS technology in epidemiology, which traditionally analyzes the relationships between locations, environments and diseases, the distribution of diseases, and monitors their diffusion over space and
time (Clarke et al., 1996). Health care data in a digital form has also stimulated interest in geospatial analyses in healthcare management research. Hilton et al. in 2005 (Brian Hilton, Thomas A. Horan, 2005), outlined the combination of GIS and human health applications within decision-making, using Anthony’s Model (Anthony, 1965) defining this approach as “the management of people, assets, and services using spatial information to ensure the delivery of the health care service while assuring that specific tasks are carried out effectively and efficiently” (Brian Hilton, Thomas A. Horan, 2005).
Creating an integrated framework of administrative health care and geographical data, enables planners and managers to visualize the relationships over space and to examine the impact of government policy decisions (Higgs, 2004). The use of a GIS approach, spatial statistics analyses and the knowledge of the accessibility index, are particularly useful to inform policy makers about where population needs are not covered by the local supply (Ngui and Apparicio, 2011), or where there might be an oversupply.
Studying and measuring access to care services has been a major concern for health care management since the early 1970s (Aday and Andersen, 1974), (Penchansky and Thomas, 1981), (Ricketts and Goldsmith, 2005), (Levesque et al., 2013), (Khan, 1992), (Luo and Whippo, 2012), (Gulliford et al., 2002), (Guagliardo, 2004). Today, the importance of measuring spatial access to care services is well known and, as Guatam et al. stated in 2014, these kinds of measurements are important instruments that can help care managers to provide more respondent services and reduce spatial inequalities (Gautam et al., 2014). The importance of the spatial dimension, in fact in 2014 Gautam et al. with reference to the US, noted that “effectively evaluating spatial healthcare disparity is crucial to improve health care access” (Gautam et al., 2014).
This paper analyzes the current distribution of outpatient services in relation to the population and to the current demand for services in Tuscany using a comprehensive geographical health information infrastructure. The aim is to support
the regional administration and care managers in terms of improvements in governance and equitable outpatient service delivery.
More broadly, our study addresses the question of “How can a GIS support the health care management in the reorganization, redesign and planning of health care services?”.
The two-step floating catchment area (2SFCA) method was used to define the spatial access to outpatient services based on the availability and accessibility of the outpatient facilities and to relate access to the current service use in Tuscany in 2015. Based on spatial criteria, the aim was to highlight where there is wastefulness, oversupplies and a lack of supplies. This kind of knowledge helps in reorganizing the delivery of care services more efficiently and at the same time ensures universal access to the entire population.
The paper is divided into five sections. Section 1 outlines the methodology, presenting the exploratory analyses used to better understand the spatial distribution of the outpatient clinics and the two-step floating catchment area method. Section 2 outlines the data used, the demand, the supply and the unit of analysis. Section 3 outlines the results of the potential spatial accessibility index and presents the three different scenarios. Section 4 outlines the discussions and section 5 the conlclusions.
2.3 Methodology
As highlighted from the literature review, relating the concept of spatial access to health care service is not easy. This is due to the multiple approaches used to define spatial access and because of the complexity in measuring it. In fact, there are various possible methodologies available and many different variables can affect it. The literature provides various methods to measure the geographic accessibility, implementing indicators based on travel costs or on quantity of opportunity (Páez et al., 2012), and a GIS is considered an appropriate tool for this purpose.
Considering spatial accessibility as the balance between the supply and demand within a geographical area, we chose the two-step floating catchment area method to compute the relative accessibility index (Luo and Wang, 2003; Wang, 2010). This method uses an integrated analysis that combines distances and supply-demand ratio, and is considered as one of the best methods to measure potential spatial accessibility to health care services, returning a geographical location of services based on population needs (Cromley, Ellen J.; McLafferty, 2012; Ngui and Apparicio, 2011; Yang et al., 2006).
The methods proposed in this study consist of three stages. The first involves implementing the potential spatial accessibility index. The second consists in simulating the potential reorganization of the outpatient services based on the results of the first step. The last step involves computing a new potential spatial accessibility index in order to verify the repercussions of the managerial strategy throughout the system.
This integrated geographical framework combines administrative health care and geographical data, and helps health care planners to visualize the impact of their policy decisions in terms of geographical space.
2.3.1 Data
The data sets of the health care system in Tuscany used for this research include individual-level administrative care data on all residents. An anonymous ID was assigned to each patient that enables residents in Tuscany to be tracked with respect to access and use of any healthcare services. We used the regional administrative health care dataset of outpatient visits for the year 2015.
From the original dataset, we extracted the main clinical disciplines that patients access to: cardiology, gynecology, neurology, orthopedics, otorhinolaryngology, ophthalmology, dermatology, urology and general surgery. We did not include consultations delivered at ERs.
All the statistical analyses were run using SAS version 9.4 (SAS Institute), and the geographical analyses were run using ArcMap version 10.3.1 (Esri).
2.3.1.1 Unit of analysis
The regional administration in Tuscany is subdivided in 280 municipalities that belong to 10 provinces. Starting from January 1, 2016, the regional law 84/2015 split the regional healthcare system into three major new local health authorities (LHAs), which combined four teaching hospitals and the previous 12 LHAs.
The overall territory is divided into three "large areas" and 25 districts which are in charge of organizing and delivering the services of territorial health networks, social care and social integration.
All the analyses were run at the municipality level, which is the smallest administrative unit possible. This scale of analysis also meets the aim of the study in terms of looking at the smallest level of the territory.
2.3.1.2 Demand
1. According to the administrative health care database, Tuscany has more than 3.7 million inhabitants, varying from the smallest municipality of the isle of Capraia, which has a population of 416 citizens, to the largest one, Florence with 381,037 inhabitants (Table 2.1). For each municipality, a georeferenced centroid was defined.
Table 2.1 Descriptive statistics
Variable Municipality Total Population Male Female
N 280 3,752.65 1,804,558 1,946,676
Mean 13,402.34 6,444.85 6,952.41
Std dev 30,264.38 14,301.83 15,966.70
Min 416 228 188
Max 381,037 178,214 202,823
Dasymetric mapping was used to create the centroids and to better estimate the distribution of the aggregated population data within each unit of analysis. This was done by interpolating areal data in order to extract only the residential urban land use areas, starting with land use data available on the website of the Tuscan regional administration (Briggs et al., 2007),(Boo, G., Fabrikant, S. I., Leyk, 2015).
2.3.1.3 Supply
The selection criteria used to analyze the original dataset revealed that there were 246 outpatient clinics throughout Tuscany, which were accessed by patients more than two million times in 2015. Each clinic was integrated into a GIS environment, geolocating patients (by using their address) over the 280 municipalities of Tuscany. Of all the 280 municipalities, 120 do not have outpatient clinics under their jurisdiction.
The total number of visits provided by each outpatient clinic for this study represented the health services delivery for each municipality, varying from a minimum of 106, to a maximum of 145,956. On average, 246 outpatient clinics in 2015 delivered 8,358 specialized visits.