SCUOLA NORMALE SUPERIORE – PISA
Single-cell and real-time analysis of transcription
rates from integrated HIV-1 provirus
Thesis submitted for the degree of Doctor Philosophiae
(Perfezionamento in Genetica Molecolare e Biotecnologie)
Candidate:
Supervisor:
Paolo Maiuri
Dr. Alessandro Marcello
I. INDEX
I. INDEX...1
II. INDEX OF FIGURES...3
III. ABSTRACT...5
IV. INTRODUCTION...9
IV.1 HIV...9
IV.1.1 Virion structure...10
IV.1.2 Genome organization...11
IV.1.3 HIV-1 life cycle...11
IV.1.3.1 Accessories genes...17
IV.1.4 Tat: structure and function...20
IV.1.4.1 The structure of Tat protein...20
IV.1.4.2 Role of Tat in HIV-1 transcription...22
IV.1.4.2.1 HIV-1 promoter...22
IV.1.4.2.2 The Tat – TAR RNA interaction...24
IV.1.4.2.3 Tat-mediated transcriptional activation...24
IV.2 Nuclear architecture...29
IV.2.1 Chromosome territories...31
IV.2.2 Transcription factories...32
IV.3 MS2-based tagging of RNA...34
IV.4 The Green Fluorescent Protein...38
IV.4.1 GFP structure and folding...39
IV.4.2 GFP optimizations and spectral variants...40
IV.4.2.1 Fluorescent proteins not from Aequorea...45
IV.4.3 Applications...46
IV.4.3.1 Reporter gene...46
IV.4.3.2 Fusion Tags...46
IV.4.3.3 FRET...47
IV.4.3.4 pH sensor...47
IV.4.3.5 Photobleaching and photoactivation...47
IV.4.3.5.1 Photoconversion...48
IV.5 Fluorescence Recovery After Photobleaching...48
IV.5.1 FRAP model...50
IV.5.1.1 Diffusion...50
IV.5.1.1.1 Fick's laws...50
IV.5.1.2 Reaction-Diffusion...52
IV.5.1.2.1 Effective diffusion...56
IV.5.1.3 FRAP model optimization...57
IV.5.2 FRAP variants...58
IV.5.2.1.1 iFRAP...58
IV.5.2.1.2 Photoactivation...58
IV.5.2.1.3 FLIP...58
V. RESULTS...60
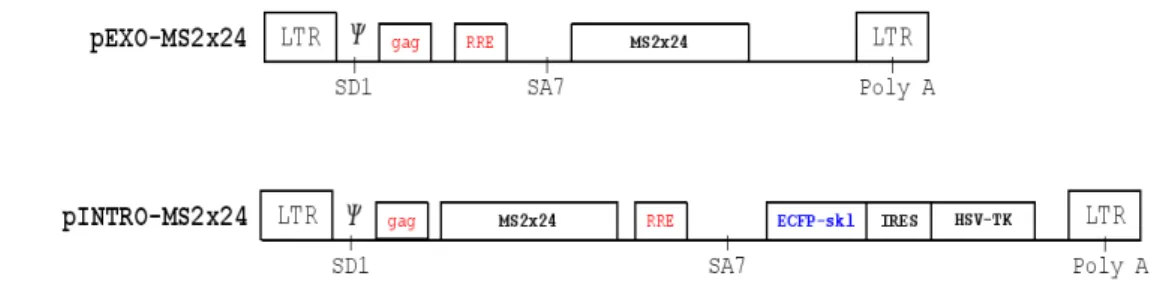
V.1 pExo-MS2x24 array...61
V.1.1 Kinetic analysis of the transcription site...62
V.1.1.1 Transcription Spot...62
V.1.1.2 A two step model for elongation and 3'-end processing. .65 V.1.1.3 Pol-II ...68
V.1.2 TAR:Tat:P-TEFb complex at HIV transcription sites...70
V.1.2.1 Tat and Cdk9...71
V.2 pIntro-MS2x24 single integration...72
V.2.1 Kinetic analysis of the transcription site...73
V.2.1.1 Transcription activation ...74
V.2.1.2 Transcription spot...74
V.3 Transcription waves model...76
V.3.1 Transcription Wave and Diffusion...78
V.3.2 pExo/pIntro-MS2x24 array...81
V.3.3 pIntro-MS2x24 single integration...82
V.4 Monte Carlo simulation...83
VI. DISCUSSION...86
VII. MATERIAL AND METHODS...97
VII.1 Cells and plasmids...97
VII.1.1 Plasmids...97
VII.1.2 pExo and pIntro HIV-1 based cells...97
VII.1.2.1 pExo and pIntro-MS2x24 array...98
VII.1.2.2 pIntro-MS2x24 single integration...98
VII.2 Imaging and FRAP procedures...99
VII.2.1 Microscopes...99
VII.2.2 Immunofluorescence and in situ hybridization...100
VII.2.3 Live cell imaging and FRAP experiments...100
VII.2.3.1 Wide-field FRAP...100
VII.2.3.1.1 Image processing...100
VII.2.3.2 Confocal FRAP...101
VII.2.3.2.1 Image processing...101
VII.2.3.3 Time lapse...101
VII.2.3.3.1 Image processing...102
VII.3 Curve Fitting...102
VII.4 MS2-G/YFP-nls...103
VII.4.1 Binding efficiency and U3...103
VII.4.2 Nuclear MS2-G/YFP-nls diffusion...104
II. INDEX OF FIGURES
Figure IV.1: HIV-1 virion and structure of Gag polyprotein...9
Figure IV.2: Structure of the HIV-1 genome and its mRNA products...11
Figure IV.3: Summary of the HIV-1 replication cycle...13
Figure IV.4: . Transcriptional control elements of the HIV-1 5’ LTR...23
Figure IV.5: Tat activates HIV-1 transcription...28
Figure IV.6: Nuclear organization...30
Figure IV.7: RNA detection MS2-based system...34
Figure IV.8: Two Aequorea victoria GFP variants were examined for their different excitation maxima...38
Figure IV.9: Stereoview of three-dimensional structure of GFP [Ormoe et al., 1996]...40
Figure IV.10: Wild-type fluorescent proteins and their spectral variants. ...45
Figure V.1: p-Exo and P-Into HIV-1 reporters...60
Figure V.2: RNA-DNA and RNA-PolII colocalization at the transcription spot...61
Figure V.3: Exo1 transfected with MS2-GFP-nls ...61
Figure V.4: Exo1 (Black) and MS2-GFP-nls (Red) recovery curve...62
Figure V.5: Exo1 (Black) and Exo2 (Red) recovery curve...63
Figure V.6: Transcription and RNA processing...63
Figure V.7: Exo1 recovery curve with different RNAPII...63
Figure V.8: Exo1 (Black) and Exo1 with Camptothecin (Red) recovery curve...64
Figure V.9: Exo1 and Exo-Long recovery cureves...64
Figure V.10: Exo1 two step model fit...66
Figure V.11: Exo-Long two step model fit...67
Figure V.12: Exo2 two step model fit...67
Figure V.13: Exo1 Camptothecin...68
Figure V.14: Exo1 Pol-hC4...68
Figure V.15: RNAPII recovey curve at the transcription spot (Black) and in the nucleoplasm (Green)...69
Figure V.16: MS2 and Tat at the transcription spot...70
Figure V.17: MS2 and CDK9 at the transcription spot...70
Figure V.18: HOS_B3 RNA FISH ...73
Figure V.19: HOS_A4 RNA FISH...73
Figure V.20: HOS_A4...73
Figure V.21: HOS_A4 CyclinT1and RNA PolII...73
Figure V.22: Spot at 30min...74
Figure V.23: Spot at 16h...74
Figure V.24: B3 Clone, Ms2-YFP-nls at the transcription spot (black) and in the nucleoplasm (blue)...75
Figure V.25: Transcription Wave model...77
Figure V.26: Exo1 Transcription Wave fit...78
Figure V.27: pEXO...82
Figure V.28: pIntro...82
Figure V.29 B3 Transcription Wave Model...83
Figure V.30: Monte Carlo simulation fitted with the Sprague model...85
Figure VII.1: Exo1 transfected with U3...104
III. ABSTRACT
Viral RNA biogenesis is a crucial step in the replication of retroviruses that require both the production of a genomic RNA as well as of translation templates. Cellular and viral factors concur in the biogenesis of RNA at the specific sub-nuclear chromatin site where the reaction takes place. The possibility of tracking viral RNA in living cells gives the unique possibility of measuring the kinetic parameters of RNA biogenesis as well as defining the dynamic recruitment of host and viral factors to the site of replication.
In order to study the activation of HIV-1 gene expression from the integrated viral promoter we exploited a method that allows the visualization of newly transcribed RNA in living cells through the specific recognition of an RNA consensus sequence for the bacteriophage MS2 coat protein tagged with an autofluorescent protein. We observed that transcription of HIV-1 occurred in discrete foci within the nucleus of cells carrying several tandem arrays of the HIV-1 construct. These foci, representing newly transcribed RNA, co-localized with the viral Tat transactivator as well as members of the positive transcription elongation factor (P-TEFb) and RNA polymerase II (RNAPII). This experimental setting was used to measure the dynamic of
HIV-1 RNA transcription in living cells. By fluorescence recovery after photobleaching (FRAP) we were able to demonstrate that following photobleaching the process reaches a steady state with a negligible immobile fraction allowing precise kinetic measurements of RNA polymerase elongation rates. We found that elongation proceeded at approximately 2 kb/min, and that 3'-end formation and release took another minute to complete. In addition we also analyzed the dynamic of RNAPII and the TAR:Tat:pTEFb complex at the site of HIV-1 transcription in living cells. Our data suggest that, while the residence time of RNAPII exceeds the time required for elongation through the viral template, the complex dissociates from the polymerase following transcription initiation, and may undergo subsequent cycles of association/dissociation.
This approach was extended to the analysis of single integrated HIV-1 transcription units by transduction of a HIV-based lentiviral vector into a human cell line and subsequent selection for Tat-induction from a latent state. Nascent RNAs from single integrated transcription units were detectable in living cells by MS2 RNA-tagging. At steady state a constant number of RNAs was measured at the transcription site corresponding to a minimal density of polymerases with negligible fluctuations over time both in space and intensity of the signal. Recovery of fluorescence after photobleaching of the transcription site was complete within seconds, much faster than what was observed
previously. However, the necessity of taking into account also the diffusion of the tagged MS2 protein required the development of novel analytical tools. To this end we developed a model that describes each polymerase sliding along the DNA like the peak of a positive progressive traveling wave (TranWave) to predict the number of MS2 RNA repeats at the transcription site in function of time. The outcome of this approach and its following improvements are being discussed.
This work provides for the first time a kinetic framework to analyze HIV-1 RNA biogenesis and RNA/protein dynamics in living cells.
List of candidate's publications during the Ph.D. training: a) Strictly related to this thisis
S. Boireau, P. Maiuri*, E. Basyuk, M. de la Mata, A. Knezevich, B. Pradet-Balade, V. Bäcker, A. Kornblihtt, A. Marcello, E. Bertrand. * first author, equal contribution
The transcriptional cycle of HIV-1 in real-time and live cells.
Journal of Cell Biology, 179 (2007): 291.
D. Molle, P. Maiuri, S. Boireau, E. Bertrand, A. Knezevich, A. Marcello, E. Basyuk.
A real-time view of the TAR:Tat:P-TEFb complex at HIV-1 transcription sites.
Retrovirology, 4 (2007): 36.
A. De Marco, C. Biancotto, A. Knezevich, P. Maiuri, C. Vardabasso, A. Marcello.
Intragenic transcriptional cis-activation of the human immunodeficiency virus 1 does not result in allele-specific inhibition of the endogenous gene.
Retrovirology, 5 (2008): 98. b) Exploiting the MS2 tagging method
L. Miorin, P. Maiuri, V.M. Hoenninger, C.W. Mandl, A. Marcello.
Spatial and temporal organization of tick-borne encephalitis flavivirus replicated RNA in living cell. Virology, 379 (2008): 64.
M. Dieudonné, P. Maiuri, C. Biancotto, A. Knezevich, A. Kula, M. Lusic and A. Marcello.
Transcriptional competence of the integrated HIV-1 provirus at the nuclear periphery.
IV. INTRODUCTION
IV.1 HIV
The acquired immunodeficiency syndrome (AIDS) is a life threatening disease caused by the human immunodeficiency virus type 1 (HIV-1). Following its discovery the virus has killed more than 25 million people world-wide and it remains a major threat to public health and a challenge for drug development [Ho and Bieniasz, 2008]. HIV-1 became the most studied virus in history and many years of research only partially unraveled the complexity of its life cycle. Studies on HIV led to critical discoveries in antiviral drug development but also gave rise to new concepts in viral and cellular biology. However, the plasticity of
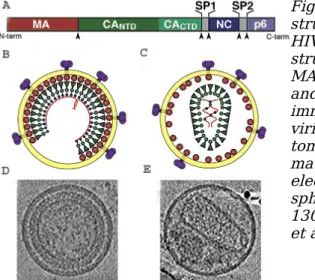
Figure IV.1: HIV-1 virion and structure of Gag polyprotein.
HIV-1 Gag polyprotein (A) domain structure, showing the locations of MA, CANTD, CACTD, SP1, NC, SP2, and p6. Schematic models of the immature (B) and mature (C) HIV-1 virions. Central slices through tomograms of immature (D) and mature (E) HIV-1 particles derived by electroncryotomography. The spherical virions are approximately 130 nm in diameter [Ganser-Pornillos et al., 2008].
viral sequences, the establishment of a latent state, and the uncovered function of some auxiliary genes still remains a challenge in finding a cure for HIV infection [Richman et al., 2009].
IV.1.1 Virion structure
HIV-1 is composed of two copies of a single-stranded RNA enclosed by a proteic core (capsid) which is surrounded by the plasma membrane (envelope) of host-cell origin in which the viral glycoproteins are inserted. All structural proteins, which are components of the HIV-1 virion, are derived from the Gag polyprotein. Traditionally two forms of HIV particles, the immature form and the mature form, have been observed. The immature virion is a roughly spherical shell of radically extended uncleaved and multimerized Gag molecules (Fig. IV.1 B and D). During particle maturation, viral protease (PR) is activated and cleaves Gag generating a set of new proteins and spacer peptides (SP), termed MA, CA, SP1, NC, SP2 and p6 (Fig. IV.1 A). These newly processed proteins then reassemble to form the distinct layers of the mature virion: MA remains associated with the inner viral membrane (the ‘matrix’ layer), NC coats the viral RNA genome (the ‘nucleocapsid’ layer), and CA assembles into the conical capsid that surrounds the nucleocapsid and its associated enzymes: reverse transcriptase (RT) and integrase (IN) (Fig. IV.1 C and E).
IV.1.2 Genome organization
HIV-1 is a retrovirus, possessing an RNA genome that is replicated via a DNA intermediate. The full HIV genome is encoded on one long strand of RNA and contains approximately nine thousand nucleotides. HIV has several major genes encoding for structural proteins that are found in all retroviruses and several nonstructural (accessory) genes that are unique for HIV. The gag gene provides structural elements of the virus and the pol provides the replication enzymes. The Env gene codes for glycoproteins which are exposed on the surface of the viral envelope. Accessory proteins (Tat, Rev, Vif, Vpr and Vpu) help to enhance virus infectivity.
IV.1.3 HIV-1 life cycle
After entry into a cell the single stranded RNA genome of the virus is Figure IV.2: Structure of the HIV-1 genome and its mRNA products.
The open reading frames for various polypeptides are shown as rectangles. The HIV-1 viral transcript is spliced in different ways yielding unspliced (9 kb), singly spliced (4 kb) and fully spliced (2 kb) mRNAs. In order to simplify the figure only the most important viral proteins are shown [Rahbek, 2008].
reverse transcribed into a double stranded DNA that is transported to the nucleus and integrated into the DNA of the host cell as a provirus [Greene and Peterlin, 2002]. Integrated provirus is transcribed by the host – cell RNA polymerase II (RNAPII) producing a copy of the viral RNA genome that can be used to infect other cells (Fig. IV.3) [Haseltine, 1991]. HIV infects cells of the immune system such as CD4+ T cells and cells of the monocyte – macrophage lineage. Productive infection starts when HIV-1 fuses its envelope with the cell plasma membrane. Entry is mediated by binding of the viral envelope glycoproteins gp120/gp41 to the CD4 receptor and to a co-receptor (the chemokine receptors CCR5 or CXCR4) [Berger et al., 1999]. These co-receptors provide a critical function for virus entry. CCR5 binds macrophage-tropic viruses (R5 viruses) and CXCR4 – T cell tropic viruses (X4 viruses). Following fusion, the viral core is released into the cell cytoplasm. Immediately after release into the cytoplasm the viral core undergoes a progressive disassembly, known as uncoating and the viral RNA genome is retrotranscribed into double stranded DNA by the viral reverse transcriptase. Finishing of reverse transcription originates the HIV preintegration complex (PIC). The viral proteins present in this complex are integrase (IN), MA, reverse transcriptase (RT), NC, and Vpr [Farnet and Haseltine, 1991]. In contrast to most retroviruses, HIV is able to infect nondividing cells such as differentiated macrophages, thus PIC needs to be translocated into the nucleus.
To reach the nuclear membrane, the particles must travel through the cytoplasm. HIV transport has been shown to exploit the cellular cytoskeleton. In particular, initial movements at the cell periphery occur in association with actin [Bukrinskaya et al., 1998], while subsequent translocation to the nucleus takes place along the microtubule network, likely by interaction of PIC with the dynein-dependent motor complex [McDonald et al., 2002]. After reaching the nuclear envelope PIC is translocated through the nuclear pore, most likely by relying on the cellular nuclear import machinery.
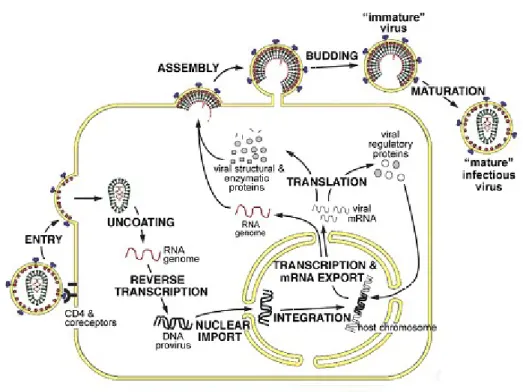
Figure IV.3: Summary of the HIV-1 replication cycle.
After binding and fusing to the surface of the host cell (entry), the HIV-1 core enters the host cell (uncoating). Reverse transcriptase synthesizes proviral double-stranded DNA, which is transported to the nucleus. Integration occurs and the ensuing provirus expresses viral RNA that will synthesize viral proteins. New virions are created by assembly and budding through the infected cell membrane and subsequent maturation due to the actions of protease [Ganser-Pornillos et al., 2008].
Like all retroviruses, HIV integrates into the host chromatin. The process of integration of the linear viral DNA is carried out by the viral integrase protein (IN) in coordination with several host cell factor.
For a long time integration of HIV and more in general of all retroviruses was believed to occur randomly into the host chromatin. Nevertheless, recent reports have challenged this notion showing a bias for integration into transcriptionally active genes [Schroeder et al., 2002]. Moreover, the chromatin status at the site of integration determines whether the provirus is transcriptionally active, poised for activation or inactive. The provirus once integrated into host genome can remain transcriptionally inactive, in a latent state or can undergo active transcription allowing continuous rounds of infection. After two months, in patients on HAART (antiretroviral therapy) the plasma levels of genomic RNA falls below the limit of detection. Therefore, it was initially assumed that prolonged treatment might lead to eradication of the virus in these patients [Marcello, 2006]. Unfortunately, it is now clear that long-live reservoirs of HIV-1 can persist for years in the presence of HAART. This reservoir is thought to consist mainly of latently infected resting memory CD4+ T cells [Chun and Fauci, 1999] [Pierson et al., 2000]. Both host transcription factors and the viral Tat trans-activator have been proposed as limiting factors for transcriptional reactivation of latent HIV-1. However, since HIV-1 is found integrated into the genome of resting memory T cells, it has been proposed that the
chromatin environment at the viral integration site may play a role in the transcriptional silencing of the HIV-1 genome [Jordan et al., 2003] [Jordan et al., 2001]. Indeed, integrated HIV-1 has nucleosomes positioned in its 5’ LTR that are remodeled by deacetylase inhibitors, cytokines and Tat [Lint et al., 1996][Lusic et al., 2003][Marcello et al., 2004]. Histones play an important role in regulating HIV-1 transcription since they integrate signals for repression, like the heterochromatin marker H3K9 trimethylation, Suv39H1 and HP1, and reactivation, like histone acetylation [Lusic et al., 2003][Chene et al., 2007]. It is now clear that also the three-dimensional (3D) nuclear architecture of the nucleus could be implicated in HIV-1 provirus regulation, as it has been proposed for cellular genes [Misteli, 2007][Dieudonne et al., 2009].
In an infectious state, the integrated provirus is actively transcribed from its promoter located in the U3 region of the HIV-1 LTR. Once the HIV-1 pre-mRNA transcript is produced, it can be spliced in alternative ways to yield three classes of mRNA in the nucleus: unspliced mRNA (9 kb), singly spliced mRNA (4 kb) and fully spliced mRNA (2 kb). The three classes of HIV-1 mRNA and the viral proteins they encode are shown in Figure IV.2. All three classes of mRNAs must be exported to the cytoplasm and translated into viral proteins for the viral life cycle to proceed. The fully spliced mRNAs, which are the first viral transcripts that appear after infection, are exported to the cytoplasm. They follow the same pathway of cellular RNA [Cullen, 1998] leading to expression
of the regulatory proteins Nef, Tat and Rev. The negative factor (Nef) is a modulator of cellular signaling pathways that optimizes the cellular environment for virus replication. The transcriptional activator (Tat) up-regulates the synthesis of viral mRNA. The regulator of viral gene expression (Rev) acts on a post-transcriptional level and plays a main role in Rev-dependent export of unspliced and incompletely spliced HIV transcripts from the nucleus to the cytoplasm.
The unspliced HIV transcript is the full-length viral RNA which acts both as a messenger and genomic RNA. Two copies of genomic RNA are encapsidated, usually linked at their 5’ end through the dimer linkage site [Darlix et al., 1990]. Dimerization is associated with encapsidation [Greatorex and Lever, 1998], but dimer stabilization occurs post-capture by the Gag protein involving the NC. Viral RNAs to be specifically packaged are identified by the presence of an RNA sequence named the packaging signal ( ) placed within the 5’leader ψ [McBride and Panganiban, 1996][Berkowitz et al., 1995].
To a first approximation, all the information necessary for retroviral particle assembly resides in the Gag polypeptide. For example, Gag alone can form extracellular virus-like particles in the absence of other viral proteins [Gheysen et al., 1989], and Gag molecules can spontaneously assemble into spherical, immature virus-like particles in vitro [Campbell and Rein, 1999]. All the viral proteins necessary for virion assembly and RNA genomes are transported to the plasma
membranes close to lipid raft membrane domains, where the building of new virions begins. The Gag-Pol precursor binds to plasma membrane through the myristol group of the MA domain. The resulting virions bud from the plasma membrane but they are still incomplete. Their maturation is finished by viral protease (PR) that cleaves Gag-Pol. Further, Gag and Pol precursors are processed to originate the single core proteins, marix and the viral enzymes. The proteolitic activity ends when the virion is already detached from plasma membrane and results in the formation of mature infectious viruses.
IV.1.3.1 Accessories genes
HIV-1 encodes at least nine genes which must be expressed during viral life cycle in the correct temporal order. Early in the viral infection, small, multiply spliced transcripts (2 kb) encoding Tat, Rev and Nef predominate in the cytoplasm. During the late phase of HIV infection, genomic (unspliced, 9kb) RNAs and singly spliced RNAs (4 kb) become leading species in the infected cell.
Nef
During the replication cycle, other auxiliary proteins of HIV-1 play a fundamental role in regulating the different steps of the intrecellular viral pathway. Completely spliced transcripts encode for Nef that is targeted to the plasma membrane by myristylation of its N-terminus. The first studied activity of Nef is the down-regulation of the CD4 receptor, a mechanism which is supposed to protect infected cell from
the immune system and to facilitate the release of HIV-1 virions. In addition to CD4, Nef is able to promote the down-regulation of cell surface MHC I (major histocompatibility complex 1) that presents viral epitopes to cytotoxic lymphocytes (CTL). As consequence, Nef impairs the CTL-mediated immune response that leads to the lysis of HIV-1 infected cell [Collins et al., 1998].
Vif
The viral infectivity factor Vif affects the infectivity but not the production of viral particles. The protein is encoded from singly spliced viral transcripts and its expression is therefore Rev-dependent. Once expressed by infected cell, the protein accumulates in the cytoplasm and is found in association with the plasma membrane. Mutant viruses lacking Vif are less infectious than the wild type, although cell-to-cell transmission is only slightly lower than normal. It has been demonstrated that Vif promotes the degradation of APOBEC3G [Sheehy et al., 2003]. APOBEC3G induces hypermutation in the retroviral plus strand DNA, in which up to 25% of all deoxyguanosine (G) sequenced are mutated to deoxyadenosine (A). This hypermutation then induces the degradation of the viral genome or, in the case of successful reverse transcription and insertion into the cell chromatin, the production of non-functional viral proteins. APOBEC3G restriction is overcome by the HIV-1 Vif protein which targets APOBEC3G to ubiquitination and thus proteasomal degradation [Sheehy et al., 2003].
Vpr
Vpr is expressed at later stages of HIV-1 replication and is packaged in all HIV-1 virions by the p6 core protein. After viral entry, Vpr is incorporated inside the PIC and enhances HIV-1 replication in nondividing cells by mediating its nuclear import. In addition, Vpr induces cell cycle arrest in the G2 phase through the inhibition of p34cdc2-cyclin B kinase activity increasing virion production [Re et al., 1995].
Vpu
Vpu is a transmembrane protein unique to HIV-1. Vpu binds to the cytoplasmic tail of CD4 and recruits the -TrCP/Skp1p complex at theβ level of the endoplasmatic reticulum. This event induces the ubiquitination and the subsequent preteosomal degradation of CD4 while Vpu is recycled. In addition, Vpu enhances release by inducing the budding of virions from the plasma membrane and promoting the detachment of budding virions [Margottin et al., 1998].
Rev
Rev specifically recognizes an RNA element located within the coding sequence for Env. This sequence, called the RRE (Rev-responsive element), is present within the env-coding region and is about 200 nucleotides in size and forms secondary RNA structure. Rev binds to this region through amino acids in the basic arginine-rich domain [Zapp and Green, 1989].
Rev permits export of unspliced/partially spliced transcripts from the nucleus to the cytoplasm where they serve as a template for translation of the gag-pol open reading frame. On the other hand the unspliced transcript is the full-length genomic RNA which thanks to Rev can be translocated to the cytoplasm for encapsidation.
IV.1.4 Tat: structure and function
The trans-activator protein (Tat) is an unusual transcription factor because it interacts with a cis-acting RNA enhancer element, TAR, present at the 5’ end of all viral transcripts. The function of Tat has been described for the first time by Sodroski et al who noted that synthesis of reporter genes placed under the control of the viral long terminal repeat (LTR) increased 200- to 300-fold in the cells which have been previously infected by HIV [Sodroski et al., 1985]. They reasoned that the induction, or “transactivation” of transcription was due to the presence of a novel trans – activating factor, which they named Tat.
IV.1.4.1 The structure of Tat protein
Tat is a small nuclear protein of 86 to 101 amino acids (depending on the viral strain) which is encoded from two separate exons. Tat is translated from a group of multiply spliced monocistronic transcripts. On the basis of amino acids distribution in the sequence and their conservation with homologous proteins from other leniviruses, it is possible to identify five domains. In the first exon (aa 1–72), it can be
distinguished an N – terminal acidic domain (aa 1 – 21); a domain containing 7 cysteins (aa 22 – 37); a core region (aa 38 – 48); and a basic domain (aa 49 – 57) enriched in arginine and lysine amino acids, highly conserved among different strains. In the reporter plasmid co-transfection assays, the first 72 amino acids of Tat fully trans-activate transcription from the LTR [Garcia et al., 1988]. A basic domain RKKRRQRRR confers TAR RNA-binding properties of Tat [Dingwall et al., 1989][Chang and Jeang, 1992] and is important for nuclear localization of the protein [Ruben et al., 1989]. However, studies suggest that this short basic stretch is insufficient in determining the entire specificity of Tat-TAR binding since amino acids outside of the basic domain also contribute to this interaction [Churcher et al., 1993]. The second coding exon of Tat has been less studied. In the routine transfection of reporter plasmids, absence of the second exon does not alter greatly measurements of Tat activity in this type of assay. However, findings from Tat of HIV-2 or SIV are quite clear in demonstrating that this exon contributes towards optimal trans-activation [Tong-Starksen et al., 1993].
No crystal structure of Tat has been obtained to date; structural prediction and data from NMR spectrometry [Bayer et al., 1995] indicate that the protein has a highly flexible structure and does not exhibit obvious secondary structure elements.
IV.1.4.2 Role of Tat in HIV-1 transcription
Transcription of the HIV-1 provirus is characterized by an early, Tat-independent and a late, Tat-dependent phase. Transcription from the HIV-1 LTR is increased several hundred-fold in the presence of Tat and the ability of Tat to activate transcription is essential for virus replication.
IV.1.4.2.1 HIV-1 promoter
The U3 region of the HIV-1 LTR functions as the viral promoter. The viral LTR promoter has a structure typical of promoters activated by cellular RNA polymerase II. It contains several binding sites for general transcription factors as shown in Figure IV.4. The HIV-1 promoter contains the core promoter sequence (TATA box) and enhancer elements placed upstream and downstream of TATA box. Immediately upstream of the TATA box are two tandem NF- B binding sites and three tandem SP–κ 1 binding sites. Immediately downstream of the start of transcription is the transactivation response element (TAR). Three tandem binding sites for the constitutively expressed Sp1 transcription factor are necessary for basal levels of LTR-directed RNA synthesis. Mutation of individual or pairs of Sp1 sites has little, if any, effect on the basal or Tat-transactivated levels of expression [Harrich et al., 1990]. However, the mutation of all three Sp1 sites markedly reduces the response to Tat [Berkhout and Jeang, 1992]. Two tandemly arranged binding sites ( Bκ sites) are recognized by the dimeric transcription factors composed of
several combinations of members of the Rel/NF- B family ofκ polypeptides [Baeuerle and Baltimore, 1996]. The predominant complex that binds to the LTR B sites in activated cells is NF- B (p50/p65κ κ heterodimer). In unstimulated cells, the p65 subunit of NF- B is retainedκ
in the cytoplasm through its interaction with inhibitor proteins belonging to the I B family. The activation of NF- B occurs through theκ κ phosphorylation and proteolysis of the I B inhibitor, and the subsequentκ translocation of p65 to join p50 in the nucleus where the factor can bind to its cognate binding sites [Henkel et al., 1993]. Moreover, the arrangement of the transcription factor binding sites in the LTR may vary in different HIV-1 subtypes but the specific contribution of these
Figure IV.4: . Transcriptional control elements of the HIV-1 5’ LTR.
Schematic representation of HIV-1 LTR promoter with the position of the identified binding sites for cellular transcription factors. Factors binding to the basal promoter region are in green, the enhancer is in orange, and upstream sites are in blue. The positions of nuc-0 and nuc-1 nucleosomes are indicated. Tat binds to a bulge region of a stem-loop structure formed by nascent RNA. The U3, R and U5 structures of the HIV 5’ LTR are shown [Marcello et al., 2001].
changes has not been yet thoroughly investigated. IV.1.4.2.2 The Tat – TAR RNA interaction
The transactivation - responsive region (TAR) is located downstream of the initiation site for transcription (nucleotides +1 and +59). TAR RNA sequence forms a highly stable, nuclease – resistant, stem – loop structure. The stem – loop structure is located between +19 and +43 nucleotides which is the minimal sequence for transactivation. Because of its location in the R domain of the LTR, TAR is present in both viral RNA and DNA.
IV.1.4.2.3 Tat-mediated transcriptional activation
The interaction of Tat with TAR permits activation of HIV-1 transcription by promoting the assembly of transcriptionally active complexes at the LTR by multiple protein–protein interactions. Over the years, a number of cellular proteins have been reported to interact with Tat and to mediate or modulate its activity. These include general transcription factors, among which are TBP, TAFII250, TFIIB, TFIIH, hNAP-1 [Kashanchi et al., 1994][Parada and Roeder, 1996] [Vardabasso et al., 2008], RNA polymerase II [Wu-Baer et al., 1995]; transcription factor Sp1; the cyclin subunit of the positive transcription elongation factor complex (P-TEFb), cyclin T1 [Wei et al., 1998], and different transcriptional co-activators that possess histone acetyltransferase activity. These interactions with P-TEFb and HATs appear to be of particular importance in the transcriptional activation of the viral promoter.
• P-TEFb
Cyclin T1 is one of the cyclin subunits of P-TEFb (positive transcription elongation factor b) a general elongation cofactor originally identified in D. melanogaster for RNA polymerase II (RNAPII)-directed transcription [Price, 2000]. P-TEFb is known to be present in the early elongation complexes and is required for elongation after promoter clearance. Although the HIV-1 LTR contains DNA binding sites for several transcription factors, in the absence of Tat, there is no expression of viral genes. However, there is production of short, non-polyadenylated RNAs that include TAR RNA. The instability of synthesizing full-length viral transcripts is caused by the low processivity of RNAPII, which is overcome by P-TEFb. The P-TEFb complex is composed of one component of the cyclin T family and of the cyclin-dependent kinase Cdk9. Cyclin T1 participates in TAR RNA recognition. It has been demonstrated that sequences in the apical loop of the TAR RNA are required for cyclin T1 binding [Wei et al., 1998]. More recently it has been discovered that P-TEFb exists in two complexes: large and small. P-TEFb is inactive in the large complex which additionally contains HEXIM1, hnRNPs and the 7SK small nuclear RNA (snRNA). In response to stimuli such as stress or UV light 7SK RNA, as well as HEXIM proteins and hnRNPs are released by an unknown mechanism and P-TEFb is activated forming the small complex [Barrandon et al., 2007] [Nguyen et al., 2001].
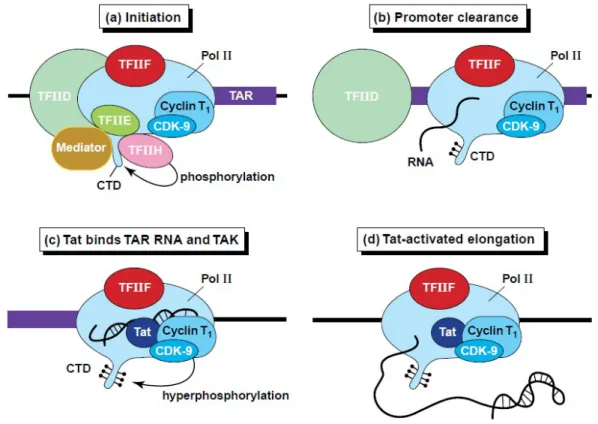
domain of RNA polymerase II (RNAPII) is phosphorylated by CDK-7, a component of TFIIH initiation factor (Fig. IV.5 a). CTD phosphorylation is an early step associated with the clearance of the promoter (Fig. IV.5 b). Following clearance of the promoter, the phosphorylated RNAPII is able to transcribe through the TAR region. When the TAR RNA stem-loop structure is synthesized, the Tat protein binds to it and by interacting with cyclin T1, activates P-TEFb. The CDK9 kinase present in P-TEFb becomes constitutively activated. The actvated P-TEFb hyperphosphorylates the CTD domain of RNAPII (Fig. IV.5 c). This molecular event is associated with increased transcriptional processivity (Fig. IV.5 d). The formation of the P-TEFb-TAR-Tat tripartite complex is an essential step towards the assembly of the processive RNAPII machinery at the LTR promoter [Bieniasz et al., 1998] [Fujinaga et al., 1998].
• HATs
The LTR acts as a very strong promoter when analyzed as naked DNA in vitro, but when it is integrated into the cellular genome is almost silent. Therefore, chromatin conformation imposes inhibition onto the integrated promoter [Marzio et al., 1998]. Experiments performed both in vivo [Verdin et al., 1993][Kharroubi et al., 1998] and in vitro using the HIV promoter reconstituted into chromatin [Sheridan et al., 1997] have shown that, independent from the integration site, nucleosomes at the 5’ LTR are precisely positioned with respect to the cis-acting regulatory elements as shown in Figure IV.4. In the transcriptionally silent
provirus, these nucleosomes define two large nucleosome-free areas, one associated with the promoter/enhancer in the U3 region and the other spanning the primer-binding site immediately downstream of the 5’ LTR. These two open regions are separated by a single nucleosome called nuc-1 that is specifically and rapidly destabilized during transcriptional activation. Complexes containing histone acetyltransferase (HAT) activity facilitates transcriptional activation by modulating nucleosomal repression of specific promoters through acetylation of the N-terminal tails of histones. This event destabilizes the histone-DNA interaction. The HAT proteins responsible for the TAR-dependent Tat transactivation include the transcriptional co-activators p300, the highly homologue cAMP-response element binding protein (CREB) binding protein (CBP), the p300/CBP-associated factor (P/CAF), the general control non-derepressible-5 (GCN5) factor, the TIP60 protein, and the general transcription factor TAFII250. Lusic et al. has observed acetylation of histones H3 and H4 at distinct nucleosomal regions and the recruitment of mentioned HATs to the viral LTR promoter upon HIV activation either with Tat or phorbol esters [Lusic et al., 2003].
The Tat-TAR-P-TEFb interaction which increased the processivity of RNA Pol II confirms that Tat plays a role in transcription elongation. The initiation model quickly lost support when Kao et al. reported that in the absence of Tat the majority of RNA polymerases initiating transcription
stall near the promoter [Kao et al., 1987]. On the other hand it is also clear that optimal Tat transactivation of HIV-1 gene expression requires upstream transcription co-factors. Along these lines it has been reported that Tat physically interacts with the pre-initiation complex (PIC) including transcription factors such as Sp1 [Jeang et al., 1993], TATA
binding protein (TBP) [Majello et al., 1998], cylinE/cdk2 [Deng et al., 2002], TFIIH, Tip60 [Kamine et al., 1996] and RNAPII [Cujec et al.,
Figure IV.5: Tat activates HIV-1 transcription.
(a) The RNA polymerase II (Pol II) holoenzyme is recruited to the HIV LTR through its interactions with TFIID and other components of the basal transcription apparatus. The CTD domain of the RNA polymerase is phopshorylated by the CDK-7 kinase found in TFIIH and the modified polymerase clears the promoter and begins transcription of TAR. (b) The nascent RNA chain corresponding to the TAR RNA transcript folds into its characteristic stem-loop structure and binds the RNA polymerase. (c) Tat is recruited to the transcription complex through binding to TAR RNA structure and forms a ternary complex with TAK (contains CDK-9 kinase and Cyclin T1). The activated CDK-9 kinase catalyses phosphorylation of the CTD and TAR is displaced from the polymerase. (d) The activated transcription complex is able to transcribe the remainder of the HIV genome [Karn, 1999].
1997]. The evidence of Tat interaction with histone acetyltransferases support the role of Tat in chromatin remodeling before the onset of viral transcription. It is possible therefore that Tat facilitates chromatin remodeling, pre-initiation complex assembly and transcription elongation in the sequential manner that leads to high levels of HIV transcription. All of these activities of Tat are probably exerted by the transient formation of large subnuclear complexes at the site of HIV transcription and must therefore be spatially and temporally regulated. It has been demonstrated [Marcello et al., 2003] that cyclinT1 and p300 interact with the promyleocytic leukemia (PML) protein within specific subnuclear compartments that are coincident with PML nuclear bodies. This observation suggests that PML bodies could regulate Tat activity by modulating the availability of essential factors to the transcriptional machinery.
IV.2 Nuclear architecture
The nucleus is a complex organelle with an internal structure and component organization that is not fully identified. Understanding the molecular details of the organization of the nucleus including: how the chromosomes are arranged, how the nuclear compartments are formed and maintained, how the synthesis, processing, assembly and transport of molecules are coordinated and regulated are one of the main objectives of cell biology. It is well accepted that organization of
chromatin is not random and whole chromosomes reside in specific locations within the nucleus called chromosome territories [Cremer and Cremer, 2006][Cremer and Cremer, 2006a]. Within the nucleus, protein and RNA-protein complexes can move to and from chromatin through the interchromatic nucleoplasmic space by a diffusion mechanism until they encounter an appropriate binding site. In addition, many nuclear factors are able to form or interact with different types of subnuclear domains, which are either attached to chromatin or located in the interchromatic space. The nuclear bodies (also called nuclear speckles or domains) include nucleoli, splicing speckles, Cajal bodies, gems, PML bodies and most recently identified paraspeckles (Fig. IV.6). They are
Figure IV.6: Nuclear organization.
The nucleus is a complex organelle which contains many specialized domains or nuclear sub-structures. Each nuclear domain is a highly dynamic structure which is involved in a certain nuclear process [Spector, 2001].
highly dynamic nuclear structures not enclosed by membranes and their appearance is probably the result of a tight association of proteins and RNA and perhaps DNA components involved in the synthesis, assembly, and storage of macromolecules playing a role in gene expression. Moreover, the exact maintenance of subnuclear organization has important consequences for cellular function and perturbation of various nuclear domains may be associated with disease phenotype.
IV.2.1 Chromosome territories
The largest unit of organization of the eukaryotic genome is the chromosome. Chromosome painting approaches revealed that chromosomes have preferred positions with respect to the centre or the periphery of the nucleus and with respect to each other [Cremer and Cremer, 2006]. Thus, the spatial positioning of a chromosome territory (CT) in the nucleus is far from random. A correlation has been observed between CT location and human chromosome size, in which smaller chromosomes are generally situated towards the interior and larger chromosomes towards the periphery of the nucleus [Sun et al., 2000]. However, there is strong evidence that CTs with similar DNA content, but with very different gene densities, occupy distinct nuclear positions. This observation indicates that gene content is a key determinant of CT positioning. A striking example comes from the distribution of human chromosome 18 and 19. Although both chromosomes have a similar DNA content (85 and 67 Mb, respectively), the gene-poor chromosome
18 territories were typically found at the nuclear periphery, whereas the gene-rich chromosome 19 territories were located in the nuclear interior [Croft et al., 1999]. Genes sometimes move outside of their chromosome
territory. This relocation occurs either in domains of constitutively high gene expression [Mahy et al., 2002] or, in some situation, when gene expression is induced [Volpi et al., 2000]. For example, the Hoxb gene cluster is activated at the same time as it moves away from the chromosome territory [Chambeyron and Bickmore, 2004]. A consequence of this relocation is that the ‘looped out’ Hoxb locus can now interact more with other chromosomes. This finding, together with the observation of extensive intermingling of DNA from different chromosomes at the boundary of, or just outside of, chromosome territories suggests that chromosome territories might be more dynamic then previously thought [Pombo and Branco, 2007].
IV.2.2 Transcription factories
Many nuclear processes are spatially compartmentalized. Transcription seems to be organized in subnuclear transcription centers, also called transcription factories. Several thousand of distinct transcription sites appear to be randomly dispersed through the nucleoplasm [Wansink et al., 1993]. These transcription sites represent hot spots of transcription that contain complex sets of transcription factors and polymerases to serve multiple genes [Cook, 1999]. It has been estimated that in the single nucleus there are 65˙000 active
RNAPII molecules but less that 10˙000 trascription sites in HeLa cells. Therefore transcription factories would contain 6 -8 actively elongating RNAPII that would probably transcribe multiple genes at the same time. Analogously, ribosomal RNA genes which are transcribed by RNA polymerase I within the nucleolus represent large specialized transcription centers. The compartmentalization of transcription has the obvious advantage of concentrating the needed factors to ensure efficient interactions among the components of the transcription machinery. Transcriptionally active genes have been proposed to loop out from their chromosome territory and associate with transcription factories. Work of Osborne et al. showed that widely separated genes are recruited to shared RNAP II sites if transcriptionally active or reposition away when inactive [Osborne et al., 2004]. They have postulated that genes with transcriptional potential often move out to existing transcription factories when activated rather than assemble their own transcription sites de novo. Transcription units might be associated through promoters and/or enhancers, with loops forming a ‘cloud’ around the factory. Transcription factories are highly dynamic structures and involved transient interaction of factors with chromatin [Misteli and Spector, 1998]. Many transcription factors undergo rapid exchange between chromatin and nucleoplasm and for instance the glucocorticoid- and estrogen-receptor transcriptional co-activators bind to their specific response elements in the promoter with residence times
of only a few seconds [McNally et al., 2000].
IV.3 MS2-based tagging of RNA
Labeling either by fusion with a fluorescent protein or with a fluorescent-dye moiety allows the dynamic study of a protein of interest inside the cell in vivo. In the case of nucleic acids, intra-molecular tagging approaches are required because the target DNA or RNA are typically not accessible for tagging in vivo. Labeling of chromosomes in vivo can be achieved by fluorescent tagging of chromosome binding factors. Usage of the lac operator (lacO) DNA sequence which is
inserted into the DNA of interest provides an elegant way to label specific chromatic regions [Robinett et al., 1996]. The specific part of chromatin can be visualized by expression of a fluorescently tagged lac repressor (lacI) fusion protein which specifically binds to lacO sequence. This approach has been used to understand the chromosome positioning
Figure IV.7: RNA detection MS2-based system.
RNA molecules are detected using a fusion protein that comprises a fluorescent tag, such as green fluorescent protein (GFP) and the MS2 bacteriophage coat protein. MS2 has an extremely high affinity for a 19 nt RNA-recognition motif that is derived from the phage genome [Shav-Tal et al., 2004a].
and movements in living cells [Janicki et al., 2004]. The mRNA can be conjugated to fluorescent dyes and directly microinjected to the cells, but this is a rather invasive procedure [Ainger et al., 1993]. Several other techniques have been developed which include the use of fluorescently labeled probes for in vivo hybridization, the use of molecular “beacons” which are active only when bound to target RNA or the use of fluorescently tagged RNA-binding proteins [Politz et al., 1998]. However, none of those approaches provide information about the behavior of a single RNA molecule in real-time in living cells. An innovative approach was developed inserting a series of RNA aptamers– stem-loops into the transcript of interest. This RNA is then detected by high affinity specific interaction between RNA stem-loops and fluorescently labeled bacteriophage coat protein MS2. Therefore, the RNA detection system is comprised of two elements, a tag protein/peptide fused to the MS2 and a reporter RNA containing MS2-binding sites repeated in tandem. MS2 binds specifically to an RNA stem–loop structure consisting of 19 nucleotides (Fig. IV.7). This method allows to detect specific RNA in order to study RNA dynamics (i.e. biogenesis, processing, export) in vivo. This technique can be used in broad range of applications such as visualization and kinetics of RNA in single cells by tagging MS2 with a fluorescent mark; or affinity purification and further proteomic studies of endogenously assembled RNA-protein complexes in order to identify new factors involved in RNA
regulation.
The MS2-based system has been effectively used to tracking specific cytoplasmic and nuclear mRNA in yeast, Dictyostelium, plants, flies and mammalian cells. For instance MS2-GFP has been used to demonstrate that ASH1 mRNA is localized to the bud tip in S. cerevisiae in a zip-code-dependent manner [Bertrand et al., 1998]. Zip-codes are cis-acting elements often placed in 3’UTRs of mRNAs that specify the spatial information for mRNA targeting to a certain subcellular location. Proper ASH1 mRNA targeting required the SHE protein complex which is homologous to mammalian myosin motor proteins. Time-lapse imaging revealed that labeled mRNAs move to the bud tip at a rate of 0.2-0.44 µm/s in a directed fashion [Bertrand et al., 1998]. Using the MS2-system in living mammalian cells, it was possible to demonstrate that cytoplasmic mRNAs exhibit directed, corralled, diffusive and static movements [Fusco et al., 2003]. The β-actin zip-code increased the number and persistence of these directed movements relative to a non-zip-code containing control reporter. Single particle tracking and time-lapse imaging revealed directed mRNA movements along microtubules at an average rate of 1–1.5 µm/s. The MS2-system has also been used for the detection and kinetic studies of nuclear events such as transcription sites [Janicki et al., 2004]. Visualization and trafficking of single mRNP in the nucleus revealed that diffusion is the primary mechanism by which these molecules translocate from transcription site to nuclear
periphery [Shav-Tal et al., 2004]. The mRNP particles moved an overage of 5µm at velocities ranging from 0.03 to 0.08 µm /s. These movements were not affected by metabolic inhibitors of active transport and are consistent with diffusional rates. MS2-based approaches allowed the study of the dynamics of RNAPII in vivo [Darzacq et al., 2007]. Photobleaching and photoactivation of fluorescent MS2 proteins used to label nascent messenger RNAs provided sensitive elongation measurements. It was shown that RNAPII elongated at 4.3 kb/min on a synthetic gene. These data were consistent with elongation rates measured on integrated HIV-1 genes [Boireau et al., 2007]. Photobleaching of nascent HIV RNAs labeled with MS2-GFP revealed that the elongation rate of RNAPII was approximately 1.9 kb/min. Alternatively, the MS2 system can be converted from visualization tool to affinity purification coupled with proteomic studies. MS2 fused to the maltose binding protein (MBP) has been used to purify the spliceosome by affinity chromatography of cellular extracts [Zhou et al., 2002]. Thanks to this approach 145 distinct spliceosomal proteins were identified, making the spliceosome the most complex cellular machine so far characterized.
In conclusion, RNA detection by the MS2 system coupled with live cell imaging technologies is a powerful approach which allows the analysis of mRNA biogenesis in single cell in real time. Alternatively, MS2 system coupled with high affinity chromatography and mass
spectrometry-based techniques permits analysis of proteome with the identification of new components of RNA-protein complexes in vivo.
IV.4 The Green Fluorescent Protein
Green fluorescent protein was discovered by Shimomura et al. in 1962 in Aequorea jellyfish as a companion to the chemiluminescent protein aequorin [Shimomura et al., 1962]. Shimomura et al. also accurately described the appearance of GFP solutions: “a protein giving solution that look slightly greenish in sunlight through only yellowish under tungsten lights, and exhibiting a very bright greenish fluorescence in the ultraviolet of a Mineralite”. In the same year the same group showed that the emission spectrum of GFP has a maximum at 508 nm [Johnson et al., 1962]. They noted that the green bioluminiscence of living Aequorea tissue also peaked near this wavelength, whereas the chemiluminescence of pure aequorin was blue and peaked near 470 nm, which was
close to one of the excitation peaks of GFP. Therefore the GFP converted the blue emission of aequorin to the green glow of the intact cells and animals. Morise et al. in 1974 purified and crystallized GFP, measured its absorbance
Figure IV.8: Two Aequorea victoria GFP variants were examined for their different excitation maxima
spectrum and fluorescence quantum yield, and showed that aequorin could efficiently transfer its luminescence energy to GFP when the two were coabsorbed onto cationic support [Morise et al., 1974]. The first estimate for the monomer molecular weight, 27 kD, was obtained by Prendergast and Mann in 1978 [Prendergast and Mann, 1978]. Fundamental historical landmarks came more than 30 years after the discovery of GFP, when in 1992 Prasher et al. cloned the 966 nucleotides long gfp gene [Prasher et al., 1992] and in 1994 Chalfie et al. [Chalfie et al., 1994] and Inouye and Tsuji [Inouye and Tsuji, 1994a] demonstrated that the protein expressed from this gene is fluorescent also in other organisms. Therefore the gene contains all the information necessary for the posttranslational synthesis of the chromophore, and no jellyfish-specific enzymes are needed [Tsien, 1998a].
IV.4.1 GFP structure and folding
GFP has a unique 11 β-sheet barrel-like structure with a diameter of about 24 Å and a height of 42 Å (Fig. IV.9). The β-sheets form the walls of a can, and α-helix runs diagonally through the can. The chromophore is in the center of the 11 β-sheet and is linked by the α-helical stretch that runs through the center of the barrel. The chromophore, a p-hydroxybenzylidebeimidazolinone, formed by an intramolecular cyclization of 65Ser-Tyr-Gly67, is well protected in the center of the barrel [Prasher et al., 1992][Cody et al., 1993]. By enclosing the chromophore in the can, it may be protected from quenching by oxygen
and attack by hydronium ions [Rao et al., 1980]. The GFP folding into the 11-strand β-barrel is probably the most crucial event for the formation of the chromophore and its bioluminescence. The formation is autocatalytic, and the only external requirement is the presence of oxygen [Chalfie et al., 1994]. The β-can structure protects the chromophore and is presumably responsible for GFP stability [Rao et al., 1980]. GFP can be reversibly denatured. Fluorescence is completely lost in the denatured GFP but is regained when the β-can structure is reformed [Ward and Bokman, 1982]. The onset of fluorescence can therefore be used as an indicator that the 11-strand β-barrel has been formed. GFP fluorescence is
not observed until 90 min to 4 h after protein synthesis [Heim et al., 1994]. The protein folds quickly, but the subsequent fluorophore formation and oxidation is slow [Reid and Flynn, 1997].
IV.4.2 GFP optimizations and spectral variants
Aequorea is found in the cold Pacific Northwest, and mature fluorescent GFP is most efficiently formed at temperatures well below 37 °C [Zimmer, 2002]. This has limited the uses of GFP and has led to the search for mutants that mature more efficiently at higher Figure IV.9: Stereoview of three-dimensional structure of GFP [Ormoe et al., 1996].
temperature. Mutation of Phe64 to Leu results in improved maturation of fluorescence at 37 °C that is almost equivalent to maturation at 28 °C [Cormack et al., 1996].
Several modification were made to the original GFP to make it suitable for mammalian system,. The optimization of codon usage for mammalian expression has also improved overall brightness of GFP expressed in mammalian cells [Yang et al., 1996]. Over 190 silent mutations were introduced into the coding sequence to optimize expression in human tissues. A Kozak translation initiation was also introduced by insertion of a Val as the second amino acid [Kozak, 1989]. These improvements have resulted in a very useful probe for live cell imaging of mammalian cells and are common to all of the currently used FPs derived from Aequorea GFP [Goldman and Spector, 2005].
Although spectral variants with blue, cyan and yellowish-green emissions have been successfully generated from the Aequorea GFP, none exhibit emission maxima longer than 529 nm. The currently known GFP variants may be divided into seven classes based on the distinctive components of their chromophores [Tsien, 1998][Zimmer, 2002]:
1. Wild-type GFP. The chromophore is in an equilibrium between the phenol and phenolate form. It has a major excitation peaks at 395 nm and a minor peak at 475 nm.
2. Phenolate anion (EGFP). Ser65 has been substituted with Thr, Ala, or Gly. Does not have the 395 nm excitation peak.
3. Neutral phenol (Sapphire). Mutation of Thr203 to Ile almost suppresses the 475 nm excitation peak, leaving only the shorter wavelength peak at 399 nm. The emission peak is at 511 nm.
4. Phenolate anion with stacked π-electron system (yellow fluorescent proteins). Mutation of Thr203 to His, Trp, Phe or Tyr results in yellow fluorescent proteins. The YFPs have the most red-shifted absorption of all GFP mutant. YFPs have lower fluorescent quantum yield than GFPs, especially when excited at 475 nm.
An enhanced YFP mutant, the E2GFP, has been obtained that might be used as a single-biomolecule optical switch. As in most GFP molecules, prolonged or intense excitation, for E2GFP at 476nm, results in photobleaching. However, in E2GFP irradiation of the dark photobleached state at 350nm forms an excited state that photoconverts to a form which is fluorescent [Cinelli et al., 2001].
5. Indole in chomophore derived from Y66W (cyan fluorescent proteins). Substitution of Trp for Tyr66 produces a new chromophore with an indole instead of a phenol or phenolate. Excitation and emission wavelength are 436 and 476 nm, intermediate between neutral phenol and anionic phenolate chromophore. These protein are called cyan fluorescent proteins (CFPs) because their blue-green or cyan emission.
protein). Substitution of His for Tyr 66 shifts the wavelength yet shorter than Trp66. The excitation and emission peaks are around 383 and 447 nm, then the emission is blue. BFP suffers from a relatively low fluorescence quantum yield and is relatively easily bleached.
7. Phenyl in chromophore derived from Y66F. The shortest wavelength are obtained with Phe at 66.
The absorbance and fluorescent properties of the different classes are summarized in Table 1.
Mutation Common name λexc [nm] λem [nm] Class 1, wild-ype
None or Q80R Wild Type 395-397 504 470-475
F99S, M153T, V163A Cycle 3 397 506 475
Class 2, phenolate anion
S65T 489 509-511
F64L, S65T EGFP 488 507-509
F64L, S65T, V163A 488 511
S65T, S72A, N149K, M153, I167T Emerald 487 509 Class 3, neutral phenol
S20F, T203I H9 399 511
T203I, S72A, Y145F H9-40 399 511 Class 4, phenolate anion with stacked -electron system (YFP)
S65G, S72A, T203F 512 522
S65G, S72A, T203H 508 518
S65G, V68L, Q69K, S72A, T203Y 10C Q69K 516 529 S65G, V68L, S72A, T203Y 10C 514 527 S65G, S72A, K79R, T203Y Topaz 514 527
Class 5, indole in chromophore (cyan fluorescent proteins)
Y66W 436
Y66W, N146I, M153T, V163A W7 434 476 452 505 F64L, S65T, Y66W, N146I, M153T,
V163A
W1B or ECFP 434 476 452 505 S65A, Y66W, S72A, N146I, M153T,
V163A
W1C 435 495
Class 6, imidazole in chromophore (blue fluorescent proteins)
Y66H BFP 384 448
Y66H,Y145F P4-3 382 446
F64L, Y66H, Y145F EBFP 380-383 440-447 Class 7, phenyl in chromophore
Y66F 360 442
Table 1: Sprectral characterisitcs of the major classes of green fluorescent proteins [Tsien, 1998]. exc and em are the peak of the excitation and emission spectrum,λ λ respectively, in units of nanometers
IV.4.2.1 Fluorescent proteins not from Aequorea
The discovery of novel GFP-like proteins from Anthozoa have significantly expanded the range of colors available for cell biology applications. Despite the modest degree of sequence similarity, these GFP-like proteins probably share a β-can fold structure that is fundamental for the fluorescence of GFP. Proteins that fluoresce at red
Figure IV.10: Wild-type fluorescent proteins and their spectral variants.
Phylogeny (a) and excitation (b) emission (c) specta of fluorescent proteins. Colors indicate emission maxima [Miyawaki et al., 2003].
or far-red wavelengths (red fluorescent proteins or RFPs) are of specific interest because they can be used in combination with other fluorescent protein that fluoresce at shorter wavelength for both multicolor labeling and fluorescence resonance energy transfer (FRET) experiment [Miyawaki et al., 2003].
IV.4.3 Applications
Fluorescent protein are quite versatile and have been successfully employed in almost every biological discipline to investigate a remarkable array of properties and behaviors.
IV.4.3.1 Reporter gene
The first applications of GFP were as a reporter gene [Chalfie et al., 1994]. Gene expression can be monitored by using a gfp gene that is under control of a promoter of interest and measuring during time the GFP fluorescence which directly indicates the gene expression level in living cells or tissue [Zimmer, 2002].
IV.4.3.2 Fusion Tags
The most successful and numerous applications of the GFPs have been as genetic fusion partner to host protein to monitor their localization and fate. The gene encoding the GFP is fused in frame with the gene encoding the protein of interest and the resulting chimera are expressed in the cell or organism. Indeed GFP fusion fusion tags can be used to visualize dynamic cellular events and to monitor protein
localization. GFP has been targeted successfully to almost every major organelle of the cell, including plasma membrane, nucleus, endoplasmic reticulum, Golgi apparatus, secretory vesicles, mitochondria, peroxisomes, vacuoles and phagosomes (reviewed in [Tsien, 1998]).
IV.4.3.3 FRET
Fluorescence resonance energy transfer (FRET) is a nonradiative exchange of energy from an excited donor fluorophore to an acceptor fluorophore that is within 10-100 Å from the donor. In order for FRET to occur, the emission spectrum of the donor has to overlap with the excitation spectrum of the acceptor. The FRET efficiency rapidly decreases with increasing distance between the two fluorophore, the efficiency is inversely proportional nearly to the sixth power of the distance. FRET is a powerful technique for studying protein-protein interactions in vitro and in vivo [Marcello et al., 2001][Marcello et al., 2003][Pantano et al., 2006].
IV.4.3.4 pH sensor
Wild-type GFP and many of its mutant display pH-dependent fluorescent behavior and have been used to monitor pH in vivo [Wachter et al., 1997]. A series of pH-sensitive GFP mutant have been developed by structure-direct combinatorial mutagenesis; they are often know as pHluorins [Miesenboeck et al., 1998].
IV.4.3.5 Photobleaching and photoactivation
imaging can be used to investigate protein dynamics in living cells by making its movement observable. Photobleaching is the photo-induced alteration of a fluorophore that extinguishes its fluorescence. Photoactivation works by converting molecules to a fluorescent state by using a brief pulse of high-intensity irradiation. After fluorescently highlighting specific populations of molecules can be followed as they re-equilibrate in the cell. The extent and rate at which this occurs can be quantified and used with computer-modeling approaches to describe the kinetic parameters of a protein [Lippincott-Schwartz et al., 2003].
IV.4.3.5.1 Photoconversion
An important phenomenon, relevant either in phobleaching and in FRET measurements, is the photoconversion of YFP in CFP-like-species after photobleaching [Valentin et al., 2005]. This process initially controversial [Thaler et al., 2006] has been later confirmed [Kirber et al., 2007].
IV.5 Fluorescence Recovery After Photobleaching
Fluorescence recovery after photobleaching (FRAP) is a method for measuring the bi-dimensional or three-dimensional mobility of fluorescent particles. A defined portion of the system containing mobile fluorescent molecules is exposed to a brief and intense focused laser beam, thereby causing irreversible, or almost irreversible, photochemical bleaching of the fluorophore in that region. The


![Table 1: Sprectral characterisitcs of the major classes of green fluorescent proteins [Tsien, 1998]](https://thumb-eu.123doks.com/thumbv2/123dokorg/4927233.51551/45.892.130.737.114.1021/table-sprectral-characterisitcs-major-classes-fluorescent-proteins-tsien.webp)