UNIVERSITÀ DEGLI STUDI DELLA TUSCIA DI VITERBO
DIPARTIMENTO PER LA INNOVAZIONE NEI SISTEMI BIOLOGICI, AGROALIMENTARI E FORESTALI
(DIBAF)
CORSO DI DOTTORATO DI RICERCA
BIOTECNOLOGIA DEGLI ALIMENTI - XXVI CICLO
Different regulation of target genes coding components of phenolics
compounds biosynthesis pathways and their accumulations in apple and
olive mutants
S.S.D AGR15Author Marco Cirilli
Coordinator of PhD course Tutor
Prof. Marco Esti Prof. Rosario Muleo
Co-Tutor
SUMMARY
INTRODUCTION 3
SECTION I
MOLECULAR AND BIOCHEMICAL CHARACTERIZATION OF
THE ITALIAN RED PASSION APPLE LINES 5
1 STATE-OF-THE-ART 5
1 AIMS OF THE STUDY 17
1 MATERIAL AND METHODS 18
1 RESULTS
1.11 PHENOTYPICAL OBSERVATION OF ITALIAN RED PASSION SEEDLINGS AND
MOLECULAR ANALYSIS OF MYB10 LOCUS 26
1.12 IRP LINES APPLE GROWTH AND DEVELOPMENT 29
1.13 COLOR EVOLUTION DURING APPLE FRUIT DEVELOPMENT 32
1.14 TOTAL POLYPHENOL AND ANTHOCYANIN CONTENT IN FLESH AND PEEL
TISSUES OF ITALIAN RED PASSION APPLE LINES 36
1.15 ANALYSIS OF MAIN PHENOLICS COMPOUNDS CONTENT IN APPLE FLESH
AND PEEL OF IRP LINES 38
1.16 ANTIOXIDANT ACTIVITY OF IRP APPLE FLESH EXTRACT 41
1.17 APPLE SENSORY EVALUATION 43
1.18 CONSUMERS’ PREFERENCES AND MARKET ANALYSIS 46
MOLECULAR ANALYSIS 50
1.19 TRANSCRIPT LEVEL OF STRUCTURAL GENE AND TRANSCRIPTION FACTORS
REGULATING FLAVONOID PATHWAYS IN APPLE FLESH AND PEEL OF IRP LINES 50 1.20 MAIN PHENOLICS CONTENT OF C2 AND C15 ‘WHITE AND RED ISLANDS’
COMPARED TO CV ANNURCA 55
1.21 MOLECULAR ANALYSIS OF RED AND WHITE ISLANDS 57
1.22 EPIGENETIC REGULATION OF MYB TRANSCRIPTION FACTORS 59
1. DISCUSSION OF SECTION I 61
1 CONCLUSION AND PERSPECTIVE 65
SECTION II
COLOR DEVELOPMENT IN OLIVE FRUIT 66
2 STATE-OF-THE-ART 66
2 AIMS OF THE STUDY 71
2 MATERIALS AND METHODS 72
2 RESULTS 77
2.11 DEVELOPMENTAL OBSERVATION OF OLIVE FRUIT IN CULTIVARS LECCINO,
LEUCOCARPA AND BUSCIONETTO 77
2.12 PIGMENTS ACCUMULATION DURING OLIVE FRUIT RIPENING 78
2.13 MAIN PHENOLICS COMPOUNDS IN RIPE DRUPE OF CULTIVARS
2.14 TOTAL FLAVONOIDS CONTENT DURING OLIVE FRUIT DEVELOPMENT IN
CULTIVARS LECCINO AND LEUCOCARPA 83
2.15 EVOLUTION OF METABOLIC ACCUMULATION PROFILE DURING
OLIVE DRUPE DEVELOPMENT 84
2.16 FRUIT FIRMNESS 87
2.17 APPLICATION OF NIR-AOTF TECHNOLOGY FOR ON-FIELD PREDICTION OF PIGMENT AND PHENOLIC COMPOUNDS DURING THE RIPENING OF OLIVE DRUPE 88 2.18 BIOINFORMATIC IDENTIFICATION OF GENES ENCODING STRUCTURAL GENES
AND TRANSCRIPTION FACTORS PUTATIVELY INVOLVED IN FLAVONOID
PATHWAY REGULATION FROM OLIVE FRUIT EST DATABASE 93
2.19 PHYLOGENETIC CLUSTERING OF CANDIDATES TRANSCRIPTION FACTORS 101 2.20 TEMPORAL EXPRESSION OF GENES ENCODING STRUCTURAL GENES
DURING OLIVE FRUIT DEVELOPMENT AND RIPENING 104
2 DISCUSSION OF SECTION II 115
2 CONCLUSION AND PERSPECTIVES 119
SECTION III
IDENTIFICATION AND CHARACTERIZATION OF APPLE AND OLIVE SMALL-RNA
WITH POTENTIAL ROLE IN HUMAN HEALTH 120
3 STATE-OF-THE-ART 120
3 MATERIALS AND METHODS 125
3 AIMS OF THE STUDY 125
3 RESULTS 125
3.1 BIOINFORMATICS PREDICTIONS OF OLIVE HOMOLOGUES OF HUMAN MIRNAS 125 3.2 OLIVE MIRNA ABUNDANCE IN DRUPE, FILTERED AND NON-FILTERED
OLIVE OIL AND OLIVE PATÈ 128
3.3 APPLE MIR858 ABUNDANCE IN LYOPHILIZED APPLE AND TOTAL POLYPHENOLS
EXTRACTED FROM APPLE FLESH 130
3 DISCUSSION AND PERSPECTIVE SECTION III 131
REFERENCES 132
INTRODUCTION
Many epidemiologic studies support the association between high intake of fruit and vegetables, and low risk of many chronic diseases. The presence in plant-derived foods of a wide range of phytochemicals has been emerged as the main biologically plausible reason of such association. Phytochemicals are plant constituents characterized by bioactivities towards animal biochemistry and metabolism, which have the potential of being incorporated into foods or food supplements as nutraceutical, or into pharmaceuticals (Dillard et al., 2000). The term nutraceutical was coined by De Felice (1995), defining as ‘any non-toxic food extract supplement that has scientifically proven health benefits for both disease treatment and prevention’. However, health effects is the result of the synergic action of numerous phytochemicals supplied by foods and/or diets at nutritional doses, rather than a simple drug (Fardet and Rock, 2013). Phytochemicals could regulate animal biochemistry, metabolism and physiology in different ways, as for example, they could be substrates for biochemical reactions, cofactors or inhibitors of enzymatic reactions, scavengers of reactive or toxic chemicals species, etc. (Dillard et al., 2000). Hundreds of researches have been added supporting evidences about beneficial role of phytochemicals on human health, related to the prevention of cardiovascular disease, cancer (Russo et al., 2005; Surh, 2003), diabetes, microbial, viral and parasitic infections and many other.
In the past, breeding programs were been aimed mainly to increase plant yield and productivity, with the results of lowering nutraceutical values of many common fruit and vegetables. However, the recent growing interest from nutritionist and consumers for food phytochemicals has opened new challenges for agriculture and food industries, particularly towards nutraceutical and functional foods. A functional foods is defined by Roberfroid (1999) as ‘foods that should have a relevant effect on well-being and health or result in a reduction in disease risk'.
The growing knowledge about genetic mechanism regulating biosynthesis and accumulation of many important phytochemical classes in plants has speeded genetic improvement programs for increasing phytochemicals content of common fruit and vegetables crops. Plant breeders have identified a great source of genetic variation in wild species, often characterized by a superior ability in phytochemicals accumulation compared to cultivate ones (Hajjar et al., 2007). However, the introgression of favorable genetic traits from wild species through traditional breeding methods is laborious and time-consuming, since requires the cleaning from linkage drag caused by disturbing neighboring wild alleles (Collard and Mackill, 2007; Dubcovsky, 2004). OGM-based approaches could be potentially more rapid and effective compared to other breeding methods. However, the difficulty to fine-tune transgene expression might results in unbalanced accumulation of phytochemicals, negatively affecting sensorial attributes of the products. In addition, consumers often prefer OGM-free products (Aldrich and Blisard, 1998) and OGM-plants cultivation is prohibited or severely limited in some countries. Spontaneous mutants of cultivated variety for phytochemicals accumulation represent important resources both for scientific and productive purpose. At scientific
level, they represent important tools for understanding genetic and biochemical mechanisms regulating phytochemicals accumulation. At productive and agro-industrial level, these mutants might be used for direct production of functional foods or for genetic improvement of other cultivars. Indeed, spontaneous mutants could effectively speeded breeding programs, since they have only a limited number of undesired character compared to wild species. Moreover, respect to OGM-plants, mutated gene/s are often better integrated in transcriptional regulation network, resulting in a more fine-control of phytochemicals accumulation.
In the first part of the thesis is aimed to characterize at pomological, biological, genetic and molecular level, the new red-fleshed apples line, Italian Red Passion, obtained through traditional breeding methods. The second part of the thesis is aimed to elucidate genetic mechanism regulating anthocyanin biosynthesis in olive fruit, comparing olive cultivars showing a different pattern of drupe pigmentation. In addition, the application of NIRS technology for on-field monitoring of pigments (and other phenolic compounds) accumulation in olive, has been evaluated. In the third part of the this research work, advanced studies are reported on the small-RNAs, their presence in fruit and derived food, and their role in plant genes network regulation and human health gene regulation.
SECTION I
MOLECULAR AND BIOCHEMICAL CHARACTERIZATION OF THE ITALIAN RED PASSION APPLE LINES
1. STATE OF THE ART
1.1 EFFECT OF APPLE CONSUMPTION ON HUMAN HEALTH
Apple is a widely consumed fruit and a rich source of phytochemicals. Epidemiological studies have linked the consumption of apples with reduced risk of some disease including cardiovascular pathologies, cancer, asthma and diabetes (Boyer et al., 2004). Several studies have specifically linked apple consumption to a reduced risk of lung cancer, especially in woman (Feskanich et al., 2000). Moreover, Le Marchand et al. (2000) associated this reduced risk to flavonols intake, such as quercetin, although results were not statistically significant. The Women's Health Study (Sesso et al., 2003) found a significant reduced risk of cardiovascular disease associated with apple regular consumption. Women ingesting the highest amounts of flavonoids had a 13–22% decrease in cardiovascular disease risk. Moreover, apple consumption was also inversely associated with coronary heart disease in postmenopausal women (Arts et al., 2001). The intakes of catechins and epicatechins, both constituents of apples, were strongly and inversely associated with coronary heart disease and the same authors suggested that apple catechins could be more bioavailable than the catechin and epicatechin gallates commonly found in teas. Apple consumption has been linked with asthma and diabetes prevention (Esenkrantz et al., 2003; Knekt et al., 2002), and positively associated with general pulmonary health (Woods et al., 2003). Anthocyanin have been implicated in a diverse range of health-promoting properties (Lila, 2004) and their antioxidant properties has been established from various fruit (Smith et al., 2000; Chun et al., 2003).
1.2 APPLE FRUIT COMPOSITION AND PHYTOCHEMICALS
Apple fruit is prevalently composed by water, which represent about of 85% of fresh weight; the solid component is predominate by carbohydrates (especially fructose and fiber) which ranged from 9% to 13%, depending from many factors. Moreover, apple fruit contain a good percentage of minerals and vitamins, in particular vitamin C and very low amounts of lipids (0.4%) and protein (0.3%). In addition, apple fruit contain relevant amount of some class of secondary metabolites, such as phenolic acid and flavonoids. However, their content is variable, depending from many factors including cultivars, environmental condition and farm management. During the last 13 years, a large number of studies reporting polyphenol concentrations of apples has been published. The Phenol Explorer (Neveu et al., 2010), available at http://www.phenol-explorer.eu/website.html, is a powerful tool to get an overview of potential polyphenol contents and ranges in different apples cultivars and in different environmental and agronomical condition. In general, five polyphenol classes predominate
apples fruit, such as flavan-3-ols, phenolic acids, dihydrochalcones, flavonols and anthocyanidins. The amount of each class varied depending from tissues (Francini et al., 2013), as shown in figure 1.
The flavan-3-ols are the most abundant group of polyphenols in apples. They could be divided into monomeric, oligomeric and polymeric flavan-3-ols. The only two monomeric flavan-3-ols in apples are catechins and epicatechins. The condensation of this two monomers results in oligomeric flavan-3-ols, which are called procyanidins. The most important dimeric procyanidins in apples are procyanidin B1 and B2. Treutter at al. (2001) reported a range of 1-8.4 mg/100 g FW for procyanidin B1 and 1.5-23 mg/100 g FW for procyanidin B2 in fresh apple fruits. The content in the apple peel ranged from 10 to 100 mg/100 g of fresh weight for procyanidin B2. Additionally, oligomeric procyanidins with 5.7-7.1 average degree of polymerization seem to be the most abundant polyphenols in apples (Guyot et al., 2002). Monomeric and oligomeric flavan-3-ols are present in both flesh and peel, although peel contained higher amounts (Tsao et al., 2003).
Phenolic acids are phenols having one carboxylic acid group and thus, belong to organic acids. Hydroxycinnamic and hydroxybenzoic acids represent the main subclasses. In apples, hydroxycinnamic acids content is relevant, particularly chlorogenic acid, the ester of caffeic acid (CF) and quinic acid (QA) but also p-Coumaroylquinic acids (CQA). The concentration ranged from 0.3 to 3.5 mg/100 g of fresh weight for CQA in whole apple fruits and 0.54-3.9 mg/100 g of fresh weight for CQA in peel tissue, as reported by Treutter et al. (2001).
Dihydrochalcones are compounds exclusively present in Pomaceae, such as apple and pear fruit. These class of compounds have a chemical structure composed by an open ring (Crozier et al. 2009). Major dihydrochalcones contained in apples are phloridzin and phloretin-xyloglucoside, differing for substituted sugar at the superior hydroxyl group (glucose in phloridzin, xylose in phloretin). The amount varied from 0.3 to 16 mg/100 g of fresh weight for phloridzin and from 1 to 23 mg/100 g of fresh weight for phloretin, whereas major levels in apple skin are reported, ranged between 0.6-65.4 mg/100 g of fresh weight and 7-27 mg/100 g of fresh weight, respectively (Treutter et al., 2001). Additionally, dihydrochalcones represent up to 60 % of the polyphenols in the seeds (Tomàs-Barberàn et al., 2000).
Flavonols are glycosylated quercetin derivatives mainly present in apple peel. The glucosyl moiety is mainly composed by galactose, although glucose, xylose, arabinose, rhamnose and
anthocyanins only in peel tissues. However, particularly apple fruit of Malus wild species, accumulate anthocyanins also in flesh tissue (Volz et al., 2009).
Figure 1. Flavonoid content of flesh, peel and seed, as determined by various authors (adapted from Francini et al., 2013). * mg/g DW; ** mg/100 g FW; - not determined.
1.3 FLAVONOID BIOSYNTHESIS
Flavonoids are synthesized by the combination of 4-coumaroyl-CoA with malonyl-CoA to yield the class of chalcones, which represent the backbone of flavonoids compounds. Flavonoids pathways (Figure 2) begin with the reaction catalyzed by the phenylalanine ammonia-lyase (PAL) enzyme, which converts the amino acid phenylalanine to cinnamic acid, which could be further utilized by phenylpropanoid enzymes to synthesize phenolic acids and lignin, or converted to chalcones by the enzyme chalcone synthase (CHS), in the presence of malonyl-CoA (malonyl Co-A). This represents the first committed step in the synthesis of flavonoid compounds. Whereas the biosynthesis of chalcones and flavonoids is well understood, the biosynthesis of closely related dihydrochalcones has been partially elucidated only recently. The high similarity of coumaroyl-CoA and p-dihydrocoumaroyl-CoA (required for dihydrochalcones biosynthesis) suggests that chalcone synthase enzyme could utilize both substrates. Studies of chalcone synthases from M. domestica confirmed this hypothesis (Gosch et al., 2009). The key unidentified enzyme is a putative carbon double-bond reductase, which acts on p-coumaroyl-CoA to produce the dihydro-p-coumaroyl-CoA precursor (Dare et al., 2013). The same authors demonstrated that the silencing of ENRL3 and ENRL5 genes, coding
for two enoyl-reductase isoforms, induce a reduction of phloridzin content, although the same authors speculate that even other genes could be play a relevant role in the regulation of dihydrochalcones content. The PGT1 gene encode the glucosyltransferase enzyme which converts phloretin to phloridzin (phloretin-2-glucoside) was also identified (Judgè et al., 2010).
Figure 2. Flavanone and chalcones simplified biosynthesis pathway (as revised from Dare et al., 2013).
Down-stream of chalcones, biosynthesis generates the dihydrokaempferol, and the reaction is catalyzed by the 3ß-hydroxylase (F3H) enzyme (Pelletier et al., 1996). Dihydrokaempferol is hydroxylated to produce dihydroquercetin by flavonoid 3’-hydroxylase (F3’H) or flavonoid 3’,5’-hydroxylase (F3’5’H) enzymes (Holton and Cornish, 1995). The conversion of the different dihydroflavonols in flavonols such as kaempferol and quercetin, is catalyzed by the flavonol synthase
anthocyanin glycosides could be produced, depending on the dihydroflavonol substrate and the carbon atom to which the aglycone is conjugated. In addition, further modification of anthocyanin glycosides by glycosylation, methylation and acylation increases the number of different anthocyanins that occur in nature. Recently, the biosynthesis of flavan-3-ols was investigated also in apple (Henry-Kirk et al., 2012). The genes leucoanthocyanidin reductase (LAR) and anthocyanidin reductase (ANR), encoding enzymes for the synthesis of catechins (2,3-transflavan-3-ol) and epicatechins (2,3-cis-flavan-3-ol), respectively. Catechins and epicatechins both act as initial substrate for the synthesis of condensed tannins. The mechanism by which extension units are added to produce a polymeric tannin molecule remains unknown, although some polymerization theories have been presented (Zhao et al., 2010).
1.4 ANTHOCYANINS BIOSYNTHESIS IN APPLE
Many genes encoding the anthocyanin biosynthesis enzymes, such as chalcone synthase CHS, F3H, DFR, LDOX and UFGT, are coordinately expressed during apple fruit development and their transcription levels are positively correlated with anthocyanin concentration (Ben-Yehuda et al., 2005). Deduced amino acid sequences of these genes in cultivar Fuji showed high homology to corresponding protein sequences from other plants (Kim et al., 2003). The mRNAs of anthocyanin biosynthetic genes are detected preferentially in peel tissue and transcription of the genes was coordinately induced by light (Kim et al., 2003). Moreover, transcripts were detected abundantly in the skin of red-pigmented apple, but rarely in non-red pigmented apple cultivars, confirming their roles in determination of apple skin color (Kim et al., 2003). However, southern hybridization using fragments of anthocyanin structural genes as probes revealed little polymorphism between green and red cultivars, demonstrating that both green and red ones carry on anthocyanin structural genes. Interesting, Kondo et al. (2002) detected CHS, F3H, DFR, LDOX and UFGT transcripts already at early developmental stages (20 Days after full bloom) in both dark and light grown fruit. These results are in agreement with those of Ju et al. (1995) which found higher UFGT activity in red-striped areas contained more anthocyanin compared to green colored adjacent areas, but no differences in PAL and CHS activities. Moreover, Ju et al. (1997) have not been found a correlation between DFR activity and anthocyanin accumulation in apple fruit. It appears that DFR is necessary, but not a limiting point, for anthocyanin synthesis in apples.
1.5 TRANSCRIPTIONAL REGULATION OF ANTHOCYANIN BIOSYNTHESIS IN APPLE The production of secondary metabolites in response to environmental and developmental cues is regulated by transcription factors (TFs), proteins that bind to specific DNA sequences modulating the initiation of target gene transcription. The plant MYB family protein comprises many of the most important TFs regulating phenylpropanoid and flavonoid biosynthesis, together with HELIX-LOOP-HELIX (bHLH) and WD-repeats (WDR) proteins families. The co-ordinate expression of particular flavonoid biosynthetic genes in response to developmental (Pelletier et al., 1999) and environmental
cues (Kim et al., 2003) has long been indicative that these genes are regulated at the level of transcription. Since the first plant MYB gene to be isolated, COLOURLESS1 (C1) from maize, regulating genes for anthocyanin synthesis (Paz-Ares et al., 1987), many TFs controlling flavonoid pathway has been identified and characterized in a variety of plant species, including snapdragon, petunia, Arabidopsis, grape and apple. Many species regulate flavonoid pathways branching through discrete control of specific gene subsets or individual flavonoid genes (Figure 3). R2R3-MYB proteins that specifically regulate anthocyanin (PRODUCTION OF ANTHOCYANIN PIGMENT1, AtPAP1), (Borevitz et al., 2000) flavonol (AtMYB11, AtMYB12, AtMYB111) (Stracke et al., 2001) or flavan-3-ols synthesis (TRANSPARENT TESTA2, AtTT2) (Nesi et al., 2001) have been identified from Arabidopsis. Transcriptional control of genes, involved in anthocyanin biosynthesis, has also been demonstrated in grape berries by VvMYBA1 (Kobayashi et al., 2004). Further research in grape has involved the discovery of more R2R3-MYB transcription factors, including VvMYBPA1 which control flavan-3-ols biosynthesis (Bogs et al., 2007), VvMYBF1 as a specific regulator of flavonol biosynthesis (Czemmel et al., 2009), and VvMYB5a and VvMYB5b which have a broad effect on a number of phenylpropanoid genes (Deluc et al., 2008).
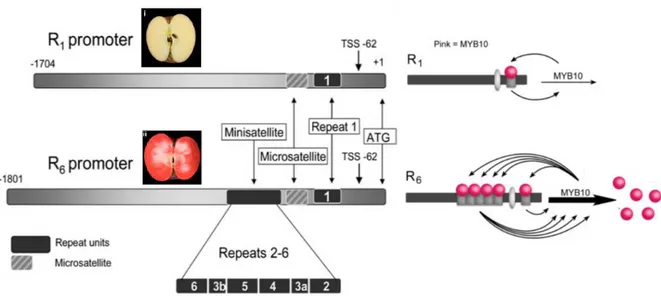
As reported by Volz et al. (2007) red-fleshed apple could be divided into two type, I and II based on the presence (type I) or absence (type II) of red pigmentation in other plant organs, such as young leaf, flowers, petiole and vasculature. Many researcher have been investigated molecular basis of these two phenotypes, ultimately leading to the identification of a R2R3 MYB, MdMYB1/10 transcription factor responsible for anthocyanin accumulation (Ban et al., 2007b; Espley et al., 2007; Takos et al., 2006a). MdMYB10 transcript levels strongly correlate with peel anthocyanin levels, and this gene is able to induce anthocyanin accumulation in heterologous and homologous systems (Espley et al., 2007). In addition, MdMYB10 cosegregates with the Rni locus, mapped in long arm of chromosome 9 of apple genome, a major genetic determinant of red foliage and red color in the flesh of apple fruit (Chagne et al., 2007). Type I red-fleshed apples are characterized by a 101 bp insertion in promoter region at MdMYB10 gene (Figure 4), composed by 5 tandem duplication of a 23 bp microsatellites (Espley et al., 2007), forming the so called R6 domain, to distinguish from the 23-bp sequence motif, named R1, present in wild type MdMYB10 allele (Figure 4). Transient assays and electrophoretic mobility shift assays demonstrated that this 23-bp sequence motif is a target of the MYB10 protein itself, and the number of repeat units correlates with an increase in trans-activation by MYB10 protein.
Figure 4. The 121 bp minisatellites insertion within MdMYB10 promoter R6 MYB10, confer trans-activation of
MYB10 protein itself, inducing anthocyanins accumulation in apple flesh.
Other apple MYBs, such as MYB1 and MYBA, were also reported to regulate genes in the anthocyanin pathway. Takos et al. (2006) identified three alleles of MdMYB1. The MdMYB1-1 allele was found to be expressed in red apple skin, whilst green or yellow apple skin possessed the MdMYB1-2 and MdMYB1-3 alleles type. Although functional assays did not revealed differences among the three types of MdMYB1 alleles, important differences were found regarding promoter region and first intron of MdMYB1-2/3 alleles, suggesting that these mutations could affect their
transcriptional regulation. MdMYBA is also more highly expressed in redder peels and the redder cultivars and its transcription is induced by UV-B light and low temperature (Ban et al., 2007). As MdMYB1 and MdMYBA share identical sequences, and MdMYB10 and MdMYB1 genes are located at very similar positions on linkage group 9, it was concluded that these genes were allelic (Lin-Wang et al., 2010). In contrast, the type 2 red-flesh apple phenotype does not cosegregate with molecular markers linked to MdMYB10 (Volz et al., 2006) and Chagnè et al. (2013) demonstrated that the red-flesh cortex type II phenotype is associated with enhanced expression of MdMYB110a, a paralog of MdMYB10. Both MdMYB10 and MdMYB110a have conserved function in some cultivars, but they differ in their expression pattern and response to fruit maturity. The expression of several anthocyanin pathway genes was found to be regulated by both MdMYB10 and MdMYB1. Transient assay demonstrated the ability of MYB10 to induce DFR promoter activity, while ectopic expression of MdMYB10 in transgenic plant enhance also expression of UFGT and CHI genes(Espley et al., 2007). A similar results was found by Takos et al. (2006), which demonstrated the ability of MYB1 to activate UFGT and DFR promoters. Although MYB1/10/A play a pivotal role in orchestrating anthocyanin accumulation, an excellent survey of van Nocker et al. (2011) highlighted that the presence of the R6 allele alone was, at least in some cases, insufficient to drive development of pigmented flesh. Analyzing red-color patterning in hundreds of different accession, authors identified genotype carry on R6 allele yet did not develop significant pigmentation. In addition, although R6 allele is associated to red-flesh pigmentation, many of these accessions produced fruit exhibiting various internal coloration patterns, unrelated to whether R6 was heterozygous or homozygous. Collectively, these observations suggest that the effect of R6 is extensively modified in a genotype-specific manner. Finally, as reported by Espley et al. (2013), ectopic MdMYB10 expression in transgenic Royal Gala plants induced a strong increase in total polyphenol content, suggesting a broad role for MYB10 in general flavonoid pathways regulation. However, Volz et al. (2007), analyzing cross populations carry on mutated MYB10 allele, did not observe a tight association between R6 mutation and total polyphenol content, suggesting that mutation could affect polyphenol content only in genotype-dependent manner.
display different binding specificities as determined by sequences within the DNA binding domain. On the other hand, proteins belonging to the bHLH and WD40 families are more highly conserved and are consequently often involved in regulation of several processes (Koes et al., 2005). Early studies in maize demonstrated that pigments production requires the interaction of the R/B family and a member of the C1/Pl family (Cocciolone and Cone, 1993). The R/B gene family of transcription factors encodes proteins with homology with the basic helix-loop-helix (bHLH) motif in the MYC transcription activator (Chandler et al., 1989). In Arabidopsis, the WD40 protein TRANSPARENT TESTA GLABRA1 (TTG1) works together with AtPAP1 (MYB) and GLABRA3 (AtGL3, bHLH) or ENHANCER OF GL3 (AtEGL3) to regulate anthocyanin synthesis (Zhang et al., 2003), and works in combination with the AtTT2 (MYB) and AtTT8 (bHLH) to control tannin production (Baudry et al., 2004). In addition to the activators, transcriptional repressors may modulate flavonoid biosynthesis, in particular members of C2-repressor motif MYB subclade 4. In Arabidopsis, C2-repressor clade include AtMYBL2 gene, which could inhibit anthocyanin synthesis in transgenic plants (Matsui et al., 2008). In kiwifruit, ectopic expression and suppression of the persimmon MYB4 gene (an orthologs of AtMYBL2) negative regulate tannin synthesis (Akagi et al., 2009). The strawberry R2R3-MYB transcription factor FaMYB1 is capable of lowering the expression of anthocyanin and flavonol biosynthetic genes in transgenic tobacco (Aharoni et al., 2001).
1.7 EPIGENETIC REGULATION OF FLAVONOIDS BIOSYNTHESIS
MicroRNAs (miRNAs) are a class of 21-24 nucleotides non-coding RNAs involved in post-transcriptional gene silencing in eukaryotes (Reinhart et al., 2002). MicroRNAs are generated from single-stranded RNA precursors (transcribed from the genomic loci-microRNA genes) forming an imperfect stem-loop secondary structure (Reinhartet al., 2002) which is processed to a mature miRNA duplex in two steps by the Dicer Like enzyme1 (DCL1). After being exported to the cytoplasm, the mature miRNAs are loaded onto the Argonaute (AGO) proteins (Figure 5), the catalytic centers of plant RNA-induced silencing complexes (RISC) (Vaucheret et al., 2004). The miRNA loaded RISC binds to the target mRNA in a sequence specific manner that cleaves the target (the predominant mechanism in plants) or prevents the translation (Brodersen et al., 2008). The plant miRNA world has expanded with the cloning of numerous miRNAs from various plant species and different environmental conditions, revealing highly conserved nature of miRNAs across the plant kingdom (Willmann & Poethig, 2007). Plant miRNAs are involved in a plethora of function, regulating plant growth and development. MYB gene family are target by at least three miRNA classes, miR858, miR828 and miR159 in model species Arabidopsis (Dubos et al., 2010). Recently, Xia et al. (2012) demonstrates that miR858 potentially target up to 53 different MYBs, many of them expressed in fruit and putatively involved in proanthocyanidin biosynthesis, such as, for example, MdMYB9 and MdMYB12 (orthologs of AtTT2 and VvMYB5a, previously described) or some putative anthocyanins repressor, such as MdMYB16, belonging to the MYBC2-repressor clade.
Figure 5. RNA silencing machinery. The mature miRNAs are loaded onto the RNA-induced silencing complexes (RISC) and binds to the target mRNA in a sequence specific manner.
1.8 BREEDING FOR RED PIGMENTATION IN APPLE FLESH
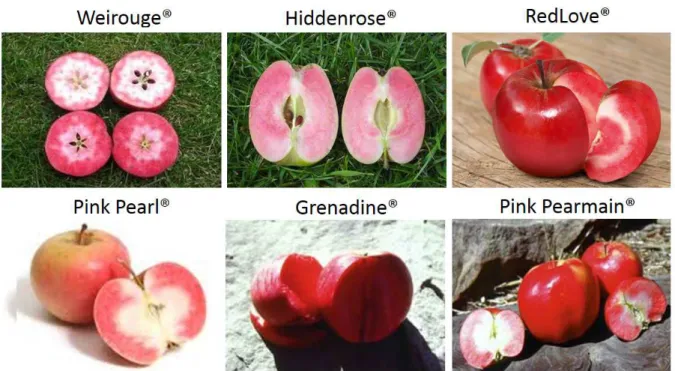
The most used breeding strategy in apple to achieve red-flesh color or polyphenol content increase is based through the cross of selected cultivars with Mauls wild species, such as M. niedzwetkyana, M. sieverisii or M. kirghisorum. The fruits of M. niedzwetzkyana Dieck. are violet-purple in colour with a waxy bloom while their flesh is pink to violet-purple in colour (Dzhangaliev et al., 2003). The fruit are normally large sized and usually astringent. This wild species has been used in many breeding programs and some of its accession include cultivars such as Redfield and Redflesh. M. sieversii fruit show a variable fruit peel and flesh colour, from yellow to red and white to yellow, respectively. Skin colour of Kirghiz apple (M. kirghisorum) is green, yellow or reddish and the flesh colour is white with a flavor that is sour-sweet, acid to bitter and astringent. Despite wild apples species are mainly used in breeding programs due to their resistance to a range of diseases such as apple scab, recently they are also used to incorporate novel colour, aroma, flavour, size, and texture into breeding programs (Forsline et al., 2003). However, wild apples are often acidic and high in
Grenadine and Pink Pearmain. Apples of Weirouge cultivars represent a red-fleshed German cultivar, bred in Weihenstephan (Germany) primarily for processing purposes and officially registered in 1997. Plant & Food Research in New Zealand has conducted research on red-fleshed apples since 1998 (Volz et al., 2009). High quality white fleshed apples were crossed with accessions of red-fleshed cultivars to give rise to progenies with various colors (Volz et al., 2006, Volz et al., 2009). However, no red-fleshed cultivar has yet been released from this breeding programme. In 2008, Next Fruit Generation (NFG) introduced a red-fleshed cultivar, Redlove, after 12 years of breeding by Swiss researchers, starting with a small, bitter red-fleshed apple from eastern Germany (Freshplaza, 2008). Annurca apples, is an old Italian variety that is used in this research thesis with Italian Red Passion to highlight the general perception that apples are good for health.
Annurca apple fruit is one of the most important cultivars of southern Italy (Scalzo, et al., 2001). The apple is not very sweet, but has an average amount of aroma and good flavor characteristics, it can be recommended, for example, in a low-sugar diet. It represents 60% of the Campania County apple production (D’Abrosca et al., 2006) and 5% of the national apple production and it has recently obtained the official designation of Protected Geographical Indication (PGI) from the European Council (Commission Regulation, EC, No. 417/2006). The Annurca variety is characterized by a strong antioxidant activity (Cefarelli et al., 2006; Napolitano et al., 2004) as a function of catechins and phloridzin concentrations. This phenomenon was found in other apple varieties, but is more evident in the Annurca, probably due to its genetic background.
1.9 SENSORY EVALUATION OF APPLE AND OTHER FRUITS
Consumers use sensory analysis to determine the degree of liking, preference and acceptability of different products. It is a scientific tool used to investigate measure and explain the difference in the properties of food as these are recognized through sight, hearing, taste, smell and touch (Lawless and Heymann, 1998). Two types of sensory analysis are common used: 1) Analytical sensory evaluation, for evaluate the degree of variation in products or food through a trained panel, and 2) consumer sensory analysis to determine the degree of liking, preference and willingness to purchase a product by using the target consumers (Lawless and Heymann, 1998). Sensory attributes mostly evaluated for apple include texture traits, such as crunchiness, crispness, juiciness, mealiness and flavor traits, such as sweetness, sourness, astringency, aroma, odour (Table 1). Texture mainly depend from the rearrangement of the primary wall and middle lamella in apple cells during ripening. However, starch content and turgor may also result in texture loss. Flavor is a combination of taste and aroma. Assess consumer preference for taste is difficult, due to the effect of different characteristic such as sugar, organic acids and phenolic compounds. Descriptive sensory analysis represent an economic and powerful tools to aid breeders in plant selection, providing good prediction of consumer’s response, in some cases, even better of instrumental measurement.
Flavour Definition
sweetness Intensity of sweet taste. Depend from total soluble sugar (TSS) sourness Intensity of sour taste. Depend from titratable acidity (TA) bitterness Bitter taste. Mainly depending from some phenolic acids
astringency Intensity of dry sensation in the mouth. Depend from condensed flavan-3-ols
odour Intensity of aroma
Texture Definition
juiciness Amount of juice released when chewing for a long time mealiness Intensity of granular dry structure
crunchiness The amount of noise produced when chewing with the back teeth crispness Sound produced when biting with the front teeth and chewing once peel toughness Intensity of skin residual in the mouth before swallowing
attributes in determining the after purchase evaluation (Harker et al., 2008). With regard to flesh colour, Janick et al. (1996) indicated that consumers prefer a clear yellow flesh colour in apples, but have shown intolerance towards red flesh and slight bleeding in apple flesh. Familiarity also seems to play a role in preference for flesh colour since in regions were ‘McIntosh’ is regarded as the standard apple, consumers prefer a white compared to the more yellow flesh colour of some other cultivars.
1.10 CONSUMERS’ PREFERENCES FOR IRP RED-FLESH APPLE LINES
Successful marketing for fresh apples requires accurate knowledge of consumers’ preferences and perceptions, particularly in the last years, characterized by substantial decrease of apples per capita consumption, especially in European country (FAO, 2011). The loss of market share by apple fruit could be mainly imputed to the relative static varietal landscape, dominated by traditional varieties and by often-inadequate marketing strategy of new positioned cultivars (O’Rourke et al., 2011). In addition, the mounting demand of consumers for high-quality fruit has generated an increasing competition between apple industries and a growing awareness of brand differentiation (Axelson & Axelson, 2000). Therefore, understanding consumers’ preference for apple cultivars is a strategic necessity for apple breeders and suppliers (Reid & Buisson, 2001; Jaeger et al., 2003; O’Rourke, 2011) and consumer research should be carried out since early stages of the breeding process (Hampson et al., 2000). Fruit quality should not be considered as an absolute variable, but rather a concept that changes dynamically across time along with consumers’ expectations (Harker et al., 2003). Indeed, quality is a combination of all attributes that makes a product acceptable to consumers. In fruit market, consumers’ preferences is generally driven by appearance and/or taste (Pre-Aymard et al., 2005). Appearance includes the external fruit colour, shape and cosmetic appeal, as well as flesh colour, whereas taste includes flavour, textural and mouth-feel attributes (Harker et al., 2008). In addition to appearance and/or taste, there is a growing interest from consumers even for nutritional and healthy values of fruits, including apples. Recent apple breeding programs have focused on the development of red-fleshed cultivars, with the presumption that red-fleshed apples will created a new market segment due to the novel appearance of the fruit, often, but not ever, associated to its high antioxidant capacity and thus, higher healthy value (Freshplaza, 2008). In this way, Italian Red Passion apple lines represent a new brand composed by different apple varieties, characterized by different peel colors, pink to red color of flesh, higher polyphenols content and, above all, higher antioxidant potential compared to commercial apples, such as the typical Italian cultivar Annurca.
1. AIMS OF THE STUDY
Aims of this study is the analyses of Italian consumer’s preferences for the internal appearance and taste of Italian Red Passion apple line. The main objective of the survey was to gain knowledge about consumer’s acceptance, the level of interest and the purchasing decision of new red-flesh apple
products. Indeed, the survey was focused on the so-called pre-purchase factors (McCracken et al. 1994), such as appearance and price, which represent the main factors influenced consumer’s decision to purchase in apple market. However, considering the relevance of nutritional property of IRP lines, an informative background was also added, further remarking this not negligible aspect. In addition to market analysis, a panel test descriptive sensorial analysis was also conducted, to assess the sensory qualities of fruits and to acquire detailed information about the main traits that influence consumer perception and general preference for the distribution pattern and intensity of red pigmentation in the flesh.
1. MATERIALS AND METHODS PLANT MATERIAL
The investigations were performed on apple seedlings of Italian Red Passion line, obtained from a free-pollinated cross of unknown mother plant belonging to Center Italian germplasm. The C2, C8 and C15 seedlings (C group) were grafted on M26 rootstock and planted in rows at 2.0-m and X 4.0-m spacing in the experimental orchard of University of Tuscia (Viterbo, Italy). The M3, M4 and M5 seedlings (M group) were grafted on MM111 and planted in rows 3.0-m X 4.5-m spacing, in the same location of C series seedlings. Soil and fertilizer management were conducted according to commercial guidelines. All trees were sprayed with pesticides according to a minimum programme of pest control against C. pomonella and apple scab.
DETERMINATION OF TOTAL SOLUBLE SOLID, PH AND TITRATABLE ACIDITY
For qualitative analysis, apples of IRP lines and cv Annurca were randomly divided into 4 batches. Three fruit from each batch were sampled for determination of total soluble solids (expressed in ° Brix), pH and titratable acidity of the juice, for total of 20 measurements per line. The titratable acidity, the soluble solids and pH were determined after extraction of the juice from the fruits through homogenization and subsequent centrifugation at 10,000 rpm for 10 minutes. The soluble solids was measured with the aid of ATAGO digital refractometer PR-101; for the determination of titratable acidity, after reading of the pH of the juice with the aid of digital pH-meter, the neutralization was performed with a solution of 0.1 N sodium hydroxide (NaOH) to pH 8.1. The titratable acidity was then expressed as grams per liter of malic acid equivalent.
FRUIT FIRMNESS
were added and mixed until completely dissolution. Maturity index has been determined by visual comparison of each fruit with guideline cultivars (Red Delicious and McIntosh), following a visual scale ranging from 1 to 9.
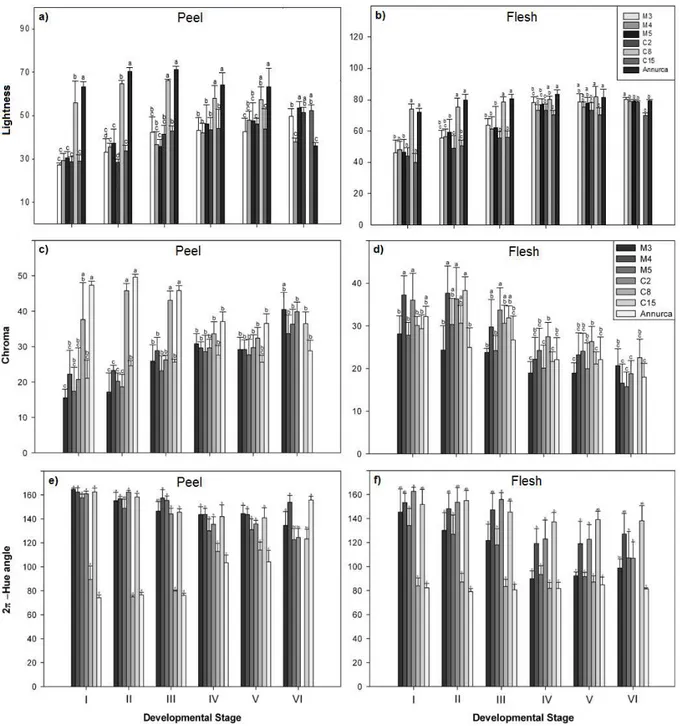
COLORIMETRIC ANALYSIS OF APPLE FRUIT
A total of 10 fruits for each lines and for each sampling data were harvested for colorimetric analysis. Color was recorded using a Minolta CR-400 Colorimeter (Minolta Camera Co., Ltd., Ramsey, NJ) tristimulus color analyzer equipped with an 8-mm diameter measuring area and diffuse illumination of a 2° standard observer. The L* coordinate indicates darkness or lightness of color and ranges from black (0) to white (100). Coordinates, a* and b*, indicate color directions: +a* is the red direction, –a* is the green direction, +b* is the yellow direction, and –b* is the blue direction. Chroma is the saturation or vividness of color. As chromaticity increases, a color becomes more intense; as it decreases, a color becomes duller. Hue angle is the basic unit of color and can be interpreted, for example, as 0° = red and 90° = yellow. Both chroma and hue are derived from a* and b* using the following equations: metric chroma: C* = √ (a*)2 + (b*)2 and metric hue angle: h = tan−1 (b*/a*)
(degrees).
TOTAL PHENOLIC CONTENT
Total phenolic content was determined spectrophotometrically according to the Folin–Ciocalteu’s method (Singleton et al., 1999), opportunely modified. Briefly, 1 mL of Folin–Ciocalteu’s, previously diluted with 10ml of distilled water, was added to 100µl of apple extracts, diluted in methanol: water 70:30. Then, 900 µl of 7.5% Na2CO3 solution and stored on dark. During the oxidation of phenolic compounds, phosphomolybdic and
phosphotungstic acid, contained in the Folin–Ciocalteu’s reagent, was reduced to blue-colored molybdenum and tungsten oxides. After 1.30 hours, the absorbance of blue coloration was measured at λ = 765 nm against a blank sample. The measurements were compared to a standard curve of prepared gallic acid solutions (in the range 25 to 500 mg L–1) and expressed as milligrams of gallic acid equivalents (GAE) per 100 g ± SD. All measurements
were performed in triplicate.
TOTAL ANTHOCYANINS CONTENT
The content of total anthocyanins was determined using the method developed by Mancinelli et al. (1975); 5 grams of finely ground plant tissue were extracted in 50 ml of methanol acidified with 0.1% HCl and placed in agitation, in the dark, for 24 hours at 4° C. The extract was then centrifuged to collect supernatant, subsequently filtered for spectrophotometric analysis. Sample absorbance was determined at 530nm, compared to a standard curve of prepared cyanidin-3-glucoside (Extrasynthese, France) solution and expressed as cyanidin-3-glucoside equivalent per 100g FW.
EXTRACTION AND HPLC ANALYSES OF APPLE FRUIT
Finely ground apple fruit tissues were immediately freeze-dried in an ‘EDWARDS modulyo’ freeze-dryer, weighted and extracted in 5 ml of slightly acidified 70% methanol (pH 4.00) for each gram of freeze-dried apple powder. The solution was sonicated for 10 min, vortexed and centrifuged at 15.000 rpm for 15 min. The pellet was separated from the supernatant, re-extracted in 5 ml per gram of slightly acidified 70% methanol (pH 4.00), vortexed and centrifuged again under the same centrifugation condition. The resulting supernatant was added to
the supernatant previous obtained, filtered by 0.45 µ m Whatman filters (GE Healthcare, US) evaporated by Rota-vapor (Buchi, Canada) at 35°C under low pressure condition, and the remaining aqueous part of the solution was freeze-dried again. Freeze-dried polyphenols were suspended in 3 ml of pure methanol for each gram of initial freeze-dried apple powder. The content of main apple phenolics compound were identified and quantified using high-performance liquid chromatography with photodiode array detection. The instrument was composed by a HPLCP680 pump (DIONEX), two thermo stated (30° C) columns, TCC-100 inverse column (DIONEX) and Acclaim® 120 C18 column (5µ m 120Å, 4.6X 250 mm) (DIONEX), and a photodiode detector
PDA-100 (DIONEX). Optimized conditions were determined by flow injection analysis (FIA) of standard solutions of the analyses at three different concentrations, ranging from 0 to 100 mg/L. System control and data processing were carried out by chromeleon software (DIONEX) running on a desk computer. Separations were performed by multistep gradient, using A) a solution of 50 mM of dihydro-ammonium phosphate acidified at pH 2.6 by ortophosphoric acid. B) 20% of phase A and 80% of acetonitrile. C) a solution 0.2 M of ortophosphoric acid basified at pH 1.5 by NaOH at a flow rate of 0.5 mL/min. Samples were introduced into the column using a single injection with a 20 µL sample loop. Catechin, epicatechin, procyanidin B1 and B2, quercetin-3-glucoside, cyanidin-3-glucoside, phlorizin and chlorogenic acid, were purchased at Extrasynthese (France).
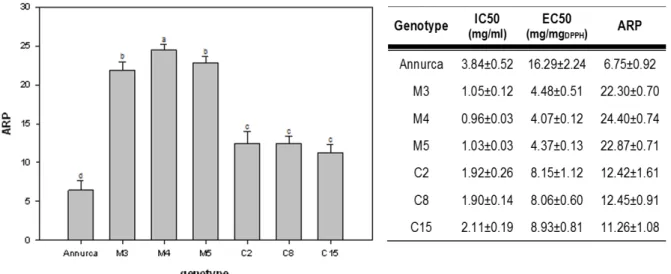
RADICAL SCAVENGING ACTIVITY
The radical scavenging ability or hydrogen donating of the extracts was monitored using the stable free radical DPPH, following the method described by Brand-Williams et al. (1995), lightly modified as follows. Different dilutions of crude extract (in 0.4 ml of methanol) were mixed in a 1 cm disposable cuvette with 3 ml of freshly prepared methanolic solution of DPPH (0.06 mM). A control was prepared with 0.4 ml of pure methanol; its initial absorbance was between 0.716 and 0.720. The cuvette was capped and left to stand in the dark at room temperature for 180 min (time required to reach the steady state). At this time, the decrease in absorbance was measured at 515 nm against a blank of pure methanol, with a Perkin–Elmer Lambda 3 UV/vis spectrophotometer (Perkin–Elmer Inc., Wiesbaden, Germany). For each extract at least five different concentrations were tested. The radical scavenging activity was expressed in terms of IC50 (inhibitory concentration %) which is the amount of extract or pure antioxidant necessary to decrease the initial DPPH concentration by 50%; EC50 (efficient concentration) and antiradical power (ARP).
NUCLEIC ACIDS EXTRACTION
Nucleic acids extraction was performed using methods described by Muleo et al. (2009). Vegetal tissues were frozen in liquid nitrogen and ground with mortar and pestle to obtain a fine powder. Then, 1 ml of extraction
Nucleic acids were visualized by ethidium bromide staining and photography of gels under UV light (240nm). Size and quantity of nucleic acid bands were estimated by comparison to Lamda Hind (Invitrogen) and 100bp (GeneAid) molecular markers. A more accurate quantification of nucleic acids was performed using a QUBIT spectrophotometer (Invitrogen, USA) using manufacturer’s protocol.
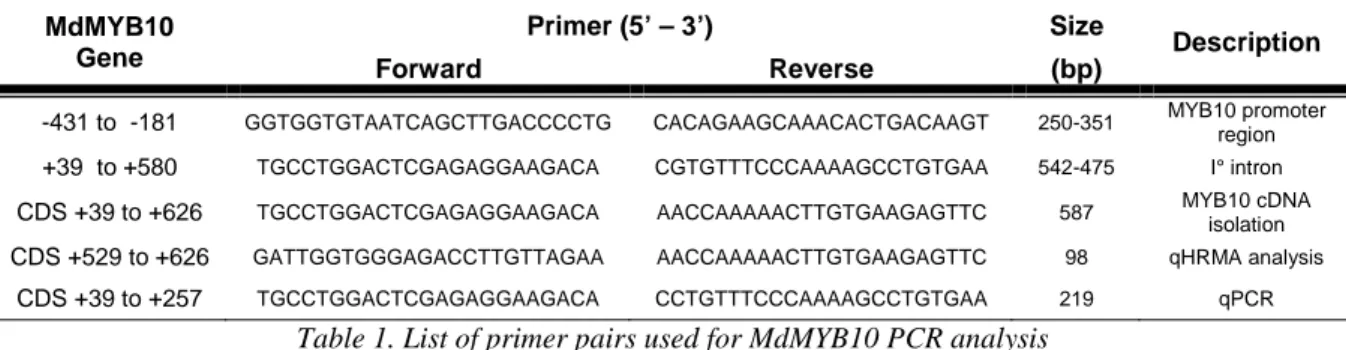
PRIMER DESIGN
For MYB10 molecular analysis oligonucleotide primers designed by Espley et al. (2007) and Takos et al. (2006) were used (Table 1), except for forward primer used in quantitative High resolution Melting Analysis (qHRMA), designed using Primer3 software, available at www.primer3.org website.
MdMYB10 Gene
Primer (5’ – 3’) Size
Description
Forward Reverse (bp)
-431 to -181 GGTGGTGTAATCAGCTTGACCCCTG CACAGAAGCAAACACTGACAAGT 250-351 MYB10 promoter region +39 to +580 TGCCTGGACTCGAGAGGAAGACA CGTGTTTCCCAAAAGCCTGTGAA 542-475 I° intron CDS +39 to +626 TGCCTGGACTCGAGAGGAAGACA AACCAAAAACTTGTGAAGAGTTC 587 MYB10 cDNA
isolation CDS +529 to +626 GATTGGTGGGAGACCTTGTTAGAA AACCAAAAACTTGTGAAGAGTTC 98 qHRMA analysis
CDS +39 to +257 TGCCTGGACTCGAGAGGAAGACA CCTGTTTCCCAAAAGCCTGTGAA 219 qPCR
Table 1. List of primer pairs used for MdMYB10 PCR analysis
Primer pairs for Real-Time PCR analysis of transcripts coding structural enzyme and transcription factors regulating flavonoid biosynthesis were, taken from previously published work (Table 2, references) or designed ex novo (Table 2) searching inside apple genome assembly (Velasco et. al., 2010) at
www.rosaceae.org, website. Annealing temperature was comprised in the range 57-60° C for all primer pairs.
Gene qPCR Primer (5’ – 3’) Size Efficency Reference
Forward Reverse (bp)
MdCHS TATCCCAGCATTGAGTTAGAGGA ACACATGCTAGATGGTACCAC 121 1.97 Espley et al. (2007)
MdF3H TGGAAGCTTGTGAGGACTGGGGT CTCCTCCGATGGCAAATCAAAGA 115 1.92 Espley et al. (2007)
MdDFR GATAGGGTTTGAGTTCAAGTA TCTCCTCAGCAGCCTCAGTTTTCT 116 1.97 Espley et al. (2007)
MdLDOX CCAAGTGAAGCGGGTTGTGCT CAAAGCAGGCGGACAGGAGTAGC 157 2.01 Espley et al. (2007)
MdUFGT CTAGACAAGCAAGAGGCTCCAT CAATGCTTTTGTCAAGAACTCA 221 1.89
MdPAL CACATACTTCAAATGCGGTGGAG CGATGAAAGGTGGGATTGTAAGG 140 1.97
MdC4H CGCAGAGCTTCGATTACAACTAC GAATCCTCTTCTCCTTCACTTCC 102 2.00
MdC3H ATGGCTCTCTCTGGACTACTTCTC CTGTATCTGGTAGAGGTTACCGAC 144 1.99
MdFLS TTCTTACAGGGAAGCTAATGAA GAGGACATGGTGGGTAGTAGTT 123 1.91
MdLAR1 TAGAGCTACTGCAAGAGGAGG CCTCGAAGAAACCCTAGAAAC 121 1.95
MdHQT CACATACTTCAAATGCGGTGGAG CGATGAAAGGTGGGATTGTAAGG 140 1.96
Md4CL CCCAAGGGAGTCATTCTAACACAC CACAATACGACATCGTCCTCCTTC 107 1.98
MdPGT1 GAAGGGTGTGTTGCCAGAAGGGT GTCACGAACCCACCAACCGACT 135 1.98
MdMYB9 CCTGGACTGCCTTGGAAGATAAA GTTGCCTCTCTTTATGTCTGGTCTC 161 1.92
MdMYB12 GATAAGCCAAGGCATAGATCCCAG GATGGACAAGACGATCAGAAGGAG 182 1.90
MdMYB16 CTCATCATCAAACTCCATAGCCTCC CAGATTCCTGAGGTGTCTCGTTG 181 1.89
MdMYB22 CCTACTCTACCACCAAACCCAAAG CTCCATTAGTAGCACGTAACCGTC 191 1.93
MdbHLH33 ATGTTTTTGCGACGGAGAGAGCA TAGGCGAGTGAACACCATACATTAAAG 143 1.96 Telias et al. (2009)
MdWDR CATCGACACCACCTGCACAATTTG CACTGGCATCGTCGGCGATCGG 162 1.90 An et al. (2012)
MdACT TGACCGAATGAGCAAGGAAATTACT TACTCAGCTTTGGCAATCCACATC 155 1.98
Table 2. List of primer pairs used for real time PCR analysis
PCR ANALYSIS AND SEQUENCING OF MYB10 LOCUS IN IRP APPLE LINES
PCR amplification were performed on a thermal cycler PTC -100 ( MJ Research ) with the following protocol: 8 minutes of initial denaturation at 95 ° C and 34 cycles each consisting of 40 sec of denaturation at 95 ° C , 30 sec of annealing at 60 ° C and 45 sec of amplification at 72 ° C. The reaction mixture was as follows: 2.5 µl 10x Buffer; 2.5 µl 10 mM dNTPs; 2.5 µl 10 mM forward and reverse primer; 0.2 µl Taq Polymerase; 0.2ul of 25mM MgCl2; 40 ng of template and DEPC water up to a total volume of 25 µl. PCR products were loaded on 1.2%
agarose gel. Bands of interested PCR products were excised from the gel and purified with the GeneMatrix Agarose-Out DNA Purification Kit (EURX) following manufacturers’ instructions. Once purified and quantified, DNA samples were sequenced by PRIMM (Milano) service.
cDNA SYNTHESIS
RNA samples concentration was quantified using QUBIT (Invitrogen, USA) and 1 µg for each sample was used for cDNA synthesis. Reactions were performed using a Superscript III cDNA synthesis kit (Invitrogen, USA), according to the manufacturer’s instructions. To maximize the RNA conversion both random hexamers and oligo (dNTs) were used in each reaction. To offset the variability of the efficiency of individual reactions, three replicate reactions for each RNA sample were synthesized and pooled before qPCR analysis.
REAL-TIME PCR ANALYSIS
Real-time PCR analysis was conducted using the thermal cycler LC480II® (Roche, Italy). Each reaction (20 µ L)
contained 10 µL of Light Cycler 480 SYBR Green I Master (Roche, Cat. No. 04 707 516 001, Italy), 0.5 µM of each primer (Tab. 1), 1 µL of cDNA and 7 µL of water PCR-grade. The PCR reaction was conducted using the following conditions: 95° C for 10 min; 45 cycles at 94° C for 20 sec, 58° C for 30 sec and 72° C for 30 sec, followed by a melting cycle from 65° to 95° C. Quantitative Real-time PCR was performed using three biological replicates, with three technical replicates for each sample. Data were expressed with the 2∆∆Cp method using ACTIN as an endogenous reference gene for the normalisation of expression analysis. After PCR amplification, all products were sequenced to confirm their identity. The amplification efficiency (E target) of each
EXTRACTION AND QUANTIFICATION OF CANDIDATE APPLE miRNA BY REAL-TIME PCR ANALYSES
Total RNA was extracted using TRIzol (Invitrogen), purified without smallRNAs enrichment using miRNeasy kit (Qiagen, Germany), and quantified using QUBIT fluorometer, according to respective manufacturers’ instructions. Generation of cDNA for RT-qPCR was done using the Qiagen miRNA first-strand synthesis and qPCR kit (miScript II; Qiagen) according to the manufacturer’s instructions. In particular, 2 µg of total RNA were reverse transcribed using HiFlex buffer and modified oligo-dT primers which have a 3' degenerate anchor and a universal tag sequence on the 5' end, allowing amplification of both mature miRNA and precursor in the real-time PCR step. The combination of polyadenylation and the universal tag addition ensures that miScript Primer Assays do not detect genomic DNA. Specific primers for mdo-miR168 and mdo-miR858 were designed based on sequences of their most abundant isoform in fruit tissue, according to Xia et al., (2012). Primer sequences was the follow: mdo-miR168 TCGCTTGGTGCAGGTCGGGAA-3’ and mdo-miR858 5’-TTCGTTGTCTGTTCGACCTGA-3’. Real-time PCR detection was performed using the same procedure above descripted for quantitative real-time PCR, however, using the follow PCR conditions: 95° C for 10 min and 40 cycles of 94° C for 15 s, 57° C for 20 s, and 70° C for 20 s. PCR products were subsequently analyzed by a melting curve analysis. Relative miRNA expression, determined by real time RT-PCR, was normalized to the expression of the reference mdo-miR168 using the ∆∆Ct method above described in Real Time PCR analysis paragraph.
5’ RLM-RACE FOR mdo-miR858 TARGET IDENTIFICATION
Following manufacturers’ instruction, FirstChoice® RLM-RACE Kit (Ambion, Austin) was used for RNA ligase mediated—5′ rapid identification of cDNA ends of putative MdMYB10 and MdMYB16 (MDP0000950559) miR858 target. The gene MdMYB9 (MDP0000210851), already confirmed
mdo-miR858 target by degradome sequencing (Xia et al., 2012) was used as further control. Briefly, RNA adapter was ligated to the free 5′ phosphate of an uncapped mRNAs population produced from nucleolytic activities. The ligation product was reverse transcribed using a forward primer directed against the linker and gene specific reverse primers, which is subsequently amplified and identified by sequencing. Reverse specific PCR primers were the follows: MdMYB10, 5’-AACCAAAAACTTGTGAAGAGT-3’ expected PCR products about 334bp;
MdMYB16, AAGGTCAAGATTCAAGTCAGGGCA-3’, products about 248 bp; MdMYB9,
5’-AGAGGTTGAGCAGCGGCAGTTGATG-3’, product about 192 bp.
HIGH RESOLUTION MELTING BASED DAE (DIFFERENTIAL ALLELIC EXPRESSION) OF MYB10 GENE
According to Nguyen-Dumont et al. (2011), primers pair was designed to amplify a C/T SNP located in the position +555 from ATG site of MdMYB10 gene. The differences in melting temperature (Tm) of two different
allele in heterozygous individuals, measured by derivative fluorescent signal, correlated to the relative abundance of each transcript. Therefore, for DAE-HRM analysis, a range of melting curves associated with known allelic imbalance were created, using respective homozygous alleles amplified from genomic DNA. PCR amplification were performed in capillaries on Light Cycler (Roche, Germany) using SensiMix kit (Quantace, USA) and LC-Green II plus dye (Idaho Technology, USA), in a 20 µl total volume containing: 4 µl Mix Buffer, 100 nM of each primer, 1 µl of LC-Green dye, 1.5 µl of Taq polymerase and 20 ng of template. The
amplification profile was set to 10 min at 95° C, 50 cycles of 10s at 95° C, 10s at the primer annealing temperature and 10s at 72° C. High resolution melting analyses were performed separately on HR1 instrument (Idaho Technology, USA) setting with temperature ramp from 70° to 90° C, rising by 0.10° C/s. All reactions were performed in triplicate. The melting curves were normalized using the software provided with HR1 instrument and visualized using Derivative Plot tool.
APPLE SENSORIAL ANALYSIS
Eleven judges were trained in descriptive sensory analysis according to the procedure described by Lawless and Heymann (1998) and tested for consistency. Apple used for panel test were preserved for one week at 4° C. Anonymous apple samples were removed peel and placed in special food trays. Eight judges were trained for descriptive sensory analysis. The judge were blindfolded and water were used as pallet cleaners between the tastings. Following criteria of Quantitative Descriptive Analysis (QDA), sensorial analysis was performed using eight descriptors, four regarding flavour attributes (sweetness, sourness, astringency and aroma) and four regarding texture attributes (mealiness, crunchiness, crispness and juiciness). An unstructured 1-10 scale was used for analysis with the left side of the scale representing low values and the right side of the scale representing higher values of the respective attributes. Samples were presented in a complete randomized order and marked with a three digit codes. Each judge tested one samples per session with size of 1/8 apple. Tasting was conducted in a controlled room temperature of 21 ºC. All data were subjected to test-retest analysis of variance (ANOVA) using SigmaPlot software v10.0.
CONSUMERS’ PREFERENCES AND MARKET ANALYSIS
The survey was conducted at mall located in Viterbo (Italy) on January 2013. The consumers were recruited adopting the quota sampling method, stratifying respondents in different age classes, each composed by a pre-established number of individuals with equal representation of males and females. Participation in the study was voluntary. Data collection was completed within one week and in different daytime slots, in order to guarantee homogeneity of data gathering conditions and to obtain the best representative sample. The questionnaire consisted of thirteen questions divided into three main areas of analysis: (i) customer profile, containing the customer socio-demographic characteristics necessary to identify individual attributes, such as sex, age and profession; (ii) customer behavior for the consumption of apples in general; (iii) consumer consumption habits and level of interest for IRP red-flesh apple lines, based on fruit appearance and explained healthy value. Consumer response modalities were structured on the basis of a Likert scale, with assigned score between 1 and 6, representing, respectively, the highest positive response (very much) and the least (not at all). Likert scale
photographs of one representative red-flesh IRP apple, and simple slogan about its higher antioxidant potential and healthy value. The symbol of ‘OGM-free products’ was also included in the poster. In addition, entire and sectioned fruits representative of red-flesh apples lines, were shown during questionnaire administration.
Figure 7. Poster shown during the survey, containing different photographs of one representative red-flesh IRP apple, simple slogan about its healthy value and the symbol of OGM-free products.
1 RESULTS
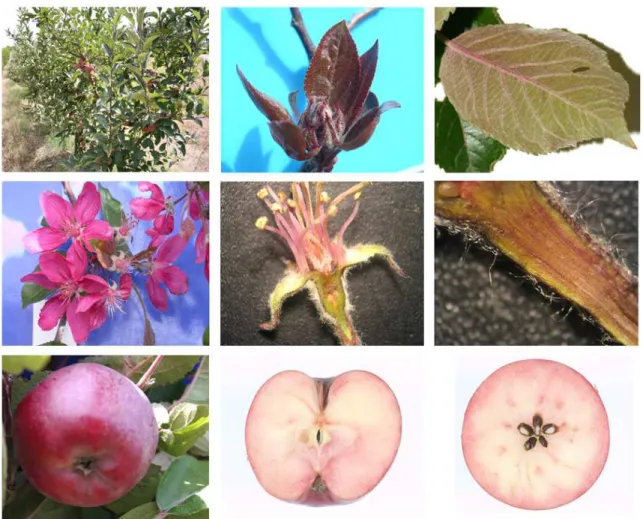
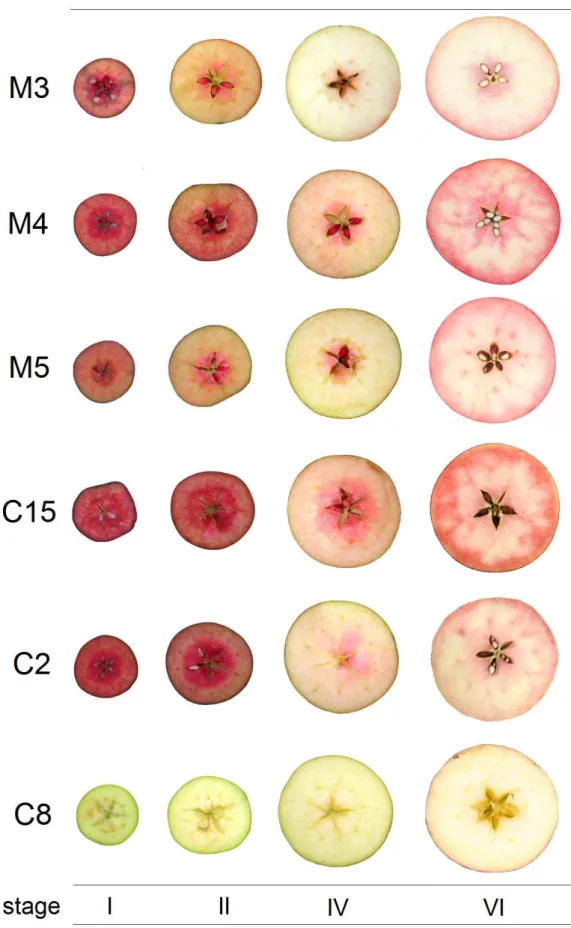
1.1 PHENOTYPICAL OBSERVATION OF ITALIAN RED PASSION SEEDLINGS
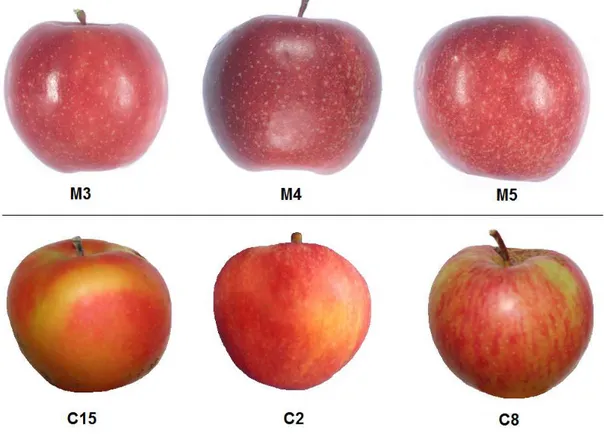
The six apple lines of Italian Red Passion (IRP) group, named M3, M4, M5, C2, C8 and C15 were generated by free-pollination of an unknown red apple mother plant, native from Center Italy. The phenotypic observations of wide red colour distribution in tissues and organs of IRP lines suggest that they belong to type I group of red apple, except C8 line, which did not display a ‘reddish phenotype’ (Figure 1). The type I group, described by Volz et al. (2009), is characterized by red coloration of apple fruit flesh and peel, young leaf, petiole and venatures of mature leaf, petals, styles, stamens and vascular tissues. All these phenotypic characters are present in IRP lines (Figure 1).
visualized onto agarose gel have confirmed the presence of two fragments of 250 and 351 bp in M3, M4, M5, C2 and C15 lines (Figure 2, a). The 250-bp fragment derived from the amplification allelic wild type (wt) form of MdMYB10 resulted to be also present in white-flesh apple of cv Annurca and C8 line; while the 351-bp amplified fragment of the mutated (m) MdMYB10 allele is characterized by the 100bp insertion, which confer MdMYB10 trans-activation (Espley et al., 2007). Coherently with the phenotypic detection, in C8 line only one amplified product is visualized onto agarose gel, since the MdMYB10m allele is absent.
Figure 2. a) Visualization of PCR product amplified from MdMYB10 promoter region in IRP lines and cv Annurca, through gel electrophoresis running. b) Visualization of PCR product amplified from MdMYB region comprised between first and second exon in MdMYB10 promoter region in IRP lines and cv Annurca, through gel electrophoresis running. c) MYB10 first and second exon region in cv Annurca and cv Dolce.
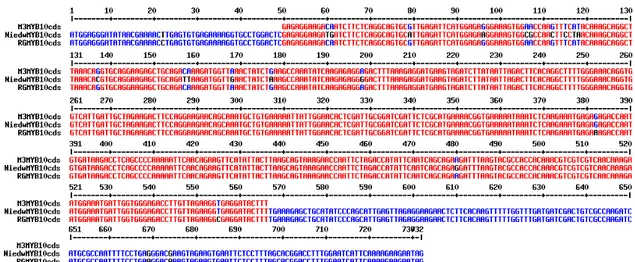
To confirm that the increased size of 350-bp amplified fragment of the MdMYB10m allele is due to the insertion, we have sequenced the amplicon amplified from M3 line (Figure 3). The analysis of sequence confirms that the insertion depend on 4-times repeated 23-bp minisatellites, and one 23-bp repeat is broken into two parts and reinserted in the opposite orientation (Figure 4, STATE-OF-THE-ART). Moreover, MdMYB10 first intron structure was also sequenced. Primers were designed to amplify the region comprised between the first exon (+39 from ATG site) and the end of second exon (+580 from ATG site). The visualization onto agarose gel of amplified products (Figure 2, b) has highlighted the presence of two type of fragments, one of 541-bp and the other of 475-bp. Both fragments resulted to be only present in C2, C15 and M5 lines, while M3, M4, C8 and cv Annurca, which carry only on the 541-bp fragment. The 475-bp fragment has been also found in cv Dolce (Figure 2, c).
Figure 3. Sequence alignment of M3 line, Royal Gala (accession number EU518249.2) and cv Niedwetskiana (accession number GQ500894.1) MdMYB10 promoter region (-431 to -181 from ATG site).
Sequence analysis of the region comprised between -481 to +580 from ATG site in IRP lines and cv Annurca revealed, the presence of at least three different wild type MdMYB10 alleles, named 1, 2 and 3, in addition to the MdMYB10m allele (Figure 4).
MdMYB10-1 and MdMYB10-2 both alleles have an analogous sequence. However, two silent SNPs mutations C/A (transversion) are present in first exon (position +49 and +64 from ATG site), two SNPs in the first intron (C/T – transition, in position +207 and A/G – transition, in position +275) and two SNPs in promoter region (C/T -transition- and G/C -transversion-, respectively in position -272 and -214). On the contrary, MdMYB10-3 allele is characterized by a 67-bp deletion in the first intron, by deletion of two repeats in promoter TG minisatellites, and other SNPs mutations in promoter region and first intron. This allele is also present in the Center Italian autochthonous cultivar Dolce and similar to MdMYB1-3 type allele described by Takos et al. (2006). Instead, MdMYB10-1 and MMdYB10-2 are more similar to MdMYB1-1 and MdMYB1-2 types, described by the same author. The analysis of sequence of a large portion of MdMYB10m coding region of M3 lines has revealed a conspicuous number of SNPs respect to cv Niedwetskiana MdMYB10 of (Figure 5) and a broad homology (only two SNPs are present) to Royal Gala MdMYB10 wt allele.
Figure 5. Sequence alignment of M3 line, Royal Gala (accession number EU518249.2) and cv Niedwetskiana (accession number GQ500894.1) MdMYB10 coding region (+50 to -565 from ATG site).
To resume, allelic composition at MdMYB10 locus in IRP lines and cv Annurca is the following: C8 line, is characterized by wtMYB10-1 and wtMYB10-2 alleles identical to cv Annurca allelic form; M3 and M4 lines are characterized by MdMYB10m and MYB10-1 wt alleles; in C2, C15 and M5 lines are present MdMYB10m and MdMYB10-3 alleles.
1.12 IRP LINES APPLE GROWTH AND DEVELOPMENT
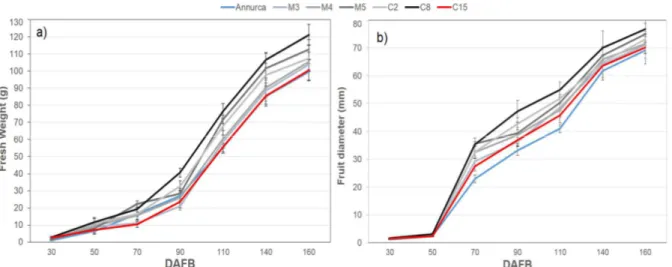
Apple fruit growth have been monitored at weekly intervals during season 2013 in IRP lines and cv Annurca, measuring fresh weight and equatorial diameter. Developmental stages have been defined by days after full bloom (DAFB). Full bloom were reached in IRP lines and cv Annurca approximately during the first decade of April, and apples were harvested in the second decade of September (about 160 DAFB). Mean apple fresh weight at harvest (Figure 6a) ranged from ~ 100g of Annurca, C15, C2
and M3 to ~ 120g of C8. Apple of M4 and M5 fresh weight ranged around 110g. The equatorial diameter of IRP apple and Annurca ranged around 70-75 mm (Figure 6b).
Figure 6. IRP apples fruit growth dynamics as function in terms of a) fresh weight (g) and b) equatorial diameter (mm). Histogram represents the average, bar represents ±SD.
To better define IRP apples maturity degree at harvest, apple firmness and starch index have been evaluated. Fruit firmness, determined by penetrometric measurements, resulted to be significant different among IRP lines and cv Annurca (Figure 7a). Apples of M3, C2 and C15 lines have shown higher firmness (9 Kg/cm2, 10 kg/cm2 and 9.4 kg/cm2, respectively) compared to Annurca (7.30 Kg/cm2), M5 and M4 lines (6.54 and 5.61 kg/cm2, respectively). The values of starch index (Figure 7b) resulted higher in apple of C2 line and Annurca, with not statistically different values of 7.8 and 8.6, respectively. In the fruit of the other lines a lower starch content has been found, however not statistically different from C2 line. Following apple harvest guideline (Peck and Merwin, 2011), starch index values indicate an advanced maturity degree for all IRP line apples and also for cv Annurca, thus indicating that apple are ready to fresh consume or short-term cold storage. Firmness values, however, highlighted important differences among IRP apples. In particular, the high firmness of C2 and C15 appear to be a genotypic characteristic that could make these lines suitable for medium-long term CA preservation.