Article
Measuring and Explaining Airport Efficiency and
Sustainability: Evidence from Italy
Fabio Carlucci1,*ID, Andrea Cirà2and Paolo Coccorese1ID
1 Department of Economics and Statistics, University of Salerno, Via Giovanni Paolo II 132,
84084 Fisciano (SA), Italy; [email protected]
2 Department of Economics, University of Messina, Piazza Pugliatti, 1, 98122 Messina, Italy; [email protected]
* Correspondence: [email protected]; Tel.: +39-089-962-836
Received: 12 January 2018; Accepted: 1 February 2018; Published: 4 February 2018
Abstract:From an environmental point of view, it is widely recognized in economic literature that an efficient management of regional airports produces positive effects both for congestion reduction in the larger airports and for better use of existing infrastructures. Regional airports generally suffer from economic vulnerabilities because of scarcity of traffic volume; besides, their small catchment areas often determine low cash flow levels. As a result, significant problems of economic sustainability arise. In this context, airport infrastructure providers have the incentive to hide failures in their strategic decisions, justifying the low share of cost recovery through market characteristics. By means of the DEA (Data Envelopment Analysis) method this paper analyses overall technical, pure technical, and scale efficiency of 34 Italian airports in the period 2006–2016 in order to investigate how a number of factors impact on the efficiency and economic sustainability of regional airports. Our findings reveal that airport size, presence of low-cost carriers and cargo traffic have a significant influence on the technical and scale efficiency of Italian airports. In other words, air transport privatization and deregulation can positively affect regional airport efficiency and sustainability. This is to say that the market mechanism is a useful tool in achieving regional airport sustainability even if the empirical analysis of the effects of privatization and deregulation is recommended for evaluating such political programs.
Keywords:air transport sustainability; airports efficiency; DEA method; Italy
1. Introduction
Aviation can be considered essential within the ongoing process of (cultural, social and economic) globalization, also from a sustainability point of view [1]. Actually, any increase in economic activity, industrial production or trade relations unavoidably causes greater need for transport [2] and an increasing level of externalities, such as air pollution [3,4].
There are many studies that have focused on airport management efficiency, but they have seldom analyzed the correlation between regional airport sustainability and airport management efficiency.
Through studying the connection between the catchment area of Italian regional airports and their management quality, in this paper we try to ascertain when regional airports are economically unsustainable due to problems related to their catchment area dimension and when this happens because of management deficiencies. In order to obtain this result, we use the DEA method that appears particularly adequate because it allows the obtaining of scores measuring overall technical, pure technical, and scale efficiency.
In the European Union air transport system currently plays a fundamental economic role, particularly after that the three “deregulation packages” have become effective. Until that period, the aviation market was characterized by the supremacy of the domestic carriers, or “flag carriers”,
and by bilateral agreements between nations. Over the years there has been a growing need of strengthening the market mechanism in the air transport sector, since up to that moment it was regarded as overregulated and with a high incidence of public monopolies. Transport deregulation and privatization, traditionally, has been thought of as something that should lower the level of pollution as a consequence of propensity to innovate of private firms [5,6] and of an improvement in fuel efficiency and load factors [7].
Moreover, the recent wave of deregulation and liberalization has determined an increase of airline competition, which translated into higher competition among airports; therefore, it appears important to assess the operational performance of airports, especially their efficiency. As a matter of fact, airport benchmarking might be useful for comparing the various structures and gauge their level of efficiency, with the additional aim of driving them toward the “best practices”.
The deregulation process in Europe has followed four steps [8–10], which have led to a unique domestic market throughout the countries. The last step has taken place in 2008 when, due to the Regulation (EC) No. 1008/2008, which reviewed the regulatory rules of 1992, European Institutions have accomplished the process of liberalization, so that EU routes are now “freely” reserved to the community air carriers. Actually, henceforward European countries are compelled to accept the entry of all “authorized” carriers into their airspace.
This situation has clearly led to phenomena such as increased competition among carriers, decreased average fares, increased frequency, and new route services [11,12]. Airlines have become more “footloose”, having a greater freedom to choose where they fly to and from, and in general to set fares, frequencies, capacities and routes according to commercial consideration [12]. This has been quite important for providing opportunities for airports to grow through attracting new routes but also challenging the existing ones (actually, around 2500 new routes were opened in 2011). Moreover, air transport produces relevant sustainability issues in both economic and environmental terms, even if our analysis is focused on the economics aspects and more specifically on the positive effects produced by the European policy of transports privatization. It is widely recognized in economic literature that an efficient management of regional airports produces positive effects on the environment both for the congestion reduction in the bigger airports and for a better use of existing infrastructures reducing soil consumption [13,14]. One of the main results of the deregulation process has been the entrance and the development of low-cost carriers (LCCs). These new players have greatly stimulated a part of demand, which was “neglected” by bigger carriers. Highly price sensitive customers are willing to receive a low profile service (‘no frills’) so, thanks to an aggressive pricing policy, LCCs have attracted millions of passengers. They have also developed a network called “point-to-point”, which indicates a connection of pairs of destinations with a high frequency gain. This strategy, by maximizing the number of passengers boarded per way, leads to reduced congestion and increased environmental performance of the whole system [15]. By doing so, LCCs have focused especially on secondary airports, due to the lower level of charges, increasing the chance for competition among airports. It is important to notice that LCCs played a key role in the aviation market because they have changed the traditional business relationship between airports and airlines. Particularly, the capability of LCCs to move high volumes of passengers has created an asymmetry between airlines and airports, with more market power in the hands of the airlines [16,17].
In Europe airport industry was traditionally characterized by public ownership and national requirements [18]. As soon as domestic air transport market was liberalized, a number of governments in Europe began to transfer the ownership or operation of larger airports to the private sector. Many smaller airports in Europe are still publicly owned, but the majority is now operated by corporatized entities. From a theoretical perspective, airport privatizations improve the efficient use of infrastructures, enhancing long-term sustainability [19].
For decades, major airports around the world have predominantly served passenger markets, thus their operations and infrastructure were designed primarily to meet the needs of people, with their remaining capacity serving air cargo. Such airports are also referred to as “gateway airports” [20].
This phenomenon can be attributed to the fact that the volume of air cargo is not sufficiently large to reach a critical mass. To a great extent, air cargo plays a complementary role for passengers, filling the excess capacity of aircraft.
However, the recent growth of global air cargo traffic has instilled great concern in policy makers and airport planners. This feature is interesting also when examining sustainability and efficiency of European airports, and the Italian ones among them. Particularly, we now aim at evaluating the impact of relevant external factors, such as the size of the airport and the presence of LCCs, on airports’ efficiency and environmental sustainability [21,22].
In the recent years, privatization and restructuring processes have affected also the Italian airport industry, with likely spillovers on their overall efficiency. Within this dynamic context, in our opinion it is worthwhile to assess whether local airport characteristics have also had a role in influencing efficiency. Actually, the latter is likely to depend not only on exogenous features on which airport management has a limited direct control (unless they act on local public policy makers and/or vectors in order to attract new demand), but also on factors that can be directly handled by local managers, particularly those pertaining the size and the business mix.
Unlike previous papers regarding Italian airports, we consider the effect of cargo traffic on airports’ efficiency and sustainability, which is expected to exhibit a higher factor productivity and a lower environmental impact because “handling cargo is capital intensive and therefore more productive than handling passengers” [23]. However, we take into account also the impact of other important external factors, particularly the size of airport and the presence of LCCs.
The producers performances are often affected by external or environmental factors which may affect the production process—being responsible for differences in the performances of the data management units (DMUs)—but, unlike the inputs and the outputs, they are not under the control of production units: we refer mainly to quality indicators, regulatory constraints, market conduct (competitive vs. monopolistic), type of ownership (private-public or domestic-foreign), environmental features. Such factors can be however included in a model as exogenous variables, thus helping to explain the efficiency differentials and even to improve policymaking.
The paper is structured as follows. After introduction, in Section2we give a concise review of literature dealing with both the measurement of airport efficiency and the assessment of its determinants. In Section3we present the first stage of our procedure and, by means of the DEA (Data Envelopment Analysis) method, estimate and examine the scores measuring overall technical, pure technical, and scale efficiency of Italian airports over the period 2006–2016. In Section4, we make use of a Tobit model and regress such efficiency scores on three explanatory variables for the same airports: airport size, the share of LCCs passenger, and the share of cargo traffic, also providing some discussion on the results.
2. A Brief Literature Review 2.1. DEA Studies in the Air Transport
Airport privatization, globalization and increased competition have generated business pressures on operating firms. This has wakened interest in performance benchmarking and pushed airports to place more emphasis on quality [24]. The airport industry is varied and heterogeneous, with a high degree of quality differentiation, heterogeneous ownership and regulatory structures, different mixes of services and operating characteristics [25], hence assessing and comparing the performance of airports is a complex task.
Nonetheless, due to the increasing strategic and economic importance of airport infrastructures, the analysis of airports efficiency has become crucial [26], because it allows airlines to select the more efficient airports, municipalities to understand their capacity to attract business and tourists, and governments to optimally allocate resources to airport improvement programs (rather than being subject to lobbies and political pressures) [27]. Therefore, in the very recent years measuring
and benchmarking of airports have captured an increasing interest among practitioners, regulators and academics.
Studies assessing the performance and sustainability of transportation infrastructures management can be classified into two groups according to the technique applied. The first refers to parametric methods, such as stochastic frontier analysis (SFA), which measure efficiency through econometric techniques [10,28–33]. The second comprises investigations applying the non-parametric methodology called DEA [13,34–37]. Some other papers compare the DEA model with the SFA model [38,39].
Focusing on DEA, it measures the relative efficiency of decision-making units on the basis of multiple inputs and outputs. The efficiency of a unit is defined as the weighted sum of its outputs divided by a weighted sum of its inputs. As Despotis (2005) [40] underlines, the weights for inputs and outputs are estimated by a linear programming so as to maximize the relative efficiency of each unit. Farrell (1957) [41] introduced the concept of “best practice frontier”, which delineates the technological limits of what a country can achieve with a given level of resources. The distance from the frontier can be used as a performance indicator [42].
DEA is a methodology directed to frontiers and proves particularly suitable for uncovering relationships that remain hidden from other methodologies [43]. The initial DEA model was proposed in a seminal paper by Charnes et al. (1978) [44], who describe the DEA methodology as a “mathematical programming model applied to observed data that provides a new way of obtaining empirical estimates of external relationships such as the production functions and/or efficiency production possibility surfaces that are the cornerstones of modern economics”. Since then, numerous applications employing the DEA methodology have been proposed, and they involve several contexts. Actually, it is designed to evaluate data management units (DMUs) that use multiple inputs to produce multiple outputs without a clear identification of the relation between them, but it has then progressed throughout a variety of formulations and applications to other kinds of industries.
We have decided to employ the DEA method just because it can be applied to scenarios where the data cannot be strictly interpreted as inputs or outputs and/or there is no direct functional relationship between the variables. Starting from the pioneer work of Gillen and Lall (1997) [45], there has been a steady growth of studies applying DEA methods in the airport industry, especially from 2008. Particularly, there has been an average of about two papers published every year during the period 1997–2007, while in the following years such number has more than doubled. Although few in number, they suggest a growing research interest in the air transport economics and management field. Among the most impactful papers, we recall those by Martín and Roman (2001, 2007) [46,47], Barros and Dieke (2007, 2008) [27,48], Barros et al. (2012, 2013) [49], Curi et al. (2010, 2011) [35,50]. Interesting literature reviews on DEA studies of airport efficiency are offered by Lam et al. (2009) [51] and Adler et al. (2013) [13].
Up to 2007, there were few papers concentrating on European airports. None of them considered the Italian context. However, from 2007 it is possible to find some studies that have focused on Italy (Gitto and Mancuso, 2012, [36]). As far as the Italian case is concerned, a number of DEA-based researches have appeared recently, but with mixed results. Malighetti et al. (2007) [52] have examined the efficiency and productivity variations of 34 Italian airports for the years 2005 and 2006. Low average efficiencies have been found with evidence of improved performance among airports larger than 5 millions passengers. Further, hub premiums and the privatization process have been considered as positive drivers of performance, while military activities and seasonality effects seem to operate as obstacles. The authors have also studied business scale inefficiency, finding that Milano Malpensa and Roma Fiumicino airports work under decreasing returns to scale, while other airports with less than 5 millions passengers operate with increasing returns to scale.
Barros and Dieke (2008) [48] have analyzed 31 Italian airports during the period 2001–2003. They use the Simar and Wilson methodology, and find high values of efficiency, which are positively affected by factors such as size and private management, and also high levels of workload units (WLU).
Their results differ from those of Malighetti et al. (2007), as they find that most airports in their sample have operated under constant returns to scale. Curi et al. (2011) [35] find low levels of efficiency among Italian airports, in line with Malighetti et al. (2007) [52]. A previous paper by Curi et al. (2010) [50] has measured the efficiency of 18 Italian airports during the period 2000–2004, separating the efficiency related to ability to manage airside activities (operational) from that related to the management of all business activities (financial). They have found that airport dimension does not allow for operational efficiency advantage, rather it allows for financial efficiency advantage of hubs and financial efficiency disadvantages of smallest airports.
2.2. Studies on the Determinants of Airport Efficiency
Previous research shows that airport characteristics (hub status, traffic structure, outsourcing policies, regulatory procedures, ownership structure) may all contribute to airport efficiency [53]. Regarding the econometric approach to the second stage (i.e., after estimating efficiency), past airport studies have employed simple ordinary least squares, Tobit regressions and truncated regressions [30]. A lively debate in the literature discusses particularly the most appropriate second-stage regression model to be applied when using DEA efficiency estimates. While Simar and Wilson (2007) [54] argue that truncated regression, combined with bootstrapping as a re-sampling technique, is able to overcome the unknown serial correlation that can affect the two-stage analysis, Banker and Natarajan (2008) [55] conclude that simple ordinary least squares (OLS), maximum likelihood estimation or Tobit regression dominate the other alternatives. Hoff (2007) [56] compares different approaches to modeling DEA efficiency scores against exogenous variables for the second-stage estimation, and concludes that the Tobit approach is the best option. Such method has been used, among others, by Latruffe et al. (2004) [57] and Bravo-Ureta et al. (2007) [58]. It is recommended especially because first-stage efficiency scores usually lie between zero and one.
For all the above reasons, in the second stage of our analysis we use the Tobit regression, a non-linear method that provides consistent estimators through maximum likelihood techniques. The Tobit model has been already used in the airport literature as a second-stage investigation following the estimated DEA efficiency scores [59].
3. First Step: Estimating Efficiency Scores through DEA Analysis 3.1. The Model
The economic theory underlying efficiency analysis is based on Debreu (1951) [60] and Farrell (1957) [41], who made the first efforts on measuring the efficiencies of a set of observed production units. Within this context, the DEA original model, introduced by Charnes et al. (1978) [44], represents an improvement on those seminal works.
The Data Envelopment Analysis is also the basic method that has been used in order to assess the performance of transportation infrastructure management. Originally, the development of DEA aimed at solving problems that were hard to deal with other approaches. This difficulty was due to the complex (frequently unknown) nature of the relations among the multiple inputs and outputs involved in the activities [43].
In DEA, the basic premise is homogeneity, that is, the DMUs must perform similar activities and produce comparable products and/or similar services, so that it can be set as a common range of products [61].
Each DMU’s score is individually optimized through mono-objective linear programming, comparing the resources used (inputs) and the quantities produced (outputs) to the levels of other units. The result is the construction of an efficient frontier. The DMUs lying on it are efficient (score of 100%) while the others are inefficient (score of less than 100%).
Besides efficiency scores, the envelope formulation of DEA models provides targets and a reference set for the inefficient DMUs. The targets are the levels that the inputs and outputs of those inefficient
units must achieve in order to be efficient. The reference set represents the efficient DMUs (benchmarks), i.e., those that will be used as references for good management practices. A linear combination of these benchmarks provides the targets for each inefficient DMU. Such targets are, in most cases, virtual, as they do not characterize a real efficient DMU.
Depending on the industry characteristics, there are different DEA models: input-oriented, output-oriented, or both. The input orientation focuses on proportional decrease of the input vector; the output orientation adjusts the proportional increase of the output vector; the output/input orientation does not discriminate the importance of possible increase of output or decrease of input.
In the air transport sector, the output-oriented model has been considered as more suitable, due to the fact that it is not possible to recover investments in infrastructure that normally are made well in advance. On the contrary, the goal of the manager is to expand the demand as much as possible and to use airport facilities as intensively as possible, since production factors are fixed or semi-fixed. In terms of returns to scale model, there are three basic DEA models: constant returns to scale (CRS), variable returns to scale (VRS), and additive. They can be used to assess which of DMUs determine the frontier of the envelopment surface. Units that do not lie on the frontier are inefficient, and the measurement of the grade of inefficiency is determined by the selection of the model.
Our paper focuses on both constant and variable returns to scale models, while it makes use of an output-oriented approach in order to analyze the financial and operating performance of Italian airports. Particularly, for the jth airport (out of n airports) the output-oriented technical efficiency under constant return to scale (CRS) is obtained by solving the following linear programming problem:
max
θCRSj ,λ
θCRSj subject to : θYj≤YλXj ≥Xλλ≥0.
where: X and Y are the input and output vectors, respectively; θCRS= 1/θjCRSis the technical efficiency of airport j under CRS; and λ is a n×1 vector of weights. The non-negative weights λ measure the contribution of the selected efficient airports to define a point of reference for the inefficient jth airport. In general, 0≤θjCRS≤1, where θjCRS= 1 if the airport is producing on the (production) frontier and hence is technically efficient. When θjCRS< 1, the airport is technically inefficient.
For the case of variable returns to scale, technical efficiency θjVRS is obtained by adding the convexity constraintΣλj= 1 into the maximization problem.
3.2. Data
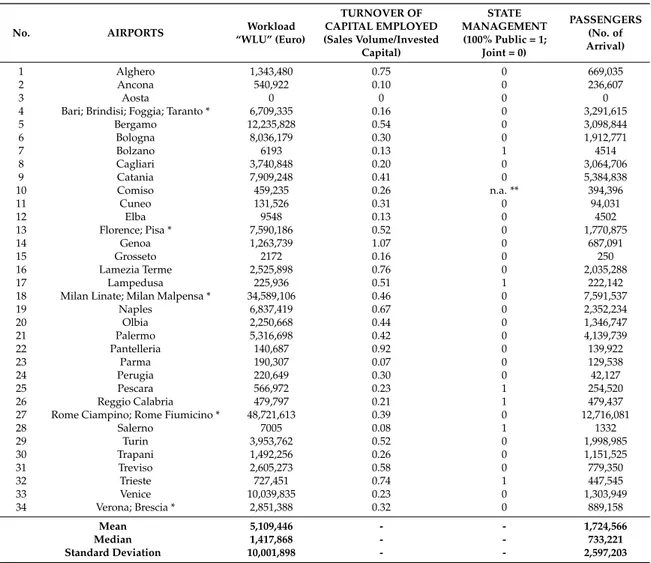
We employ data for a cross section of Italian airports that differ in ownership, financing and operational characteristics. In particular, our sample considers all 34 Italian airports certified by ENAC (the Italian Civil Aviation Authority) for the period 2006–2016. Such time interval considers the very last deregulation steps linked to the Regulation (EC) No. 1008/2008, but it especially takes into account the revitalization of air traffic occurred after 2011 (i.e., after the attack on the Twin Towers). Table1 portrays some characteristics of Italian airports for 2016.
Some interesting insights can be drawn from its data. First, for the workload units (WLU) and the total number of passengers the standard deviation is higher than the mean, which indicates that the sample is not very homogeneous. This is largely due to the presence of both small and large airports in the sample, a characteristic that reflects the local population density. Second, the lowest ratios of the rate of turnover of invested capital are found for small airports, most of which are managed by a capital company totally in public hands. The highest values belong to the airports of Genova (where the rate of change is greater than 1), Pantelleria, Alghero, Lamezia Terme and Trieste. Such airports are mostly managed by partially privatized company, which foresees that privatized or partially privatized airports achieve higher levels of efficiency. Third, none of the listed airports is completely privatized: the majority is characterized by a joint management system (public-private), whereas the remaining airports, mostly small-sized, are totally public managed.
Table 1.Summary characteristics of Italian airports (year 2016).
No. AIRPORTS Workload
“WLU” (Euro) TURNOVER OF CAPITAL EMPLOYED (Sales Volume/Invested Capital) STATE MANAGEMENT (100% Public = 1; Joint = 0) PASSENGERS (No. of Arrival) 1 Alghero 1,343,480 0.75 0 669,035 2 Ancona 540,922 0.10 0 236,607 3 Aosta 0 0 0 0
4 Bari; Brindisi; Foggia; Taranto * 6,709,335 0.16 0 3,291,615
5 Bergamo 12,235,828 0.54 0 3,098,844 6 Bologna 8,036,179 0.30 0 1,912,771 7 Bolzano 6193 0.13 1 4514 8 Cagliari 3,740,848 0.20 0 3,064,706 9 Catania 7,909,248 0.41 0 5,384,838 10 Comiso 459,235 0.26 n.a. ** 394,396 11 Cuneo 131,526 0.31 0 94,031 12 Elba 9548 0.13 0 4502 13 Florence; Pisa * 7,590,186 0.52 0 1,770,875 14 Genoa 1,263,739 1.07 0 687,091 15 Grosseto 2172 0.16 0 250 16 Lamezia Terme 2,525,898 0.76 0 2,035,288 17 Lampedusa 225,936 0.51 1 222,142
18 Milan Linate; Milan Malpensa * 34,589,106 0.46 0 7,591,537
19 Naples 6,837,419 0.67 0 2,352,234 20 Olbia 2,250,668 0.44 0 1,346,747 21 Palermo 5,316,698 0.42 0 4,139,739 22 Pantelleria 140,687 0.92 0 139,922 23 Parma 190,307 0.07 0 129,538 24 Perugia 220,649 0.30 0 42,127 25 Pescara 566,972 0.23 1 254,520 26 Reggio Calabria 479,797 0.21 1 479,437
27 Rome Ciampino; Rome Fiumicino * 48,721,613 0.39 0 12,716,081
28 Salerno 7005 0.08 1 1332 29 Turin 3,953,762 0.52 0 1,998,985 30 Trapani 1,492,256 0.26 0 1,151,525 31 Treviso 2,605,273 0.58 0 779,350 32 Trieste 727,451 0.74 1 447,545 33 Venice 10,039,835 0.23 0 1,303,949 34 Verona; Brescia * 2,851,388 0.32 0 889,158 Mean 5,109,446 - - 1,724,566 Median 1,417,868 - - 733,221 Standard Deviation 10,001,898 - - 2,597,203
* = This Airports are aggregated because they are managed by a single airport managing bodies, so that to our ends it is better pull together the data concerning the single airports. ** = Not available.
To measure airport productivity through DEA, we need to identify both the outputs that an airport produce and the inputs used in producing those outputs. In statistical analysis, the most common airport output measure used is the number of passengers served, as most airports serve mainly passenger traffic, so in our study we will follow the same line. Air cargo, however, is becoming more and more important for many airports. Therefore, we consider it as a separate additional output.
While passengers and cargo handling are usually considered as the outputs of airport landside operations (also considered as final outputs of an airport), aircraft movements are regarded as an output of airside operations generating revenues for airports in the form of landing and aircraft parking charges, although they can be also seen as an intermediate outputs (meaning that they carry passengers and cargo that generate additional revenues in airports’ landside operations). They represent therefore our third output.
Moreover, airports revenues arise also from concessions, car parking, and many other services that are not directly related to aeronautical activities in a traditional sense, but nonetheless are becoming increasingly more important for airports around the world. Thus, additional outputs in our analysis are the revenues from aeronautical, handling and commercial services. From the above, it is clear that the airport industry emerges as a paradigmatic case of joint production [62,63].
As for inputs, we consider three categories: labor (measured by the number of employees who work directly for an airport operator), capital (consisting of the various infrastructure and facilities,
and expressed by the book assets value), and all expenses not directly related to capital and personnel (which allow us to take into account the effects of airports’ operation strategies with respects to outsourcing activities on production).
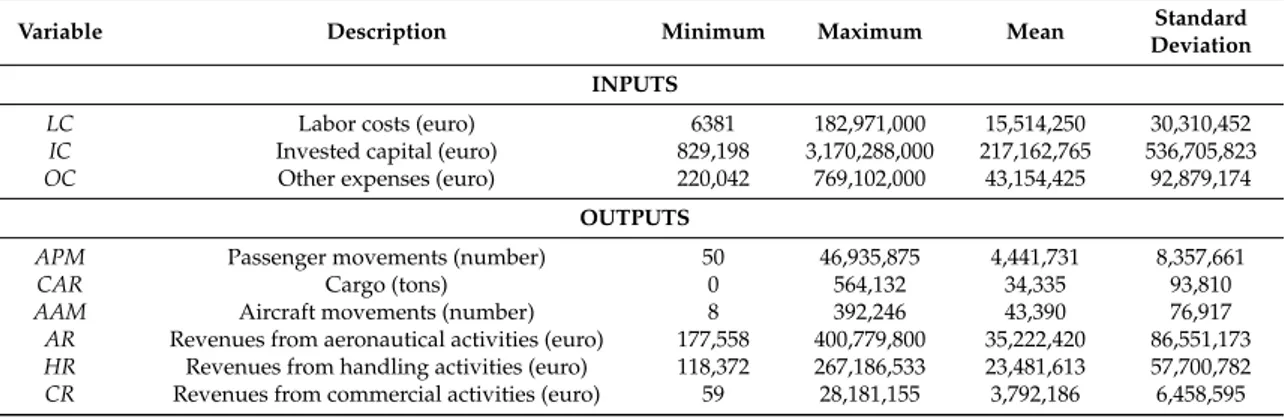
Summing up, for each airport we have information on six output variables: the number of passengers movements (APM), the ton of cargo (CAR), the yearly number of aircraft movements (AAM), revenues from aeronautical activities (AR), revenues from handling services (HR), and revenues from commercial activities (CR). Input variables are: labor costs (LC), invested capital (IC), and other expenses (OC) (Table2).
Table 2.Provides some statistics of the variables used in the analysis.
Variable Description Minimum Maximum Mean Standard
Deviation INPUTS
LC Labor costs (euro) 6381 182,971,000 15,514,250 30,310,452
IC Invested capital (euro) 829,198 3,170,288,000 217,162,765 536,705,823 OC Other expenses (euro) 220,042 769,102,000 43,154,425 92,879,174
OUTPUTS
APM Passenger movements (number) 50 46,935,875 4,441,731 8,357,661
CAR Cargo (tons) 0 564,132 34,335 93,810
AAM Aircraft movements (number) 8 392,246 43,390 76,917
AR Revenues from aeronautical activities (euro) 177,558 400,779,800 35,222,420 86,551,173 HR Revenues from handling activities (euro) 118,372 267,186,533 23,481,613 57,700,782 CR Revenues from commercial activities (euro) 59 28,181,155 3,792,186 6,458,595
Source: ENAC and AIDA data.
Our choice regarding inputs and outputs meets various DEA requirements. Actually, in the DEA methodology there exists a direct correlation between the number of variables used (inputs and outputs) and the number of observations considered “efficient.” As Seiford and Thrall (1990) [64] show, a low ratio of observations to the number of inputs and outputs weakens the discriminatory power of DEA models, and most DMUs could be rated efficient. Liebert and Niemeier (2013) [65] suggest that this should not be considered a flaw of the methodology but rather a direct result of the dimensionality of the input/output space (m inputs + s outputs), relative to the number of observations (n). In this case, too few inputs and outputs would reduce the capacity of the DEA to select the efficient airports.
With respect of the minimum set of data points in the evaluation set, in the DEA literature there are a couple of guidelines. A first rule states that the sample size should be greater than the product of the number of inputs and outputs, while a second rule declares that the number of observation in the data set should be at least three times the sum of the number of input and output variables. However, the size of our sample exceeds the desirable size as suggested by these rules, so we trust we are able to obtain sufficient discriminatory power.
As before, it comes out that the Italian airports are relatively heterogeneous, being the standard deviation higher than the average for all the considered variables.
3.3. Empirical Results
The results were obtained using the Open Source DEA software for both the CRS (constant return to scale) and VRS (variable return to scale) models and following the output-oriented approach (i.e., we assume that airports aim to maximize the profits resulting from their activity, and try to determine whether an airport is able to produce the same level of output with fewer inputs).
It should be noted that the DEA technique provides a “relative” efficiency measure, therefore its value refers only to the context under investigation. Changing the characteristics of the sample (e.g., increasing the number of units) or varying the model (type of returns to scale, orientation) generate different “efficient” units, or different efficiency values. The relative performance of an airport is defined as the ratio of the weighted sum of its outputs to the weighted sum of its inputs. The weights
are not predetermined, but rather allocated by the model, avoiding bias resulting from subjectively assigned weights.
By using the CRS model via an output-oriented approach, it is possible to obtain each unit’s technical efficiency score that represent its capacity to produce a certain amount of output, given a set of input.
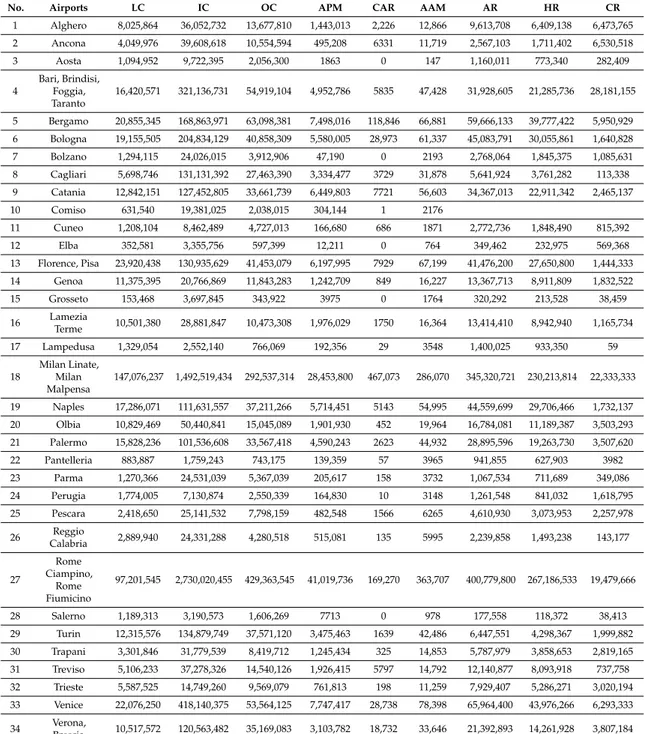
For each airport, Table3shows the values of the inputs and outputs used for the DEA analysis; they are averaged over the 2006–2016 period.
Table 3.Average of input and output airport data over the period 2006–2016 *.
No. Airports LC IC OC APM CAR AAM AR HR CR
1 Alghero 8,025,864 36,052,732 13,677,810 1,443,013 2,226 12,866 9,613,708 6,409,138 6,473,765 2 Ancona 4,049,976 39,608,618 10,554,594 495,208 6331 11,719 2,567,103 1,711,402 6,530,518 3 Aosta 1,094,952 9,722,395 2,056,300 1863 0 147 1,160,011 773,340 282,409 4 Bari, Brindisi, Foggia, Taranto 16,420,571 321,136,731 54,919,104 4,952,786 5835 47,428 31,928,605 21,285,736 28,181,155 5 Bergamo 20,855,345 168,863,971 63,098,381 7,498,016 118,846 66,881 59,666,133 39,777,422 5,950,929 6 Bologna 19,155,505 204,834,129 40,858,309 5,580,005 28,973 61,337 45,083,791 30,055,861 1,640,828 7 Bolzano 1,294,115 24,026,015 3,912,906 47,190 0 2193 2,768,064 1,845,375 1,085,631 8 Cagliari 5,698,746 131,131,392 27,463,390 3,334,477 3729 31,878 5,641,924 3,761,282 113,338 9 Catania 12,842,151 127,452,805 33,661,739 6,449,803 7721 56,603 34,367,013 22,911,342 2,465,137 10 Comiso 631,540 19,381,025 2,038,015 304,144 1 2176 11 Cuneo 1,208,104 8,462,489 4,727,013 166,680 686 1871 2,772,736 1,848,490 815,392 12 Elba 352,581 3,355,756 597,399 12,211 0 764 349,462 232,975 569,368 13 Florence, Pisa 23,920,438 130,935,629 41,453,079 6,197,995 7929 67,199 41,476,200 27,650,800 1,444,333 14 Genoa 11,375,395 20,766,869 11,843,283 1,242,709 849 16,227 13,367,713 8,911,809 1,832,522 15 Grosseto 153,468 3,697,845 343,922 3975 0 1764 320,292 213,528 38,459 16 Lamezia Terme 10,501,380 28,881,847 10,473,308 1,976,029 1750 16,364 13,414,410 8,942,940 1,165,734 17 Lampedusa 1,329,054 2,552,140 766,069 192,356 29 3548 1,400,025 933,350 59 18 Milan Linate, Milan Malpensa 147,076,237 1,492,519,434 292,537,314 28,453,800 467,073 286,070 345,320,721 230,213,814 22,333,333 19 Naples 17,286,071 111,631,557 37,211,266 5,714,451 5143 54,995 44,559,699 29,706,466 1,732,137 20 Olbia 10,829,469 50,440,841 15,045,089 1,901,930 452 19,964 16,784,081 11,189,387 3,503,293 21 Palermo 15,828,236 101,536,608 33,567,418 4,590,243 2623 44,932 28,895,596 19,263,730 3,507,620 22 Pantelleria 883,887 1,759,243 743,175 139,359 57 3965 941,855 627,903 3982 23 Parma 1,270,366 24,531,039 5,367,039 205,617 158 3732 1,067,534 711,689 349,086 24 Perugia 1,774,005 7,130,874 2,550,339 164,830 10 3148 1,261,548 841,032 1,618,795 25 Pescara 2,418,650 25,141,532 7,798,159 482,548 1566 6265 4,610,930 3,073,953 2,257,978 26 Reggio Calabria 2,889,940 24,331,288 4,280,518 515,081 135 5995 2,239,858 1,493,238 143,177 27 Rome Ciampino, Rome Fiumicino 97,201,545 2,730,020,455 429,363,545 41,019,736 169,270 363,707 400,779,800 267,186,533 19,479,666 28 Salerno 1,189,313 3,190,573 1,606,269 7713 0 978 177,558 118,372 38,413 29 Turin 12,315,576 134,879,749 37,571,120 3,475,463 1639 42,486 6,447,551 4,298,367 1,999,882 30 Trapani 3,301,846 31,779,539 8,419,712 1,245,434 325 14,853 5,787,979 3,858,653 2,819,165 31 Treviso 5,106,233 37,278,326 14,540,126 1,926,415 5797 14,792 12,140,877 8,093,918 737,758 32 Trieste 5,587,525 14,749,260 9,569,079 761,813 198 11,259 7,929,407 5,286,271 3,020,194 33 Venice 22,076,250 418,140,375 53,564,125 7,747,417 28,738 78,398 65,964,400 43,976,266 6,293,333 34 Verona, Brescia 10,517,572 120,563,482 35,169,083 3,103,782 18,732 33,646 21,392,893 14,261,928 3,807,184 Input: LC = Labor costs (euro); IC = Invested capital (euro); OC = Other expenses (euro). Output: APM = Passenger movements (number); CAR = Cargo (tons); AAM = Aircraft movements (number); AR = Revenues from aeronautical activities (euro); HR = Revenues from handling activities (euro); CR = Revenues from commercial activities (euro). * All variables are expressed in euro, except APM (number), CAR (tons) and AAR (number).
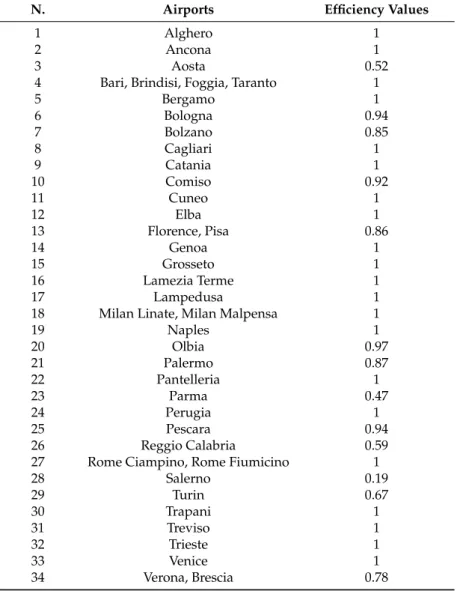
Table4reports the efficiency results obtained by the application of output-oriented CRS model to the 34 Italian airports. Values still refer to the 2006–2016 period.
Table 4.DEA estimation results for the CRS output-oriented model.
N. Airports Efficiency Values
1 Alghero 1
2 Ancona 1
3 Aosta 0.52
4 Bari, Brindisi, Foggia, Taranto 1
5 Bergamo 1 6 Bologna 0.94 7 Bolzano 0.85 8 Cagliari 1 9 Catania 1 10 Comiso 0.92 11 Cuneo 1 12 Elba 1 13 Florence, Pisa 0.86 14 Genoa 1 15 Grosseto 1 16 Lamezia Terme 1 17 Lampedusa 1
18 Milan Linate, Milan Malpensa 1
19 Naples 1 20 Olbia 0.97 21 Palermo 0.87 22 Pantelleria 1 23 Parma 0.47 24 Perugia 1 25 Pescara 0.94 26 Reggio Calabria 0.59
27 Rome Ciampino, Rome Fiumicino 1
28 Salerno 0.19 29 Turin 0.67 30 Trapani 1 31 Treviso 1 32 Trieste 1 33 Venice 1 34 Verona, Brescia 0.78
As told, an efficiency value less than 1 indicates that the unit is inefficient. In our case we find 16 inefficient airports out of 34: Aosta, Bologna, Bolzano, Comiso, Florence/Pisa, Olbia, Palermo, Parma, Pescara, Reggio Calabria, Salerno, Turin, Verona/Brescia. Efficient units (for which the estimated value of efficiency is equal to 1) are: Alghero, Ancona, Bari/Brindisi/Foggia/Taranto, Bergamo, Cagliari, Catania, Cuneo, Elba, Genoa, Grosseto, Lamezia Terme, Lampedusa, Milan Linate/Milan Malpensa, Naples, Pantelleria, Perugia, Rome Ciampino/Rome Fiumicino, Trapani, Treviso, Trieste, Venice.
Table5shows the performance indicators’ breakdown. The output-oriented CRS model allows measurement of the overall efficiency of each DMU (both technical efficiency and scale efficiency: third column, corresponding to the last column of Table4), while the pure technical efficiency is measured through a VRS output-oriented model (fourth column). Hence, the efficient DMUs (which assume value 1) are fewer than those obtained taking into account the same set with the VRS model. The latter values reveal that technical efficiency (or managerial efficiency) is not influenced by the firms’ size. As already seen, the efficiency of scale value (fifth column) is obtained through the ratio between the overall technical efficiency (CRS) and pure technical efficiency (VRS). Finally, the sixth column
shows the type of returns to scale (constant, increasing or decreasing: CRS, IRS or DRS, respectively) exhibited by each DMU.
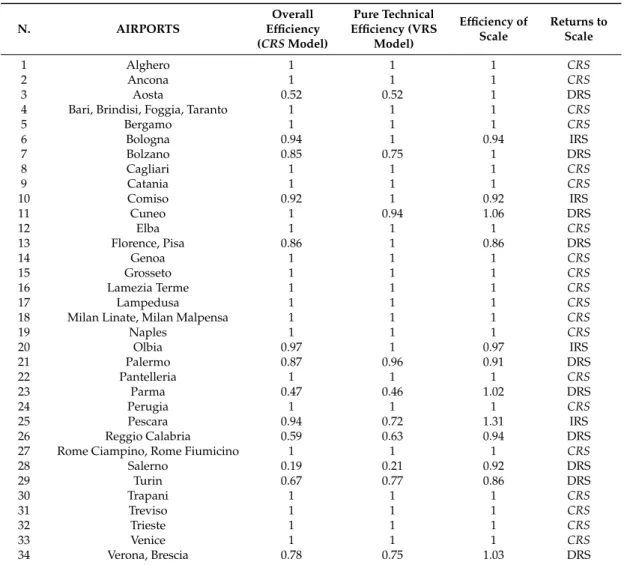
Table 5.Performance breakdown by airport.
N. AIRPORTS Overall Efficiency (CRS Model) Pure Technical Efficiency (VRS Model) Efficiency of Scale Returns to Scale 1 Alghero 1 1 1 CRS 2 Ancona 1 1 1 CRS 3 Aosta 0.52 0.52 1 DRS
4 Bari, Brindisi, Foggia, Taranto 1 1 1 CRS
5 Bergamo 1 1 1 CRS 6 Bologna 0.94 1 0.94 IRS 7 Bolzano 0.85 0.75 1 DRS 8 Cagliari 1 1 1 CRS 9 Catania 1 1 1 CRS 10 Comiso 0.92 1 0.92 IRS 11 Cuneo 1 0.94 1.06 DRS 12 Elba 1 1 1 CRS 13 Florence, Pisa 0.86 1 0.86 DRS 14 Genoa 1 1 1 CRS 15 Grosseto 1 1 1 CRS 16 Lamezia Terme 1 1 1 CRS 17 Lampedusa 1 1 1 CRS
18 Milan Linate, Milan Malpensa 1 1 1 CRS
19 Naples 1 1 1 CRS 20 Olbia 0.97 1 0.97 IRS 21 Palermo 0.87 0.96 0.91 DRS 22 Pantelleria 1 1 1 CRS 23 Parma 0.47 0.46 1.02 DRS 24 Perugia 1 1 1 CRS 25 Pescara 0.94 0.72 1.31 IRS 26 Reggio Calabria 0.59 0.63 0.94 DRS
27 Rome Ciampino, Rome Fiumicino 1 1 1 CRS
28 Salerno 0.19 0.21 0.92 DRS 29 Turin 0.67 0.77 0.86 DRS 30 Trapani 1 1 1 CRS 31 Treviso 1 1 1 CRS 32 Trieste 1 1 1 CRS 33 Venice 1 1 1 CRS 34 Verona, Brescia 0.78 0.75 1.03 DRS
The efficiency results help to discover some interesting features of the Italian airport system. All technically efficient airports under the assumption of constant returns to scale (16 over 34, see above) are technically efficient even under the assumption of variable returns to scale (VRS), which means that the dominant source of efficiency is the efficiency of scale. Looking at the VRS efficiency scores, i.e., those concerning pure technical efficiency due to management skills, 24 airports out of 34 (70.6%) are efficient over the time period here considered. Therefore, In Italy only 10 airports appear inefficient from an operational point of view, which makes us conclude that overall Italians airports are well managed with regard to the pure technical efficiency.
Considering the scale efficiency, 26 of 34 units analyzed reach the value of 1. As the efficiency score has to be considered as an average value during the period, it suggests that approximately 71% of Italian airports reveal pure technical efficiency, but some of them (4 units, 16.7%) do not exhibit efficiency of scale.
Finally, 4 airports exhibit increasing returns to scale (they are either small- and medium-sized), while 10 have decreasing returns to scale (many of them are small-sized). The units characterized by increasing returns to scale (IRS) may improve efficiency by increasing the productive dimension; conversely, units characterized by decreasing returns to scale (DRS) could gain in efficiency just by reducing the size of production. For smaller airport, this could call for a reconsideration of their
activity. The units characterized by constant returns to scale (CRS) work, instead, in optimal production conditions and the size of their pure technical efficiency is equal to one, given the concurrence of overall efficiency and scale efficiency.
4. Second Step: Assessing the Efficiency Drivers through Tobit Analysis 4.1. The Model
The Tobit model is also called censored regression model, because the latent variable cannot always be observed while the independent variable is observable. It is an alternative to OLS regression, and is employed when the dependent variable is bounded from below or above or both (as it happens when dealing with efficiency scores, normally lying between 0 and 1). Particularly, we make use of a random effect Tobit model, which assumes that the unobservable effects are uncorrelated with the observed exploratory variables (on the contrary, a fixed effect model assumes that they are correlated).
The model can be expressed in a general way as follows: Yi∗=βXi+εii=1, . . . , N with:
a) Yi= Yi* if 0≤Yi*≤1; b) Yi= 0 if Yi*≤0; c) Yi= 1 if Yi*≥1.
In the above, N is the number of observation, Yi* is an unobserved latent variable, Yi is the dependent variable (DEA scores), Xiis a vector of independent variables, β is a vector of unknown coefficients to be estimated, and εiis an independently distributed error term, assumed to be normal with zero mean and constant variance σ2.
As said, we employ the Tobit regression in order to identify the factors that are more significant in influencing airports efficiency. The importance of our analysis stays in providing information to airports managers about the major determinants requiring more attention in the course of business activities.
We again consider the 34 Italian airports, and employ the first-stage DEA efficiency scores (technical efficiency, overall efficiency, and scale efficiency) as the dependent variable, while the explanatory variables are a number of other important factors that may affect the production efficiency: the number of Work Load Units, the percentage of passengers handled by low-cost carriers, and the percentage of cargo traffic. In our model, we suppose that estimated coefficients are independent of time, so that, the greater the value of efficiency, the more efficient the airport. In case the regression coefficient comes out to be positive, we deduce that they positively affect efficiency.
Our explanatory variables (airport size, the share of LCC passengers, and the share of cargo traffic) have been selected among those that have been widely used within the international literature on the topic. Hence, we estimate the following relationship:
Yi= β0+ β1SIZEi+ β2LCCi+ β3CARGOi+ εi.
Here, Yi are the efficiency scores (overall technical, pure technical, and scale efficiency scores, respectively), while the three environmental variables (measured for each airport) are: the number of Work Load Units, or WLU (SIZE); the percentage of passengers handled by low-cost carriers (LCC); and the percentage of cargo traffic relative to total WLUs (CARGO).
4.2. Empirical Results
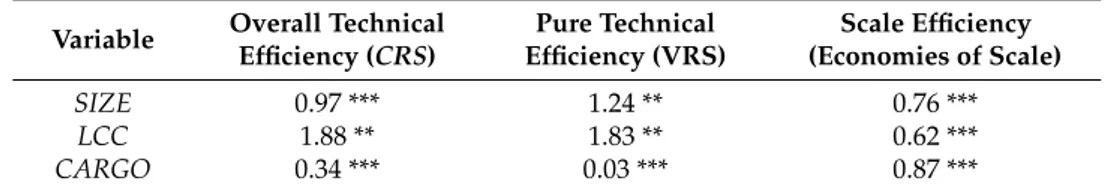
In Table6we show the empirical results of our three Tobit estimations for the sample of 34 Italian airports. Particularly, we report the marginal effect of each regressor on the dependent variables. The Likelihood Ratio test indicates that in all of them the variables included in the model have a statistically significant effect on the dependent variables. All parameters exhibit a significant sign
(at least at the 5% level), and their sign always reveals a positive influence of the corresponding explanatory variable on the dependent (efficiency) variable.
Table 6.Tobit estimation results.
Variable Overall Technical Efficiency (CRS) Pure Technical Efficiency (VRS) Scale Efficiency (Economies of Scale) SIZE 0.97 *** 1.24 ** 0.76 *** LCC 1.88 ** 1.83 ** 0.62 *** CARGO 0.34 *** 0.03 *** 0.87 ***
The reported coefficients measure marginal effects. *** Significant at the 1% level; ** Significant at the 5% level. The coefficient of SIZE (airport size) indicates that larger airports are expected to have higher overall technical efficiency, pure technical efficiency, and scale efficiency scores compared to smaller airports. This evidence is in line with previous similar research. For example, Perelman and Serebrisky (2012) [66] perform a DEA analysis for Latin American airports and conclude that larger airports have higher technical efficiency than smaller ones. The same result characterizes the analyses by Pels et al. (2003) [39], Martín et al. (2009) [67], and Coto-Millan et al. (2014) [63].
The presence of LCCs is also positively associated with all types of efficiency. Actually, the introduction of LCCs has generated a substantial growth of demand in the Italian airports, especially in small- and medium-sized ones. This is also what Cavaignac and Petiot (2017) [68] find in their survey on papers applying DEA to the transport sectors. Moreover, our results are in line with those obtained for British airports by Bottasso et al. (2013) [69], who conclude that LCCs’ entry on European markets has stimulated airports productivity improvements, which in turn has positively affected total factor productivity. Likewise, Coto-Millan et al. (2014) [63] find that the share of LCC passengers has had a positive effect on the efficiency of Spanish airports.
Finally, the cargo traffic (CARGO) positively impacts all types of efficiency as well. Hence, airports with a higher proportion of cargo traffic are again able to get higher levels of efficiency [23]. Once more, this confirms the evidence of previous works, for which airports with a large proportion of cargo traffic are expected to disclose a higher variable factor productivity, since handling cargo is capital intensive and therefore more productive than handling passengers.
5. Conclusions
The European policies on air transport liberalization have had positive effect on environment inasmuch as they have improved the natural resources use. Notwithstanding, management systems designed to achieve the maximum efficiency of regional airports do not seem to pay particular attention to the issue of the economic and environmental sustainability.
In the air transport related literature little attention has been devoted to the aspects involved in the sustainability issue of peripheral airports and this might seem surprising given the relevance of the problem.
In our opinion, a viable path for exploring the influence of exogenous factors in airports’ efficiency is to employ a two-stage procedure. Specifically, from a pure efficiency perspective, we estimate technical efficiency of Italian airports over a group of variables that may affect it.
This paper, starting from general considerations about the literature concerning DEA studies in the air transport, focuses attention on the overall technical, pure technical, and scale efficiency of Italian airports. Analyzing several factors and their impact on efficiency level, we investigate the economic and environmental performance of 34 Italian airports in the period 2006–2016. In order to provide a clear-cut answer, we use the DEA method that appears particularly adequate because it allows us to get scores measuring overall technical, pure technical, and scale efficiency. Such analysis highlights some interesting features of the Italian airport system. First, scale economies affect the efficiency outcome in a significant way, so that, in presence of increasing returns to scale, the airport managers should
aim at extending the catchment area of the airport or developing strategies that are able to attract new carriers and new business activities, such as cargo activity. Second, the majority of Italian airports are well managed with regard to the pure technical efficiency. In a second step, we have applied a Tobit regression model, with the aim of investigating whether airport size, LCCs presence and cargo traffic have a significant influence on technical and scale efficiency of Italian airports. The results suggest a positive association between overall technical efficiency and these variables, confirming the key role of market in achieving a more sustainable and efficient airport economy. In other words, a regional airport can become economically sustainable if the airport managing authority acts on the market so as to improve both cargo demand and LCCs demand. This confirms the theoretical hypothesis according to which regional airports are economically sustainable if there is an intensive use of the infrastructure, otherwise they would become a problem—and not a resource—for its territory [70].
The analysis of airport performances is carried out following the idea that political determinants are very influential on management system.
Moreover, our findings seem of major interest not only for airport managers and operators, but also for policy makers and regulators. Actually, they shed light on how airports’ performance and environmental sustainability could be improved as well as on the influence that airport size and traffic distribution between passengers and cargo can exert on airport efficiency.
Finally, in the light of the analysis’ findings reported in this paper, we conclude that air transport privatization and deregulation is able to positively affect the transport environmental efficiency and sustainability. This is to say that our results are helpful for better understanding the role of the market mechanism in achieving transport sustainability. However, the topic needs to be further and carefully investigated as regulation, traditionally, is considered crucial in terms of consumer benefits and environmental performance. Therefore, the empirical analysis of the effects of privatization and deregulation is recommended for evaluating such political programs.
Author Contributions:This work is the outcome of joint efforts of the three authors, who contributed equally to conceive and design the research. They read and approved the final manuscript.
Conflicts of Interest:The authors declare no conflicts of interest.
References
1. Gössling, S.; Fichert, F.; Forsyth, P.; Niemeier, H.M. Subsidies in aviation. Sustainability 2017, 9, 1295. [CrossRef]
2. Blauwens, G.J.; De Baere, P.; Van De Voorde, E. Transport Economics; De Boeck: Paris, France, 2016; ISBN 9789045555300.
3. Arbolino, R.; Carlucci, F.; Cirà, A.; Ioppolo, G.; Yigitcanlar, T. Efficiency of the EU regulation on greenhouse gas emissions in Italy: The hierarchical cluster analysis approach. Ecol. Indic. 2017, 81, 115–123. [CrossRef] 4. Arbolino, R.; Carlucci, F.; Cirà, A.; Yigitcanlar, T.; Ioppolo, G. Mitigating regional disparities through
microfinancing: An analysis of microcredit as a sustainability tool for territorial development in Italy. Land Use Policy 2018, 70, 281–288. [CrossRef]
5. Adams, R.; Jeanrenaud, S.; Bessant, J.; Denyer, D.; Overy, P. Sustainability-oriented Innovation: A Systematic Review. Int. J. Manag. Rev. 2016, 18, 180–205. [CrossRef]
6. Costantini, V.; Crespi, F.; Marin, G.; Paglialunga, E. Eco-innovation, sustainable supply chains and environmental performance in European industries. J. Clean. Prod. 2017, 155, 141–154. [CrossRef]
7. Lin, B.; Omoju, O.E. Does private investment in the transport sector mitigate the environmental impact of urbanisation? Evidence from Asia. J. Clean. Prod. 2017, 153, 331–341. [CrossRef]
8. European Commission. Guidelines on State Aid to Airports and Airlines (2014/C 99/03); European Commission: Brussels, Belgium, 2004.
9. Graham, B. Liberalization, regional economic development and the geography of demand for air transport in the European Union. J. Transp. Geogr. 1998, 6, 87–104. [CrossRef]
10. Scotti, D.; Malighetti, P.; Martini, G.; Volta, N. The impact of airport competition on technical efficiency: A stochastic frontier analysis applied to Italian airport. J. Air Transp. Manag. 2012, 22, 9–15. [CrossRef]
11. Bracaglia, V.; D’Alfonso, T.; Nastasi, A. Competition between multiproduct airports. Econ. Transp. 2014, 3, 270–281. [CrossRef]
12. Koo, T.; Halpern, N.; Papatheodorou, A.; Graham, A.; Arvanitis, P. Air transport liberalisation and airport dependency: Developing a composite index. J. Transp. Geogr. 2016, 50, 83–93. [CrossRef]
13. Adler, N.; Ülkü, T.; Yazhemsky, E. Small regional airport sustainability: Lessons from benchmarking. J. Air Transp. Manag. 2013, 33, 22–31. [CrossRef]
14. Jamshidi, A.; Kurumisawa, K.; Nawa, T.; Hamzah, M.O. Analysis of structural performance and sustainability of airport concrete pavements incorporating blast furnace slag. J. Clean. Prod. 2015, 90, 195–210. [CrossRef] 15. Matsumura, T.; Matsushima, N. Airport privatization and international competition. Jpn. Econ. Rev. 2012, 63,
431–450. [CrossRef]
16. Barbot, C. Low-cost airlines, secondary airports, and state aid: An economic assessment of the Ryanair-Charleroi Airport agreement. J. Air Transp. Manag. 2006, 12, 197–203. [CrossRef]
17. Laurino, A.; Beria, P. Low-cost carriers and secondary airports: Three experiences from Italy. J. Destin. Mark. Manag. 2014, 3, 180–191. [CrossRef]
18. Graham, A. Understanding the low cost carrier and airport relationship: A critical analysis of the salient issues. Tour. Manag. 2013, 36, 66–76. [CrossRef]
19. Goetz, A.R.; Graham, B. Air transport globalization, liberalization and sustainability: Post-2001 policy dynamics in the United States and Europe. J. Transp. Geogr. 2004, 12, 265–276. [CrossRef]
20. Mayer, R. Airport classification based on cargo characteristics. J. Transp. Geogr. 2016, 54, 53–65. [CrossRef] 21. Durrani, T.S.; Forbes, S.M. Regional airports—Sustainability, survival or success a case study. In Proceedings
of the IEEE International Engineering Management Conference, Singapore, 18–21 October 2004; Volume 1, pp. 37–41.
22. Minato, N.; Morimoto, R. Designing the commercial sustainability of unprofitable regional airports using system dynamics analysis. Res. Transp. Bus. Manag. 2011, 1, 80–90. [CrossRef]
23. Fu, X.; Lijesen, M.; Oum, T.H. An analysis of airport pricing and regulation in the presence of competition between full service airlines and low cost carriers. J. Transp. Econ. Policy 2006, 40, 425–447.
24. Graham, A. Managing Airports: An International Perspective, 4th ed.; Routledge: Abingdon, UK, 2013; ISBN 978-0415529419.
25. Graham, B.; Shaw, J. Low-cost airlines in Europe: Reconciling liberalization and sustainability. Geoforum 2008, 39, 1439–1451. [CrossRef]
26. Sarkis, J.; Talluri, S. Performance-based clustering for benchmarking of US airports. Transp. Res. Part A Policy Pract. 2004, 38, 329–346. [CrossRef]
27. Pestana Barros, C.; Dieke, P.U.C. Performance evaluation of Italian airports: A data envelopment analysis. J. Air Transp. Manag. 2007, 13, 184–191. [CrossRef]
28. Abrate, G.; Erbetta, F. Efficiency and patterns of service mix in airport companies: An input distance function approach. Transp. Res. Part E Logist. Transp. Rev. 2010, 46, 693–708. [CrossRef]
29. Assaf, A.G.; Gillen, D.; Barros, C. Performance assessment of UK airports: Evidence from a Bayesian dynamic frontier model. Transp. Res. Part E Logist. Transp. Rev. 2012, 48, 603–615. [CrossRef]
30. Barros, C.P. Airports in Argentina: Technical efficiency in the context of an economic crisis. J. Air Transp. Manag. 2008, 14, 315–319. [CrossRef]
31. Martín-Cejas, R.R. An approximation to the productive efficiency of the Spanish airports network through a deterministic cost frontier. J. Air Transp. Manag. 2002, 8, 233–238. [CrossRef]
32. Oum, T.H.; Yan, J.; Yu, C. Ownership forms matter for airport efficiency: A stochastic frontier investigation of worldwide airports. J. Urban Econ. 2008, 64, 422–435. [CrossRef]
33. Yoshida, Y.; Fujimoto, H. Japanese-airport benchmarking with the DEA and endogenous-weight TFP methods: Testing the criticism of overinvestment in Japanese regional airports. Transp. Res. Part E Logist. Transp. Rev. 2004, 40, 533–546. [CrossRef]
34. Arocena, P.; Oliveros, D. The efficiency of state-owned and privatized firms: Does ownership make a difference? Int. J. Prod. Econ. 2012, 140, 457–465. [CrossRef]
35. Curi, C.; Gitto, S.; Mancuso, P. New evidence on the efficiency of Italian airports: A bootstrapped DEA analysis. Socioecon. Plann. Sci. 2011, 45, 84–93. [CrossRef]
36. Gitto, S.; Mancuso, P. Two faces of airport business: A non-parametric analysis of the Italian airport industry. J. Air Transp. Manag. 2012, 20, 39–42. [CrossRef]
37. Wanke, P.; Barros, C.P.; Nwaogbe, O.R. Assessing productive efficiency in Nigerian airports using Fuzzy-DEA. Transp. Policy 2016, 49, 9–19. [CrossRef]
38. Pels, E.; Nijkamp, P.; Rietveld, P. Relative efficiency of European airports. Transp. Policy 2001, 8, 183–192. [CrossRef]
39. Pels, E.; Nijkamp, P.; Rietveld, P. Inefficiencies and scale economies of European airport operations. Transp. Res. Part E Logist. Transp. Rev. 2003, 39, 341–361. [CrossRef]
40. Despotis, D.K. A reassessment of the human development index via data envelopment analysis. J. Oper. Res. Soc. 2005, 56, 969–980. [CrossRef]
41. Farrell, M.J. The Measurement of Productive Efficiency. J. R. Stat. Soc. Ser. A 1957, 120, 253–290. [CrossRef] 42. Terzi, S.; Pierini, A. Data Envelopment Analysis (DEA) assessment of composite indicators of infrastructure
endowment. Riv. Stat. Uff. 2015, 1, 5–18.
43. Cooper, W.W.; Seiford, L.M.; Zhu, J. Handbook on Data Envelopment Analysis; Chapter 1 Data Envelopment Analysis; Springer: Berlin, Germany, 2011; pp. 1–39.
44. Charnes, A.; Cooper, W.W.; Rhodes, E. Measuring the efficiency of decision making units. Eur. J. Oper. Res. 1978, 2, 429–444. [CrossRef]
45. Gillen, D.; Lall, A. Developing measures of airport productivity and performance: An application of data envelopment analysis. Transp. Res. Part E Logist. Transp. Rev. 1997, 33, 261–273. [CrossRef]
46. Martín, J.C.; Román, C. An application of DEA to measure the efficieny of Spanish airports prior to privatization. J. Air Transp. Manag. 2001, 7, 149–157. [CrossRef]
47. Martín, J.C.; Román, C. Political opportunists and mavericks? A typology of Spanish airports. Int. J. Transp. Econ. 2007, 34, 245–269.
48. Barros, C.P.; Dieke, P.U.C. Measuring the economic efficiency of airports: A Simar-Wilson methodology analysis. Transp. Res. Part E Logist. Transp. Rev. 2008, 44, 1039–1051. [CrossRef]
49. Barros, C.P.; Liang, Q. Bin; Peypoch, N. The technical efficiency of US Airlines. Transp. Res. Part A Policy Pract. 2013, 50, 139–148. [CrossRef]
50. Curi, C.; Gitto, S.; Mancuso, P. The Italian airport industry in transition: A performance analysis. J. Air Transp. Manag. 2010, 16, 218–221. [CrossRef]
51. Lam, S.W.; Low, J.M.W.; Tang, L.C. Operational efficiencies across Asia Pacific airports. Transp. Res. Part E Logist. Transp. Rev. 2009, 45, 654–665. [CrossRef]
52. Malighetti, P.; Martini, G.; Paleari, S.; Redondi, R. An Empirical Investigation on the Efficiency, Capacity and Ownership of Italian Airports. Rev. di Polit. Econ. 2007, I, II, 157–188. Available online:http://www. rivistapoliticaeconomica.it/2007/gen-feb/default.php(accessed on 2 February 2018).
53. Oum, T.H.; Adler, N.; Yu, C. Privatization, corporatization, ownership forms and their effects on the performance of the world’s major airports. J. Air Transp. Manag. 2006, 12, 109–121. [CrossRef]
54. Simar, L.; Wilson, P.W. Estimation and inference in two-stage, semi-parametric models of production processes. J. Econom. 2007, 136, 31–64. [CrossRef]
55. Banker, R.D.; Natarajan, R. Evaluating Contextual Variables Affecting Productivity Using Data Envelopment Analysis. Oper. Res. 2008, 56, 48–58. [CrossRef]
56. Hoff, A. Second stage DEA: Comparison of approaches for modelling the DEA score. Eur. J. Oper. Res. 2007, 181, 425–435. [CrossRef]
57. Latruffe, L.; Balcombe, K.; Davidova, S.; Zawalinska, K. Determinants of technical efficiency of crop and livestock farms in Poland. Appl. Econ. 2004, 36, 1255–1263. [CrossRef]
58. Bravo-Ureta, B.E.; Solís, D.; Moreira López, V.H.; Maripani, J.F.; Thiam, A.; Rivas, T. Technical efficiency in farming: A meta-regression analysis. J. Product. Anal. 2007, 27, 57–72. [CrossRef]
59. Yuen Chi-Lok, A.; Zhang, A. Effects of competition and policy changes on Chinese airport productivity: An empirical investigation. In Proceedings of the International Forum on Shipping, Ports and Airports, IFSPA 2008, Trade-Based Global Supply Chain and Transport Logistics Hubs: Trends and Future Development, Hong Kong, China, 25–28 May 2008.
60. Debreu, G. The Coefficient of Resource Utilization. Econometrica 1951, 19, 273–292. [CrossRef]
61. Dyson, R.G.; Allen, R.; Camanho, A.S.; Podinovski, V.V.; Sarrico, C.S.; Shale, E.A. Pitfalls and protocols in DEA. Eur. J. Oper. Res. 2001, 132, 245–259. [CrossRef]
62. Tovar, B.; Martín-Cejas, R.R. Are outsourcing and non-aeronautical revenues important drivers in the efficiency of Spanish airports? J. Air Transp. Manag. 2009, 15, 217–220. [CrossRef]
63. Coto-Millán, P.; Casares-Hontañón, P.; Inglada, V.; Agüeros, M.; Pesquera, M.Á.; Badiola, A. Small is beautiful? The impact of economic crisis, low cost carriers, and size on efficiency in Spanish airports (2009–2011). J. Air Transp. Manag. 2014, 40, 34–41. [CrossRef]
64. Seiford, L.M.; Thrall, R.M. Recent developments in DEA. The mathematical programming approach to frontier analysis. J. Econom. 1990, 46, 7–38. [CrossRef]
65. Liebert, V.; Niemeier, H.-M. A survey of empirical research on the productivity and efficiency measurement of airports. J. Transp. Econ. Policy 2013, 47, 157–189.
66. Perelman, S.; Serebrisky, T. Measuring the technical efficiency of airports in Latin America. Util. Policy 2012, 22, 1–7. [CrossRef]
67. Martín, J.C.; Román, C.; Voltes-Dorta, A. A stochastic frontier analysis to estimate the relative efficiency of Spanish airports. J. Product. Anal. 2009, 31, 163–176. [CrossRef]
68. Cavaignac, L.; Petiot, R. A quarter century of Data Envelopment Analysis applied to the transport sector: A bibliometric analysis. Socioecon. Plann. Sci. 2017, 57, 84–96. [CrossRef]
69. Bottasso, A.; Conti, M.; Piga, C. Low-Cost carriers and airports’ performance: Empirical evidence from a panel of UK airports. Ind. Corp. Chang. 2013, 22, 745–769. [CrossRef]
70. Freestone, R. Planning, sustainability and airport-led urban development. Int. Plan. Stud. 2009, 14, 161–176. [CrossRef]
© 2018 by the authors. Licensee MDPI, Basel, Switzerland. This article is an open access article distributed under the terms and conditions of the Creative Commons Attribution (CC BY) license (http://creativecommons.org/licenses/by/4.0/).