Effects of Liraglutide on Weight
Loss, Fat Distribution, and
b-Cell
Function in Obese Subjects With
Prediabetes or Early Type 2
Diabetes
Diabetes Care 2017;40:1556–1564 | https://doi.org/10.2337/dc17-0589
OBJECTIVE
Obesity is associated with an increased risk of type 2 diabetes and cardiovascular complications. The risk depends significantly on adipose tissue distribution. Liraglutide, a glucagon-like peptide 1 analog, is associated with weight loss, improved glycemic control, and reduced cardiovascular risk. We determined whether an equal degree of weight loss by liraglutide or lifestyle changes has a different impact on subcutaneous adipose tissue (SAT) and visceral adipose tissue (VAT) in obese subjects with prediabetes or early type 2 diabetes.
RESEARCH DESIGN AND METHODS
Sixty-two metformin-treated obese subjects with prediabetes or newly diagnosed type 2 diabetes, were randomized to liraglutide (1.8 mg/day) or lifestyle counseling. Changes in SAT and VAT levels (determined by abdominal MRI), insulin sensitivity (according to the Matsuda index), andb-cell function (b-index) were assessed during a multiple-sampling oral glucose tolerance test; and circulating levels of IGF-I and IGF-II were assessed before and after a comparable weight loss (7% of initial body weight).
RESULTS
After comparable weight loss, achieved by 20 patients per arm, and superimposable glycemic control, as reflected by HbA1clevel (P = 0.60), reduction in VAT was
signif-icantly higher in the liraglutide arm than in the lifestyle arm (P = 0.028), in parallel with a greater improvement inb-index (P = 0.021). No differences were observed in SAT reduction (P = 0.64). IGF-II serum levels were significantly increased (P = 0.024) only with liraglutide administration, and the increase in IGF-II levels correlated with both a decrease in VAT (r = 20.435, P = 0.056) and an increase in the b-index (r = 0.55, P = 0.012).
CONCLUSIONS
Liraglutide effects on visceral obesity andb-cell function might provide a rationale for using this molecule in obese subjects in an early phase of glucose metabolism dysregulation natural history.
1
Department of Medicine and Aging, and Center of Aging Science and Translational Medicine (CESI-Met), “G. d’Annunzio” University of Chieti-Pescara, Chieti, Italy
2
Department of Neuroscience, Imaging and Clini-cal Sciences,“G. d’Annunzio” University of Chieti-Pescara, Chieti, Italy
3Department of Epidemiology and Prevention,
Istituto di Ricovero e Cura a Carattere Scientifico Istituto Neurologico Mediterraneo, Pozzilli, Italy
4
Department of Clinical and Experimental Med-icine, University of Parma, and Division of Endo-crinology, Azienda Ospedaliera-Universitaria di Parma, Parma, Italy
5
Department of Clinica Medica,“SS. Annunziata” Chieti Hospital, Chieti, Italy
6Department of Clinical Pathology,“SS. Annunziata”
Chieti Hospital, Chieti, Italy
7
Dipartimento Pediatrico Universitario Ospedaliero, “Bambino Ges`u” Children’s HospitaldTor Vergata University, Rome, Italy
8Department of Women’s and Children’s Health,
Karolinska Institutet, Stockholm, Sweden
9
Department of Medicine Sciences, University of Ferrara, Ferrara, Italy
Corresponding author: Francesca Santilli, f.santilli@ unich.it.
Received 22 March 2017 and accepted 21 August 2017.
This article contains Supplementary Data online at http://care.diabetesjournals.org/lookup/ suppl/doi:10.2337/dc17-0589/-/DC1.
†Deceased.
© 2017 by the American Diabetes Association. Readers may use this article as long as the work is properly cited, the use is educational and not for profit, and the work is not altered. More infor-mation is available at http://www.diabetesjournals .org/content/license.
Francesca Santilli,1Paola G. Simeone,1 Maria T. Guagnano,1Marika Leo,1 Marica T. Maccarone,2
Augusto Di Castelnuovo,3
Cristina Sborgia,1Riccardo C. Bonadonna,4 Ermanno Angelucci,5Virginia Federico,6 Stefano Cianfarani,7,8Lamberto Manzoli,9
Giovanni Dav`ı,1†Armando Tartaro,2and Agostino Consoli1 PATH OPHYS IOLO GY/C OMPLI CAT IONS
Obesity predisposes to individuals to sev-eral chronic diseases (1), including type 2 diabetes and its complications. Not all obese subjects, however, share the same risk of the development of type 2 diabe-tes (2). Although BMI per se is also as-sociated with an increased risk of the development of type 2 diabetes, this de-pends significantly on adipose tissue body distribution. Indeed, it has been shown that in obese adults visceral adipose tis-sue (VAT) and insulin resistance are in-dependently associated with incident prediabetes and type 2 diabetes, but this is not the case for general adiposity or subcutaneous adipose tissue (SAT) (3). However, whether excess visceral adipos-ity is causally related to metabolic abnor-malities andb-cell function decline is still an open question.
Glucagon-like peptide 1 (GLP-1) is an incretin hormone capable of inducing in-sulin secretion and reducing glucagon se-cretion in a glucose-dependent manner (4). GLP-1 enhances glucose-induced in-sulin synthesis and secretion upon bind-ing to GLP-1 receptors inb-cells, thus increasing b-cell sensitivity to glucose (5,6). In addition, GLP-1 delays gastric emptying and induces satiety, leading to decreased energy intake and weight reduction. GLP-1 analogs with receptor agonist (RA) activity superimposable on the native hormone but with a circulat-ing half-life compatible to clinical use, like liraglutide, have become available for type 2 diabetes treatment. Treatment with these agents is associated with improved glucose control and weight loss (7).
It has been proposed that the activa-tion of the IGF-I receptor expression and signaling, modulated by IGF-II synthe-sis and secretion by theb-cells, might play a role in the actions exerted by in-cretin hormones onb-cells (8). In partic-ular, GLP-1 increases the activity of an IGF-II/IGF-I receptor autocrine loop (8), and this might contribute to protecting b-cells against apoptosis. Interestingly, ad-ipocytes from both SAT and VAT express both IGF-II and IGF-II receptors (9), thus suggesting a possible role of IGF-II in the modulation of body fat distribution. The IGF system might thus be involved in the modulation of incretin effects on both weight loss andb-cell function.
Hypocaloric diet and lifestyle counsel-ing are also associated with weight loss (10). It is unknown, however, whether
achieving an equal degree of weight loss by intervention on caloric intake and physical activity or by using GLP-1 RA has a different impact on the relative reduction in SAT and VAT and, thus, whether a“healthier weight loss modal-ity” might exist (11). Thus, in the current study we assessed modifications in SAT and VAT in obese subjects with impaired glucose tolerance (IGT), impaired fasting glucose (IFG) levels, or early type 2 diabe-tes, who achieved a modest and compa-rable weight loss (7% of initial body weight) induced by either liraglutide treatment or lifestyle counseling. We also evaluated whether modifications in SAT and VAT distribution achieved with either treatment were associated with changes in insulin sensitivity, as assessed by the Matsuda index, and/or inb-cell function. This might provide additional insight into the relationship between vis-ceral fat inflammation and b-cell function and into additional potential mechanisms for the favorable effects of liraglutide on glycemic control and cardiovascular risk (12).
RESEARCH DESIGN AND METHODS
Subjects and Study Design
This study was a longitudinal, random-ized, controlled, parallel-arm study. Each patient provided written informed consent to participate and the protocol was ap-proved by the Ethics Committee of the Uni-versity of Chieti. Subjects were enrolled at the Obesity and Diabetes Clinics of Chieti University Hospital. All study visits and pro-cedures took place at the Clinical Research Center within the CeSI-Met (Center on Aging Sciences and Translational Medi-cine) at the University of Chieti.
This study was performed under the Good Clinical Practice regulations (Good Clinical Practice for Trial on Medicinal ProductdCPMP/European Commissiond July 1990; Decreto Ministeriale 27.4.1992d Ministero della Sanit`a) and the Declaration of Helsinki (Hong Kong 1989). In addition, by signing the present protocol, partici-pants in the study committed themselves to adhere to local legal requirements. Eligibility Criteria
We enrolled subjects with a BMI $30, who had received a diagnosis of IGT, IFG, or type 2 diabetes,12 months pre-viously according to American Diabetes Association Guidelines (13). At the time of study enrollment, all patients were
treated with diet therapy plus metformin at the highest tolerated dose (up to 3,000 mg/day).
Exclusion criteria included type 1 dia-betes; BMI,30; diabetes diagnosed .12 months previously; treatment with any other diabetes drug, other than met-formin, within the last 3 months; uncon-trolled hypertension (systolic/diastolic blood pressure.160/90 mmHg); signifi-cant comorbidities such as kidney disease with a glomerularfiltration rate ,60 ml or liver disease (aspartate aminotransfer-ase [AST] or alanine aminotransferaminotransfer-ase [ALT] levels twice above the upper normal range); pregnancy or lactation; female of child-bearing potential not using adequate contraceptive methods while sexually active; any contraindication to liraglutide (known or suspected hyper-sensitivity to liraglutide or related prod-ucts, previous acute pancreatitis or chronic pancreatitis, inflammatory bowel disease, gastrointestinal surgery including gastric bypass, New York Heart Association heart failure class III-IV); personal history or family history of medullary thyroid carci-noma or personal history of multiple en-docrine neoplasia type 2; claustrophobia; metal implants or other contraindications for MRI; and recent participation in other research projects within the last 3 months or participation in two or more projects in 1 year.
Randomization and Allocation After a baseline evaluation, patients were randomized in a 1:1 ratio to receive liraglutide or lifestyle counseling. The computer-generated random allocation sequence was prepared by the trial stat-istician in blocks of four participants. Based on the order of inclusion in the study, subjects were assigned a consec-utive random number and then were assigned to one of the two treatment groups.
Study medication was supplied to the research pharmacy by Novo Nordisk as liraglutide 6.0 mg/mL in 3-mL prefilled pen injectors. Liraglutide treatment was administered daily by subcutaneous in-jection at bedtime with an initial dose of 0.6 mg/day (first week) and titrated over a 3-week period to doses of 1.2 mg daily (second week) and 1.8 mg daily (third week) based on the clinical response and side effects. The nonattainment of the 1.8-mg dose level did not constitute a with-drawal criterion.
Both groups received lifestyle and di-abetes education as part of the standard care. Patients in the liraglutide arm were invited to continue with their usual die-tary habits and physical activity. Outcome and Study Visits
Participants stayed on the assigned treat-ment until they lost 7% of their initial body weight (calculated on the basis of body weight at baseline visit at the time of randomization). We chose the loss of 7% of initial body weight as the target weight loss based on previous reports where such a weight loss was associated with improved metabolic outcomes (14). Patients not achieving this amount of weight loss within 15 months after ran-domization discontinued treatment, and their data (as well as those of subjects who dropped out of the study) were not included in the calculations. After signing the informed consent form, subjects were evaluated at baseline and after reaching the prespecified weight loss. Both visits included the following: clinical evalua-tion; and abdominal MRI for adipose tis-sue quantification and VAT and SAT (15) assessment. At each visit, blood samples were obtained after a 12-h overnight fast for the measurement of plasma glucose and plasma insulin levels, and circulating levels of hs-CRP. Right after each visit, a frequent-sampling oral glucose tolerance test (OGTT) was performed for the as-sessment of insulin sensitivity (Matsuda index) (16), and b-cell function (17) (b-index).
While receiving treatment, patients were seen every 3 weeks at the Clinical Research Center to reinforce their moti-vation to achieve the weight loss goal and to monitor compliance with liraglutide therapy (missed doses counting) or life-style changes (see below). On each occa-sion, participants underwent a physical examination and were carefully moni-tored for adverse events.
Lifestyle Intervention Program Participants were encouraged to achieve the target weight loss within the first 6 months after randomization, since previ-ous behavioral weight loss studies sug-gested that in most individuals maximum weight loss is achieved within thefirst 20– 24 weeks of a lifestyle intervention (18). Standard lifestyle recommendations were provided in written form and during peri-odic 20- to 30-min individual sessions
focused on the importance of a healthy life-style. Patients met the nutritionists on staff once a week for thefirst 4 weeks, then once every 2 weeks for the following 20 weeks, andfinally once a month (until the achieve-ment of the weight loss goal). Participants were encouraged to follow the Food Guide Pyramid and the equivalent of a National Cholesterol Education Program Step 1 diet, to reduce their weight (healthy low-calorie, low-fat diet) and to increase their physical activity (moderate intensity, such as brisk walking, for at least 150 min/week, to approximate at least 700 kcal/week expenditure).
OGTT With Frequent Sampling Subjects underwent OGTTs with frequent sampling before and after achievement of the weight loss target, at least 48 h after the last administration of liraglutide for those in the liraglutide arm. Patients were admitted to the Clinical Research Center at 8:00A.M.after a 10- to 12-h over-night fast. A catheter was inserted into an antecubital vein, and another catheter was inserted retrogradely into a wrist vein for blood sampling. At time 0 minutes, subjects ingested a 75-g glucose solution over 5 min. Blood samples were collected at210, 0, 15, 30, 45, 60, 90, and 120 min to measure plasma glucose, serum C-peptide, and insulin (baseline samples and 30 min) concentrations.
Insulin sensitivity was calculated using the Matsuda index, which represents a composite of both hepatic and peripheral tissue sensitivity to insulin, as previously described (16).
b-Cell secretion during an OGTT was estimated by applying a minimal model of glucose-induced insulin secretion to the glucose and C-peptide curves of each subject, as previously described in detail (17).
MRI Quantification of Visceral and Subcutaneous Fat
Magnetic resonance images were ob-tained with a Philips 1.5-Tesla Achieva body scanner, available at the Institute for Advanced Biomedical Technologies within the University of Chieti. Calculation of adipose tissue area and volume was performed as previously described (15). Analytical Measurements
Biological Material Collection
At baseline and after achievement of the weight loss goal, venous blood samples
were collected and frozen at220°C for subsequent biochemical measurements.
Biochemical Measurements
Plasma glucose concentrations were mea-sured by the glucose oxidase method, and serum insulin and C-peptide levels were measured by immunochemiluminometric assays. Serum hs-CRP concentrations were measured using a highly sensitive immunoassay. HbA1clevels were
deter-mined by automated high-performance liquid chromatography (19).
Serum IGF-I, IGF-II, and insulin-like growth factor binding protein 3 (IGFBP-3) were measured with specific radioim-munoassay kits (Mediagnost, Tubingen, Germany), as previously described (20).
More detailed methods are available in the Supplementary Data.
Statistical Analysis
The primary outcome was the change in VAT (pretreatment2 posttreatment) af-ter achievement of the weight loss target. Continuous secondary outcomes were changes in levels of SAT, CRP, Matsuda index, hs-CRP, glycemic control measures, including HbA1c, fasting glucose, 2-h
post-load glucose, andb-cell function, as as-sessed byb-index.
Twenty patients were to be studied in each treatment group for a two-taileda value of 0.05 and a power of 90% to de-tect, at the end of the treatment period, a mean difference in the VAT areas of at least 1 SD (of the distribution of VAT changes) between liraglutide and lifestyle intervention. Allowing for a 35% dropout rate or lack of achievement of the weight loss target, we estimated that;30 pa-tients for each treatment arm should have been enrolled and randomized.
The Kolmogorov-Smirnov test and ex-amination of residual distribution were used to determine whether each variable had a normal distribution. When neces-sary, natural-log transformation was used to normalize the data or appropriate nonparametric tests were used (Mann-Whitney U test, Spearman correlation co-efficient). Comparisons of baseline data between groups were performed byx2 tests, Fisher exact tests, unpaired Student t tests, or Mann-Whitney U tests.
For the primary analysis, we used a linear mixed-effects model for repeated mea-sures over time, with change in VAT as the dependent variable, study group and time-by-group interaction asfixed effects, time-to-weight loss (month) as thefixed-effect
covariate, and patients and error as random effects. Within the mixed model, we ob-tained least-squares estimates of the treat-ment differences and SEs, and estimated 95% CIs and P values for the two prespeci-fied intergroup contrasts (liraglutide and life-style intervention) for baseline and end of study within each group.
For other continuous variables (such as insulin sensitivity,b-cell function), we used the same procedure as in the pri-mary analysis.
P values,0.05 were considered to be statistically significant. Data analysis was generated using SAS/STAT software, ver-sion 9.4 of the SAS System for Windows 2009 (SAS Institute Inc., Cary, NC).
RESULTS
Between June 2012 and September 2013, 132 patients were assessed for eligibility in the outpatient Diabetes Clinic and Obe-sity Centre of Chieti UniverObe-sity Hospital. Among these, 70 were excluded (53 did not meet the eligibility criteria, 10 refused to participate, 5 had claustrophobia, and 2 were wearing a pacemaker). A total of 62 patients was randomized to one of the two treatment groupsd31 were assigned to the liraglutide group and 31 were assigned to the lifestyle changes groupdand monitored until achieve-ment of the weight loss goal. Patients were recruited from October 2013 to July 2015.
Final outcome status was ascertained for 40 patients (20 per arm).
Twenty-two subjects were excluded from the analysis. Of those subjects, 6 did not achieve the weight loss target within the allowed 15-month period and 16 were lost to follow-up (13 for unwill-ingness to continue the study, 1 due to metformin intolerance, 1 due to preg-nancy, and 1 due to severe anemia) (Sup-plementary Table 1, seeflowchart). No serious adverse event occurred during the treatment period. Minor gastrointes-tinal side effects were generally well tol-erated. All patients were able to tolerate the maximum dosage of liraglutide (1.8 mg once daily), except one patient who continued with a dose of 1.2 mg/day because of persistent nausea.
Completers were comparable to non-completers with regard to baseline char-acteristics (Supplementary Table 2).
Table 1 shows the demographic and clinical characteristics of the 40 patients
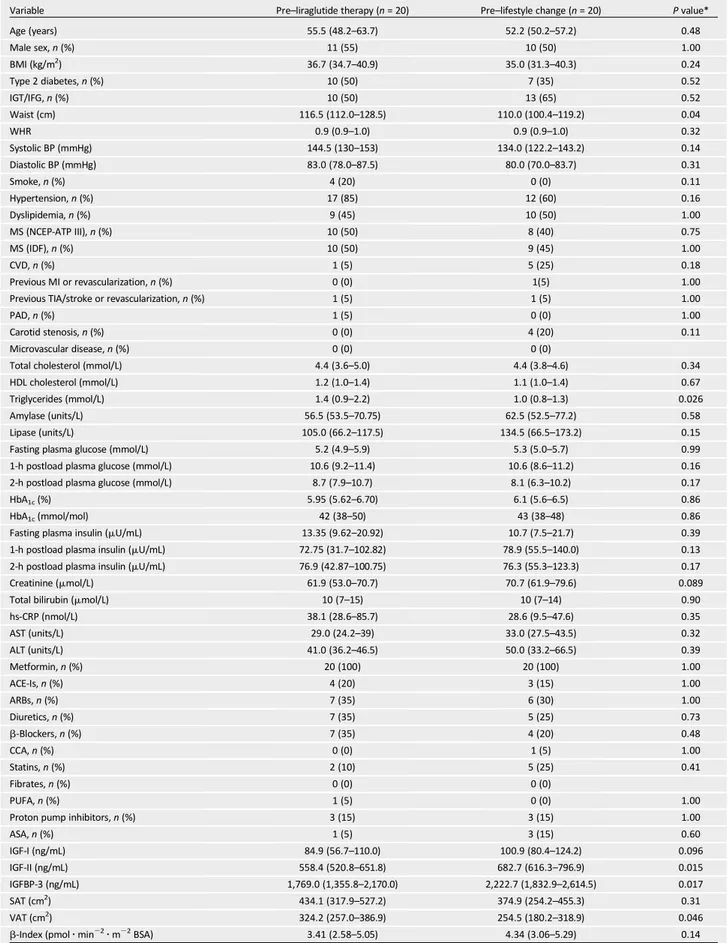
who completed the study. At baseline, the only significant between-group differ-ences were triglyceride levels (greater in the liraglutide group, P = 0.026) and VAT (slightly greater in the liraglutide arm, P = 0.046) (Table 1).
Effects of Liraglutide and Lifestyle Interventions
Weight Loss
The amount of weight loss (as a percent-age of the baseline body weight) was prespecified per protocol; thus, it was the same in both groups. In absolute amount, total weight loss was of 7.79 kg in the liraglutide group and 7.20 kg in the lifestyle intervention group (P. 0.05). The median time necessary to achieve the prespecified amount of weight loss was not different between the two treatment arms (4 months [interquartile r a n g e ( I Q R ) 3 . 2 5–6 months] and 4 months [IQR 3–5.75 months] in the lira-glutide and lifestyle intervention arms, respectively).
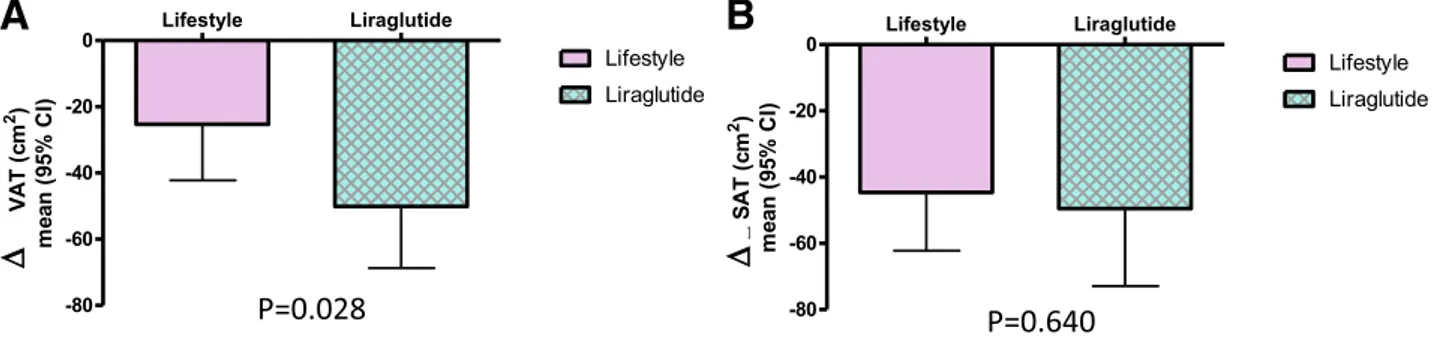
Reduction of VAT and SAT
After comparable weight loss, reduction in VAT was significantly higher in the liraglutide arm (215.3%) than in the life-style arm (29.0%) (between-group P = 0.028) (Fig. 1A and Table 2). On the con-trary, no differences between the two groups were observed in SAT reduction (between-group P = 0.64) (Fig. 1B and Table 2).
Glucose Control
An improvement in glycemic control was observed in both groups. HbA1cwas
com-parably reduced in both arms (P = 0.60) (from 43 to 38 mmol/mol [6.1–5.6%] in the lifestyle arm and from 42 to 38 mmol/mol (5.95–5.65%) in the liraglutide arm) (Fig. 2A and Table 2). A tendency toward improve-ment in fasting blood glucose level and glucose tolerance was observed in both groups. However, the OGTT 1-h and 2-h plasma glucose values decreased signi fi-cantly only in the liraglutide group (Fig. 2B and Table 2).
Insulin Sensitivity andb-Cell Function
As expected, a trend toward improved in-sulin sensitivity, as assessed by the Matsuda index (Fig. 2C and Table 2), was observed in both groups after weight loss. This im-provement reached statistical signi fi-cance only in the lifestyle intervention group; however, no significant between-group difference was observed relative to this parameter.
b-Cell function, as assessed by b-index, improved in the liraglutide group (1.36 pmol z min22 z m22body surface area [BSA], P = 0.001) but not in the lifestyle group (0.46 pmolz min22z m22BSA, P = 0.30) (between-group P = 0.021) (Fig. 2D and Table 2).
IGF-II
At baseline, VAT was inversely related to IGF-II in the whole cohort (n = 62; data not shown).
IGF-II serum levels were significantly increased (P = 0.024), whereas IGFBP-3 was levels were significantly reduced (P = 0.015) after liraglutide-induced weight loss but not after lifestyle intervention– associated weight loss (Table 2). In the liraglutide arm, but not in the lifestyle intervention arm, a significantcorrelation was observed between IGF-II increase and both VAT decrease (r = 20.435, P = 0.056) andb-index increase (r = 0.55, P = 0.012) (data not shown).
The circulating IGF-I level was not af-fected by either intervention (Table 2).
CONCLUSIONS
Weight loss is associated with several metabolic benefits. However, because of different metabolic characteristics of VAT and SAT, it is believed that the loss of VAT, as opposed to SAT, is more bene-ficial. Treatment with GLP-1 RAs of both subjects with type 2 diabetes and obese subjects is associated with weight loss (7). The current study demonstrates that, for the same degree of weight loss, treatment with a GLP-1 RA is more ef-fective than a standardized lifestyle in-tervention protocol in reducing visceral fat.
Previous studies on the effect of GLP-1 RAs on adipose tissue distribution have yielded conflicting results, mostly be-cause of heterogeneity of the length of the intervention and the methods used to assess adipose tissue areas (21–23). In the only study directly comparing liraglutide treatment to lifestyle interven-tion effects (24), the two treatment arms were not comparable in terms of the weight loss achieved but only relative to the duration of the intervention. In our study, the impact on visceral fat loss was independent both of the length of drug exposure (3–12 months) and of overall weight loss per se. Thus, it is conceivable that specific properties of liraglutide (or in general of GLP-1 RAs) might be responsible
Table 1—Baseline characteristics of obese patients randomized to liraglutide- or lifestyle-induced weight loss
Variable Pre–liraglutide therapy (n = 20) Pre–lifestyle change (n = 20) P value*
Age (years) 55.5 (48.2–63.7) 52.2 (50.2–57.2) 0.48 Male sex, n (%) 11 (55) 10 (50) 1.00 BMI (kg/m2) 36.7 (34.7–40.9) 35.0 (31.3–40.3) 0.24 Type 2 diabetes, n (%) 10 (50) 7 (35) 0.52 IGT/IFG, n (%) 10 (50) 13 (65) 0.52 Waist (cm) 116.5 (112.0–128.5) 110.0 (100.4–119.2) 0.04 WHR 0.9 (0.9–1.0) 0.9 (0.9–1.0) 0.32 Systolic BP (mmHg) 144.5 (130–153) 134.0 (122.2–143.2) 0.14 Diastolic BP (mmHg) 83.0 (78.0–87.5) 80.0 (70.0–83.7) 0.31 Smoke, n (%) 4 (20) 0 (0) 0.11 Hypertension, n (%) 17 (85) 12 (60) 0.16 Dyslipidemia, n (%) 9 (45) 10 (50) 1.00 MS (NCEP-ATP III), n (%) 10 (50) 8 (40) 0.75 MS (IDF), n (%) 10 (50) 9 (45) 1.00 CVD, n (%) 1 (5) 5 (25) 0.18 Previous MI or revascularization, n (%) 0 (0) 1(5) 1.00
Previous TIA/stroke or revascularization, n (%) 1 (5) 1 (5) 1.00
PAD, n (%) 1 (5) 0 (0) 1.00
Carotid stenosis, n (%) 0 (0) 4 (20) 0.11
Microvascular disease, n (%) 0 (0) 0 (0)
Total cholesterol (mmol/L) 4.4 (3.6–5.0) 4.4 (3.8–4.6) 0.34
HDL cholesterol (mmol/L) 1.2 (1.0–1.4) 1.1 (1.0–1.4) 0.67
Triglycerides (mmol/L) 1.4 (0.9–2.2) 1.0 (0.8–1.3) 0.026
Amylase (units/L) 56.5 (53.5–70.75) 62.5 (52.5–77.2) 0.58
Lipase (units/L) 105.0 (66.2–117.5) 134.5 (66.5–173.2) 0.15
Fasting plasma glucose (mmol/L) 5.2 (4.9–5.9) 5.3 (5.0–5.7) 0.99
1-h postload plasma glucose (mmol/L) 10.6 (9.2–11.4) 10.6 (8.6–11.2) 0.16 2-h postload plasma glucose (mmol/L) 8.7 (7.9–10.7) 8.1 (6.3–10.2) 0.17
HbA1c(%) 5.95 (5.62–6.70) 6.1 (5.6–6.5) 0.86
HbA1c(mmol/mol) 42 (38–50) 43 (38–48) 0.86
Fasting plasma insulin (mU/mL) 13.35 (9.62–20.92) 10.7 (7.5–21.7) 0.39 1-h postload plasma insulin (mU/mL) 72.75 (31.7–102.82) 78.9 (55.5–140.0) 0.13 2-h postload plasma insulin (mU/mL) 76.9 (42.87–100.75) 76.3 (55.3–123.3) 0.17
Creatinine (mmol/L) 61.9 (53.0–70.7) 70.7 (61.9–79.6) 0.089
Total bilirubin (mmol/L) 10 (7–15) 10 (7–14) 0.90
hs-CRP (nmol/L) 38.1 (28.6–85.7) 28.6 (9.5–47.6) 0.35 AST (units/L) 29.0 (24.2–39) 33.0 (27.5–43.5) 0.32 ALT (units/L) 41.0 (36.2–46.5) 50.0 (33.2–66.5) 0.39 Metformin, n (%) 20 (100) 20 (100) 1.00 ACE-Is, n (%) 4 (20) 3 (15) 1.00 ARBs, n (%) 7 (35) 6 (30) 1.00 Diuretics, n (%) 7 (35) 5 (25) 0.73 b-Blockers, n (%) 7 (35) 4 (20) 0.48 CCA, n (%) 0 (0) 1 (5) 1.00 Statins, n (%) 2 (10) 5 (25) 0.41 Fibrates, n (%) 0 (0) 0 (0) PUFA, n (%) 1 (5) 0 (0) 1.00
Proton pump inhibitors, n (%) 3 (15) 3 (15) 1.00
ASA, n (%) 1 (5) 3 (15) 0.60 IGF-I (ng/mL) 84.9 (56.7–110.0) 100.9 (80.4–124.2) 0.096 IGF-II (ng/mL) 558.4 (520.8–651.8) 682.7 (616.3–796.9) 0.015 IGFBP-3 (ng/mL) 1,769.0 (1,355.8–2,170.0) 2,222.7 (1,832.9–2,614.5) 0.017 SAT (cm2) 434.1 (317.9–527.2) 374.9 (254.2–455.3) 0.31 VAT (cm2) 324.2 (257.0–386.9) 254.5 (180.2–318.9) 0.046
b-Index (pmol z min22z m22BSA) 3.41 (2.58–5.05) 4.34 (3.06–5.29) 0.14
ACE-I, ACE inhibitor; ARB, angiotensin receptor blocker; ASA, acetylsalicylic acid; BP, blood pressure; CCA, calcium channel antagonist; CVD, cardiovascular disease; IDF, International Diabetes Federation; MI, myocardial infarction; MS, metabolic syndrome; NCEP-ATP III, National Cholesterol Education Program-Adult Treatment Panel III; PAD, peripheral artery disease; TIA, transient ischemic attack; WHR, waist-to-hip ratio. Data are expressed as the median (IQR), unless otherwise indicated. *Determined by Mann-Whitney orx2test, as appropriate.
for the more pronounced visceral fat loss observed in the liraglutide arm.
A GLP-1–specific receptor, structurally and/or functionally distinct from that expressed in the pancreas, has been iden-tified in adipose tissue, and its mRNA and protein levels are increased in VAT from severely insulin-resistant, morbidly obese patients (25,26). GLP-1 promotes preadipocyte differentiation (27), reduces the expression of adipogenic and lipogenic genes, and enhances the expression of lipolytic markers in human adipose tissue explants, with distinct effects on VAT and SAT (28). Some of the molecular mecha-nisms described in these preclinical stud-ies might explain the liraglutide effects on VAT that we observed. Consistently, liraglutide treatment is associated with a rapid and substantial reduction of epicardial adipose tissue, an emerging cardiovascu-lar risk factor reflecting organ-specific visceral fat, which correlates with athero-sclerosis and coronary artery disease (29). In addition, it has been recently described (30), in rodents as well as in humans, that liraglutide-induced weight loss might be mediated by the activation of adipose-resident invariant natural killer cells, which in turn drive the production of fi-broblast growth factor 21 by adipocytes, with subsequent thermogenic browning of white fat. These observations, coupled with our results, might point to the adi-pose tissue as a novel target organ for GLP-1 agonists.
We also observed that liraglutide treat-ment was associated with an improve-ment in b-cell function significantly greater than that observed in subjects achieving the same weight loss through lifestyle intervention (31).
In this regard, ourfindings are consis-tent with those of the LIraglutide and
b-cell RepAir (LIBRA) trial (32), where lir-aglutide treatment was associated with a significant and sustained enhancement in b-cell function in individuals with early type 2 diabetes. In the LIBRA trial (33), the increase in theb-cell secretory capac-ity could have been attributable to weight reduction and/or lowering of blood glu-cose level rather than to a direct liraglu-tide effect. In our study, subjects in the two treatment arms achieved the same percentage reduction in body weight and superimposable HbA1cvalues. Thus,
the observed liraglutide effects onb-cell function are presumably independent of weight loss and/or glycemic control (34). In addition, patients in both arms were already in good glycemic control before randomization, as reflected by baseline HbA1c values (median 6.05 [IQR 5.62–
6.50]), and.50% of subjects did not have overt diabetes but were affected just by prediabetes, thus limiting the role of baseline glucotoxicity in inducing b-cell dysfunction. Moreover, we tried to be as accurate as possible in estimating b-cell function in our subjects by applying a minimal model of glucose-induced in-sulin secretion to the post-OGTT glucose and C-peptide curves of each subject (17). Finally, since our study also involved sub-jects with prediabetes, one might specu-late, on the basis of our results, that early treatment with a GLP-1 RA could be help-ful in contrasting and eventually reversing theb-cell deterioration, potentially lead-ing to overt diabetes even in patients with IFG and/or IGT.
Supporting this hypothesis, liraglutide modulates 1-h postload hyperglycemia during an OGTT, which is associated with a higher risk of the development of type 2 diabetes and cardiovascular dis-ease in individuals with prediabetes (35).
We also speculated that the effects of liraglutide on both visceral fat andb-cell function might be intertwined and chal-lenged the hypothesis that the IGF system may be implicated as a mechanistic link. Interestingly, GLP-1 protects b-cells against apoptosis by increasing the activ-ity of an IGF-II/IGF-I receptor autocrine loop (8), which in turn is dependent on IGF-II synthesis and secretion by the b-cells (36). The autocrine action of IGF-II also regulates adultb-cell mass and func-tion (37).b-cell–specific inactivation of IGF-II in mice was associated with impaired glucose-stimulated insulin secretion and cir-culating levels of IGF-II below the detection limit of the ELISA (37), suggesting that se-rum IGF-II levels largely reflect the auto-crine synthesis and secretion byb-cells.
In our study, IGF-II circulating concen-trations significantly increased only in the liraglutide arm, and this increase was re-lated to the positive changes in the b-index. It is tempting to establish a par-allel between the elevation in serum IGF-II mirroring the liraglutide mediated autocrine IGF-II synthesis and the possible positive GLP-1analogue effects onb-cell proliferation, eventually reflected by the increase inb-index.
We also observed that at baseline IGF-II was inversely related to VAT and that in the liraglutide arm the IGF-II in-crease paralleled the dein-crease in VAT area. Since both IGF-II and IGF-II receptors are expressed by adipocytes (9), circulat-ing IGF-II might be a possible link between VAT decrease and b-cell function im-provement during liraglutide treatment. Thus, one could speculate that the ob-served effect of liraglutide onb-cell func-tion might be associated in part with the effect of the drug on visceral fat loss, through an adipoinsular axis where the
Figure 1—Effects of liraglutide- or lifestyle-induced weight loss on adipose tissue body distribution. Changes in VAT (A) and SAT (B) after liraglutide- or lifestyle-induced weight loss, in obese subjects with prediabetes and early type 2 diabetes. P values (lifestyle vs. liraglutide) are for comparison of changes between groups.
Ta bl e 2— Cl inica l, b io chem ic al, a nd im aging p ara m et e rs o f o b e se pa ti ent s be fo re an d a ft e r li ra glu tid e-or li fe sty le-i n du ce d w ei ght lo ss V a ri a b le Pre –l ir a g lu ti d e th e ra p y Post –l ir aglutid e ther a py P v a lu e * Pre –l if e st y le ch a n g e Post –li fes tyle change P valu e* BMI (kg/ m 2) 36. 7 (3 4.7 –4 0 .9 ) 33.9 (31. 4– 37 .9 ) , 0 .0 0 1 35. 0 (31. 3– 4 0 .3 ) 32. 5 (29. 0– 37 .1) , 0. 0 0 1 W a is t (c m ) 116 .5 (112 .0 –1 2 8 .5 ) 110 .0 (104 .2 –1 20. 7) , 0 .0 0 1 110.0 (100 .4 –1 1 9 .2 ) 106 .0 (97.2 –1 1 2 .7 ) 0.001 W H R 0.9 7 (0 .92 –1 .0 4 ) 0.98 (0. 92 –1 .0 0 ) 0.59 0.9 (0. 9– 1 ) 0.9 (0. 9– 1 ) 0.7 8 S y st o lic B P (m m H g ) 144 (130 –1 5 3 ) 133 (122 –1 4 4 ) 0.0 29 134 (122 –1 4 3 ) 133 (125 –1 4 3 ) 0.6 8 D ia st o li c B P (m m H g ) 83 (78 –8 7 ) 7 8 (69 –8 3 ) 0.0 79 80 (70 –8 4 ) 80 (77 –8 6 ) 0.4 8 T o ta l ch o le st e ro l (m m o l/ L) 4.4 (3 .6 –5 .0 2 ) 3.9 (3. 4– 4.6 ) , 0 .0 0 1 4.4 (3. 8– 4 .6 ) 4.2 (3. 7– 4 .6 ) 0.5 1 H D L ch o le st e ro l (m m o l/ L) 1.2 (1. 0– 1 .4 ) 1.1 5 (1. 0– 1 .4 ) 0.0 85 1.1 (1. 0– 1 .4 ) 1.2 (0. 9– 1 .3 ) 0.4 0 T ri g ly ce ri d e s (m m o l/ L) 1.4 (0. 9– 2 .2 ) 1.5 (0. 9– 1 .7 ) 0.29 1.0 (0. 8– 1 .3 ) 90.5 (1. 0– 1 .5 ) 0.3 1 A m y la se (u n it s/ L) 56. 5 (53. 5– 7 0 .7 5 ) 67.5 (46. 7– 8 2 .2 ) 0.65 62. 5 (52. 5– 7 7 .2 ) 74. 5 (55. 2– 9 0 .7 ) 0.046 Li p a se (u n it s/ L) 105.0 (66. 2– 1 1 7 .5 ) 132 .0 (99. 0– 2 2 3 .0 ) 0.0 04 134 .5 (66. 5– 1 7 3 .2 ) 118 .5 (79.0 –1 72. 0) 0 .8 8 F a st in g p la sm a g lu co se (m m o l/ L) 5.2 (4. 9– 5 .9 ) 4.9 (4. 5– 5 .2 ) 0.0 01 5.3 (5. 0– 5 .7 ) 4.9 (4. 6– 5 .2 ) 0.057 1 -h p o st lo a d p la sm a g lu co se (m m o l/ L) 10.6 (9. 2– 1 1 .4 ) 9.0 (7. 1– 10.0 ) , 0 .0 0 1 10. 0 (8 .6 –1 1 .2 ) 8.7 (7. 8– 9 .9 ) 0.097 2 -h p o st lo a d p la sm a g lu co se (m m o l/ L) 8.7 (7 .9 –1 0 .7 ) 7.2 (5. 1– 9 .9 ) 0.0 01 8.1 (6. 3– 1 0 .1 ) 7.7 (5. 7– 1 0 .4 ) 0.3 9 HbA 1c (% ) 5.9 5 (5 .62 –6 .7 0 ) 5.65 (5. 40 –5. 9 7 ) , 0 .0 0 1 6.1 (5. 6– 6 .5 ) 5.6 (5. 4– 6 .1 ) 0.001 HbA 1c (m m o l/ m o l) 42 (38 –5 0 ) 3 8 (36 –42 ) , 0 .0 0 1 4 3 (38 –4 8 ) 38 (36 –4 3 ) 0.001 Fasti n g p lasm a in sul in (m U /m L) 13.3 (9. 6– 2 0 .9 ) 9.7 (6. 7– 1 5 .1 ) 0.0 15 10. 7 (7 .5 –2 1 .7 ) 8.9 (6. 3– 1 1 .1 ) 0.001 Cr eatini ne (m m o l/ L) 61. 6 (5 2.8 –7 0 .4 ) 61.6 (52. 8– 7 9 .2 ) 0.80 70. 4 (61. 6– 7 9 .2 ) 70. 4 (61. 6– 7 9 .2 ) 0.3 6 T o tal b il ir u b in (m m o l/ L) 10 (7 –1 5 ) 10 (9 –1 4 ) 0.88 10 (7 –14 ) 1 0 (7 –1 4 ) 0.8 1 h s-C R P (n m o l/ L) 38. 1 (2 8.6 –8 5 .7 ) 28. 6 (9. 5– 5 7 .1 ) 0.0 04 28. 6 (9 .5 –4 7 .6 ) 28. 6 (19. 0– 2 8 .6 ) 0.018 A S T (u n it s/ L) 29. 0 (24. 2– 3 9 ) 22.0 (19. 2– 25 .5 ) , 0 .0 0 1 33. 0 (27. 5– 4 3 .5 ) 24. 0 (20. 0– 33 .7) , 0. 0 0 1 A LT (u n it s/ L) 41. 0 (3 6.2 –4 6 .5 ) 31.0 (26. 2– 37 .0 ) , 0 .0 0 1 50. 0 (33. 2– 6 6 .5 ) 35. 0 (28. 2– 4 9 .0 ) 0.001 IG F -I (n g /m L) 84. 9 (56. 7– 1 1 0 .0 ) 97. 6 (65.0 –1 2 0 .0 ) 0.12 100 .9 (80. 4– 1 2 4 .2 ) 101 .7 (86.6 –1 28. 7) 0 .2 8 IG F -I I (n g /m L) 558 .4 (520 .8 –6 5 1 .8 ) 610 .7 (543 .0 –7 2 4 .5 ) 0.0 24 682.7 (616 .3 –7 9 6 .9 ) 708 .9 (633 .0 –8 1 8 .4 ) 0.1 7 IG F B P -3 (n g /m L) 1,76 9.0 (1, 355 .8 –2 ,1 7 0 .0 ) 1,51 0.0 (1 ,176 .0 –1 ,9 4 0 .1 ) 0.0 15 2, 222.7 (1,8 33. 0– 2 ,6 1 4 .5 ) 1, 972 .7 (1, 547.3 –2 ,6 0 6 .6 ) 0.100 SA T (c m 2 ) 434 .1 (317 .9 –5 2 7 .2 ) 421 .0 (258 .2 –4 8 1 .8 ) 0.0 01 374.9 (254 .2 –4 5 5 .3 ) 294 .3 (210 .6 –403 .8) , 0. 0 0 1 VAT (cm 2 ) 324 .2 (257 .0 –3 8 6 .9 ) 274 .6 (183 .9 –3 21. 2) , 0 .0 0 1 254.5 (180 .2 –3 1 8 .9 ) 231 .6 (171 .3 –2 9 0 .7 ) 0.017 b -Index (pm o lz min 2 2zm 2 2B S A ) 3.4 1 (2 .58 –5 .0 5 ) 4.77 (3. 39 –5 .5 0 ) 0.0 01 4.3 4 (3. 06 –5 .2 9 ) 4.8 0 (3. 55 –5. 24) 0 .3 0 BP, b lood pr essur e ; W H R , w aist-to-hip ratio. D ata a re expr ess e d a s the medi an (IQR), un less other w is e indi cated. * P val u es fo r com pari son b efore v s. after tr e atment with in grou ps.
IGF system plays a role. However, although our data do suggest an effect of liraglutide on IGF-II increase, ourfindings remain largely correlational, and need to be con-firmed by more in-depth studies specifi-cally designed to test the hypothesis that the IGF system is indeed involved in me-diating liraglutide effects on visceral fat andb-cell function.
A potential limitation of our study, be-side the relatively limited sample size, which might have prevented the detec-tion of addidetec-tional differences between the two groups, is the high rate of study withdrawals. This was largely anticipated, given the complexity of the study design and the requirement of obtaining at least a minimum prespecified weight loss, and was therefore factored in the a priori sample size calculation and subse-quent randomization of an excess of sub-jects. However, study withdrawals were not related to liraglutide side effects, be-cause they were mostly dependent on the nonattainment of the weight loss goal or on metformin intolerance. More im-portantly, completers and noncompleters did not differ in their baseline characteris-tics (Supplementary Table 2), thus largely ensuring against a possible selection bias. Still, we cannot exclude that the
per protocol nature of the analysis might somehow weaken our conclusions. Another limitation is the lack of postintervention follow-up, which prevented assessment of the durability of ourfindings, in particular on adipose tissue distribution. Finally, the reduction in VAT associated with liraglutide treatment was definitely sig-nificant but limited in magnitude. Its clin-ical significance, if any, remains to be fully established.
In conclusion, in a group of obese subjects with prediabetes or early type 2 diabetes randomized to therapy with liraglutide or lifestyle changes to achieve comparable weight loss, we observed significantly en-hanced abdominal visceral fat loss and im-provedb-cell function with liraglutide. Both interventions were equally effective on glycemic control, although improve-ment in glucose tolerance seemed more pronounced after liraglutide treatment. The liraglutide effects on visceral obesity andb-cell function might provide a ratio-nale for its use in obese subjects in an early phase of the natural history of glu-cose metabolism dysregulation.
Acknowledgments. The authors thank Drs. Maria Golato (Department of Clinical Pathology,“SS.
Annunziata” Chieti Hospital), Daniela Germani (Department of Systems Medicine, Tor Vergata University), and Domenico De Cesare (Athero-sclerosis Prevention Center,“G. d’Annunzio” University of Chieti-Pescara) for help in the bio-chemical measurements; Dr. Maria Linda Boselli (Division of Endocrinology and Metabolic Dis-eases, University of Verona) for her contribution in the analysis of the data; and Alessia Quirino (Department of Clinica Medica,“SS. Annunziata” Chieti Hospital) for patient education.
Funding. This study was supported by a grant from the Italian Ministry of University and Re-search (PRIN no. 2010JS3PMZ to F.S.). Duality of Interest. A.C. received lecture fees and fees for serving on advisory boards from Novo Nordisk, Eli Lilly, AstraZeneca, Sanofi, Merck Sharp & Dohme, and Takeda and grant support to his institution from Novo Nordisk. No other potential conflicts of interest relevant to this article were reported.
Author Contributions. F.S. contributed to the study design and protocol, the analysis plan, the supervision of the analysis, study implementation, data acquisition and interpretation, statistical analy-ses,writing of the manuscript, andcriticalrevisionand finalapprovalofthemanuscript.P.G.S.contributedto study implementation, data acquisition and inter-pretation, and writing of the manuscript. M.T.G., M.L., M.T.M., C.S., R.C.B., E.A., V.F., S.C., G.D., and A.T. contributed to study implementation, data acquisition and interpretation, andfinal approval of the manuscript. A.D.C. and L.M. contributed to the analysis plan, the supervision of the analysis, statistical analyses, andfinal approval of the manuscript. A.C. contributed to the study design and protocol, the analysis plan, the supervision Figure 2—Effects of liraglutide- or lifestyle-induced weight loss on glycemic control, insulin sensitivity, and b-cell function. Changes in HbA1c(A), 2-h
postload plasma glucose (B), Matsuda index (C), andb-index (D) after liraglutide- or lifestyle-induced weight loss in obese subjects with prediabetes and early type 2 diabetes. P values (lifestyle vs. liraglutide) are for comparison of changes between groups.
of the analysis, data interpretation, writing of the manuscript, and critical revision andfinal approval of the manuscript. F.S. and A.C. are the guarantors of this work and, as such, had full access to all the data in the study and take responsibility for the integrity of the data and the accuracy of the data analysis.
Prior Presentation. Parts of this study were presented in poster form at the 75th Scientific Sessions of the American Diabetes Association, Boston, MA, 5–9 June 2015, and at the 51st An-nual Meeting of the European Association for the Study of Diabetes (EASD), Stockholm, Sweden, 14–18 September 2015.
References
1. Heymsfield SB, Wadden TA. Mechanisms, pathophysiology, and management of obesity. N Engl J Med 2017;376:254–266
2. Kim SH, Despr´es JP, Koh KK. Obesity and car-diovascular disease: friend or foe? Eur Heart J 2016;37:3560–3568
3. Neeland IJ, Turer AT, Ayers CR, et al. Dysfunc-tional adiposity and the risk of prediabetes and type 2 diabetes in obese adults. JAMA 2012;308: 1150–1159
4. Nauck MA, Meier JJ. The incretin effect in healthy individuals and those with type 2 diabe-tes: physiology, pathophysiology, and response to therapeutic interventions. Lancet Diabetes Endo-crinol 2016;4:525–536
5. Drucker DJ, Nauck MA. The incretin system: glucagon-like peptide-1 receptor agonists and di-peptidyl peptidase-4 inhibitors in type 2 diabetes. Lancet 2006;368:1696–1705
6. Yusta B, Baggio LL, Estall JL, et al. GLP-1 recep-tor activation improves beta cell function and survival following induction of endoplasmic re-ticulum stress. Cell Metab 2006;4:391–406 7. Vilsbøll T, Zdravkovic M, Le-Thi T, et al. Liraglutide, a long-acting human glucagon-like pep-tide-1 analog, given as monotherapy significantly improves glycemic control and lowers body weight without risk of hypoglycemia in patients with type 2 diabetes. Diabetes Care 2007;30:1608–1610 8. Cornu M, Yang J-Y, Jaccard E, Poussin C, Widmann C, Thorens B. Glucagon-like peptide-1 protectsb-cells against apoptosis by increasing the activity of an Igf-2/Igf-1 receptor autocrine loop. Diabetes 2009;58:1816–1825
9. Sinha MK, Buchanan C, Raineri-Maldonado C, et al. IGF-II receptors and IGF-II-stimulated glu-cose transport in human fat cells. Am J Physiol 1990;258:E534–E542
10. Pi-Sunyer X, Astrup A, Fujioka K, et al.; SCALE Obesity and Prediabetes NN8022-1839 Study Group. A randomized, controlled trial of 3.0 mg of liraglutide in weight management. N Engl J Med 2015;373:11–22
11. Despr ´es JP. Obesity and cardiovascular dis-ease: weight loss is not the only target. Can J Cardiol 2015;31:216–222
12. Marso SP, Daniels GH, Brown-Frandsen K, et al.; LEADER Steering Committee; LEADER Trial Investigators. Liraglutide and cardiovascular out-comes in type 2 diabetes. N Engl J Med 2016;375: 311–322
13. American Diabetes Association. Classification and diagnosis of diabetes. Sec. 2. In Standards of Medical Care in Diabetesd2015. Diabetes Care 2015;38(Suppl. 1):S8–S16
14. Knowler WC, Barrett-Connor E, Fowler SE, et al.; Diabetes Prevention Program Research Group. Reduction in the incidence of type 2 diabetes with lifestyle intervention or metformin. N Engl J Med 2002;346:393–403
15. Ross R, L ´eger L, Morris D, de Guise J, Guardo R. Quantification of adipose tissue by MRI: rela-tionship with anthropometric variables. J Appl Physiol (1985) 1992;72:787–795
16. Matsuda M, DeFronzo RA. Insulin sensitivity indices obtained from oral glucose tolerance test-ing: comparison with the euglycemic insulin clamp. Diabetes Care 1999;22:1462–1470 17. Cretti A, Lehtovirta M, Bonora E, et al. Assess-ment of beta-cell function during the oral glucose tolerance test by a minimal model of insulin se-cretion. Eur J Clin Invest 2001;31:405–416 18. Jeffery RW, Wing RR, Mayer RR. Are smaller weight losses or more achievable weight loss goals better in the long term for obese patients? J Consult Clin Psychol 1998;66:641–645 19. Khuu HM, Robinson CA, Goolsby K, Hardy RW, Konrad RJ. Evaluation of a fully automated high-performance liquid chromatography assay for hemoglobin A1c. Arch Pathol Lab Med 1999; 123:763–767
20. Cianfarani S, Inzaghi E, Alisi A, Germani D, Puglianiello A, Nobili V. Insulin-like growth factor-I and -II levels are associated with the progression of nonalcoholic fatty liver disease in obese child-ren. J Pediatr 2014;165:92–98
21. Bouchi R, Nakano Y, Fukuda T, et al. Reduc-tion of visceral fat by liraglutide is associated with ameliorations of hepatic steatosis, albuminuria, and micro-inflammation in type 2 diabetic pa-tients with insulin treatment: a randomized con-trol trial. Endocr J 2017;64:269–281
22. Li CJ, Yu Q, Yu P, et al. Changes in liraglutide-induced body composition are related to modi fi-cations in plasma cardiac natriuretic peptides levels in obese type 2 diabetic patients. Cardio-vasc Diabetol 2014;13:36
23. Morano S, Romagnoli E, Filardi T, et al. Short-term effects of glucagon-like peptide 1 (GLP-1) receptor agonists on fat distribution in patients with type 2 diabetes mellitus: an ultrasonography study. Acta Diabetol 2015;52:727–732
24. Pastel E, McCulloch LJ, Ward R, et al. GLP-1 analogue-induced weight loss does not improve
obesity-induced AT dysfunction. Clin Sci (Lond) 2017;131:343–353
25. Montrose-Rafizadeh C, Yang H, Wang Y, Roth J, Montrose MH, Adams LG. Novel signal trans-duction and peptide specificity of glucagon-like peptide receptor in 3T3-L1 adipocytes. J Cell Physiol 1997;172:275–283
26. Vendrell J, El Bekay R, Peral B, et al. Study of the potential association of adipose tissue GLP-1 receptor with obesity and insulin resistance. Endocrinology 2011;152:4072–4079
27. Challa TD, Beaton N, Arnold M, Rudofsky G, Langhans W, Wolfrum C. Regulation of adipocyte formation by GLP-1/GLP-1R signaling. J Biol Chem 2012;287:6421–6430
28. El Bekay R, Co´ın-Arag¨uez L, Fern´andez-Garc´ıa D, et al. Effects of glucagon-like peptide-1 on the differentiation and metabolism of human adipo-cytes. Br J Pharmacol 2016;173:1820–1834 29. Iacobellis G, Mohseni M, Bianco SD, Banga PK. Liraglutide causes large and rapid epicardial fat reduction. Obesity (Silver Spring) 2017;25: 311–316
30. Lynch L, Hogan AE, Duquette D, et al. iNKT cells induce FGF21 for thermogenesis and are re-quired for maximal weight loss in GLP1 therapy. Cell Metab 2016;24:510–519
31. Færch K, Johansen NB, Witte DR, Lauritzen T, Jørgensen ME, Vistisen D. Relationship between insulin resistance andb-cell dysfunction in sub-phenotypes of prediabetes and type 2 diabetes. J Clin Endocrinol Metab 2015;100:707–716 32. Retnakaran R, Kramer CK, Choi H, Swaminathan B, Zinman B. Liraglutide and the preservation of pancreaticb-cell function in early type 2 diabe-tes: the LIBRA trial. Diabetes Care 2014;37:3270– 3278
33. Arnolds S, Sawicki PT. Comment on Retnakaran et al. Liraglutide and the preservation of pancreaticb-cell function in early type 2 diabe-tes: the LIBRA trial. Diabetes Care 2014;37:3270-3278. Diabetes Care 2015;38:e25
34. Ferrannini E, Camastra S, Gastaldelli A, et al. Beta-cell function in obesity: effects of weight loss. Diabetes 2004;53(Suppl. 3):S26–S33 35. Fiorentino TV, Sesti F, Andreozzi F, et al. One-hour post-load hyperglycemia combined with HbA1c identifies pre-diabetic individuals with a higher cardio-metabolic risk burden. Atheroscle-rosis 2016;253:61–69
36. Cornu M, Modi H, Kawamori D, Kulkarni RN, Joffraud M, Thorens B. Glucagon-like peptide-1 increases beta-cell glucose competence and pro-liferation by translational induction of insulin-like growth factor-1 receptor expression. J Biol Chem 2010;285:10538–10545
37. Modi H, Jacovetti C, Tarussio D, et al. Auto-crine action of IGF2 regulates adultb-cell mass and function. Diabetes 2015;64:4148–4157
©2017 American Diabetes Association. Published online at http://care.diabetesjournals.org/lookup/suppl/doi:10.2337/dc17-0589/-/DC1
Subjects underwent OGTT with frequent sampling before and after achievement of the weight loss goal,
after at least 48 hours since the last administration of liraglutide for those in the liraglutide arm. Patients
were instructed to consume a weight maintaining diet containing 200-250 g of carbohydrate per day for
at least 3 days before the OGTT. Patients were admitted to the Clinical Research Center (CRC) at 8 am
after 10-12 hours overnight fast. For the post-weight loss OGTT, liraglutide was withheld two evenings
before the OGTT such that the last dose was administered 48 h earlier. A catheter was inserted into an
antecubital vein and another catheter was inserted retrogradely into a wrist vein for blood sampling.
Each study lasted 130 minutes (-10’ to 120’). At time 0’, subjects ingested a 75-g glucose solution over
5’. Blood samples was collected at -10', 0', 15', 30', 45', 60', 90', 120' to measure plasma glucose and
serum C-peptide and insulin (baseline samples and +30’) concentrations.
Insulin sensitivity was obtained using the Matsuda index, a simple index which represents a composite
of both hepatic and peripheral tissue sensitivity to insulin, and has been demonstrated to be highly
correlated with the rate of whole-body glucose disposal during the euglycemic insulin clam (1). The
following formula was employed: 10,000/square root (fasting plasma glucose* fasting plasma insulin)
*(Mean OGTT glucose concentration *mean OGTT insulin concentration).
Beta cell secretion during OGTT was estimated by applying a minimal model of glucose-induced
insulin secretion to the glucose and C-peptide curves of each subject, as previously described in detail
(2). C-peptide kinetics was assumed to be known in each subject according to a two-compartmental
model previously proposed (3). Individual parameters were calculated from population data (4),
according to sex, age, body surface area and presence/absence of obesity and type 2 diabetes.
©2017 American Diabetes Association. Published online at http://care.diabetesjournals.org/lookup/suppl/doi:10.2337/dc17-0589/-/DC1
Charlottesville, VA, USA), leading to unique identification of OGTT beta index (log units), a compound
parameter of beta cell function during OGTT.
The OGTT beta index is derived from a very parsimonious description of beta cell response to oral
glucose, developed for tests in which sampling number and frequency is limited (2). Glucose-stimulated
insulin secretion (GSIS) during the OGTT is superimposed on basal insulin secretion rate (B-ISR;
derived from basal C-peptide concentration and from the parameters of C-peptide kinetics calculated
from population data as in (4)) and is described as follows:
where GSIS(t) (units: pmol
.min
-1) is C-peptide (insulin) secretion rate in response to glucose, (units:
min) is the time constant with which C-peptide (insulin) made available for secretion is released into the
bloodstream, X (units: pmol) is the amount of C-peptide (insulin) made available for secretion, (units:
pmol
.L
.min
-1.mmol
-1) is the slope of the line relating glucose stimulus to the amount of insulin made
available for secretion, G (units: mmol
.L
-1) is the prevailing plasma glucose concentration, and (units:
mmol
.L
-1) is the apparent glucose concentration threshold above which insulin secretion is stimulated by
plasma glucose.
where 11 is the extreme nondiabetic glucose (mmol
.L
-1) value at 120’ during a standard OGTT, BSA
(units: m
2) is the body surface area and
is the basis of natural logarithms, which was chosen to
mitigate the disproportionate impact that
τ
values lower than 1 would exert on global beta index.
©2017 American Diabetes Association. Published online at http://care.diabetesjournals.org/lookup/suppl/doi:10.2337/dc17-0589/-/DC1
were calculated using the trapezoidal rule.
- Magnetic resonance imaging (MRI) Quantification of Visceral and Subcutaneous Fat
MR images were obtained with a Achieva Philips 1.5 Tesla body scanner, which was available at the
Institute for Advanced Biomedical Technologies (ITAB), a neuroscience and imaging research center
within the University of Chieti. A spin-echo sequence with a 500-ms repetition time and 20-ms echo
time was used for all acquisitions. To plan the data acquisition, a transverse and sagittal image of the
abdomen region were taken to identify the intervertebral space between the lumbar fourth (L4) and fifth
(L5) vertebrae. Transverse slices (10 mm thick) were then acquired every 50 mm, beginning at the
L4-L5 space and continuing toward the feet. The optimal threshold for adipose tissue was 110 (on a scale of
256). Calculation of adipose tissue area and volume was performed as previously described (5).
Analytical measurements
Biological material collection. At admission to the study and after the achievement of the weight loss
goal, venous blood samples were collected and frozen at -20°C for subsequent biochemical
measurements.
Biochemical measurements
Plasma glucose concentration was measured by the glucose oxidase method and serum insulin and
C-peptide levels by immunochemiluminometric assays. Serum high sensitivity-C-reactive protein
(hs-CRP) concentrations were measured using highly sensitive immunoassay. The HbA1c level was
determined by automated high-performance liquid chromatography (HPLC) (6).
©2017 American Diabetes Association. Published online at http://care.diabetesjournals.org/lookup/suppl/doi:10.2337/dc17-0589/-/DC1
which uses an excess of IGF-II to eliminate interferences by IGFBPs. The intra-assay CV was 6.7%, the
interassay CV was 6.8%, and the sensitivity limit was 0.09 ng/mL. IGF-II was measured using a specific
immunoassay kit (Mediagnost) with an interassay CV of <7.2%, an intra-assay CV of <6.6%, and a
sensitivity limit of 0.02 ng/mL. IGFBP-3 was determined with a specific immunoassay kit (Mediagnost)
with an intra-assay CV of <4.51%, an interassay CV of <6.3%, and a sensitivity limit of 0.1 ng/mL.
References
1.
Matsuda M,
DeFronzo RA
. Insulin sensitivity indices obtained from oral glucose tolerance testing:
comparison with the euglycemic insulin clamp. Diabetes Care 1999; 22:1462-1470
2.
Cretti A
,
Lehtovirta M
,
Bonora E
, et al. Assessment of beta-cell function during the oral glucose
tolerance test by a minimal model of insulin secretion. Eur J Clin Invest 2001;31:405-416.
3.
Polonsky KS,
Licinio-Paixao J
,
Given BD
, et al. Use of biosynthetic human C-peptide in the
measurement of insulin secretion rates in normal volunteers and type I diabetic patients.
J Clin
Invest 1986;77:98-105
4.
Van Cauter E,
Mestrez F
,
Sturis J
,
Polonsky KS
. Estimation of insulin secretion rates from
C-peptide levels. Comparison of individual and standard kinetic parameters for C-C-peptide clearance.
Diabetes 1992;41:368-377
5.
Ross R,
Léger L
,
Morris D
,
de Guise J
,
Guardo R
. Quantification of adipose tissue by MRI:
relationship with anthropometric variables. J Appl Physiol 1992;72:787-795
6.
Khuu HM, Robinson CA, Goolsby K, Hardy RW, Konrad RJ. Evaluation of a fully automated
high-performance liquid chromatography assay for hemoglobin A1c. Arch Pathol Lab Med.
1999;123:763-767
©2017 American Diabetes Association. Published online at http://care.diabetesjournals.org/lookup/suppl/doi:10.2337/dc17-0589/-/DC1
Variable
Completers (n=40)
Non-completers
(n=22)
p-value*
Age (years)
53.0 (49.0-60.2)
47.5 (42.2-57.5)
0.054
Gender (male), n (%)
21 (52.5)
4 (18.2)
0.014
BMI (kg/m
2)
36.6 (32.7-40.3)
40.8 (34.9-44.2)
0.064
Type 2 diabetes, n (%)
17 (42.5)
6 (27.3)
0.281
IGT/IFG, n (%)
24 (60)
17(77.3)
0.281
Waist (cm)
113.5 (104.0-124.2)
122.0 (107.0-127.2)
0.276
WHR
0.96 (0.90-1.01)
0.91 (0.86-0.97)
0.052
Systolic BP (mmHg)
139.0 (124.7-148.7)
138.0 (125.5-150.2)
0.959
Diastolic BP (mmHg)
80.0 (75.0-85.0)
80.0 (72.2-88.5)
0.796
Smoke, n (%)
4 (10)
3 (13.6)
0.691
Hypertension, n (%)
29 (72.5)
11(50)
0.099
Dyslipidemia, n (%)
19 (47.5)
9 (40.9)
0.790
MS (NCEPT-ATP III), n (%)
18 (45.0)
13 (59.1)
0.426
MS (IDF), n (%)
19 (47.5)
13 (59.1)
0.434
CVD, n (%)
6 (15)
0 (0)
0.081
Previous MI, or
revascularization, n (%)
1 (2.5)
0 (0)
1.00
Previous TIA/stroke, or
revascularization, n (%)
2 (5)
0 (0)
0.535
PAD, n (%)
1 (2.5)
0 (0)
1.00
Carotid stenosis, n (%)
4 (10)
0 (0)
0.287
Microvascular disease, n
(%)
0 (0)
0 (0)
-
Total cholesterol (mmol/L)
4.4 (3.7-4.9)
4.3 (3.7-5.3)
0.691
HDL cholesterol (mmol/L)
1.1 (1.0-1.4)
1.1 (1.0-1.4)
0.768
Triglycerides (mmol/L)
1.3 (0.8-1.6)
1.5 (1.1-1.8)
0.088
Amylase (U/L)
60.0 (53.2-74.0)
57.0 (45.0-71.0)
0.279
Lipase (U/L)
111.0 (66.5-152.7)
85.0 (59.5-109.0)
0.071
Fasting plasma glucose
(mmol/L)
5.3 (5.0-5.8)
5.3 (4.7-5.9)
0.735
1-hour-post load plasma
glucose (mmol/L)
10.2 (9.0-11.3)
10.1 (7.2-11.2)
0.485
2-hour-post load plasma
glucose (mmol/L)
8.5 (7.3-10.4)
8.7 (7.2-11.2)
0.933
HbA1c (%)
6.05 (5.62-6.50)
6.0 (5.70-6.5)
0.768
HbA1c (mmol/mol)
43 (38-48)
42 (39-48)
0.768
Fasting plasma insulin
(uU/ml)
11.60 (8.87-20.92)
13.9 (6.7-24.5)
0.687
1-hour post load plasma
insulin (uU/ml)
©2017 American Diabetes Association. Published online at http://care.diabetesjournals.org/lookup/suppl/doi:10.2337/dc17-0589/-/DC1