Fat mass and obesity-associated gene (FTO) is
associated to eating disorders susceptibility
and moderates the expression of
psycho-pathological traits
Giovanni Castellini1,2☯, Marica Franzago3☯, Silvia Bagnoli1, Lorenzo Lelli1, Michela Balsamo3, Milena Mancini3, Benedetta Nacmias1, Valdo Ricca1, Sandro Sorbi1,
Ivana Antonucci3, Liborio Stuppia3*, Giovanni Stanghellini3,4
1 Department of Neuroscience, Psychology, Drug Research and Child Health. University of Florence,
Florence, Italy, 2 Sexual Medicine and Andrology Unit, Department of Experimental, Clinical and Biomedical Sciences. University of Florence, Florence, Italy, 3 Department of Psychological, Health and Territorial Sciences, School of Medicine and Health Sciences, “G. d’Annunzio University” Chieti-Pescara, Chieti, Italy,
4 D. Portales’ University, Santiago, Chile
☯These authors contributed equally to this work. *[email protected]
Abstract
Eating Disorders (EDs) show a multifactorial etiopathogenesis including environmental, psy-chological and biological factors. In the present study, we propose a model of interactions between genetic vulnerability—represented by Fat Mass and Obesity-Associated (FTO) gene—and stable psychopathological traits, such as bodily disorders and emotion dysregu-lation for EDs patients. The distribution of a polymorphism of the FTO (rs9939609 T>A) was
evaluated in a series of 250 EDs patients and in a group of 119 healthy control subjects. Clinical data were collected through a face-to-face interview and several self-reported questionnaires were applied, including the Emotional Eating Scale and the IDentity and EAting disorders (IDEA) questionnaire for bodily disorders and self-identity. The A-allele was associated with an increased vulnerability to EDs (AA+AT genotypes frequency 72.8% in EDs vs. 52.9% in controls). The presence of the A-allele was associated with binge eating behavior, higher emotional eating and higher IDEA scores. Finally, the FTO rs9939609 SNP was found to influence the relationship between these variables, as an association between disorder of corporeality and emotional eating was found only in A-allele carriers. A-A-allele seems to represent a potential additive risk factor for EDs persons, with bodily disorders to develop emotional eating and binge eating behaviors.
Introduction
The multifactorial etiopathogenesis of eating disorders (EDs) encompasses environmental, psy-chological and biological factors [1]. According to a gene-environmental approach, the different expression of the psychopathological core can be influenced by genetic variability, explaining a part of the variance of the susceptibility to EDs and different phenotypical features [2]. In this
a1111111111 a1111111111 a1111111111 a1111111111 a1111111111 OPEN ACCESS
Citation: Castellini G, Franzago M, Bagnoli S, Lelli
L, Balsamo M, Mancini M, et al. (2017) Fat mass and obesity-associated gene (FTO) is associated to eating disorders susceptibility and moderates the expression of psychopathological traits. PLoS ONE 12(3): e0173560. doi:10.1371/journal.
pone.0173560
Editor: David Meyre, McMaster University,
CANADA
Received: September 28, 2016 Accepted: February 23, 2017 Published: March 10, 2017
Copyright:© 2017 Castellini et al. This is an open access article distributed under the terms of the
Creative Commons Attribution License, which permits unrestricted use, distribution, and reproduction in any medium, provided the original author and source are credited.
Data Availability Statement: All relevant data are
within the paper.
Funding: The authors received no specific funding
for this work.
Competing interests: The authors have declared
view, several genes have been investigated as possible candidates [3]. Among these, great inter-est has been recently devoted to the Fat Mass and Obesity-Associated (FTO) gene, previously
implicated in obesity within several association studies [4,5], as a possible candidate for playing a role in the pathogenesis of EDs [6].FTO encodes for an AlkB-like 2-oxoglutarate–dependent
nucleic acid demethylase, a potential regulator of RNA modification, whose cellular function so far remains undefined [7].
The molecular basis of the association between theFTO locus and obesity have been
hypothe-sized, even though the involved cell types and target genes remain uncharacterized [8]. Recently, several authors evidenced, with state-of-the-art chromatin-capture sequencing technologies, that noncoding variations in Single Nucleotide Polymorphisms (SNPs) within a 47-kb region in introns 1 and 2 ofFTO do no affect the expression of this gene, but are connected, at megabase
distances with the homeobox geneIRX3 in the human, mouse and zebrafish genomes [8,9].IRX3
encodes a transcription factor expressed in multiple regions of the brain including cerebellum and hypothalamus, suggesting that this gene plays an important role in the regulation of body mass and composition [9].
In addition, Claussnitzer et al. [8] demonstrated that specificFTO variant can disrupt a
conserved motif for theARID5B repressor, leading to derepression of a potent preadipocyte
enhancer and a doubling ofIRX3 and IRX5 expression during early adipocyte differentiation.
AmongFTO SNPs involved in this mechanism and associated with obesity, rs9939609 (located
82.431kb downstream of ATG start codon) is the most frequently described. The obesity predis-posing riskA-allele is considered one of the strongest risk factor for polygenetic obesity in the
Caucasian ethnic group worldwide, showing carriers of this allele with a significantly higher BMI and adiposity, as well as consuming a higher percentage of energy from fat [5,10]. The interest in the relationship between rs9939609 and EDs pathogenesis is also due to the role of this SNP in satiety responsiveness [11] and to FTO high expression in the hypothalamic regions of the brain associated with appetite regulation [12]. Notwithstanding the hypothetically relevant connection between EDs, satiety and appetite regulation, conflicting results have so far been reported about the possible associations betweenFTO and EDs. In fact, Mu¨ller et al. [6] found an association of theA-allele with both diagnoses of Anorexia Nervosa (AN) and Bulimia Nervosa (BN), while
Jonassaint et al. [12] did not find any significant association with AN diagnosis. However, rs993 9609 was not evaluated in this latter study, which pointed at othersFTO SNPs. Moreover, data
about Binge Eating Disorder (BED) are totally lacking. Thus, these spurious results do not rule out a role ofFTO in the susceptibility to EDs, suggesting that this association should be further
investigated using a more refined assessment of ED psychopathology. Also, phenotypes defined by DSM diagnoses such as AN, BN, BED are known to be unstable through time [13,14,15] and unsuitable for correlations with genetic polymorphisms.
Our hypothesis is that significant correlations can be found betweenFTO and ED
pheno-types associated with stable traits such as disorders of corporeality. Indeed, they have been found to often precede eating disorders [16] and to predict long term outcome [14,17]. In this view, in the present study we propose a model of interactions between genetic vulnera-bility represented by a specific polymorphism and stable psychopathological traits, resulting in specific pathological eating attitudes and behavior, which can be considered as endophe-notypes (intermediate pheendophe-notypes) of this condition. In particular, high-risk variant inFTO
could affect eating behaviours (i.e. by means of binge-eating episodes) and promote exces-sive weight gain and obesity.
The main aim of the present study is to investigate the role ofA-allele at rs9939609 as a risk
factor for Eating Disorder and in particular for the above mentioned specific ED psychopa-thology aspects.
Materials and methods
The distribution of theFTO rs9939609 (T>A) was evaluated in a series of 250 Italian,
Cauca-sian, EDs patients referred to the outpatient clinic for EDs at the Florence University School of Medicine, and in a group of 119 Caucasian healthy sex matched control subjects. All diagnostic procedures (apart from the extraction of blood samples and genetic analyses) and psychomet-ric tests are part of the routine clinical assessment for EDs patients regularly performed at our clinic, as previously described [18]. Study procedures were fully explained during the first rou-tine visit and prior to the collection of data; after which the patients were asked to provide two different written informed consents, one for participation in the clinical study and one for the genetic analysis. The study protocol was performed in compliance with the Declaration of Hel-sinki and was approved by the Ethics Committee of G. d’Annunzio University and Careggi Hospital University, respectively. The detailed study design has already been described in two earlier studies reported by our group [18,19].
Participants
EDs patients attending the outpatient clinic for EDs of Florence, Italy, between July 2010 and March 2014 were enrolled in the study, provided they met the following inclusion criteria: aged between 18 and 60 years; current DSM-IV diagnosis of AN and BN assessed by means of the Structured Clinical Interview for DSM-IV [20]. The study design and methodology was adopted from our previous studies [18]. The diagnoses were based on the current symptomatology at refer-ral. Patients were included if they reported at least 3 years of a stable diagnosis, according to the Diagnostic and Statistical Manual of Mental Disorder Fourth Edition (DSM-IV) criteria [21]. The Structured Clinical interview for DSM-IV was also used to identify the presence of comorbid axis I mental disorders. Exclusion criteria were as follows: a BMI of <14 kg/m2, comorbid schizophre-nia, bipolar I disorder, illiteracy, intellectual disability; severe medical conditions; current use of psychoactive medications, with the exception of antidepressant medication and benzodiazepines.
Of the 273 subjects who met the participation criteria, 250 agreed to participate in the study. In particular, 134 patients were affected by AN [56 with AN-B/P subtype (BP), 78 with AN-restricting subtype (AN-R)] (mean age± SD = 29.8 ± 10.3 years) and 116 by BN (mean age± SD = 30.7 ± 10.8 years). Patients were compared with a group of 119 Caucasian unrelated controls (mean age± SD = 24.4 ± 4.2 years), consecutively recruited through local advertise-ments at the “G. d’Annunzio” University of Chieti-Pescara. The controls were carefully inter-viewed in order to exclude any history of an ED, any actual psychiatric axis I disorder or the presence of a first-degree relative suffering from an ED.
Study design
The study was based on a naturalistic approach. The clinical assessment, as well as the collec-tion of blood samples, was conducted on the first day of admission.
Assessment
The clinical assessment is described more in depth in previous publications from our group [18,
19]. Socio-demographic, psychopathological, and clinical data were collected through a face-to-face interview by two expert psychiatrists (G.C., V.R.). The ED diagnoses were performed using the structured clinical interview for DSM-IV axis I disorders [20]. Eating attitudes and behav-iors were specifically investigated by means of the Eating Disorder Examination Questionnaire (EDE-Q) [22]. Emotional eating defined as “tendency to eating in response to different emo-tions” was assessed by means of the Emotional Eating Scale (EES) [23].
For further characterization of the psychopathological features of the patients, the Beck Depression Inventory (BDI), a widely used and well established measure of current depression level and symptoms [24], the Spielberg’s State-Trait Anxiety Inventory (STAI), to measure lev-els of trait anxiety [25] and the IDentity and EAting disorders (IDEA) questionnaire [26] were administered.
IDEA represents a multidimensional, brief, versatile, easy-to-perform self-reported instru-ment for clinical evaluation, assessing bodily disorders, and of personal identity, specifically associated with the core features of ED psychopathology. The questionnaire consists of 23 items evaluated by a likert scale from (0) “not at all” to (4) “very much”.
The questionnaire provided a total score and four subscales: ‘Feeling oneself only through the gaze of the other and defining oneself only through the evaluation of the other’ (GEO), ‘feeling oneself only through objective measures’ (OM), feeling extraneous from one’s own body’ (EB), and ‘feeling oneself only through starvation’ (S) [26]. Total IDEA scores were cal-culated by averaging participants’ rating across the 23 items. The test showed good test-retest reliability, and internal consistency, both in clinical [26] and general population [27].
The total score of the BDI (ranges from 0 to 63) and STAI (ranges from 20 to 80) were cal-culated by summing up item scores. Instead, EDE-Q and EES total scores were calcal-culated by averaging participants’ rating, respectively.
Genetic analysis
Genomic DNA was isolated from peripheral blood lymphocytes of ED patients and buccal swabs of controls using standard methods. All DNA samples were amplified by Polymerase Chain Reaction (PCR) performed in 25μl reaction volume containing 50 ng of genomic DNA in a AB Applied Biosystem 2720 thermal cycler (Applied System, Foster City, CA), using the KAPA Taq DNA polymerase (Resnova, Genzano, Italy). The amplification products was sub-mitted to: i) direct sequencing procedure using BigDye Term v3.1 CycleSeq Kit (Life Technol-ogies, Monza, Italy) followed by automatic sequencing analysis (ABI PRISM 3130XL) or ii) High Resolution Melting (HRM) using PikoReal™ Real-Time PCR System (Thermo Scientific) according to the manufacturer’s instructions.
Statistical analysis
Clinical variables. Continuous variables were reported as mean± SD, whereas categorical variables were reported as numbers and percentages. The independent sample t test and theχ2
were used for continuous and categorical variables respectively, to compare AN and BN groups.
Genotype analyses. A principle component analysis (PCA), with Varimax rotation, using
genotype as a qualitative variable was performed. PCA applied to genotype data can be used to calculate principal components (PCs) that explain differences among the sample individuals in the genetic data. Based on the presence of each genotype (AA, AT, and TT) for each subject
of the overall sample, theFTO SNP was transformed and coded into three binary variables
(0 = absence of genotype on each subject; 1 = presence of genotype on each subject) named:
AA, AT and TT variables.
According to Kaiser’s criterion [28], PCs with eigenvalues greater than 1 were extracted. Component Plot in rotated space was also provided to a better visual representation of the loadings plotted in a 2-dimensional space. Differences on each of the genotype components indicated by the PCA between patients and healthy control subjects, as well as among AN and BN subgroups and healthy control subjects, were tested using one-way analysis of variance. In addition, correlation analysis among the genotype components indicated by the PCA, IDEA and EES scores, and some socio-demographic variables (age and BMI) was performed.
First of all, genetic analyses were performed considering AN and BN as separate groups, as they may show different genetic components. Considering the well demonstrated instability of DSM diagnostic categories, we further evaluated genotypes on the basis of behavioral and psychopathological features.
The overall association between the ED (AN or BN) and theFTO genotypes (AA, AT, TT),
was tested. Considering the heterogeneity of the adopted models for this SNP in the scientific literature, genotype analyses were performed assuming dominant (TT vs. TA+AA),
co-domi-nant (TT vs. AT vs. AA) and recessive (TT+TA vs. AA) models by means of the χ2 statistics.
We compared genotype distribution separately between ED and healthy controls. Indepen-dent sample t test was performed to evaluate BMI, EDE-Q, total and subscale scores, EES, BDI, and STAI, IDEA total and subscales scores differences in the patients with differentFTO
geno-types. General Linear Models were adopted to test the moderating effects ofFTO genotypes on
the association between IDEA scores and psychopathology. In particular, a first model was tested with Emotional Eating total score as dependent variable (EDs psychopathology) and age, BMI and IDEA scores as covariates. Then, in a second model, we entered IDEA by FTO genotypes(AA, AT, TT) interaction. The Statistical Package for the Social Sciences for
Win-dows SPSS (IBM, 2011) version 20.0 was used for data analysis.
Results
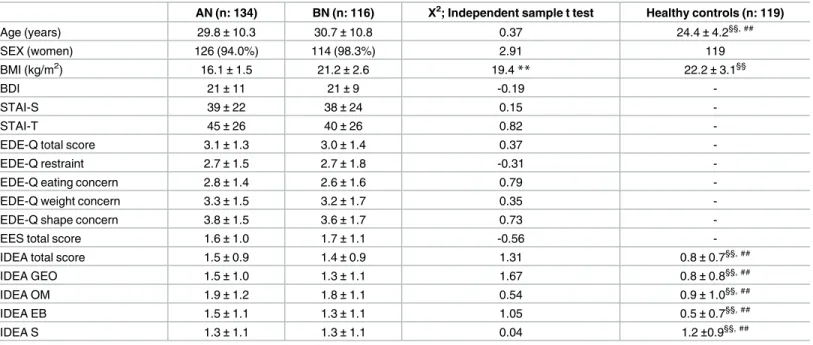
The demographic and clinical characteristics of ED and control groups are reported inTable 1. As expected, AN patients showed a lower BMI as compared with controls as well as with BN
Table 1. General, Psychopathological and Clinical Characteristics of the Eating Disorders groups.
AN (n: 134) BN (n: 116) Χ2; Independent sample t test Healthy controls (n: 119)
Age (years) 29.8±10.3 30.7±10.8 0.37 24.4±4.2§§, ## SEX (women) 126 (94.0%) 114 (98.3%) 2.91 119 BMI (kg/m2) 16.1±1.5 21.2±2.6 19.4** 22.2±3.1§§ BDI 21±11 21±9 -0.19 -STAI-S 39±22 38±24 0.15 -STAI-T 45±26 40±26 0.82
-EDE-Q total score 3.1±1.3 3.0±1.4 0.37
-EDE-Q restraint 2.7±1.5 2.7±1.8 -0.31
-EDE-Q eating concern 2.8±1.4 2.6±1.6 0.79
-EDE-Q weight concern 3.3±1.5 3.2±1.7 0.35
-EDE-Q shape concern 3.8±1.5 3.6±1.7 0.73
-EES total score 1.6±1.0 1.7±1.1 -0.56
-IDEA total score 1.5±0.9 1.4±0.9 1.31 0.8±0.7§§, ##
IDEA GEO 1.5±1.0 1.3±1.1 1.67 0.8±0.8§§, ##
IDEA OM 1.9±1.2 1.8±1.1 0.54 0.9±1.0§§, ##
IDEA EB 1.5±1.1 1.3±1.1 1.05 0.5±0.7§§, ##
IDEA S 1.3±1.1 1.3±1.1 0.04 1.2±0.9§§, ##
Statistics: Data are reported as numbers (percentage), and mean±SD.
Abbreviations: AN, anorexia nervosa; BN, bulimia nervosa; BMI, body mass index; BDI, beck depression inventory; STAI, state/trait anxiety inventory; EDE-Q, Eating Disorder Examination Questionnaire; EES: Emotional Eating Scale; IDEA: Identity and Eating Disorders Questionnaires; GEO: ‘feeling oneself only through the gaze of the other and defining oneself only through the evaluation of the other’; OM: ‘feeling oneself only through objective measures’; EB: ‘feeling extraneous from one’s own body’; S: ‘feeling oneself only through starvation’.
Comparisons between AN and BN patients—**P<0.01. Comparisons between healthy controls and AN patients - §§: p<0.01. Comparisons between healthy controls and BN patients—##: p<0.01.
patients. Patients and controls did not differ in terms of education (mean years of education 12.5± 1.7 vs 12.8 ± 1.4; t = 1.7, p = 0.08). Other comparisons between clinical groups were not significant.
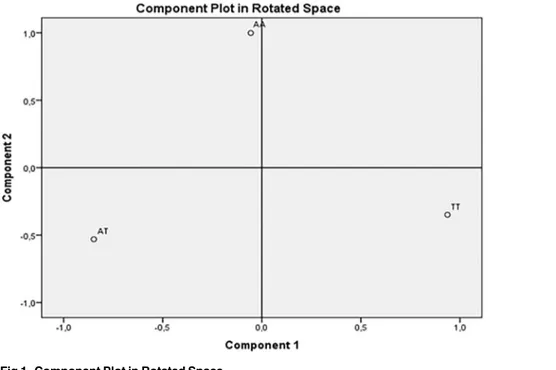
By applying PCA, two orthogonal (not correlated) PC, with eigenvalues greater than 1, best explained our genotypes sample structure. The rotated component matrix showed that the first PC was composed byTT genotype variable, which accounted for 54% of the total variance
(eigen-value = 1.62). The second PC was identified byAA genotype variable, explaining 46% of the total
variance (eigenvalue = 1.38). Differently, theAT genotype variable showed double salient
load-ings on both the components, thus making it not interpretable [29]. Component Plot in rotated space showed how closely related the variables were each other and to the two components. As you can see inFig 1, the two genotype variables were orthogonal:TT genotype variable showed
factor loadings close to 1 on the first component, and close to 0 on the second, whileAA genotype
variable showed loadings close to 0 on the first component, and near 1 on the second. AT geno-type variable had negative and moderate loadings on both the components, thus it resulted to be not easily identifiable in the factor space. Thus, the factor solution that met best the criterion of simple structure as defined by Thurstone [30,31], in order to guarantee easy interpretability of the extracted components and good replicability of the results, included two components:AA
andTT genotype components.
Significant difference (F1, 367= 8.28,p < .01) on AA and TT genotype components between
patients and healthy control subjects was found.
Healthy control subjects (MTT= |.215| MAA= |.237| SDTT =1.079,SDAA= .796) reported
signif-icantly higher means on AA and TT genotype components, compared to patients (MAA= |.102|,
MTT= |.113|; SDTT= .945, SDAA= 1.066). Also, significant differences onTT (F2, 368= 4,21,p <
.05) andAA (F2, 368= 9,99,p < .001) genotype components between AN subgroup, BN subgroup
and healthy control subjects were found. Specifically, onTT genotype component, the Bonferroni
post-hoc revealed that healthy control subjects showed significantly higher mean (M = |.21|, SD = |1.07|) compared to AN subgroup (M = |.12|, SD = |.98|), while no significant differences between
Fig 1. Component Plot in Rotated Space.
BN subgroup mean (M = |.07|, SD = |.89|) versus AN group mean and versus healthy control sub-jects were found. As regardsAA genotype component, BN subgroup showed significantly higher
mean (M = |.32|, SD = |1.14|) compared to AN subgroup (M = |.06|, SD = |.97|) and healthy control subjects (M = |.24|, SD = |.80|).
Summing up, the PCA best explained differences among the sample individuals in the genotype data.
Also, correlations of the two genotype components with IDEA and EES scores, as well as with socio-demographic variables (age and BMI), were tested. Results showed thatTT
geno-type component correlated significantly with IDEA EB (r = -.03, p>.01), while AA genotype
component correlated significantly with IDEA GEO (r = .12, p>.05), IDEA EB (r = .11, p>.05), and EES total score (r = .12, p>.05).
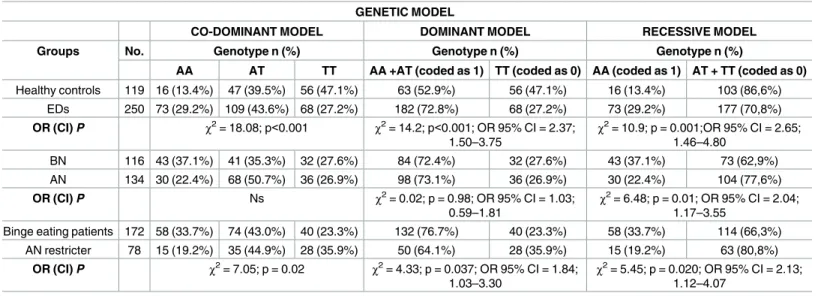
The distribution of genotypes of rs9939609 in controls and EDs patients as a whole sample and according to different categories (AN, BN) are reported inTable 2. A significant difference was detected in terms of genotype distribution between healthy controls and ED patients, beingA-allele carriers (AA and AT genotypes) significantly more frequent in EDs patients
than in healthy controls (72.8% vs 52.9%,Χ2= 14.2; p<0.001).
Odds ratio with 95% CIs were used for dominant model (AA + AT vs. TT) in ED subjects
versus control subjects (OR: 2.37; 95% CI: 1.50–3.75;P = 0.0002).
On the other hand, recessive model showed thatAA genotype allele (AT + TT vs AA) was
more frequent in patients as compared with healthy controls (χ2 = 10.9; p = 0.001; OR 95% CI = 2.65; 1. 46–4.80).
Within the ED patient group, no significant differences in the frequency of theA-allele
were detected between AN and BN (72.4% vs. 73.1%), while recessive model showed a signifi-cant positive association ofAA genotype with BN (χ2 = 6.48; p = 0.011; OR 95% CI = 2.0;
1.17–3.55).
A modest association was found betweenA-allele and binge eating behaviors (BN and AN
binge/purge patients), beingA-allele carriers more frequent among these patients as compared
to ANR patients (76.7% vs. 64.1%,Χ2
= 4.31; p = 0.037). A modest association was found in
Table 2. Distribution of rs9939609 genotypes according to diagnoses, along with relative odds ratios. GENETIC MODEL
CO-DOMINANT MODEL DOMINANT MODEL RECESSIVE MODEL
Groups No. Genotype n (%) Genotype n (%) Genotype n (%)
AA AT TT AA +AT (coded as 1) TT (coded as 0) AA (coded as 1) AT + TT (coded as 0)
Healthy controls 119 16 (13.4%) 47 (39.5%) 56 (47.1%) 63 (52.9%) 56 (47.1%) 16 (13.4%) 103 (86,6%) EDs 250 73 (29.2%) 109 (43.6%) 68 (27.2%) 182 (72.8%) 68 (27.2%) 73 (29.2%) 177 (70,8%) OR (CI) P χ2= 18.08; p<0.001 χ2= 14.2; p<0.001; OR 95% CI = 2.37; 1.50–3.75 χ2= 10.9; p = 0.001;OR 95% CI = 2.65; 1.46–4.80 BN 116 43 (37.1%) 41 (35.3%) 32 (27.6%) 84 (72.4%) 32 (27.6%) 43 (37.1%) 73 (62,9%) AN 134 30 (22.4%) 68 (50.7%) 36 (26.9%) 98 (73.1%) 36 (26.9%) 30 (22.4%) 104 (77,6%) OR (CI) P Ns χ2= 0.02; p = 0.98; OR 95% CI = 1.03; 0.59–1.81 χ2= 6.48; p = 0.01; OR 95% CI = 2.04; 1.17–3.55
Binge eating patients 172 58 (33.7%) 74 (43.0%) 40 (23.3%) 132 (76.7%) 40 (23.3%) 58 (33.7%) 114 (66,3%) AN restricter 78 15 (19.2%) 35 (44.9%) 28 (35.9%) 50 (64.1%) 28 (35.9%) 15 (19.2%) 63 (80,8%)
OR (CI) P χ2= 7.05; p = 0.02 χ2= 4.33; p = 0.037; OR 95% CI = 1.84;
1.03–3.30
χ2= 5.45; p = 0.020; OR 95% CI = 2.13;
1.12–4.07
Legend: Binge eating patients include Bulimia Nervosa and Anorexia Nervosa binge/purge patients. ns: Not statistical significant. Abbreviations: EDs: Eating Disorders; AN: Anorexia Nervosa; BN: Bulimia Nervosa.
recessive model betweenAA genotype and binge eating behaviors (χ2 = 5.45; p = 0.02; OR
95% CI = 2.13; 1.12–4.07).
In the controls, theFTO rs9939609 genotypic frequency did not deviate from
Hardy-Wein-berg equilibrium (HWE) (p = 0.23), whereas a marginal deviation was found in EDs (p = 0.04).
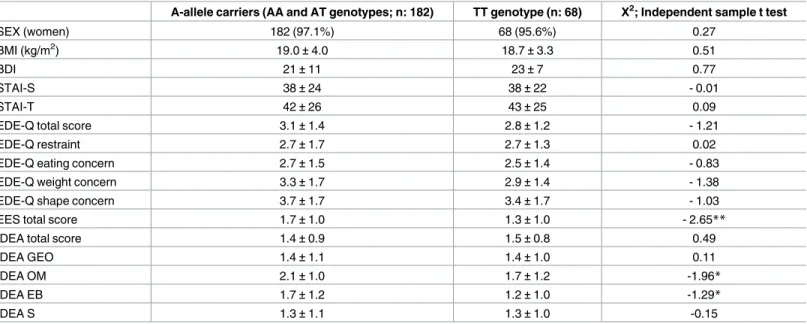
The comparison of clinical variables, in relation to rs9939609 polymorphism, are reported inTable 3.A-allele carriers, as compared to TT genotype carriers, reported significantly higher
emotional eating scores (1.7±1.0 vs. 1.3±1.0, χ2
= -2.65; p<0.01) and IDEA subscale scores, in particular: ‘feeling oneself only through objective measures’ (2.1± 1.0 vs. 1.7 ± 1.2, χ2= -1.96; p<0.05) and ‘feeling extraneous from one’s own body’ (1.7± 1.2 vs. 1.2 ± 1.0, χ2
= -1.29; p<0.05).
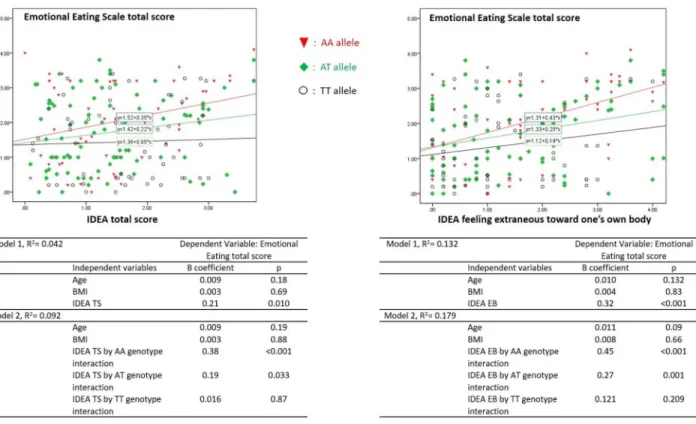
Finally, General Linear Model showed thatFTO genotypes significantly moderated the
association between emotional eating and IDEA scores (Fig 2). A significant effect was added enteringFTO genotype in the model of association between Emotional Eating total score and
IDEA TS (R squared from = 0.04 to 0.09), and IDEA EB (R squared from = 0.13 to 0.18). In particular, the models showed an increasing effect for the interaction according to different genotypes (IDEA TS,AA: p<0.001, AT: p = 0.03, TT: p = 0.87; IDEA EB: AA: p<0.001, AT:
p = 0.001, TT: p = 0.21).
Discussion
In the present study, we evaluated theFTO rs9939609 variant as a risk factor for EDs, because
of its well-known role in controlling energy homeostasis and eating behavior [32]. To the best
Table 3. Comparison of clinical variables according to FTO genotypes.
A-allele carriers (AA and AT genotypes; n: 182) TT genotype (n: 68) Χ2; Independent sample t test
SEX (women) 182 (97.1%) 68 (95.6%) 0.27
BMI (kg/m2) 19.0±4.0 18.7±3.3 0.51
BDI 21±11 23±7 0.77
STAI-S 38±24 38±22 - 0.01
STAI-T 42±26 43±25 0.09
EDE-Q total score 3.1±1.4 2.8±1.2 - 1.21
EDE-Q restraint 2.7±1.7 2.7±1.3 0.02
EDE-Q eating concern 2.7±1.5 2.5±1.4 - 0.83
EDE-Q weight concern 3.3±1.7 2.9±1.4 - 1.38
EDE-Q shape concern 3.7±1.7 3.4±1.7 - 1.03
EES total score 1.7±1.0 1.3±1.0 - 2.65**
IDEA total score 1.4±0.9 1.5±0.8 0.49
IDEA GEO 1.4±1.1 1.4±1.0 0.11
IDEA OM 2.1±1.0 1.7±1.2 -1.96*
IDEA EB 1.7±1.2 1.2±1.0 -1.29*
IDEA S 1.3±1.1 1.3±1.0 -0.15
Statistics: Data are reported as numbers (percentage), and mean±SD.
Abbreviations: AN, anorexia nervosa; BN, bulimia nervosa; BMI, body mass index; BDI, beck depression inventory; STAI, State/Trait anxiety inventory; EDE-Q, Eating Disorder Examination Questionnaire; EES: Emotional Eating Scale; IDEA: Identity and Eating Disorders Questionnaires; GEO: ‘feeling oneself only through the gaze of the other and defining oneself only through the evaluation of the other’; OM: ‘feeling oneself only through objective measures’; EB: ‘feeling extraneous from one’s own body’; S: ‘feeling oneself only through starvation’.
*P<0.05. **P<0.01.
of our knowledge, this is one of the very few studies considering the possible role ofFTO in the
different expression of EDs specific psychopathology [6,12]. In general, our preliminary study showed that
FTO rs9939609 variant represents a putative risk factor for people with high disorder of bodily disorders to develop emotional eating. As extensively reported in the literature, emo-tional eating is a pathological behavior, which accounts for development of obesity and for sev-eral pathological eating behaviors such as binge eating [33,34].
As a first result, in both dominant and recessive models, we found a significant association of rs9939609A-allele with vulnerability to EDs, being this allele more frequent among EDs
patients than in controls. In particular, this association was related to the binge eating behav-ior, present in both AN B/P and BN patients, rather than to the DSM diagnostic category.
Secondly, theA-allele was associated with an increased severity of specific EDs
psychopath-ological features, including emotional eating and disorder of corporeality, and it shows a mod-erating effect between these variables. Many studies have analysed theFTO variants role on
metabolism, but only few studies have explored the association betweenFTO variants and
cerebral activity. Two groups explored howFTO’s putative demethylase action affect complex
human phenotypes [35,36]. Karra et al. [36], using MRI techniques, demonstrated thatFTO
genotype modulates the neural responses to food cues and modifies the responsivity to ghrelin levels in the fasted state in normal-weight volunteers. These findings provide a possible expla-nation to the link between theA-risk allele and obesity predisposition through the regulation
of the reward and appetite regions. Hess et al. [35] demonstrated the tissue- or even cell-type-specific role ofFTO by regulating mRNA subsets relevant to the physiological function of the
Fig 2. Relationship between IDEA scores and Emotional Eating in Eating Disorders patients (n: 250): moderating effect of FTO genotypes. Statistics: Tables report General Linear Models FTO by IDEA interaction. The first models tested the effects of IDEA scores on
Emotional Eating, entering age, and BMI. In the second step FTO genotype interaction was added. Tables showed the increasing effect of different FTO genotypes (AA, AT, TT).
tissue. This study described a potential role of FTO to influence food intake by altering D2 receptor-dependent feeding behaviour [35].
In a behavioral and fMRI study, Sevgi et al. [37] demonstrated that variants of theFTO gene
affect dopamine (D2)-dependent mesocorticolimbic-prefrontal responses that may influence reward learning and behavioral responses associated with learning from negative outcome in humans. In addition, Olivo et al. [38] studied the interaction between genetics, neural patterns, and behavioral measures in determining the obesity risk. The authors suggested that theAA
carriers show neural connectivity patterns that might more closely influence the sensitivity toward punishment and reward. In turn, social and environmental factors acting on this neu-ral substrate might increase the susceptibility to obesity.
Moreover, a recent study demonstrated howAA and TT genotype are associated with
dif-ferential neural processing of food images of different caloric content: in fact, theAA genotype
had increased brain activity specifically in areas important for emotion (cingulate gyrus), memory, and self-image (cuneus and precuneus) and reward (putamen) compared with the
TT genotype [39].
Different mechanisms for explainingFTO’s role in the association with ED susceptibility
can be proposed. A possible role in energy homeostasis is supported by studies performed on humans, mice and rodents that have suggested thatFTO non coding variants could affect
hypothalamic mRNA expression, in turn able to regulate food intake, circulating glucose lev-els, weight status and energy expenditure [7,40].
Despite all these emerging data, a study by Smemo et al. [9] pursued functional interactions between obesity-linked SNPs and neighbouring genes. In fact, the authors demonstrated, for the first time, an association between intronic variance withinFTO and IRX3 expression,
sug-gesting a broader role forFTO beyond that of regulating fat mass [9]. The promoter ofIRX3
directly binds to an enhancer sequence within the firstFTO intron. The IRX3 role in the
regu-lation of body mass and composition is shown by a reduction in body weight of 25 to 30% in Irx3-deficient mice, through increase in basal metabolic rate with browning of white adipose tissue. In addition, hypothalamus-specific dominant-negative form of Irx3 mice reproduces the metabolic phenotype of Irx3-deficient mice [9].
Therefore,FTO variants may represent a risk factor for overweight condition, in turn
con-sidered a frequent antecedent of both AN and BN patients [22]. Accordingly, previous studies indicated an association of the rs9939609 riskA-allele with increased energy intake and
decreased satiety [11]. According to Mu¨ller et al., [6], it can be suggested that the observed association ofFTO with EDs might be independent from the elevating effect of this variant on
BMI, and that both a weight-elevating effect of the riskA-allele and a modulation of eating
behavior and satiety accounts for the observed associations.
The association of theA-allele at rs9939609 with AN was already observed by Muller et al.
[6]. Furthermore, Boraska et al. [41] performed a genome-wide association scan (GWAS) of anorexia nervosa. When the authors compared 76 variants (53 independent) from the AN results with 89 established BMI/obesity SNPs,FTO variant and other 4 SNPs (inside other
genes) had P<0.05 (binomial P = 0.1906). Twenty-six of the 53 SNPs had the same direction of effect in AN and BMI/obesity (binomial P = 1) and 3 variants includedFTO had P<0.05
(binomial P value = 0.0084), indicating modest enrichment of nominally associated SNP from extreme obesity in their discovery dataset [41]. More recently, through cross-trait analysis of the 1000 SNPs and functional ex vivo studies, Hinney et al [42] identified three genetic loci involved in both anorexia nervosa risk and variation of BMI. None of the nine SNPs located in these loci have previously been associated to either AN or BMI/obesity or other psychiatric dis-orders. However, no SNPs inFTO gene reached genome-wide significance in data.
Of particular interest is the association between theA-allele and the endophenotypes of
EDs. Interest in endophenotypes has been stimulated by the difficulties encountered in estab-lishing specific genetic causes for complex disorders by classical linkage or association designs. In this context, the concept of endophenotype may be of relevant value in order to bridge the gap between the genotype and the phenotype, through the deconstruction of the clinical phe-notype into variables hypothetically more proximal to genetic effects.
In this view, we attempted to overcome the behavioral level of the EDs psychopathology, characterized by diagnostic instability [14,43], by considering more stable quantitative traits, such as emotional eating and disorders of corporeality, as candidate phenotypes relevant to EDs pathology [44,45].
Emotional Eating (EE)–defined as tendency to eat in response to a range of negative emo-tions such as anxiety, depression, anger and loneliness, to cope with negative affect—has been identified as a possible factor triggering binge eating in BN [23,46] and binge eating disorder [47]. A second candidate endophenotype for EDs investigated in this study was represented by the bodily disorders [26,27,48]. Pathological concerns about body shape and weight are considered as secondary epiphenomena to a more profound pathological core [17,43]. ED patients complain about their being alienated from their own body and emotions, and experi-ence body as an object that is looked at and judged by other subjects [26]. Especially, feeling extraneous from one’s own body may feature as a possible factor for abnormal eating patterns via emotional dysregulation and/or the dysregulation of bodily-mediated satiety responsive-ness. According to this model, the cenesthetic apprehension of one’s own body is the more primitive and basic form of self-awareness, and patients with EDs often report–with different extents of insight–their difficulties in perceiving their emotions and that they do not “feel” themselves [27]. In this study, we found a significant association between emotional eating and the IDEA subscale measuring feeling extraneous from one’s own body. Moreover, we found that theA-allele of the rs9939609 represented a moderator of the association between
emotional eating and disorder of corporeality and identity measured by IDEA. Therefore, our findings suggest bodily disorders in the individuals with the A-allele, is more likely to favor emotional eating as well as binge eating phenomena.
Overall, the results confirm the importance of a fine-tuned characterization of the EDs psy-chopathology based on qualitative and subjective rather than quantitative measures.
However, the present study has the limitation of the sample pool size being relatively small. Future studies with a larger sample size are required. It should be noted that due to our small sample size, we possibly overestimated the odds ratio of the minor allele.
Finally, the information regarding the population of patients seeking treatment cannot be generalized to all people presenting pathological eating behaviors. It is possible that some aspects of the described clinical features are state-dependent. However, it is important to note that recent observations in clinical [14,17] and general population [27] confirmed that disor-ders of corporeality related with EDs are more stable across time as compared to DSM diagno-ses, which are typically prone to the so called diagnostic crossover [13]. Indeed, the clear association ofFTO genotypes with measures of disorders of corporeality rather than with
DSM diagnoses confirmed the hypothesis that they can represent stable trait of EDs. In addi-tion, the SNP diverts from equilibrium of these subjects: this would be consistent with the association results of binge eating traits.
Furthermore, it should be remembered that the patients were included if they reported at least 3 years of a stable diagnosis. This may explain in part the lack of age matching in between cases and controls (there were significantly younger in the control group).
Author Contributions
Conceptualization: LS GS VR. Data curation: MF GC MM. Formal analysis: GC MF. Funding acquisition: LS. Investigation: MF SB. Methodology: VR LS GS. Project administration: LS GS. Resources: IA. Software: GC MB. Supervision: LS GS VR. Validation: SS. Visualization: IA BN LL.Writing – original draft: GC MF. Writing – review & editing: GC MF LS.
References
1. American Psychiatric Association. Diagnostic and statistical manual of mental disorders, 5th edition. Washington, DC: American Psychiatric Association; 2013.
2. Steiger H, Richardson J, Schmitz N, Joober R, Israel M, Bruce KR, et al. Association of trait-defined, eating-disorder sub-phenotypes with (biallelic and triallelic) 5HTTLPR variations. J Psychiatr Res. 2009; 43:1086–94. doi:10.1016/j.jpsychires.2009.03.009PMID:19383563
3. Hinney A, Volckmar AL. Genetics of eating disorders. Curr Psychiatry Rep. 2013; 15:423. doi:10.1007/ s11920-013-0423-yPMID:24202964
4. Hunt SC, Stone S, Xin Y, Scherer CA, Magness CL, Ladonato SP, et al. Association of the FTO gene with BMI. Obesity (Silver Spring). 2008; 16: 902–904.
5. Peng S, Zhu Y, Xu F, Ren X, Li X, Lai M. FTO gene polymorphisms and obesity risk: a meta-analysis. BMC Med. 2011; 9:71. doi:10.1186/1741-7015-9-71PMID:21651756
6. Mu¨ller TD, Greene BH, Bellodi L, Cavallini MC, Cellini E, Di Bella D, et al. Fat mass and obesity-associ-ated gene (FTO) in eating disorders: evidence for association of the rs9939609 obesity risk allele with bulimia nervosa and anorexia nervosa. Obes Facts. 2012; 5:408–19. doi:10.1159/000340057PMID:
22797368
7. Gerken T, Girard CA, Tung YC, Webby CJ, Saudek V, Hewitson KS, et al. The obesity-associated FTO gene encodes a 2-oxoglutarate-dependent nucleic acid demethylase. Science. 2007; 318:1469–1472. doi:10.1126/science.1151710PMID:17991826
8. Claussnitzer M, Dankel SN, Quon G, Meuleman W, Haugen C, Glunk V et al. FTO Obesity Variant Cir-cuitry and Adipocyte Browning in Humans. N Engl J Med. 2015; 373:895–907. doi:10.1056/
NEJMoa1502214PMID:26287746
9. Smemo S, Tena JJ, Kim KH, Gamazon ER, Sakabe NJ, Go´mez-Marı´n C et al. Obesity-associated vari-ants within FTO form long-range functional connections with IRX3. Nature. 2014; 507:371–5. doi:10. 1038/nature13138PMID:24646999
10. Tanofsky-Kraff M, Han JC, Anandalingam K, Shomaker LB, Columbo KM, Wolkoff LE, et al. The FTO gene rs9939609 obesity-risk allele and loss of control over eating. Am J Clin Nutr. 2009; 90:1483–8. doi:10.3945/ajcn.2009.28439PMID:19828706
11. Wardle J, Carnell S, Haworth CM, Farooqi IS, O’Rahilly S, Plomin R. Obesity associated genetic varia-tion in FTO is associated with diminished satiety. J Clin Endocrinol Metab. 2008; 93:3640–3643. doi:
12. Jonassaint CR, Szatkiewicz JP, Bulik CM, Thornton LM, Bloss C, Berrettini WH, et al. Absence of asso-ciation between specific common variants of the obesity-related FTO gene and psychological and behavioral eating disorder phenotypes. Am J Med Genet B Neuropsychiatr Genet. 2011; 156B: 454– 61. doi:10.1002/ajmg.b.31182PMID:21438147
13. Tozzi F, Thornton LM, Klump KL, Fichter MM, Halmi KA, Kaplan AS et al. Symptom fluctuation in eating disorders: correlates of diagnostic crossover. Am J Psychiatry. 2005; 162:732–40. doi:10.1176/appi. ajp.162.4.732PMID:15800146
14. Castellini G, Lo Sauro C, Mannucci E, Ravaldi C, Rotella CM, Faravelli C, Ricca V. Diagnostic crossover and outcome predictors in eating disorders according to DSM-IV and DSM-V proposed criteria: a 6-year follow-up study. Psychosom Med. 2011; 73:3270–9.
15. Milos GF, Baur V, Muehlebach S, Spindler A. Axis-I comorbidity is linked to prospective instability of diagnoses within eating disorders. BMC Psychiatry. 2013; 7:295.
16. Fairburn CG, Harrison PJ. Eating disorders. Lancet. 2003; 361:407–16. doi:10.1016/S0140-6736(03) 12378-1PMID:12573387
17. Bardone-Cone AM, Harney MB, Maldonado CR, Lawson MA, Robinson DP, Smith R, Tosh A. Defining recovery from an eating disorder: Conceptualization, validation, and examination of psychosocial func-tioning and psychiatric comorbidity. Behav Res Ther. 2010; 48: 194–202. doi:10.1016/j.brat.2009.11. 001PMID:19945094
18. Castellini G, Ricca V, Lelli L, Bagnoli S, Lucenteforte E, Faravelli C et al. Association between serotonin transporter gene polymorphism and eating disorders outcome: a 6-year follow-up study. Am J Med Genet B Neuropsychiatr Genet. 2012; 159B: 491–500. doi:10.1002/ajmg.b.32052PMID:22488946 19. Cellini E, Castellini G, Ricca V, Bagnoli S, Tedde A, Rotella CM, et al. Glucocorticoid receptor gene
polymorphisms in Italian patients with eating disorders and obesity. Psychiatr Genet. 2010; 20:282–8. doi:10.1097/YPG.0b013e32833a2142PMID:20440229
20. First MB, Spitzer MB, Gibbon M, Williams JBW. Structured clinical interview for DSM-IV Axis I disorders patient edition (SCID-I/P version 2.0), New York: Biometrics Research Department, New York State Psychiatric Institute; 1995.
21. American Psychiatric Association. Diagnostic and statistical manual of mental disorders, fourth ed. (revised). Washington, DC: American Psychiatric Association; 1994.
22. Fairburn CG, Beglin SJ. Assessment of eating disorders: interview or self-report questionnaire? Int J Eat Disord. 1994; 16:363–70. PMID:7866415
23. Arnow B, Kenardy J, Agras WS. The Emotional Eating Scale: the development of a measure to assess coping with negative affect by eating. Int J Eat Disord. 1995; 18:79–90. PMID:7670446
24. Beck AT, Ward CH, Mendelson M, Mock J, Erbaugh J. An inventory for measuring depression. Arch Gen Psychiatry. 1961; 4:561–71. PMID:13688369
25. Spielberg CD, Gorsuch RL, Lushene RE. Manual for the state-trait anxiety inventory (self-evaluation questionnaire), Palo Alto, CA: Consulting Psychologists Press. 1970.
26. Stanghellini G, Castellini G, Brogna P, Faravelli C, Ricca V. Identity and eating disorders (IDEA): a questionnaire evaluating identity and embodiment in eating disorder patients. Psychopathology. 2012; 45:147–58. doi:10.1159/000330258PMID:22398386
27. Stanghellini G, Trisolini F, Castellini G, Ambrosini A, Faravelli C, Ricca V. Is feeling extraneous from one’s own body a core vulnerability feature in eating disorders? Psychopathology. 2015; 48:18–24. doi:
10.1159/000364882PMID:25341960
28. Kaiser H.F. The application of electronic computers to factor analysis. Educational and Psychological Measurement. 1960; 20: 141–151.
29. Kline P. An easy guide to factor analysis. New York, NY: Routledge 1994.
30. Thurstone L.L. Multiple-factor analysis. Chicago: Univ. Chicago Press 1947.
31. Cattell R.B. The scientific use of factor analysis in behavioral and life sciences. New York: Plenum 1978.
32. Frayling TM, Timpson NJ, Weedon MN, Zeggini E, Freathy RM, Lindgren CM, et al. A common variant in the FTO gene is associated with body mass index and predisposes to childhood and adult obesity. Science. 2007; 316: 889–894. doi:10.1126/science.1141634PMID:17434869
33. Ricca V, Castellini G, Lo Sauro C, Ravaldi C, Lapi F, Mannucci E, Rotella CM, Faravelli C. Correlations between binge eating and emotional eating in a sample of overweight subjects. Appetite. 2009; 53: 418–21. doi:10.1016/j.appet.2009.07.008PMID:19619594
34. Fioravanti G, Castellini G, Lo Sauro C, Ianni S, Montanelli L, Rotella F, Faravelli C, Ricca V. Course and moderators of emotional eating in anorectic and bulimic patients: a follow-up study. Eat Behav. 2014; 15:192–6. doi:10.1016/j.eatbeh.2014.01.006PMID:24854803
35. Hess ME, Hess S, Meyer KD, Verhagen LA, Koch L, Bro¨nneke HS, et al. The fat mass and obesity associated gene (Fto) regulates activity of the dopaminergic midbrain circuitry. Nat. Neurosci. 2013; 16: 1042–1048. doi:10.1038/nn.3449PMID:23817550
36. Karra E, O’Daly OG, Choudhury AI, Yousseif A, Millership S, Neary MT, et al. A link between FTO, ghre-lin, and impaired brain food-cue responsivity. J Clin Invest. 2013; 123:3539–51. doi:10.1172/JCI44403
PMID:23867619
37. Sevgi M, Rigoux L, Ku¨hn AB, Mauer J, Schilbach L, Hess ME, et al. An Obesity-Predisposing Variant of the FTO Gene Regulates D2R-Dependent Reward Learning. J Neurosci. 2015; 35:12584–92.
38. Olivo G, Wiemerslage L, Nilsson EK, Solstrand Dahlberg L, Larsen AL, Olaya Bu´caro M, et al. Resting-State Brain and the FTO Obesity Risk Allele: Default Mode, Sensorimotor, and Salience Network Con-nectivity Underlying Different Somatosensory Integration and Reward Processing between Genotypes. Front Hum Neurosci. 2016; 10:52. doi:10.3389/fnhum.2016.00052PMID:26924971
39. Wiemerslage L, Nilsson EK, Solstrand Dahlberg L, Ence-Eriksson F, Castillo S, Larsen AL, Bylund SB, et al. An obesity-associated risk allele within the FTO gene affects human brain activity for areas impor-tant for emotion, impulse control and reward in response to food images. Eur J Neurosci. 2016; 43:1173–80. doi:10.1111/ejn.13177PMID:26797854
40. Poritsanos NJ, Lew PS, Fischer J, Mobbs CV, Nagy JI, Wong D, et al. Impaired hypothalamic Fto expression in response to fasting and glucose in obese mice. Nutr. Diabetes. 2011; 1:e19. doi:10. 1038/nutd.2011.15PMID:23154321
41. Boraska V, Franklin CS, Floyd JA, Thornton LM, Huckins LM, Southam L, Rayner NW, Tachmazidou I, Klump KL, Treasure J et al. A genome-wide association study of anorexia nervosa. Mol Psychiatry. 2014; 19:1085–94. doi:10.1038/mp.2013.187PMID:24514567
42. Hinney A, Kesselmeier M, Jall S, Volckmar AL, Fo¨cker M, Antel J, et al. Evidence for three genetic loci involved in both anorexia nervosa risk and variation of body mass index. Mol Psychiatry. 2016.
43. Peterson CB, Crow SJ, Swanson SA, Crosby RD, Wonderlich SA, Mitchell JE, et al. Examining the sta-bility of DSM-IV and empirically derived eating disorder classification: implications for DSM-5. J Consult Clin Psychol. 2011; 79:777–783. doi:10.1037/a0025941PMID:22040286
44. Keski-Rahkonen A, Neale BM, Bulik CM, Pietila¨inen KH, Rose RJ, Kaprio J, Rissanen A. Intentional weight loss in young adults: sex-specific genetic and environmental effects. Obes Res. 2005; 13:745– 53. doi:10.1038/oby.2005.84PMID:15897484
45. Wade TD, Bulik CM. Shared genetic and environmental risk factors between undue influence of body shape and weight on self-evaluation and dimensions of perfectionism. Psychol Med. 2007; 37:635–44. doi:10.1017/S0033291706009603PMID:17176504
46. Castellini G, Mannucci E, Lo Sauro C, Benni L, Lazzeretti L, Ravaldi C, et al. Different moderators of cognitive-behavioral therapy on subjective and objective binge eating in bulimia nervosa and binge eat-ing disorder: a three-year follow-up study. Psychother Psychosom. 2012; 81:11–20. doi:10.1159/ 000329358PMID:22116257
47. Mond JM, Peterson CB, Hay PJ. Prior use of extreme weight-control behaviors in a community sample of women with binge eating disorder or subthreshold binge eating disorder: a descriptive study. Int J Eat Disord. 2010; 43:440–6. doi:10.1002/eat.20707PMID:19551718
48. Castellini G, Stanghellini G, Godini L, Lucchese M, Trisolini F, Ricca V. Abnormal Bodily Experiences Mediate the Relationship between Impulsivity and Binge Eating in Overweight Subjects Seeking Bariat-ric Surgery. Psychother Psychosom. 2015; 84:124–126. doi:10.1159/000365765PMID:25720444