UNIVERSITÀ DEGLI STUDI DI
CASSINO E DEL LAZIO MERIDIONALE
Corso di Dottorato in
Metodi, modelli e tecnologie per l’ingegneria
Curriculum Ingegneria dell’informazione
Ciclo XXXII
A Learning Sensors Platform for Health and Safety Applications
SSD:
ING-INF/05Coordinatore del Corso
Chiar.ma Prof.ssa Wilma Polini Dottorando Marco Ferdinandi
Supervisori
Chiar.mo Prof. Luigi Ferrigno Chiar.mo Prof. Mario Molinara
Declaration
I hereby declare that except where specific reference is made to the work of others, the contents of this dissertation are original and have not been submitted in whole or in part for consideration for any other degree or qualification in this, or any other university. This dissertation is my own work and contains nothing which is the outcome of work done in collaboration with others, except as specified in the text and Acknowledgements.
Marco Ferdinandi February 2020
Acknowledgements
I would like to express my special appreciation and thanks to my supervisors Professor Mario Molinara and Professor Luigi Ferrigno helping and supporting me from both scientific and personal points of view. A special thank is also for Roberto Simmarano, President and CEO of Sensichips s.r.l. for which I was employed as an apprentice for research during my doctorate, who acted as a company supervisor for the conducted research activities. Thank you all, academic and company supervisors, for encouraging my activities and for allowing me to grow as a research scientist. I am very grateful to the entire computer and artificial intelligence as well as the electric and electronic measurements research groups of the University of Cassino and Southern Lazio for letting me to work in a very familiar environment. A great acknowledgment and thankfulness is for ENEA Portici research center and, in particular, Dr. Ettore Massera for the precious scientific support in some of my Ph.D. thesis activities and for giving me access to the laboratory and research facilities. A special thank is also for Gianni Cerro, Ph.D. for his technical and personal support and for the rest of my fellow labmates sharing stimulating discussions, late evenings working on deadlines and for all the fun. Last but not the least, I would like to thank my parents, my sister and my girlfriend for personally supporting me during these 3 years.
Abstract
Nowadays, people and environment health and safety are increasingly threatened by human activities. Industrial processes, or more in general, air and water contamination are worsening the planet life conditions. Increasing people awareness and improving the regulation system play a key role to face and tackle this global phenomenon. To this aim, reliable and low– cost technologies for a pervasive and ubiquitous environmental monitoring are really needed, especially for developing and poorer countries. This Ph.D. thesis has been focused on the development of the SENSIPLUS Embedded System for health and safety applications. It has been designed considering low–cost, miniaturization and low–power as main requirements for the whole developing and experimental phases. More in detail, it is designed according to Internet of Things and Edge Computing paradigms, integrating sensing, elaboration and communication capabilities. Sensing is mainly based on the SENSIPLUS chip, which is a micro analytical tool integrating heterogeneous sensors typologies. As for the elaboration and communication, embedded software based on statistical and artificial intelligence solutions is adopted for data analysis and technologies as Wi–Fi, USB and Bluetooth Low Energy have been integrated to transmit processing results. The embedded software has been tested on low–resources Micro Controller Units as the ESP32, STM32 and CC2541 manufactured by Espressif, STMicroelectronics and Texas Instrument, respectively. Three different applications have been addressed in this thesis: state of health monitoring of activated carbon filters and biofilters; contaminants detection and recognition in air; contaminants detection and recognition in water. Both the hardware and software components have been developed and customized for these three applications and real scenarios experimental activities have been conducted to test and validate the proposed solutions. Positive results have been obtained providing the validation of the developed technology for the addressed applications. The activities carried out for this thesis have different European research projects (Horizon 2020 and European Defence Agency) as background and reference. Furthermore, multiple collaborations with public and private research centers have characterized the design, developing and experimental activities.
Table of contents
Abstract ix
List of figures xv
List of tables xix
Introduction 1
1 SENSIPLUS Embedded System 5
1.1 Overview . . . 5
1.2 SENSIPLUS chip . . . 6
1.3 SENSIPLUS Deep Machine . . . 7
1.3.1 SDM architecture . . . 8
1.3.2 Configurations . . . 9
1.4 SDM Hardware Layer . . . 10
1.4.1 Bluetooth Low Energy board based on CC2541 . . . 10
1.4.2 Wi-Fi and USB Board based on ESP8266 and STM32L0 MCUs . . . 11
1.4.3 Smart-Cable Board based on SP RUN5 . . . 11
1.5 SDM Software Layer . . . 12
1.5.1 SENSIPLUS API . . . 12
1.5.2 Developed Applications . . . 14
2 State of Health Monitoring of Activated Carbon Filters and Biofilters 17 2.1 Introduction . . . 17
2.2 State of the Art . . . 18
2.3 Developed prototypes . . . 20
2.3.1 Prototype based on BLE board . . . 20
2.3.2 Prototype based on the USB and Wi-Fi board . . . 20
xii Table of contents
2.4.1 Repeatability comparison between reference instrument and DUT . . 26
2.4.2 DUT linearity analysis . . . 27
2.4.3 Measuring error evaluation . . . 27
2.5 Experimental campaign on real scenario for ACF . . . 30
2.5.1 Measurement setup and procedure . . . 30
2.5.2 Obtained results . . . 31
2.5.3 Equivalent circuit modeling . . . 33
2.5.4 Preliminary prototype for RLI method . . . 35
2.6 Experimental campaign on real scenario for Biofilters . . . 36
2.6.1 Test with reference instrument . . . 36
2.6.2 Test with SP system . . . 36
2.7 Conclusion . . . 40
3 Detection and recognition of indoor air contaminants 43 3.1 Introduction . . . 43
3.2 State of the Art . . . 44
3.3 Data acquisition . . . 45
3.3.1 Experimental measurement setup . . . 45
3.3.2 Measurement Procedure . . . 47
3.4 Data pre–processing . . . 48
3.5 Data analysis . . . 48
3.5.1 Multi Layer Peceptron . . . 49
3.5.2 Convolutional Neural Network . . . 50
3.5.3 Long Short Term Memory neural network . . . 50
3.5.4 Network training strategy . . . 51
3.6 Results . . . 52
3.6.1 Collected dataset . . . 52
3.6.2 Classification results . . . 55
3.7 Computational analysis of MLP and CNN . . . 58
3.8 Embedded implementation of MLP . . . 59
3.9 Conclusion . . . 60
4 Detection and Recognition of contaminants in Water 61 4.1 Introduction . . . 61
4.2 State of the Art . . . 62
4.3 Data acquisition for water monitoring . . . 63
Table of contents xiii
4.3.2 Electrochemical Impedance Spectroscopy (EIS) experiments . . . 64
4.3.3 Differential Pulse Voltammetry (DPV) experiments . . . 65
4.4 Data Pre-processing . . . 67
4.5 Data analysis for EIS dataset . . . 68
4.5.1 MLP architectures . . . 69
4.5.2 Computational Analysis . . . 69
4.5.3 Network training . . . 70
4.6 Data Analysis for DPV dataset . . . 71
4.7 Results for EIS dataset . . . 71
4.8 Results for DPV dataset . . . 74
4.9 Conclusion . . . 75
Conclusions 77
List of figures
1.1 SENSIPLUS Embedded System . . . 5
1.2 SENSIPLUS logical architecture . . . 6
1.3 SDM logical diagram . . . 7
1.4 SDM software architecture . . . 8
1.5 SDM node architecture . . . 9
1.6 BLE board prototype . . . 10
1.7 USB and Wi-Fi board prototype . . . 11
1.8 Smart Cable board prototype . . . 12
1.9 SENSIPLUS API Architecture . . . 13
1.10 Personal Hazards Monitor (PHM) GUI . . . 14
1.11 Sensiplus Winux GUI . . . 15
2.1 Measurement setup adopted for the feasibility demonstration . . . 21
2.2 Some pictures of a sensorized (BLE board) ACF running a first (very simple) version of the RLI estimation algorithm. . . 21
2.3 Diagram of the operating phases designed for the ACFs monitoring. . . 23
2.4 Experimental laboratory setup for metrological characterization . . . 24
2.5 Calibration curves (for impedance module and phase) obtained for 13 kHz frequency. . . 28
2.6 Calibration curves (for impedance module and phase) obtained for 20 kHz frequency. . . 28
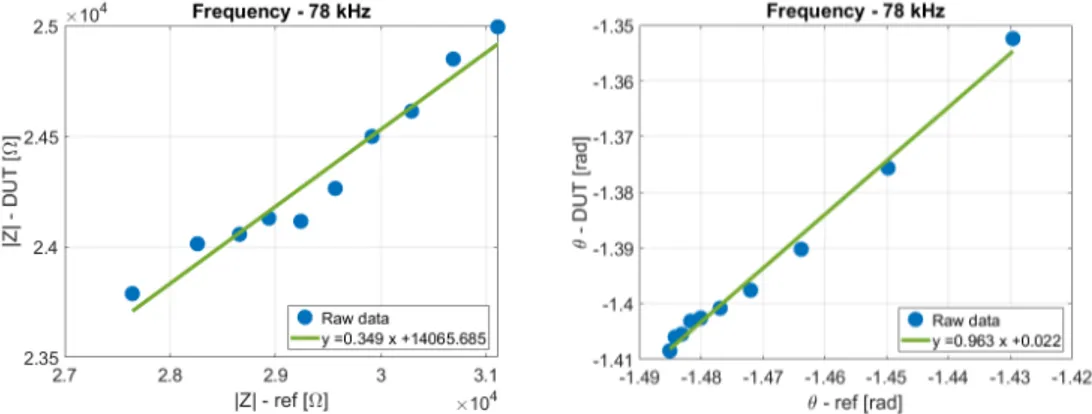
2.7 Calibration curves (for impedance module and phase) obtained for 78 kHz frequency. . . 28
2.8 Impedance module and phase errors percentages after correction . . . 29
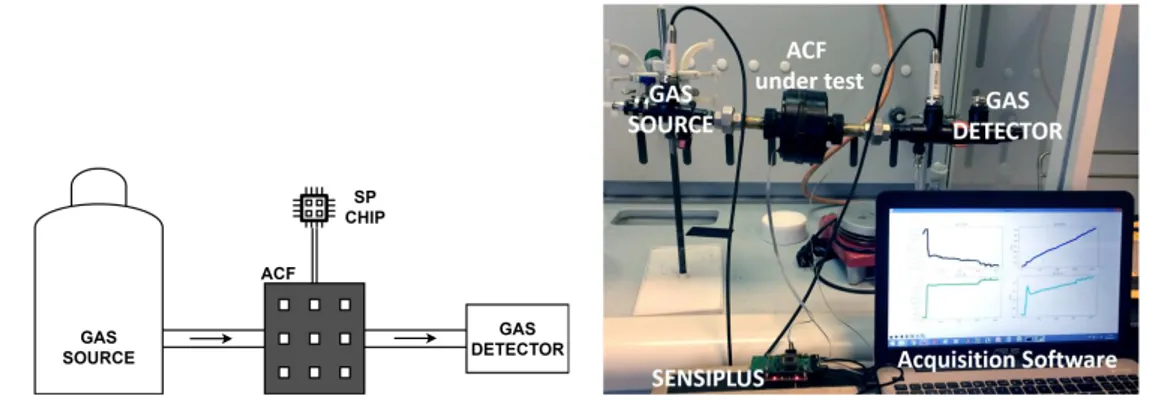
2.9 Experimental measurement setup adopted for real scenario measurements. A logical representation with main involved elements is reported on the left while a picture of the real laboratory setup is provided on the right . . . 31
xvi List of figures
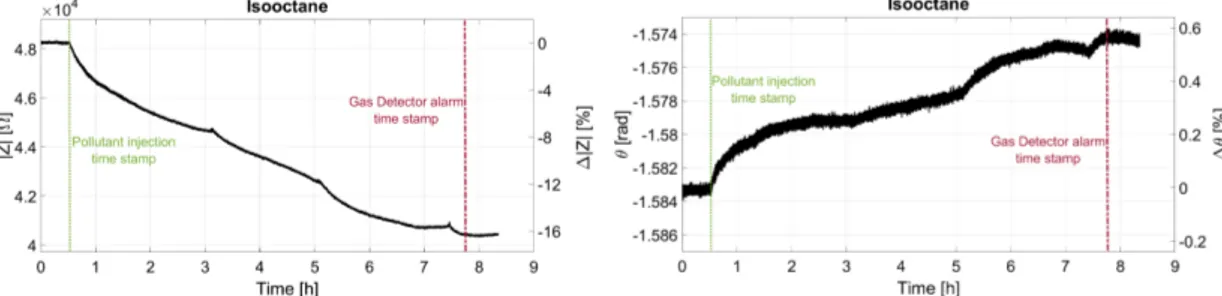
2.11 Impedance module and phase during isooctane injection . . . 33
2.12 Impedance module and phase during ethanol injection . . . 33
2.13 Impedance module and phase during chlorine injection . . . 33
2.14 Impedance module and phase during mek injection . . . 33
2.15 Activated Carbon Filter equivalent circuit . . . 34
2.16 Resistance and Capacitance values evaluated according to the parallel equiva-lent circuit during ethanol injection. . . 34
2.17 Resistance and Capacitance values evaluated according to the parallel equiva-lent circuit during isooctane injection. . . 35
2.18 Measurements performed with reference LCR meter with 2 different bacteria concentrations. a) Resistance values; b) Capacitance values . . . 37
2.19 Dispersion index values: a) Resistance; b) Capacitance . . . 37
2.20 Electrode used as sensors for impedance measurements in soil mixture . . . . 38
2.21 Setup for impedance measurements with electrodes immersed in biofilter soil without bacteria . . . 38
2.22 Resistance and capacitance values obtained with 3 different SP chips and electrodes on the same soil. . . 38
2.23 Resistance and capacitance values obtained for 3 different soil and relative humidity. . . 39
2.24 Measurement setup adopted for data acquisition with 3 SP chips on the same soil for different concentrations. . . 40
2.25 Resistance and capacitance values acquired for the 3 different bacteria concen-trations. . . 40
3.1 Experimental measurement setup for data acquisition . . . 46
3.2 MLP3architecture . . . 49
3.3 Convolutional Neural Network architecture . . . 50
3.4 Long Short Term Memory architecture . . . 51
3.5 Normalized ONCHIP_ALUMINUM_OXIDE sensor responses to contaminants 52 3.6 Normalized OFFCHIP_HUMIDITY sensor responses to contaminants . . . . 53
3.7 Normalized OFFCHIP_GRAPHENE sensor responses to contaminants . . . 53
3.8 EMA filtering and normalization examples. a) Raw sensor response and its EMA filtered version. b) Normalization computer on measurements shown in a. 54 3.9 Responses to contaminants acquired with the ONCHIP_ALUMINUM_OXIDE sensor. Substances order: acetone, air, alcohol, ammonia, bleach and water. . 54
3.10 Responses to contaminants acquired with the OFFCHIP_HUMIDITY sensor. Substances order: acetone, air, alcohol, ammonia, bleach and water. . . 55
List of figures xvii
3.11 Responses to contaminants acquired with the OFFCHIP_GRAPHENE sensor.
Substances order: acetone, air, alcohol, ammonia, bleach and water. . . 55
3.12 Confusion matrices obtained with MLP (a), CNN (b) and LSTM (c). . . 57
3.13 Confusion matrices obtained for MLP (a), CNN (b) and LSTM (c) unifying acetone and alcohol as acet–alc class. . . 58
4.1 Experimental measurement setup . . . 64
4.2 Equivalent electrical circuit adopted for the gold and copper IDEs . . . 65
4.3 General representation of Differential Pulse Voltammetry waveform . . . 66
4.4 Raw dataset projected on the first 3 PCs. . . 68
4.5 Loadings coefficients used for the PCA transformation . . . 68
4.6 MLP architecture with 8 (feature vector) and 3 (principal components) input and 6 output neurons . . . 69
4.7 DPV Dataset projected through LDA . . . 71
4.8 Dispersion Index evaluated for the 6 ANN architectures . . . 72
4.9 Confusion matrices obtained with MLP architectures . . . 73
4.10 DPV cycles for the adopted substances . . . 74
List of tables
2.1 Selected parameters and estimated lifetime for two specific applications . . . 23
2.2 Discrete components values . . . 25
2.3 Worst case Standard deviation values (worst case) evaluated for reference instrument (REF) and DUT . . . 26
2.4 NLE evaluated with respect the reference instrument . . . 27
2.5 Mean errors after correction . . . 29
3.1 Mean and accuracy values evaluated for each ML architecture . . . 56
3.2 Notation symbols used for FLOPS evaluation . . . 59
3.3 Evaluated number of floating point operations for CNN and MLP. . . 59
3.4 Execution time and power consumption . . . 60
4.1 EIS dataset: number of samples for training, validation and test sets . . . 67
4.2 FLoating Point Operations for tested configurations with and without PCA pre–processing . . . 70
Introduction
Nowadays, people and environment health and safety are continuously threatened by human activities. Industrial processes and daily people habits are worsening health conditions of our planet. Air and water pollution represents a huge hazard for the Earth ecosystems. According to World Health Organization (WHO) 4.2 and 3.8 million deaths are caused by outdoor and indoor contaminated air, respectively, and about 91% of the world’s population lives in countries where the air quality indexes exceed the WHO guidelines. As regards water pollution, both freshwater and marine environments are contaminated by human activities. According to WHO
estimates, about 2 billion people daily use contaminated drinking water. More than 23% [1] of
the global diseases are associated with the environmental pollution, representing a significant weight for the usage of health care services and for their costs. Many studies highlight the association between contaminated air and drinking water with the diffusion of diseases and,
more in general, health problems [2][3]. Aiming at improving the health and safety conditions
of the Hearth planet, the WHO defines the guidelines, regarding air and water pollution, to help governments with their regulations. Although the reduction of contaminants emission is the key to tackle the environmental pollution, it is worth noting that the development and the adoption of reliable and widely spreadable (miniaturized and inexpensive) monitoring technologies are equally necessary. Indeed, they have positive impact for the phenomenon awareness increase, also in developing and poorer countries, providing a higher spatio-temporal resolution through a pervasive on-line monitoring. This is the basis for deeper analysis, as the detection of the emission sources, helping authorities for more efficient investigations and interventions. In this context, both the academic and industrial research fields are striving to
develop suitable environmental pollution monitoring solutions [4] [5] [6] [7]. The main devices
which are currently adopted for air and water quality monitoring are cumbersome static or mobile costly stations. In other cases, where specific analysis is needed, more sophisticated laboratory instruments are adopted, requiring the employment of professional technicians. Laboratory based procedures are commonly too slow to be used to fastly respond to accidental
contamination events [8]. Furthermore, their high costs are usually the reason for a very sparse
2 Introduction
widespread of the Internet of Things (IoT) paradigm [9] in a continuously increasing number
of applications has furthered its adoption also in environmental monitoring [10]. The concept
of integration of multiple technologies as sensing and communication in cheap platforms, which is the basis of the IoT paradigm, can be considered a breakthrough in the environmental monitoring field. Indeed, IoT enable the development of solutions for continuous and real time data collection and ubiquitous deployment of sensor nodes. A further technological
advance is represented by edge computing [11][12]. It consists in performing most of data
elaboration directly on-field devices positioned near the sensors at the network edges. This paradigm represents a meaningful improvement in terms of costs, power consumption and data
security with respect to centralized approaches [13]. Bandwidth costs, power usage, latency
and privacy can be optimized performing proper data processing algorithms directly on the data collecting device. As for this emerging technologies for environment monitoring, based on requirements as reduced sizes and costs, reliability of measurements and their analysis have
not been fully reached yet. Acquired data quality still represents an open issue [5][8] for a very
large deployment. Aspiring to a such diffusion, these technologies must be characterized by few false positives and false negatives, low costs and easy integration, usage and maintenance.
As underlined in [14], low-costs sensors are usually affected by the interference with different
substances (low selectivity) and by the dependence on the environmental conditions. Many sensor platforms are already commercially available and others are under development in many
research projects, both for air and water monitoring [15] [8]. Although they are still far from
replacing the current bulky devices, as laboratory instruments or monitoring stations, they represent an important alternative to increase the awareness of citizens, utilities companies and authorities.
This Ph.D. thesis main aim is represented by the development of the SENSIPLUS Em-bedded System, an IoT and Edge Computing solution endowed with sensing, processing and communication capabilities for health and safety applications. It is built around the
SENSI-PLUS (SP) chip which is developed by Sensichips s.r.l. [16] and the Department of Information
Engineering of the University of Pisa. The SP chip is a micro–analytical platform integrating heterogeneous sensors and representing the core business for the Italian company Sensichips s.r.l. for which I have been employed as apprentice for research activities during the Ph.D. course. As partner of different European research projects (Horizon 2020 and European De-fence Agency), Sensichips has been engaged in the development of key-technologies for the following listed applications:
• State of health monitoring of Activated Carbon Filters (ACF) and Biofilters; • Detection and recognition of indoor air contaminants;
Introduction 3
• Detection and recognition of contaminants in industrial waste water;
These applications have represented the testing scenarios of the developed SENSIPLUS Em-bedded System. Furthermore, as partner of the same research projects or for pure scientific interest, collaborations with different public and private research centers have been pursued (e.g. ENEA Portici, Arescosmo, Centro Diagnostico Baronia).
While the final aim is the development of prototypes customized for each specific ap-plication, from a general point of view, the main common activities can be summarized as follows:
• Design and development of Printed Circuit Boards (PCBs) for the integration of the SP chip;
• Software development for measurement acquisition, processing, displaying and storage for mobile Android devices, desktop Windows or Linux PC and embedded systems; • Metrological characterization of the SP chip as generic measuring instrument and of the
sensors adopted in each specific application;
• Experimental campaigns for measurements acquisition;
• Development of processing solutions based on statistical methods and Artificial Intelli-gence (AI) techniques as Machine Learning (ML) and Deep Learning (DL) architectures for raw sensors data analysis.
This thesis is organized as follows: Chapter1provides details regarding the SENSIPLUS
Embedded System, highlighting both hardware and software components. General architecture and hardware and software solution developed and exploited for all applications are described. Each of the following chapters is fully dedicated to the addressed applications. Specif cus-tomization details, state of the art analysis, experimental activity and obtained results are
provided in each of them. More in detail, Chapter2describes the activity regarding the state
of health monitoring of ACF and Biofilters while chapter3 and 4reports details regarding
6 SENSIPLUS Embedded System
The embedded system general architecture and the main hardware and software components adopted in the different addressed application scenarios are presented in this chapter. Details regarding the system customization carried out for each application, as the specific adopted sensors and the involved pre-processing and analysis techniques, are reported in relative chapters.
1.2
SENSIPLUS chip
The SP chip is a very low power (1.5 mW) micro–analytical sensing platform developed by the Italian company Sensichips s.r.l. and the Department of Information Engineering of
the University of Pisa. The SP chip, whose logical architecture is depicted in Figure1.2, is
characterized by a tiny silicon CMOS integrated circuit of 3mm x 3mm in size endowed with the capability to perform continuous (DC) and alternate (AC) electrical measurements on a versatile and configurable Analog Front End (AFE). The latter can be connected up to 4 external and 11 internal analog ports and can be used to read a wide range of sensors typologies (resistive and capacitive, as chemiresistors, temperature, humidity and pressure sensors) requiring high resolution measurements. Both the two-wire and four-wire electrical measurements method can be applied on the external analog ports. The Electrochemical Impedance Spectroscopy (EIS) technique is implemented through the usage of the Lock-In Amplifier (LIA) method. The electrical measuring capability and the external analog ports are the basis to use the SP chip as a real measuring instrument. A large functions set can be selected configuring the digital SP registers through specific commands. To this aim, 3 distinct serial communication protocols are available: SPI, I2C and SENSIBUS (one-wire proprietary protocol with 6 bytes for addressing). Sensichips s.r.l. and the Department of Information Engineering of the University of Pisa develop a SP release every year (RUNx, where x identifies the release number). The boards developed for the activities reported in this thesis work integrate the fourth (RUN4) and fifth (RUN5) SP releases. SENSIPLUS SPI, I2C, SENSIBUS ADC EIS On chip sensors External ports
12 SENSIPLUS Embedded System
Fig. 1.8 Smart Cable board prototype
external devices through wired connection. Multiple Smart-Cable boards can be simultaneously placed on the same wire configuring a wired network. The very small sizes of both boards and cable are designed to enable the integration of such technology in various infrastructure typologies.
1.5
SDM Software Layer
The SDM software layer is endowed with a generic Application Programming Interface (API), namely SENSIPLUS API, and modules for data transmission, pre–processing and analysis specifically designed and developed for each application scenario.
The SENSIPLUS API architecture, as further detailed in section1.5.1, is designed to model
the SP chip as a parametric measuring device providing high level functionalities.
Initially implemented only in Java programming language, it has been used as common
module for Android, Windows and Linux applications (1.5.2), allowing to acquire, elaborate,
display and store measurements carried out through the SP chip.
In order to meet the requirements of low power consumption and small sizes of the addressed applications, the SP API has been implemented also in C programming language for the integration on resources limited MCUs. Furthermore, lightweight embedded software has been built on the SP C API, for a stand-alone usage of the developed hardware boards in experimental testing and demonstration activities.
1.5.1
SENSIPLUS API
The SP API represents the way a software application can deal with the set of functionalities needed for the interaction with SP chip. It is based on a stacked multi-layer software architecture
1.5 SDM Software Layer 13
characterized by a hierarchical logical model. Each layer provides services and functionalities to the upper level and exploits the ones provided by the lower level. As shown on the right
column of Figure1.9, the SP API architecture is composed of 3 levels. Each level abstracts
a hardware component to which is logically linked as virtual interaction (horizontal arrow in
Figure1.9).
Physical channel
BLE COM USB WIFI
SPDriver(Interact directly on Operating System Library)
API Level 0 SPDecoder
SPProtocol
(SPI, Sensibus, I2C on FT232 - CC254 – ESP8266 – STM32)
API Level 1 API Level 2
SPMeasurement SPSensor API Level 3Application Level
SPProtocol
(SPI,I2C,SENSIBUS)
MCU
(FT232RL - CC2541 -STM32 - ESP8266)
USB
BLE COM USB WIFI
USB SENSIPLUS CHIP Registers Sensors Insruments Measurements Stimulus Hardware Software Peer to Peer Protocol Hardware Interaction Software Interaction SPAnalyte Classification
Fig. 1.9 SENSIPLUS API Architecture
More in detail, each API level and relative functionalities are listed in the following: • API level 0: it represents the communication driver level. Various communication
technologies can be adopted to connect the host (Android or Windows/Linux device) and the MCU which is connected to the SENSIPLUS chip, as BLE, WiFi and USB.
• API level 1: this level deals with decoding and encapsulating in data packets high level instructions. More in particular, the SPDecoder translates instructions strings (written in a human readable format) in byte sequences according to specific rules depending on the SP chip, while the SPProtocol creates specific data packets according to the serial communication protocol used between the MCU and the SP chip.
• API level 2: representing the higher software library API level, it is the unique level reachable from the application level. It is endowed with three distinct entities: SPAnalyte-Classification, SPSensor and SPMeasurement. The SPAnalyteClassification is composed of a series of methods and algorithms which are the core of any high level data analysis performed on raw acquired data. This entity can optionally use a ML models depending on the specific task to be performed and according to the application specifications. The
14 SENSIPLUS Embedded System
SPSensor entity deals with the SP sensors. It is endowed with a series of methods where all the measuring settings for each specific sensor are contained and used. Finally, the SPMeasurement module allows a deeper and more expert usage of the SP chip as generic measuring instrument. It is possible to set all the measuring settings as the stimulus pa-rameters (e.g. sinusoidal frequency and amplitude etc..) or signal conditioning variables (e.g. amplifier gain).
1.5.2
Developed Applications
Two distinct software applications have been developed to interact with the SDM hardware and software components and the SP chip. Personal Hazards Monitor (PHM) and Sensiplus Winux are the applications name for Android and Windows/Linux operating systems, respectively. These applications have been exploited to test the different use cases where the SP technology has been involved. They both allow a direct interaction with available SDM configurations performing electrical measurements and gathering acquired values. Measured data are plotted,
as shown in Figures1.10and1.11, during the acquisition and stored in files for post–processing.
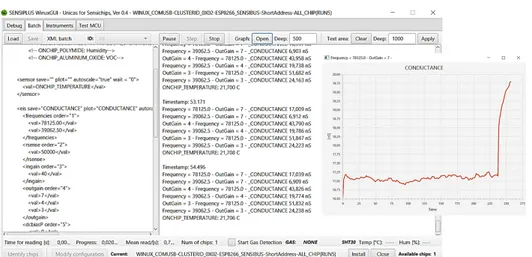
As regards PHM application, the main views implemented to deal with electrical impedance and sensors measurements are shown. More in detail, from the left to the right, the reported views correspond to: the GUI shown at the application starting, the electrical impedance parameters setting, the list of available sensors and the graphical representation of acquired data. Furthermore, Sensiplus Winux application is endowed with the capability to perform measurements on multiple sensors. An array of sensing elements can be instantiated in a proper file (XML format) which is loaded and parsed by the software. Once data structures have been prepared the sequential sweep of measurements on each sensor is computed in cycle and repeated a parametric number of repetitions. Multiple electrical impedance quantities,
1.5 SDM Software Layer 15
Fig. 1.11 Sensiplus Winux GUI
as modulus and phase but also resistance and capacitance values calculated according to the
selected equivalent circuit, can be plotted and stored for each sensor. As shown in Figure1.11,
acquired measurements from sensors are reported both on a plot window and in the text view of the main GUI. As regards the measurement storage, distinct files (CSV format), reporting all measuring parameters (e.g. stimulus frequency and amplification gain), are saved for each sensor and a further global file, where only the plotted quantities are reported, is stored. While the former files allows to analyze the sensors behavior from the measuring settings point of view, the latter has been designed for an easier usage in post–processing, having all needed data in a unique container.
Chapter 2
State of Health Monitoring of Activated
Carbon Filters and Biofilters
2.1
Introduction
Technological advances carried out in electronics, sensors and data science fields are furthering
the deployment of novel paradigms and solutions, as sensor networks and IoT [18], in many
different scenarios. Industrial [19], homeland security [20] and predictive maintenance [21]
[22] applications represent fields where continuous and near real time monitoring are required
for people and environmental health and safety guarantee.
Air contamination is a widely concerning phenomenon for which many technologies are already adopted and continuously improved. The usage of technologies capable to remove contaminants, as air filters, can surely be considered an important solution for people and environment health protection.
Activated Carbon Filters (ACF) [23] are currently employed in different scenarios, as
military and industrial fields to protect soldiers form toxic substances and to prevent polluting emissions. ACs capability to remove contaminants from the air is based on their pore structure, responsible for trapping and adsorbing undesired substances molecules. Nowadays, ACF maintenance is commonly based on a time-based schedule. More in detail, they are replaced
according to an estimated expiration time [24] and often used in a clogged and exhaust
state. ACF state of health and exhaustion time depend on different factors as environmental conditions (e.g. temperature and humidity) and the specific typology of contaminants present in the working scenario. For these reasons, a monitoring device capable to measure and analyze, through specific algorithms, the state of health and the residual life of an air ACF is required to assure a safer usage. In such a way, predictive maintenance can be implemented in industrial
18 State of Health Monitoring of Activated Carbon Filters and Biofilters
air purification system reducing failures and consequent polluting emissions. Furthermore, a safer usage of the respiratory mask’s cartridges can be reached by integrating a such technology. An accurate notification, based on continuous and real time measurements and elaborations, is provided when the filter is reaching the saturation level.
A further technology, often adopted for purification purposes both for air and water regards
the biofiltration [25]. It is based on the decomposition and metabolization of the undesired
compounds. Pollutants are captured and biologically degraded through the living film material
adopted for the biofilter [26]. The emissions are passed through an organic porous medium,
that is a special bed filled with natural material such as wood chips or barks. Temperature and relative humidity are usually controlled to handle and guarantee the microorganisms (e.g. bacteria) to flourish. Colonies of aerobic microorganisms living on the filter biofilm are able to degrade contaminants present in the gaseous flow. As for the ACF, a reliable solution capable to estimate the state of health of biofilters provide the possibility to perform safer usages. Monitoring their the state of health allows, for instance, to implement a proper control of temperature and humidity condition of the material, on which strongly rely microorganism life, and to provide early warning notification when specific dangerous levels are reached.
The work carried out in the Ph.D. thesis aims at the development of monitoring device prototype both for ACs and biological filters. The same approach based on the SENSIPLUS embedded system has been adopted and electrical impedance has been exploited as measuring technique. After a detailed analysis of the solution adopted and proposed by the scientific community for ACF and biofilters state of health monitoring, the developed prototypes and the experimental activities are reported. The research activity described in this chapter and
relative to ACF has brought to the works proposed in [27][28][29]. The research activities
for the development of a state of health monitoring system for ACF and biofilters have been conducted with the collaboration with Arescosmo and Centro Diagnostico Baronia (CDB), respectively, which have provided the needed materials for real scenarios experiments.
2.2
State of the Art
Different approaches have been adopted in the scientific research field for the development of both a measurement technique and a Residual Life Indicator (RLI) estimation algorithm for ACF, which still represent on open issue. The evaluation of the state of health of an air filter based on activated carbons is commonly made with destructive or off–line approaches. Filters are opened and different techniques are adopted for the analysis of the residual life of carbons. Obviously, this approach cannot be adopted for online monitoring for which other techniques are required. Furthermore, ACF state of health cannot be analyzed with the level
2.2 State of the Art 19
of impediment to airflow as for several other filtration systems. Infact, ACF does not provide any measurable reduction of airflow even when the activated carbon pores are saturated by unwanted vapors. This has made the development of a generic End of Service Life Indicator (ESLI) or RLI sensor for ACF filters quite challenging. Company 3M has commercialized an Organic Vapor Service Life Indicator which can only operate in specific environments. The 3M ESLI provides a visual indication, exploiting the capability of a polymer to change the color during the adsorption of target compounds. Chemical tracers are usually used for the evaluation of the residual adsorption capability of the carbons. A study of the relationship between the residual life of an ACF and the resonance frequency of a resonator cavity is provided in
[30]. This work is based on the consideration that the adsorption of air contaminants causes a
variation of the carbons dielectric constant of the filter. Electrical Impedance variation relation
with the AC adsorption of SO2 is highlighted by Rubel et al. [31], while Electro-Mechanical
Impedance Spectroscopy (EMIS) is applied on ACs in [32] to evaluate their state of health
through the observation of both electrical and mechanical carbons properties. EMIS allows to analyze structural deformation of the carbons, while the EIS provides information related to the carbons’ dielectric properties. Some specific examples of the dependence of activated
carbons’ electrical properties on contaminants adsorption are provided in [32] [33]. Depending
on the material used for the electrodes connected to activated carbons, DC or AC electrical measurements can be used. More in detail, different kind of electrodes have been used in literature. When electrodes are directly in contact with activated carbons the overall electrical resistance is very low (tens of ohms) because of the high conductivity of carbons. In this case
DC measurements are usually used for resistance evaluation [31] [32], while AC measurements
carried out through a sinusoidal stimulus are adopted when electrodes are insulated (through
polyurethane or nylon) as in [32] to enhance the capacity variation with overall resistance
values higher than tenth of kilo-ohms [32]. A procedure based on AC measurements with
sinusoidal stimulus frequency in the range 10 mHz to 300 kHz has been adopted by Muriel
et al. in [34]. Insulated electrodes configuration and EIS measurement technique allows to
analyze the frequency response of the material providing the possibility to model an equivalent circuit. In such a way, the contribution of different phenomenon could be analyzed through the analysis of the behavior of specific electrical parameters. The work carried out for this Ph.D. thesis has been based on the usage of insulated electrodes and AC sinusoidal measurements as deeply detailed in following paragraphs.
As regards biofilters, multiple scientific works highlight the relationship between the presence of biological microorganisms in a medium and its electrical impedance behavior
[35][36]. The frequency range from 100 Hz up to 1 MHz has been widely exploited to detect
20 State of Health Monitoring of Activated Carbon Filters and Biofilters
modeling is adopted to analyze the specific parameters related to bacteria or, more in general, biological compounds state of health. Multiple aspects of biofilters relationship with different
pollutants substances have been studied and analyzed in the scientific literature. In [38] and
[39] the authors studied biofilter impedance dependence on acetone injection and its capability
to remove it from air. More in particular, the biofilter electrical impedance has been analyzed with respect to the variation of both temperature and acetone concentration of the biological
film [38].
2.3
Developed prototypes
Two hardware prototypes of the ACF state of health monitoring device have been designed and developed in this research activity. The design and development processes have been carried out considering the points listed in the following as the main application requirements:
• Electrical Impedance Spectroscopy measuring capability; • Low power consumption and small sizes;
• Wireless communication capabilities;
2.3.1
Prototype based on BLE board
The BLE board, whose details are provided in section 1.4.1, has been the first prototype
developed for this application. A preliminary experimental phase, exploiting the BLE board, has been conducted in order to prove the feasibility of the research activity. To this aim, the
testing and demonstration setup shown in Figure2.1has been prepared. The BLE board has
been directly integrated inside the filter and the SP chip connected to the electrodes. The PC, running an ad hoc developed software, has been used to control and communicate with the BLE board. Furthermore, a very first prototype of the RLI algorithm has been developed and tested in this activity. The 7-segment led digit exposed through a drill in the ACF container has
been used, as shown in Figure2.2, to provide the filter state during gas filtering. The algorithm,
described in section2.5.4, is mainly based on an initial calibration phase, indicated with the
letter C on the 7-segment led, and ten different residual life levels before reaching the saturation, indicated with letter F.
2.3.2
Prototype based on the USB and Wi-Fi board
Stricter application requirements, mainly in terms of miniaturization and power consumption, have brought to design and develop the Wi-Fi/USB board, whose details are provided in section
2.3 Developed prototypes 21
Fig. 2.1 Measurement setup adopted for the feasibility demonstration
Fig. 2.2 Some pictures of a sensorized (BLE board) ACF running a first (very simple) version of the RLI estimation algorithm.
1.4.2. The new release of SP (RUN5), characterized by improved measurement capability, has been integrated in this board. Furthermore, the modularity characterizing this device allows to singularly use the STM32L0 shield in scenarios where ultra-low dimensions and power consumption are needed and wireless communication capability is not required. Most of the research activity carried out for this application has been conducted with this secondly developed board. In order to meet the application requirement regarding the long lifetime of such device in a battery-operated mode, a smart usage of its modules has been defined. Exploiting the sleep modalities of the three main elements (i.e. SP, STM32L0 and ESP8266) of
22 State of Health Monitoring of Activated Carbon Filters and Biofilters
the device, an operating cycle based on different phases has been designed. Each phase and
relative power consumption are shown in Figure2.3and described in the following:
• Initialization: The unique operation performed here is to set the ESP8266 MCU in deep sleep mode. Since all blocks are in their normal mode this phase is characterized by the maximum power consumption of about 600 mW. The duration is very short and negligible with respect to the other phases. This first phase is performed only at the device start-up, the real operating cycle starts with the second phase.
• Measurements: the STM32L0 MCU sets the SP chip to perform an electrical impedance measurement, read the acquisition and calculate the impedance module and phase values (v[i]). This operation is repeated a parametric number of times (N), which can be set considering the trade-off between measurement precision and time, enqueuing calculated
values in a RAM stored buffer. The overall duration of this phase is equal to N x Tmeasure
(100 ms) and the relative power consumption is about 6 mW.
• Elaboration: mean and standard deviation of impedance module and phase values are
computed by the STM32L0 according to2.1and2.2. This operation is performed in a
negligible time with respect to the other phases and 6 mW is its power consumption.
µb= 1 N N
∑
i=1 v[i] (2.1) σb= s 1 N N∑
i=1 (v[i] − m)2 (2.2)• Data transmission: the ESP8266 MCU is woken up to transmit the mean and standard deviation values for both impedance module and phase. The Wi-Fi communication technology and the TCP-IP protocol are adopted for this phase. Once data have been sent, the ESP8266 and the SP chip are set in their low power mode. The duration of
this phase is the sum of TwakeUp(about 1 s) and Tsend(negligible). The maximum power
consumption of about 600 mW characterizes this phase since all modules are in their normal mode.
• Pause: this last cycle phase starts with the STM32L0 entering its low power mode (i.e.
Stop Mode) and is held for Twaitseconds. This last is a parametric value which can be
chosen according to the specific application needs. This phase is characterized by the minimum power consumption of about 0.33 mW. Finally, the STM32L0 wakes up after
2.3 Developed prototypes 23
DeepSleep()
t NEGLIGIBLE N x Tmeasure NEGLIGIBLE
ESP8266 STM32L0 SENSIPLUS Power [mW] 1 10 100
Operating phases & Power Consumption
TwakeUp + Tsend 1000 i < N WakeUp() StopMode(Twait) Twait 567 mW Measure()
v[i] = ImpEval() std = StDev(v)m = Mean(v)
Sleep() WakeUp() Send(m, std) DeepSleep() false true j < K false STOP true
Fig. 2.3 Diagram of the operating phases designed for the ACFs monitoring.
As shown in Figure2.3, the operating cycle, composed of the phases 2 to 5, can be repeated
K times. In such a way a continuous monitoring can be implemented and the update rate can
be controlled through the Twaitparameter. The different parameters introduced in the designed
operating cycle allows to properly customize the monitoring device in terms of: • Measurement precision and update rate;
• Lifetime;
• Physical dimensions;
More in detail, these requirements can be controlled by N and Twait parameters, and the
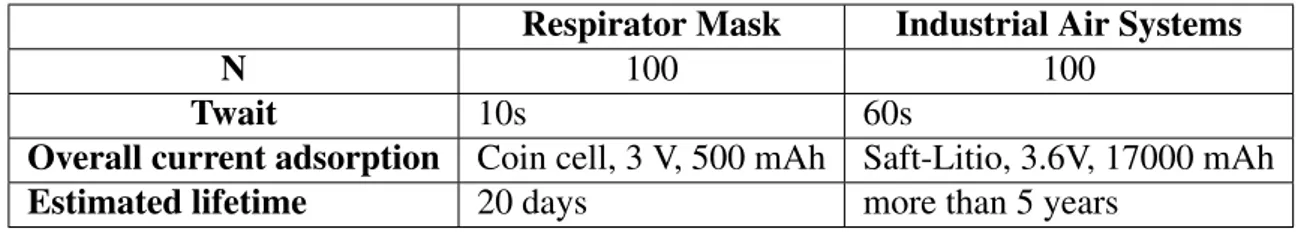
battery sizes. Considering as application scenarios the respirator mask cartridges (used by military and civil operators) and industrial air filtering systems, two specific combinations of such parameters are provided in the following. A high update rate is needed for respirator masks, since rapid flow of high toxic gases concentration can rapidly saturate the ACF. Furthermore, tiny batteries need to be selected for proper integration inside the cartridge and 24 hours is the
minimum operating time [24].
Table 2.1 Selected parameters and estimated lifetime for two specific applications
Respirator Mask Industrial Air Systems
N 100 100
Twait 10s 60s
Overall current adsorption Coin cell, 3 V, 500 mAh Saft-Litio, 3.6V, 17000 mAh
24 State of Health Monitoring of Activated Carbon Filters and Biofilters
Weaker requirements characterize the industrial air purification filters in terms of battery dimension and update rate, but much longer lifetime (e.g. years) is needed. Specific details are
provided for both the applications in Table2.1.
2.4
Metrological Characterization
The SP platform has been subjected to a metrological characterization to test and verify its
measuring capability. To this aim, the experimental setup shown in Figure 2.4 has been
prepared.
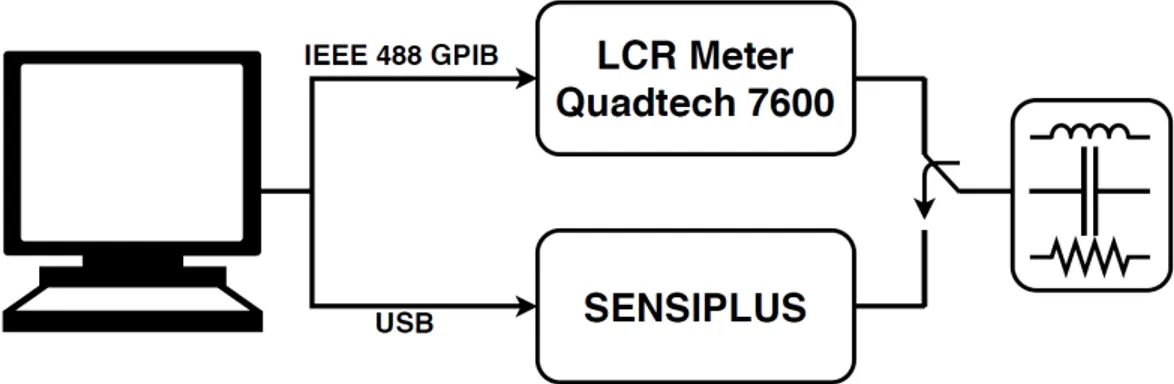
Fig. 2.4 Experimental laboratory setup for metrological characterization It is mainly composed of:
• An electrical circuit, emulating the ACF electrical load, composed of discrete components (resistors, capacitors);
• An LCR Meter Quadtech 7600 adopted as reference measuring instrument. Its highly accurate measuring capability allows to perform a reliable comparison with the SP platform;
• The SP platform, which is hereafter also referred as Device Under Test (DUT);
• A PC running ad hoc developed software for measurement acquisition and storage. It is connected to the reference instrument and DUT through different communication technologies, IEEE 488 GPIB for the Quadtech 7600 and USB for the SP. More in detail, the PC software deals with the measuring instrument configuration, by setting needed parameters, and gathering data once they have been measured by the instruments for storage and elaboration.
2.4 Metrological Characterization 25 Table 2.2 Discrete components values
Component Range Step
Resistor [kΩ] [350 - 440] 10
Capacitor [pF] [70 - 79] 1
Measurements acquisition has been conducted alternating the two devices (reference instru-ment and DUT) and keeping constant the laboratory environinstru-mental conditions. Moreover, the same wires have been used to perform measurements with both instruments to neutralize the parasite effects.
The electrical discrete components composing the impedance load for the emulation of the ACF have been chosen according to a preliminary characterization of few real filters’ samples. Their electrical impedance variability range has been analyzed and resistance and capacitance values have been calculated modeling a real filter according to an RC parallel equivalent circuit. To this aim, variables decades resistors and capacitors, whose values range
and steps are reported in Table2.2, have been used.
Ten different loads have been generated combining the adopted decade resistor and capacitor. Starting from the minimum values (350 kΩ for resistance and 70 pF for capacitance), further 9 loads have been created increasing the resistance and capacitance values of the relative step. DUT comparison with respect to the reference instrument has involved 3 different sinusoidal frequency (13, 20 and 78 kHz). They have been selected according to the most suitable frequency highlighted in literature, as reported in section 2.2, and the SP chip signal generation capability. Multiple repetitions of the same measurement have been conducted for each frequency and load to compensate effects due random phenomena. More in detail the operating cycle, described in section 2.3.2, has been configured by setting N = 16, K = 20 and
Twait= 15 s. At each iteration of the cycle a burst of N measurements is performed and mean
and standard deviation values (µb, σb) are calculated. For each load and frequency, the same
operation is repeated K times. The metrological characterization has been addressed to the analysis of following main three factors:
• Repeatability comparison between the reference instrument and the DUT; • Metrological linearity of the DUT;
• Measuring error;
In order to analyze the above reported metrological aspects of the DUT, different figures of merit have been adopted. The Mean and standard deviation values have been calculated
26 State of Health Monitoring of Activated Carbon Filters and Biofilters Table 2.3 Worst case Standard deviation values (worst case) evaluated for reference instrument (REF) and DUT
Frequency [kHz] σ|Z|,ref[Ω] σθ ,ref[rad] σ|Z|,DUT[Ω] σθ ,DUT[rad]
13 5.5 2.9 × 10⁻⁵ 120 4.4 × 10⁻⁴
20 3.0 2.6 × 10⁻⁵ 110 6.6 × 10⁻⁴
78 1.9 6.1 × 10⁻⁵ 39 1.1 × 10⁻⁴
for the repeatability comparison assessment. The DUT linearity has been analyzed mainly through the building of Calibration Curve (CC) and the evaluation of the Non-Linearity Error
(NLE), calculated according to equation 2.5. CC is an analytical relationship between the
reference quantity (in our case it corresponds to the measurement performed with the reference instrument) and the measurement carried out with the DUT. The NLE is calculated as the
maximum distance between the raw measured value (yR(x)) and the relative point on the linear
least-square approximation (yA(x)), normalized with respect the approximating value in the
maximum location (xmax)
µ = 1 K K
∑
j=1 µb, j (2.3) σ = v u u t 1 K2 K∑
j=1 σb, j2 (2.4) NLE%= maxx(|yR(x) − yA(x)|) |yA(xmax)| ∗ 100% (2.5)2.4.1
Repeatability comparison between reference instrument and DUT
As first step of the characterization, the compliance of the Quadtech 7600 to be adopted as reference instrument has been proved. Since the DUT metrological performance in electrical measurements are not characterized, a first comparison between the Quadtech 7600 and the DUT has been addressed to determine if the adopted LCR meter can be used as a reference instrument. To this aim, the standard deviation of the obtained measurements for the 3
frequencies have been analyzed. As reported in Table2.3, the DUT standard deviation values
are always (for all 3 frequencies and for both impedance module and phase) much greater than the Quadtech 7600 ones. For this reason, the LCR meter Quadtech 7600 can be used in this activity as reference instrument for the DUT.
2.4 Metrological Characterization 27
2.4.2
DUT linearity analysis
As aforementioned, the DUT linearity analysis has been carried out through the observation of the CCs and NLEs. More in detail, the CCs highlight the relationship between the reference instrument (x-axis) and DUT (y-axis) measurements. A linear approximation fitting curve has been used to evaluate the analytical relationship. The validity of usage of a linear fitting has been analyzed through the NLE figure of merit. Obtained NLEs results for impedance module
and phase at the 3 adopted frequency, shown in Table2.4, are lower than 2%. The most linear
trend has been achieved with the 78 kHz measurements, with 0.6 % and 0.2 % as NLEs for impedance module and phase, respectively.
Table 2.4 NLE evaluated with respect the reference instrument
Frequency [kHz] NLE|Z| [%] NLEθ [%]
13 1.2 0.3
20 1.9 0.5
78 0.6 0.2
The low values obtained for NLEs allows to reliably use the linear approximation function. As regards CCs, the ideal case is represented by the bisector line (y=x), which is obtained if the DUT measurements are the same as for the reference instrument. CCs obtained for impedance
module and phase at each frequency are reported in Figures2.5-2.7. The slope of the best
fitting linear approximation obtained for impedance module becomes lower with the frequency increase. As for the impedance phase, CCs results to be closer to the ideal case, especially for the 20 kHz and 78 kHz frequencies, in terms of both slope and offset. The impedance phase at the 3 analyzed frequencies highlight a different behaviour in terms of points distribution. More in detail, 13 kHz and 20 kHz measurements show equally distributed points on the linear approximation, while the 78 kHz ones are thickened around the 1.4 rad point. This phenomenon is probably due to the different impedance phase behavior at various frequencies. Finally, the CCs slope and offsets have been used to adjust the DUT measurements approaching the ideal behavior.
2.4.3
Measuring error evaluation
The CCs slopes and offsets compensations has brought to correct the DUT systematic errors. A further measurements campaign has been conducted and the developed correction function has been applied to DUT measurements. Corrected data have been used to evaluate the residual
28 State of Health Monitoring of Activated Carbon Filters and Biofilters
Fig. 2.5 Calibration curves (for impedance module and phase) obtained for 13 kHz frequency.
Fig. 2.6 Calibration curves (for impedance module and phase) obtained for 20 kHz frequency.
Fig. 2.7 Calibration curves (for impedance module and phase) obtained for 78 kHz frequency.
the DUT measurements for module and x the actual (measured by the reference instrument) load value.
∆|Z|% =
|y|Z|,c(x) − x|Z||
2.4 Metrological Characterization 29 Table 2.5 Mean errors after correction
Frequency [kHz] ∆|Z|,mean[%] ∆θ ,mean[%]
13 0.692 0.125
20 1.616 0.145
78 0.635 0.097
∆θ% = |yθ ,c(x) − xθ|
xθ ∗ 100% (2.7)
Obtained error percentages are shown in Figure2.8and reported, in a more synthetic view,
in Table2.5. Impedance module and phase are for all 3 frequencies lower than 4 % and 0.6
%, respectively. More in detail, worst peaks are obtained for 20 kHz measurements while best performance have been achieved with 78 kHz ones.
Fig. 2.8 Impedance module and phase errors percentages after correction
The metrological characterization results have allowed to state the capability to use the SP chip for the reference application. Although no comparisons with other on-chip LCR meters have been conducted, the SP platform can be considered a promising technology for a such application given the metrological results the availability of further on-chip sensors. The SP chip is endowed with on-chip temperature, humidity and gas sensors which can be simultaneously measured with the analog port connected to the ACF electrodes. The sensors’ array provides a more comprehensive feature vector which can be exploited by an RLI algorithm. For instance, a correlation between temperature, humidity and the filter impedance values can be analyzed and the presence of gases flowing inside the filter can be immediately detected.
30 State of Health Monitoring of Activated Carbon Filters and Biofilters
2.5
Experimental campaign on real scenario for ACF
An experimental campaign on real scenario has been conducted after the validation of the
measuring capability of the SP platform, whose description is provided in section2.4. More
in detail, prototypes of ACF have been assembled and testes during the injection of different gases. This part of the activity aims to analyze the sensitivity of the SP platform in real ACF and with the presence of gas. The electrical impedance behavior of the ACF in the following 3 states has been analyzed with different prototypes and gases:
• Clean region: filter is clean and still uncontaminated; • Working region: filter is working during polluting injection; • Exhaust region: filter has reached the saturation level.
Before starting the analysis of the obtained impedance measurements, it is relevant to underline and consider that the ACF have been prepared with a hand-made process, involving both the electrodes’ insulation through nylon and the cartridge filling with activated carbons. This has caused different baseline values at the beginning of the impedance measurements. For this reason, a relative representation, with respect to initial baseline, of obtained impedance module and phase measurements has been considered.
2.5.1
Measurement setup and procedure
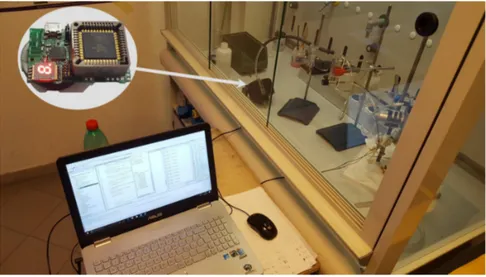
The experimental measurement setup shown in Figure2.9has been prepared to test the ACF
impedance behavior during its usage to filter contaminants. To this aim, the following main
elements (reported in the left picture of Figure2.9) have been involved:
• A gas source which pumps the chemical inside the filter under test; • The assembled ACF under test;
• The SP chip connected to the ACF for impedance measurements; • A gas detector to reveal the filter breakthrough moment.
As regards the contaminants, the experiments have been conducted using the following gases: ethanol, isooctane, methyl ketone (MEK) and chlorine (diluted at 1%). All of them can be found in both industrial and military scenarios. Considering the metrological characterization results, the 78 kHz frequency has been selected for impedance measurements. As for the measurement procedure, 3 phases for each experiment have been pursued:
2.5 Experimental campaign on real scenario for ACF 31
Fig. 2.9 Experimental measurement setup adopted for real scenario measurements. A logical representation with main involved elements is reported on the left while a picture of the real laboratory setup is provided on the right
• Phase #1: clean air is pumped inside the filter. During this phase the ACF remains unaffected and, consequently, it is expected that the impedance module and phase values do not change.
• Phase #2: the chemical substance is injected inside the ACF. The gas pumping contin-ues until the gas detector reveals traces of chemicals. The impedance is expected to change during this phase since activated carbons are adsorbing the substance molecules modifying their electrical properties.
• Phase #3: the impedance module and phase continue to be monitored in order to verify the achievement of a steady state.
It is worth noting that the developed adjustment procedure has been applied to these measure-ments in order to correct them from systematic errors.
2.5.2
Obtained results
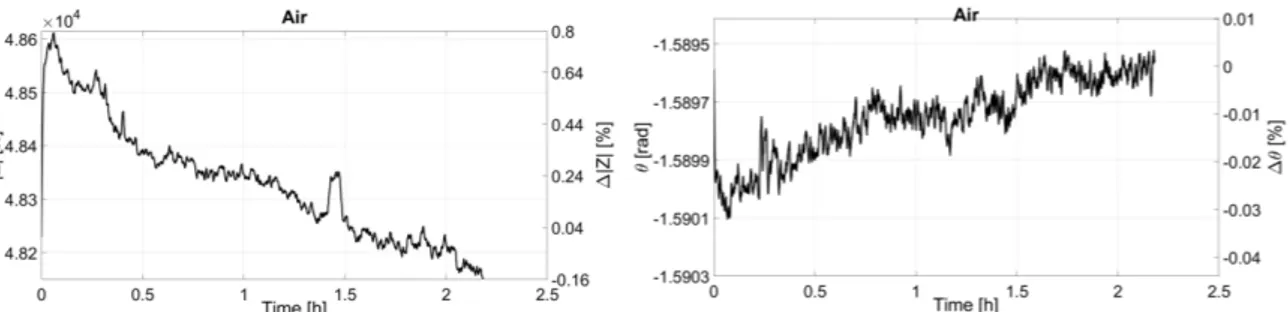
A first test has been carried out injecting only clean air inside the filter in order to analyze the activated carbon impedance behavior. In this experiment, whose results are reported in Figure
2.10, a mean value of 48.3 kΩ and -1.59 rad and a standard deviation of 109.8 Ω and 0.0002 rad
have been obtained for impedance module and phase, respectively. Finally, a relative variation lower than 1% for impedance module and lower than 0.1% for impedance phase characterize the obtained trend in more than 2 hours of measurements. For all the other experiments, for which the gases reported in previous section have been used, the 3 phases are highlighted on each plot
on Figures2.11-2.14. The green dotted lines mark the moment in which the gas injection is
32 State of Health Monitoring of Activated Carbon Filters and Biofilters
the gas detector. Figures2.11report the impedance measurements acquired during the injection
of isooctane. During the phase #1, standard deviation values of 0.23% and 0.008% have been obtained for modulus and phase. The variations observed during the phase #2, equal to 16% for modulus and 0.6% for phase, are much greater than the relative repeatability experimented for clean air. Finally, during phase #3 the steady state is reached and standard deviation values
of 0.3% and 0.01% are observed. In the second test, whose results are depicted in Figures2.12,
ethanol has been used as contaminant. Impedance module and phase measurements highlight a very similar behavior with respect to isooctane experiment for all 3 phases. Chlorine (diluted at
1%) has been adopted as contaminant for the third experiment. As depicted in Figures2.13,
also for this experiment the modulus and phase values variability of the second phase is much greater than the one obtained during the first and third ones. Furthermore, relative repeatability of phase #1 and phase #3 are very similar to the one observed for the previous experiments. Also for MEK, which has been the last tested substance, an appreciable variation characterizes
the middle phase with respect to the starting and ending zones (Figures2.14). Summarizing
consideration are listed in the following:
• The relative impedance repeatability during clean air injection is very similar among the different experiments (carried out with different hand-crafted ACF);
• A steady state of the impedance measurements is reached when the filter is exhaust and no more capable to trap chemicals’ molecules, although the gas continues to be injected; • The phase #2 variability is always greater than the ones obtained for the initial and final phases, highlighting the dependencies of the impedance measurements on the adsorption phenomenon of the activated carbons.
2.5 Experimental campaign on real scenario for ACF 33
Fig. 2.11 Impedance module and phase during isooctane injection
Fig. 2.12 Impedance module and phase during ethanol injection
Fig. 2.13 Impedance module and phase during chlorine injection
Fig. 2.14 Impedance module and phase during mek injection
2.5.3
Equivalent circuit modeling
Considering the ACF hardware structure, which, as expressed in previous sections, is composed of activated carbons surrounded by insulated electrodes, a ohmic-capacitive impedance load
34 State of Health Monitoring of Activated Carbon Filters and Biofilters
behavior is expected. For this reason, the ACF has been modeled according to a parallel
resistance–capacitance (R–C) equivalent circuit, as shown in Figure2.15. Resistance (Rp) and
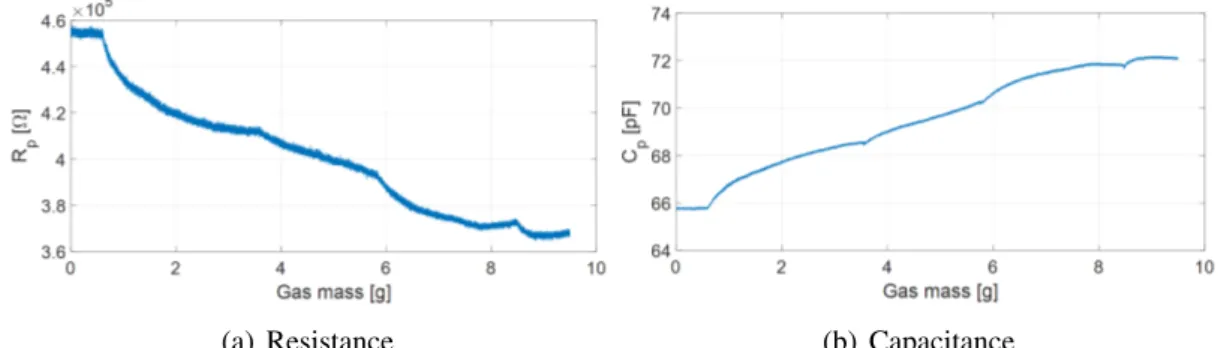
capacitance (Cp) values have been calculated according to equations2.8and2.9. Finally, the
acquired impedance module and phase values relative to ethanol and isooctane experiments
have been transformed in resistance and capacitance, as shown in Figures2.16-2.17. As regard
the relative variation, a greater percentage is obtained for resistance values for both experiments. More in detail, resistance percentage variation are 30% and 24% for ethanol and isooctane, respectively, while it is lower than 10% for capacitance. As expected considering the impedance module and phase behavior, an opposite trend characterized the resistance and capacitance values. Both the conductivity and the dielectric constant of the carbons increase with the adsorption of injected chemical molecules.
SENSIPLUS
ACF
Fig. 2.15 Activated Carbon Filter equivalent circuit
R= |Z|
cos(φZ)
(2.8)
C= −sin(φZ)
|Z| (2.9)
(a) Resistance (b) Capacitance
Fig. 2.16 Resistance and Capacitance values evaluated according to the parallel equivalent circuit during ethanol injection.
2.5 Experimental campaign on real scenario for ACF 35
(a) Resistance (b) Capacitance
Fig. 2.17 Resistance and Capacitance values evaluated according to the parallel equivalent circuit during isooctane injection.
2.5.4
Preliminary prototype for RLI method
A preliminary design of the RLI method has been developed. It is based on the experimental activity documented in previous sections, where the relation between ACF electrical impedance behavior with contaminants filtering has been analyzed. According to the specific chemical contaminant injected, different absolute saturation levels and percentage variation have been observed on both impedance modulus and phase. A further variability, characterizing the differ-ent absolute values measuremdiffer-ent in the experimdiffer-ental activity, is introduced by environmdiffer-ental condition (e.g. temperature and humidity) and hand-crafted filters preparation. While these last aspect can be compensated with temperature and humidity sensors (available on SENSIPLUS chip) and automatizing the filters preparation process, the impedance values dependence on the specific chemical is still an open issue. The designed method, explained in the following, is based on the minimum percentage variation observed in the experimental phase (i.e. worst case). The method is organized according to following points:
• Baseline evaluation: a buffer of impedance measurements is acquired when the filter seal is opened and the mean value and standard deviation is calculated;
• Saturation level evaluation: a maximum threshold is calculated considering a percentage of the baseline;
• Residual life levels evaluation: considering the baseline as level 0 and the saturation level, N intermediate equally separated steps are calculated;
• Operative phase: Impedance measurements are acquired and elaborated directly on the MCU connected to the SP chip. A notification is provided when a new level is reached, informing the operator for the military mask and the maintenance in an industrial air purification system.
36 State of Health Monitoring of Activated Carbon Filters and Biofilters
2.6
Experimental campaign on real scenario for Biofilters
The preliminary experimental activity conducted for the development of a state of health monitoring for biofilters is organized according to two main phases:
• Test with reference instrument: impedance measurements of filtering material at different concentrations have been performed through a laboratory LCR meter. More in detail, two soils at different bacteria concentrations have been exploited for this phase and a frequency sweep (from 1 kHz up to 100 kHz) has been performed for measurements acquisition.
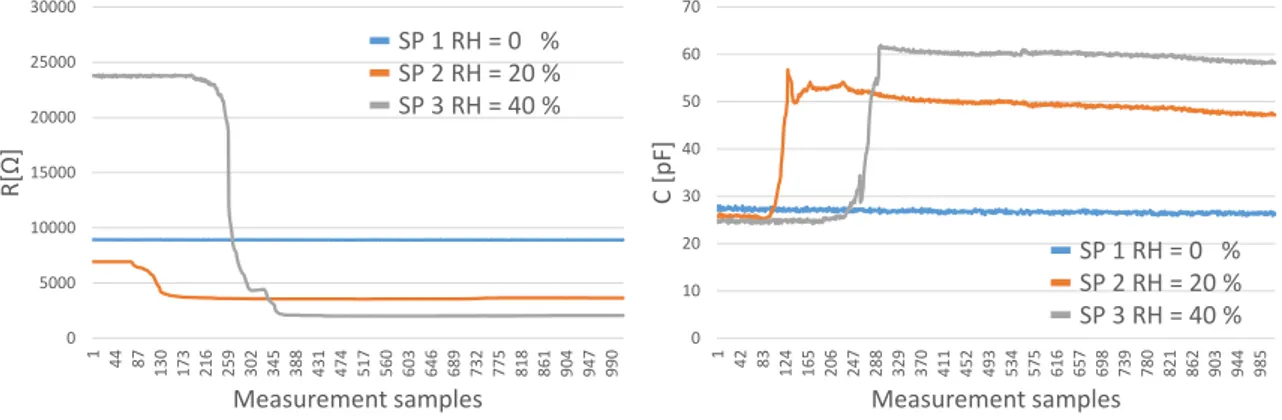
• Test with SP system: for this phase three different SP devices have been adopted and a sensitivity analysis of the impedance dependence on soil relative humidity and bacteria concentration has been conducted.
As introduced, both phases have involved the soil used as filtering material provided by CDB. More in detail, soils with different concentration of bacteria have been adopted for the experiments reported in the following.
2.6.1
Test with reference instrument
Two soils at different bacteria concentrations (7.26 × 10⁶#/ml and 2.93 × 10⁶#/ml) and at 15%
of relative humidity have been used for this phase and the LCR meter Quadtech 7600 has been adopted as reference instrument. Resistance and capacitance values, calculated according to
a parallel equivalent circuit, are reported in Figure2.18. Both for resistance and capacitance
a decreasing trend with respect to frequency has been obtained. Furthermore, the higher the bacteria concentration the greater the resistance and capacitance values. According to this result, the presence of bacteria decrease the soil conductivity allowing, in such a way, to monitor the filtering capability. An analysis of the dispersion index (DI), calculated according to equation
2.10, has been conducted and obtained results are reported in Figure2.19. As shown, DI values
lower than 1.5% are obtained for resistance and lower than 10% for capacitance except for the first frequency (1 kHz).
DI[%] =σ
µ × 100 (2.10)
2.6.2
Test with SP system
In order to analyze the behavior of the impedance measurements performed with SENSIPLUS chip, three phases have been considered: