2019
Publication Year
2020-12-21T11:49:30Z
Acceptance in OA@INAF
The AGN fuelling/feedback cycle in nearby radio galaxies I. ALMA observations
and early results
Title
RUFFA , ILARIA; PRANDONI, ISABELLA; Laing, Robert A.; Paladino, Rosita;
PARMA, PAOLA; et al.
Authors
10.1093/mnras/stz255
DOI
http://hdl.handle.net/20.500.12386/29050
Handle
MONTHLY NOTICES OF THE ROYAL ASTRONOMICAL SOCIETY
Journal
484
Number
1
APPENDIX A: ANCILLARY DATA
We provide here a brief description of the archival radio and optical images referred to in this paper.
A1 VLA
A1.1 Observations and data reduction
In order to compare the core and jet emission detected at 230 GHz with that visible at lower frequencies, we extracted VLA data at 4.9, 8.5 or 14.9 GHz for our target sources from the NRAO archive. These frequencies were chosen to give a reasonable compromise between high resolution (to match our ALMA images as closely as possible) and sensitivity to extended structure. The datasets are inevitably heterogeneous, with wide ranges of resolution, uv cov-erage and integration time. In particular, the only data available for NGC 612 have very low spatial resolution. We calibrated the archival data using standard methods, with the flux-density scale set using observations of 3C 48 or 3C 286. Polarization leakage was calibrated for NGC 612 and IC 4296 and the absolute E-vector polarization position angle was set for these sources using observa-tions of 3C 286. For NGC 3557, we combined data from three VLA configurations and for NGC 7075 and ESO443 G024 we show im-ages with two combinations of frequency and resolution; in all other cases useful data were only available for a single configuration and frequency. All of the datasets were self-calibrated in phase and am-plitude and the final images were made using single or multi-scale depending on the complexity of the brightness distribution. The datasets and image parameters are listed in TableA1. We dis-play the linear polarization as vectors with lengths proportional to the degree of polarization, p = P/I, where P and I are polarized and total intensity, respectively, orientated along the local E-vector direction.
The highest-resolution images available are plotted together with the corresponding 230-GHz images in Figure 1. Lower-resolution images of four sources, ESO443 G024, IC 4296, NGC 612 and NGC 7075, are significantly deeper than any pub-lished to date and/or include linear polarization for the first time. These are therefore shown below (Fig.A1–A3).
A1.2 NGC 612
The image of NGC 612 shown in FigureA1was made from the same dataset as that analysed byMorganti et al.(1993), but has a significantly lower rms noise level. In addition, linear polarization has been calibrated and the image has been corrected for attenuation by the primary beam. The effects of Faraday rotation on the degree and direction of polarization are 4.9 GHz are very small (Kaczmarek et al. 2018). The apparent magnetic field direction (orthogonal to the plotted vectors) is circumferential in both lobes and transverse in the jets.
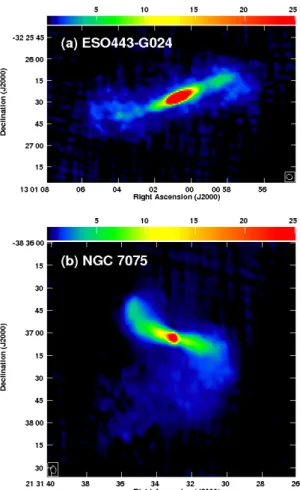
A1.3 ESO443 G024 and NGC 7075
The 4.9-GHz images of ESO443-G024 and NGC 7075 (Fig.A2) show the overall structures of the sources, both of which have lobed twin-jet FR I morphologies. The jet structure of ESO443-G024 is symmetrical on large scales (Fig.A2a); side-to-side asymmetry on scales of a few arcseconds is evident from Fig. 1(f), indicating that the NW jet is approaching. For NGC 7075, the base of the NE jet appears brighter even at low resolution (Fig.A2b) and only the NE
Figure A1. VLA images of NGC 612 at 4.9 GHz. (a) Total intensity in the
range 0 – 20 mJy beam 1. The circular pattern visible on the right-hand side
of the plot is an artefact caused by the correction for primary-beam atten-uation. (b) E-vectors with lengths proportional to degree of polarization, p = P/I, superimposed on total intensity. The vector scale is indicated by the labelled bar.
(approaching) side is visible in the high-resolution VLA and ALMA images (Fig. 1h).
A1.4 IC 4296
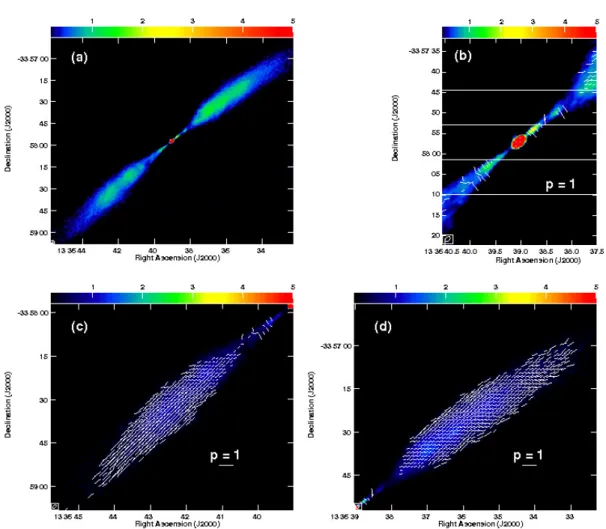
This source was studied in detail byKilleen et al.(1986), but they did not present images for their highest-resolution 4.9-GHz dataset, which we have therefore re-reduced. The resulting total-intensity images, shown in Fig.A3, have a resolution of 1.58 ⇥ 0.93 arcsec2 and show the jet bases in detail. The jets are unusually symmetrical and are likely to be close to the plane of the sky. The Faraday rota-tions estimated for the jets byKilleen et al.(1986) are in the range 40 – 0 rad m 2, implying that the magnitude of the rotation of the observed E-vectors from their intrinsic directions is <⇠8 . The apparent magnetic field within ⇡20 arcsec of the core (Fig.A3b) is therefore aligned with the axis on both sides of the nucleus. FigsA3(c) and (d) show polarization vectors for the SE and NW jets, respectively. The magnetic-field structure farther from the core than the flaring points at ⇡20 arcsec is remarkably uniform, with an apparent field direction orthogonal to the jet axis and p ⇡ 0.3 0.5. IC 4296 and 3C 449 (Feretti et al. 1999) have remarkably symmetri-cal jet intensity and polarization distributions, consistent with their axes being close to the plane of the sky (e.g.Laing & Bridle 2014).
A2 HST
To investigate the dust-CO connection, we downloaded HST im-ages (available only for NGC 3557 and IC 4296) from the Hubble MNRAS 000, 000–000 (0000)
2
Table A1. Archival VLA data used in this study.
Name Code Date t Config ⌫ ⌫ ✓maj ✓min PA RMS
(s) (MHz) (MHz) (arcsec) (deg) (µJy beam 1)
(1) (2) (3) (4) (5) (6) (7) (8) (9) (10) (11) IC 1531 AH640 1998 06 19 40 A 8460.1 100.0 0.58 0.23 3.4 210 NGC 612 AK135 1985 10 29 12700 C/D 4860.1 100.0 13.00 13.00 29 PKS 0718 34 AL508 1999 10 18 45 A/B 8460.1 100.0 2.29 0.58 14.9 220 NGC 3100 AD270 1991 07 21 260 A 4860.1 100.0 0.90 0.32 6.9 140 NGC 3557 AB289 1984 12 14 1640 A 4876.1 50.0 1.38 0.35 12.4 53 AW136 1985 06 22 340 B/C 4860.1 100.0 AB377 1987 02 16 14120 C/D 4860.1 100.0 ESO443 G024 AJ141 1986 10 04 169 B/C 4860.1 100.0 4.13 3.62 65.9 200 AM141 1985 02 18 460 A 14938.7 100.0 0.60 0.60 970 IC 4296 AE016 1982 07 09 20200 A/B 4872.6 25.0 1.58 0.93 46.8 55 NGC 7075 AH640 1998 05 18 530 A 8460.1 100.0 0.79 0.22 2.1 270 AG478 1996 01 30 35 B/C 4860.1 100.0 5.06 3.59 9.7 110 IC 1459 AG674 2004 09 07 240 A 8460.1 100.0 0.80 0.17 22.2 210
Notes. Columns: (1) Source name.(2) VLA proposal code. (3) Date of observation. (4) On-source integration time (scaled to 27 antennas). (5) VLA configuration (A/B, B/C and C/D are hybrid configurations with a long N arm).(6) Centre reference frequency. (7) Total bandwidth. (8) Beam major axis. (9) Beam minor axis. (10) Beam position angle. (11) Rms image noise level for I.
Figure A2. 4.9-GHz VLA images of (a) ESO443-G024 and (b) NGC 7075.
Legacy Archive at the Canadian Astronomy Data Centre (CADC)1.
1 http://www.cadc-ccda.hia-iha.nrc-cnrc.gc.ca/en/hsthla/
This provides enhanced HST image products with an absolute as-trometric accuracy ⇡0.3 arcsec.
Both galaxies were observed with the HST Wide-Field and Planetary Camera 2 (WFPC2) through the F555W optical filter ( ⇡472 595 nm). The final image products have a pixel scale of 0.1 arcsec pixel 1and an image FWHM of 0.08 arcsec. NGC 3557 was observed on 1997 March 10 with a total on-source time of 1900 s (proposal ID: 6587), IC 4296 on 1997 July 16 with a total exposure time of 1700 s (proposal ID: 6587). Both images are documented byLauer et al.(2005) and were subsequently used byBalmaverde & Capetti(2006).
The HST images of NGC 3557 and IC 4296 are discussed in Section 6.4 and presented in Figure 11, where they are overlaid on CO integrated intensity maps.
A3 Other optical images
Archival optical images from ground-based telescopes were also available for NGC 612 and NGC 3100 (Fig. 12).
We retrieved the NGC 612 optical image from NED2. It was observed with the UK Schmidt Telescope on 1977 September 18 at ⇡ 468 nm, with a total exposure time of 4500 s. The pixel scale is 1.7 arcsec pixel 1. The B I image was derived byVéron-Cetty & Véron(2001) from CCD images taken with EFOSC on the ESO 3.6m Telescope.
The optical images of NGC 3100 were retrieved from the Carnegie-Irvine Galaxy Survey (CGS) database3. NGC 3100 was observed with the Tek5 CCD camera of the du Pont 2.5-meter telescope at Las Campanas Observatory on 2004 April 19. The ob-servations were made using four filters (Harris B, V, R and I; from 300 to 1100 nm). The exposure times were 120 – 360 s in each filter, with resolutions ranging from 0.77 arcsec (B) to 0.62 arcsec (I).
The multi-wavelength set of optical images available for
2 https://ned.ipac.caltech.edu
3 https://cgs.obs.carnegiescience.edu/CGS/Home.html
3
Figure A3. VLA images of IC 4296 at 4.9 GHz. (a) Total intensity. (b) E-vectors with lengths proportional to degree of polarization, p = P/I, superimposed
on total intensity for the inner jets. (c) and (d) As (b), but for larger regions around the SW and NE jets, respectively. The vector scales in panels (b) – (d) are indicated by the labelled bars.
NGC 3100 were used to produce a B-I colour map (bottom-right inset of Fig. 12a). Followingde Koff et al.(2000) andde Ruiter et al.(2002), we first scaled the B image (where the dust absorption is most prominent) for the mean magnitude value measured in the I image (where the dust absorption is smallest), and then divided the B by the I image. In the resulting image we assumed that dust absorption features are present where the pixel values are 0.85 (i.e. where at least 15% of the emission is absorbed). In regions without absorption, the pixel values are close to unity.
REFERENCES
Balmaverde B., Capetti A., 2006,A&A,447, 97
Feretti L., Perley R., Giovannini G., Andernach H., 1999, A&A,341, 29
Kaczmarek J. F., Purcell C. R., Gaensler B. M., Sun X., O’Sullivan S. P., McClure-Griffiths N. M., 2018,MNRAS,476, 1596
Killeen N. E. B., Bicknell G. V., Ekers R. D., 1986,ApJ,302, 306
Laing R. A., Bridle A. H., 2014,MNRAS,437, 3405
Lauer T. R., et al., 2005,AJ,129, 2138
Morganti R., Killeen N. E. B., Tadhunter C. N., 1993,MNRAS,263, 1023
Véron-Cetty M. P., Véron P., 2001,A&A,375, 791
de Koff S., et al., 2000,ApJS,129, 33
de Ruiter H. R., Parma P., Capetti A., Fanti R., Morganti R., 2002,A&A,
396, 857