2020-12-21T09:59:44Z
Acceptance in OA@INAF
The AGN fuelling/feedback cycle in nearby radio galaxies II. Kinematics of the
molecular gas
Title
RUFFA , ILARIA; Timothy A. Davis; PRANDONI, ISABELLA; Robert A. Laing;
Paladino, Rosita; et al.
Authors
10.1093/mnras/stz2368
DOI
http://hdl.handle.net/20.500.12386/29031
Handle
MONTHLY NOTICES OF THE ROYAL ASTRONOMICAL SOCIETY
Journal
489
Number
Advance Access publication 2019 August 26
The AGN fuelling/feedback cycle in nearby radio galaxies – II. Kinematics
of the molecular gas
Ilaria Ruffa ,
1,2‹Timothy A. Davis ,
3Isabella Prandoni ,
2Robert A. Laing,
4Rosita Paladino,
2Paola Parma,
2Hans de Ruiter,
2Viviana Casasola,
2Martin Bureau
5,6and Joshua Warren
51Dipartimento di Fisica e Astronomia, Universit`a degli Studi di Bologna, via P. Gobetti 93/2, I-40129 Bologna, Italy 2INAF - Istituto di Radioastronomia, via P. Gobetti 101, I-40129 Bologna, Italy
3School of Physics & Astronomy, Cardiff University, Queens Buildings, The Parade, Cardiff CF24 3AA, UK
4Square Kilometre Array Organisation, Jodrell Bank Observatory, Lower Withington, Macclesfield, Cheshire SK11 9DL, UK
5Sub-department of Astrophysics, Department of Physics, University of Oxford, Denys Wilkinson Building, Keble Road, Oxford OX1 3RH, UK 6Yonsei Frontier Lab and Department of Astronomy, Yonsei University, 50 Yonsei-ro, Seodaemun-gu, Seoul 03722, Republic of Korea
Accepted 2019 August 21. Received 2019 August 17; in original form 2019 June 19
ABSTRACT
This is the second paper of a series exploring the multicomponent (stars, warm and cold gas, and radio jets) properties of a sample of 11 nearby low-excitation radio galaxies, with the aim of better understanding the active galactic nuclei (AGN) fuelling/feedback cycle in these objects. Here, we present a study of the molecular gas kinematics of six sample galaxies detected in 12CO(2-1) with the Atacama Large Millimeter/submillimeter Array (ALMA).
In all cases, our modelling suggests that the bulk of the gas in the observed (sub-)kpc CO discs is in ordered rotation. Nevertheless, low-level distortions are ubiquitous, indicating that the molecular gas is not fully relaxed into the host galaxy potential. The majority of the discs, however, are only marginally resolved, preventing us from drawing strong conclusions. NGC 3557 and NGC 3100 are special cases. The features observed in the CO velocity curve of NGC 3557 allow us to estimate a supermassive black hole (SMBH) mass of (7.10 ± 0.02) × 108M", in agreement with expectations from the MSMBH–σ∗relation. The rotation pattern
of NGC 3100 shows distortions that appear to be consistent with the presence of both a position angle and an inclination warp. Non-negligible radial motions are also found in the plane of the CO disc, likely consistent with streaming motions associated with the spiral pattern found in the inner regions of the disc. The dominant radial motions are likely to be inflows, supporting a scenario in which the cold gas is contributing to the fuelling of the AGN.
Key words: galaxies: active – galaxies: elliptical and lenticular, cD – galaxies: evolution – galaxies: ISM – galaxies: nuclei.
1 I N T RO D U C T I O N
Active galactic nuclei (AGN) are associated with the accretion of material on to supermassive black holes (SMBHs), located at the centres of their host galaxies. It is now widely believed that AGN activity plays an important role in shaping galaxies over cosmic time, with AGN feedback being responsible for changing the physical conditions of the surrounding interstellar medium (ISM) or expelling it from the nuclear regions, thus impacting the star
"E-mail:[email protected]
formation processes and the subsequent evolution of the host galaxy (e.g. Garc´ıa-Burillo et al.2014; Combes2017; Harrison2017)
In the local Universe, two main AGN modes are commonly discussed, differentiated by the nature of the dominant energetic output (i.e. feedback; for a review see e.g. Fabian2012). The first is the so-called radiative mode (also known as quasar or wind mode), whereby the accretion occurs at high rates (! 0.01 ˙MEdd, where
˙
MEddis the Eddington accretion rate1) through an optically thick and geometrically thin accretion disc (Shakura & Sunyaev1973).
1M˙Edd= 4πGMSMBHmp/εcσT, where G is the gravitational constant,
MSMBH is the mass of the central SMBH, mpis the mass of the proton,
Downloaded from ht tps: //academic. oup. com/ mnras/ art icle/ 489/ 3/ 3739/ 5554765 by INA F T riest e (O sservat orio A st ronomico di T riest e), prandoni@ira. inaf .it on 06 November 2020
The accretion process in this type of AGN is radiatively efficient, so the dominant energetic output is in the form of electromagnetic radiation produced by the efficient conversion of the potential energy of the gas accreted by the SMBH. The second AGN mode is the kinetic mode, whereby the accretion process occurs in a radiatively inefficient way (i.e. little radiated energy), and the dominant energetic output is in kinetic form through the radio jets (e.g. Merloni & Heinz2007). In this AGN mode, material is accreted at low rates (% 0.01 ˙MEdd), with the classic geometrically thin accretion disc either absent or truncated at some inner radius and replaced by geometrically thick, optically thin structures such as advection-dominated accretion flows (e.g. Narayan & Yi1995). Kinetic-mode objects are a very intriguing class of AGN: they lack all the observational features typical of ‘conventional’ AGN (e.g. there is no clear evidence for the presence of the infrared-emitting dusty torus, accretion-driven emission lines are absent in their optical spectra, etc.), indicating they may represent a distinct class of sources, with a distinct formation history.
In the local Universe, radio galaxies (RGs), which by definition show strong kinetic (jet-induced) feedback, can be divided into two main classes according to their optical spectra (e.g. Heck-man & Best2014). High-excitation radio galaxies (HERGs) have spectra showing strong, quasar/Seyfert-like emission lines and are radiatively efficient, thereby producing radiative as well as kinetic feedback. Low-excitation radio galaxies (LERGs) show no or weak, LINER (low-ionization nuclear emission-line region)-like emission lines in their optical spectra and their feedback is almost entirely kinetic. Locally, LERGs are the dominant RG population (e.g. Hardcastle, Evans & Croston2007) and they are typically hosted by very massive early-type galaxies (ETGs), with absolute K-band magnitude MK ≤ −25 mag (corresponding to M∗ ≥ 1011 M"; e.g. Best & Heckman2012). Despite their prevalence, however, the trigger mechanisms of these objects and associated AGN feed-ing/feedback processes are still poorly understood (e.g. Hardcastle
2018): investigating the nature of LERGs is thus crucial to shed light on the mechanisms that determine the observed properties of massive ETGs in the local Universe.
LERGs are generally dominated by an old stellar population, already formed at z = 2 (e.g. Thomas et al.2005; Greene et al.2015). Their red optical colours place them in the so-called red sequence in the optical colour–magnitude diagram (e.g. Faber et al.2007; Salim et al.2007). For this reason, these objects have traditionally been believed to be mostly devoid of cool ISM reservoirs. This has been one of the strongest argument favouring the hypothesis that LERGs are powered by accretion directly from the hot phase of the intergalactic medium (e.g. Hardcastle et al.2007) through Bondi spherical accretion (Bondi1952). Although too simplistic in describing the circumnuclear environment of kinetic-mode AGN, the hot accretion scenario was initially supported by the finding of a correlation between the jet power in LERGs and the Bondi accretion rate (Allen et al.2006; Balmaverde, Baldi & Capetti2008; Russell et al.2013).
Over the past decade, however, this ‘hot-mode’ picture has been partly questioned. On the theoretical side, more realistic models for the accretion process in LERGs have been proposed on the basis of different numerical simulations and are now referred to as
chaotic cold accretionmodels (e.g. King & Pringle2007; Wada, Papadopoulos & Spaans2009; Nayakshin, Power & King2012;
εis the accretion efficiency, c is the speed of light, and σT is the
cross-section for Thomson scattering.
Gaspari, Ruszkowski & Oh2013; Gaspari, Brighenti & Temi2015; King & Nixon 2015; Gaspari, Temi & Brighenti 2017). In this mechanism, the hot gas from the galaxy halo cools because of turbulence to temperatures lower than 103K prior to the accretion on to the SMBH. Hints of cold gas clouds falling towards active nuclei have recently been observed in some objects (e.g. Tremblay et al.
2016; Maccagni et al.2018), providing support for this hypothesis. Observationally, cold (atomic and molecular) gas and dust are often detected in LERGs, with masses that are potentially capable of powering the jets by accretion (MH2∼ 107–1010 M"; e.g. Okuda
et al.2005; Prandoni et al.2007,2010; Oca˜na Flaquer et al.2010; Ruffa et al.2019).
The presence of cold gas alone is not a direct evidence of fuelling, however. For example, the cold gas in 3C 31 (the prototypical LERG) is found to be mostly in ordered rotation and stable orbits (Okuda et al.2005; North et al., in preparation): in cases like this, the accretion rate may be relatively low. Furthermore, the few existing spatially resolved studies of molecular gas in radio-loud objects show that the molecular gas is outflowing or interacting with the radio jets, rather than infalling (e.g. Alatalo et al.2011; Combes et al. 2013; Oosterloo et al.2017). Indeed, jets expanding into the surrounding material can create shells of shocked gas that are pushed away from the jet axis, resulting in lateral expansion (i.e. outflow; Wagner, Bicknell & Umemura2012). Another possible form of interaction could be entrainment of the molecular gas, causing fragmentation of the gas clouds and jets’ deceleration from relativistic speeds (e.g. Laing & Bridle2002). In both cases, however, the jet–cold gas mutual interplay leaves clear signs in the gas distribution and kinematics (i.e. clumpy/disrupted morphology, kinematic distortions/asymmetries). Resolved studies of LERGs are currently very sparse: detailed investigation of the physical and kinematic properties of the cold gas in the nuclear regions of these objects would represent a fundamental step for-ward in our understanding on the fuelling/feedback mechanism in LERGs.
We aim to carry out an extensive, multiphase study of the various galaxy components (stars, warm and cold gas, radio jets) to get a better understanding of the AGN fuelling/feedback cycle in LERGs. Our specific project is a systematic study of a complete volume- and flux-limited (z < 0.03, S2.7 GHz≤ 0.25 Jy) sample of 11 LERGs in the southern sky (Ruffa et al.2019, hereafterPaper I). InPaper I, we presented Atacama Large Millimeter/submillimeter Array (ALMA) Cycle 312CO(J = 2-1) and 230 GHz continuum observations of nine objects, at spatial resolutions of few hundreds of parsec. Our work shows that rotating (sub-)kpc molecular discs are very common in LERGs: six out of nine sources observed with ALMA have been detected in CO. We present here the 3D modelling of these six CO discs. The paper is structured as follows. In Section 2, we briefly summarize the ALMA obser-vations used in this work. The general method used to model the CO(2-1) discs is described in Section 3. Details of the mod-elling of individual sources are reported in Section 4. We discuss the results in Section 5, before summarizing and concluding in Section 6.
Throughout this work, we assume a standard %CDM cosmology with H0= 70 km s−1Mpc−1, &%= 0.7, and &M= 0.3.
2 A L M A O B S E RVAT I O N S
Full details of our ALMA observations and data reduction can be found inPaper I; a brief summary is presented here.
Downloaded from ht tps: //academic. oup. com/ mnras/ art icle/ 489/ 3/ 3739/ 5554765 by INA F T riest e (O sservat orio A st ronomico di T riest e), prandoni@ira. inaf .it on 06 November 2020
Table 1. Main properties of the ALMA12CO(2-1) data sets used in this paper.
Radio source Host galaxy z MRS θmaj θmin PA Scale νsky(vcen) rms S/N )vchan
(kpc, arcsec) (arcsec) (deg) (pc) (GHz) (km s−1) (mJy beam−1) (km s−1)
(1) (2) (3) (4) (5) (6) (7) 8 (9) (10) (11) (12) PKS 0007-325 IC 1531 0.0256 5.6, 10.9 0.7 0.6 87 360 224.7774 (7702) 0.7 18 20 PKS 0131-31 NGC 612 0.0298 6.6, 11.0 0.3 0.3 − 75 180 223.8426 (8974) 1.3 14 20 PKS 0958-314 NGC 3100 0.0088 1.9, 10.6 0.9 0.7 − 87 160 228.6299 (2484) 0.6 45 10 PKS 1107-372 NGC 3557a 0.0103 2.5, 10.7 0.4 0.4 − 57 90 228.2319 (2999) 0.7 21 22 PKS 1333-33 IC 4296 0.0125 2.8, 10.8 0.6 0.6 − 84 150 227.7110 (3705) 0.2 8 40 PKS 2128-388 NGC 7075 0.0185 4.1, 10.8 0.6 0.6 − 76 230 226.4196 (5483) 0.4 10 40
Notes.Columns: (1) Name of the radio source. (2) Host galaxy name. (3) Galaxy redshift from the NASA/IPAC Extragalactic Database. (4) Maximum recoverable scale in kiloparsec for the array configuration, and corresponding scale in arcseconds. (5) Major axis full width at half-maximum (FWHM) of the synthesized beam. (6) Minor axis FWHM of the synthesized beam. (7) Position angle of the synthesized beam. (8) Spatial scale corresponding to the major
axis FWHM of the synthesized beam. (9)12CO(2-1) redshifted (sky) centre frequency estimated using the redshift listed in column (3); the corresponding
velocity (vcen; LSRK system, optical convention) is reported in parentheses. (10) 1σ rms noise level of the CO channel map measured in line-free channels at
the channel width listed in column (12). (11) Peak S/N of the detection. (12) Final channel width of the data cube (km s−1in the source frame).
aThe parameters listed here refer to the combined Cycle 3 and Cycle 6 data of NGC 3557 (see Section 2.1 for details).
CO(2-1) ALMA observations were taken during Cycle 3, be-tween 2016 March and July (PI: I. Prandoni). The CO(2-1) line (rest frequency 230.5380 GHz) was observed using the high-resolution correlator configuration (1920 1.129 MHz-wide channels), pro-viding about three raw channels in a 5 km s−1 bin. The array configurations provide spatial resolutions (at ≈230 GHz) ranging from ≈0.3 to ≈0.9 arcsec, corresponding to few hundreds of parsecs at the redshift of our sources. Titan and Pallas were used as primary flux calibrators; bright quasars were observed as standards if no Solar system object was available.
The data were calibrated and imaged using the Common Astron-omy Software Application (CASA; McMullin et al.2007) package, version 4.7.2. The continuum-subtracted CO data cubes were produced using the clean task with natural weighting (seePaper I
for details). The final channel widths range from 10 to 40 km s−1, chosen to achieve the best compromise between the signal-to-noise ratio (S/N) and the sampling of the line profiles.
2.1 Archival ALMA data
Higher resolution CO(2-1) ALMA data of one of our sample sources (NGC 3557) were taken during Cycle 4 and are now publicly available in the ALMA archive (project 2015.1.00878.7, PI: Barth). The CO(2-1) disc of NGC 3557 is barely resolved at the resolution of our Cycle 3 ALMA observations (0.6 arcsec + 130 pc;Paper I). To better constrain the kinematics of the molecular gas, in this work we combined the two data sets.
The Band 6 archival data of NGC 3557 were taken in 2016 July. The spectral window centred on the redshifted frequency of the CO(2-1) line is composed of 480 3.906 MHz-wide channels. 39 12-m antennas were arranged in an extended configuration, with a maximum baseline length of 1.1 km. The achieved spatial resolution is ≈0.4 arcsec (≈90 pc). We calibrated the data manually, using the same approach as for the other observations (seePaper Ifor details). The archival data were then combined with our observations, using theCASAtask concat. A continuum-subtracted CO data cube of
the combined data set was then produced using the clean task with Briggs weighting (robust = 0.5), and a final channel width of 22 km s−1. The sensitivity (determined in line-free channels) is 0.7 mJy, and the achieved angular resolution is 0.44 arcsec (about 1.4 times higher than that of our observations alone; Table1). The analysis reported in the following is carried out using this combined data cube.
A summary of some relevant properties of the six 12CO(2-1) detections, the ALMA observations, and the CO channel maps used in this paper is presented in Table1.
2.2 Data products
The 3D imaging data products (moment maps and position–velocity diagrams (PVDs)) used in this work were created from the cleaned, continuum-subtracted CO data cubes using the masked moment technique as described by Dame (2011) (see also Bosma1981a,b; van der Kruit & Shostak1982; Rupen1999). In this technique, a copy of the cleaned data cube is first Gaussian smoothed spatially (with an FWHM equal to that of the synthesized beam) and then Hanning smoothed in velocity. A 3D mask is then defined by selecting all the pixels above a fixed flux density threshold; this threshold is chosen to recover as much flux as possible while minimizing the noise. We used thresholds varying from 1.2 to 2σ , depending on the significance of the CO detection (higher threshold for noisier maps). The moment maps were then produced from the unsmoothed cubes using the masked regions only (e.g. Davis et al.2017). The integrated intensity, mean velocity, and velocity dispersion maps of the objects analysed here are presented and discussed in detail inPaper I. The mean velocity and PVD of NGC 3557 as extracted from the combined data cube (see Section 2.1 for details) are shown later in Fig.5.
3 K I N E M AT I C M O D E L L I N G : G E N E R A L D E S C R I P T I O N
We analyse the kinematics of the six CO detections by adopting a forward-modelling approach, using the publicly available KINE
-MATICMOLECULARSIMULATIONtool (KINMS2; Davis et al.2013).
This routine allows us to input guesses for the gas distribution and kinematics, and produces mock ALMA cubes with the same beam, pixel size, and channel width as the observed ones, taking into account the observational effects of disc thickness, beam smearing, gas velocity dispersion, etc. The simulated data cube is generated by calculating the line-of-sight projection of the circular velocity for a defined number (105–106) of point-like sources that represent the
2https://github.com/TimothyADavis/KinMS Downloaded from ht tps: //academic. oup. com/ mnras/ art icle/ 489/ 3/ 3739/ 5554765 by INA F T riest e (O sservat orio A st ronomico di T riest e), prandoni@ira. inaf .it on 06 November 2020
gas distribution. Additional velocity contributions can be added to take into account the velocity dispersion and non-circular motions. The KINMS routines are coupled with the Markov chain Monte
Carlo (MCMC) code (KINMS MCMC3) that fits the data and outputs the full Bayesian posterior probability distribution, together with the best-fitting model parameter.
The purpose of carrying out the CO 3D modelling is to investigate the dynamical state of the molecular gas and derive its physical pa-rameters. In particular, we are interested in searching for kinematic signatures that can be related to the AGN, such as deviations from circular motions (i.e. inflow/outflow). To this end, we initially adopt for all the sources the simple geometrical model described in the next subsection.
3.1 Gas distribution and kinematics
One of the inputs of the KINMS models is an arbitrary parametric function that describes the surface brightness of the gas disc as a function of the radius. At the resolution of our ALMA observations, the gas surface brightness profiles turn out to be reasonably well described by a Gaussian function. The Gaussian centre and width are left free to vary in the KINMS MCMC fit. Additional free
parameters of the gas disc are the integrated flux, position angle (PA), inclination (i), and kinematic centre (in RA, Dec., and velocity). The inclination and position angles are initially fitted as single values throughout the disc. The CO disc is assumed to be thin and the model axisymmetric.
We fit the CO rotation curves using the simplest model that provides a good fit to most rotation curves on ∼kpc scales (e.g. Swinbank et al.2012; van de Voort et al.2018). We assume that it follows an arctangent function of the form
vrad= 2vflat π arctan ! R rturn " , (1)
where vflatis the asymptotic (or maximum) circular velocity in the flat part of the rotation curve, R is the radius, and rturnis the effective radius at which the rotation curve turns over (e.g. van de Voort et al.
2018). Both vflatand rturnare left as free parameters in the fitting process, in order to find the best match to the observed gas velocity curves.
As a first step, we always assume that the gas is in purely circular motion (i.e. the rotation velocity varies only radially). This approach allows us to identify the possible presence of non-circular motions, if significant residuals (i.e. larger than the channel width) are found between the data and the model velocity fields. Another free parameter is the internal velocity dispersion of the gas (σgas), assumed to be spatially constant.
3.2 Fitting process
To fit the model to the data, we use the KINMS MCMC code, which utilizes Gibbs sampling and adaptive stepping to explore the parameter space. To measure the goodness of fit of the model to the data, we utilize a log-likelihood based on the chi-squared statistic χ2=# i ! datai− modeli σi "2 = 1 σ2 # i (datai− modeli)2, (2) where the sum is performed over all the pixels within the region of the data cube that the model fits, and σ is the rms noise level
3https://github.com/TimothyADavis/KinMS MCMC
measured in line-free channels of the data cube (see Table 1), assumed to be constant for all the pixels. The posterior distribution of each model is then described by the log-likelihood function ln
P = −χ2/2. As in Smith et al. (2019), we rescale the uncertainty in the cube by a factor of (2N)0.25, where N is the number of pixels with detected emission in the mask, as defined in Section 2. This ensures that the uncertainty in the χ2statistics for high N does not lead to unrealistically small uncertainties in our final fit values.
To ensure our kinematic fitting process converges, we set rea-sonable priors for the physical parameters that are left free to vary in the fit. The CO central velocity offset (i.e. the shift with respect to the kinematic centre) is allowed to vary within ±5 times the channel widths of each data cube (listed in Table1). The gas velocity dispersion (σgas) is constrained to be less than the maximum line-of-sight velocity width presented inPaper I. The kinematic PA is allowed to vary by ±20◦around the values estimated inPaper I (table 7). The disc inclination (θinc) is initially left free to vary over the full physical range (0–90◦); in subsequent iterations, it is constrained to vary within ±20◦of the value at which the first chain converges. The CO maximum circular velocity (vflat) and the turnover radius (rturn) are constrained to lie within ±40 km s−1and two beam widths, respectively, around the values determined by visually inspecting the PVDs of the six CO discs.
Initially, the step size in each fit is adaptively scaled to ensure a minimum acceptance fraction and the chain converges. Once the MCMC chains converged, we re-run the entire chain for an additional 105steps to produce the full final posterior probability distribution. For each model parameter, these probability surfaces are then marginalized over to produce a best-fitting value (median of the marginalized posterior distribution) and associated 68 and 99 per cent confidence levels (CLs).
4 K I N E M AT I C M O D E L L I N G : I N D I V I D UA L S O U R C E S
At the resolution of our ALMA observations (Table1), the majority of the CO discs are only marginally resolved, so that the simple geometrical model described earlier reproduces reasonably well the bulk of the observed gas structures. Nevertheless, modifications to that basic model, such as inclusion of warps or an inner surface brightness cut-off, are required in some cases to reproduce the gas distribution and kinematics accurately. In Sections 4.1–4.4, we describe the modelling details for the four individual sources where no or minor modifications to the model are required to get a good fit to the data. The best-fitting parameters, associated errors (including only random uncertainties at 99 per cent CL), and the reduced chi-squared (χ2
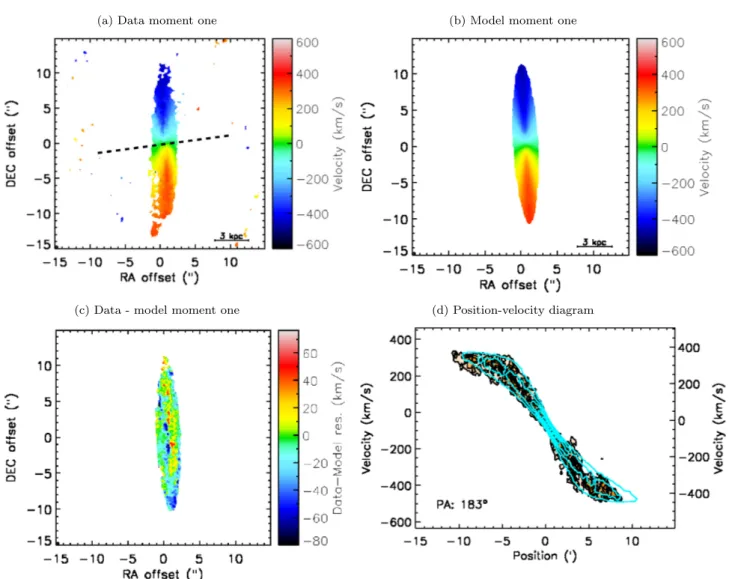
red)4 of the models adopted for these four objects are listed in Table 2. The upper panels of Figs1–4compare the observed and modelled mean velocity maps (moment 1; panels a and b). The lower panels of Figs1–4show the data − model residual moment 1 map (panel c) and the major axis PVD with the best-fitting model overplotted (cyan contours; panel d).
NGC 3557 and NGC 3100 are special cases: the asymmetries observed in both their morphology and kinematics require a more complex approach, discussed separately in Sections 4.5 and 4.6.
4χ2
red= χ2/d.o.f., where d.o.f. is the number of degrees of freedom for the
adopted model. Downloaded from ht tps: //academic. oup. com/ mnras/ art icle/ 489/ 3/ 3739/ 5554765 by INA F T riest e (O sservat orio A st ronomico di T riest e), prandoni@ira. inaf .it on 06 November 2020
Table 2. Best-fitting parameters for the four sources that are adequately fitted by simple models.
Target PA θinc vflat rturn σgas voffset(vcen) Rhole χred2
(deg) (deg) (km s−1) (arcsec) (km s−1) (km s−1) (arcsec)
(1) (2) (3) (4) (5) (6) (7) (8) (9)
IC 1531 356 ± 1.0 32 ± 2.5 272 ± 29 0.07 ± 0.02 3.4 ± 2.3 − 25 ± 1.0 (7677) − 1.2
NGC 612 183 ± 0.05 81 ± 0.01 453 ± 0.04 1.2 ± 0.05 20 ± 0.02 − 95 ± 0.01 (8879) 0.3 1.2
IC 4296 240−220 68 ± 1.5 404 ± 1.5 0.01 ± 0.002 64 ± 1.5 − 16 ± 2.0 (3691) − 1.0
NGC 7075 322 ± 4.0 46 ± 1.5 446 ± 56 0.03 ± 0.02 5.1 ± 2.6 7.8 ± 3.0 (5491) − 1.1
Note:Columns: (1) Target name. (2) Kinematic position angle of the CO disc (i.e. the PA measured counterclockwise from North to the approaching side of the velocity field). This is given as a range for IC 4296, where a position angle war is included. (3) Inclination of the CO disc (i.e. angle between the observer line-of-sight and the normal to the disc plane). (4) Asymptotic (or maximum) circular velocity in the flat part of the rotation curve. (5) Effective radius at which the rotation curve turns over. (6) Gas velocity dispersion. (7) Velocity offset of the kinematic centre (i.e. offset with respect to the expected and observed velocity zero-point; the expected zero-point
corresponds to the redshifted frequency of the CO(2-1) transition listed in column (9) of Table 1). The corresponding CO central
velocity is reported in parentheses. (8) Radius of the central surface brightness cut-off. (9) Reduced χ2of the best-fitting model.
Figure 1. IC 1531 observed, model, and residual (data − model) mean velocity maps (panels a, b, and c, respectively). The black dashed line in panel (a) indicates the direction of the radio jet axis. The synthesized beam is shown in the bottom-left corner of each panel. The wedges to the right show the colour scale. East is to the left and North to the top. Velocities are measured in the source frame and the zero-point corresponds to the intensity-weighted centroid of
the CO emission (vCO; see table 5 ofPaper I). The maps are created with the masked moment technique described in Section 2.2, using a data cube with a
channel width of 20 km s−1. CO PVD (panel d) extracted within a rectangular area whose long axis is orientated along the kinematic position angle (indicated
in the bottom-left corner of the panel) and that includes all of the CO emission along the major axis. The contours of the best-fitting model are overlaid in cyan.
The x-axis indicates the position offset along the extraction axis. The y-axes indicate the velocities centred on the value reported in column (7) of Table2and
that reported in column (9) of Table1(left and right axes, respectively). The contour levels are drawn at 1, 3, 9, . . . times the 1σ rms noise level (see Table1).
Downloaded from ht tps: //academic. oup. com/ mnras/ art icle/ 489/ 3/ 3739/ 5554765 by INA F T riest e (O sservat orio A st ronomico di T riest e), prandoni@ira. inaf .it on 06 November 2020
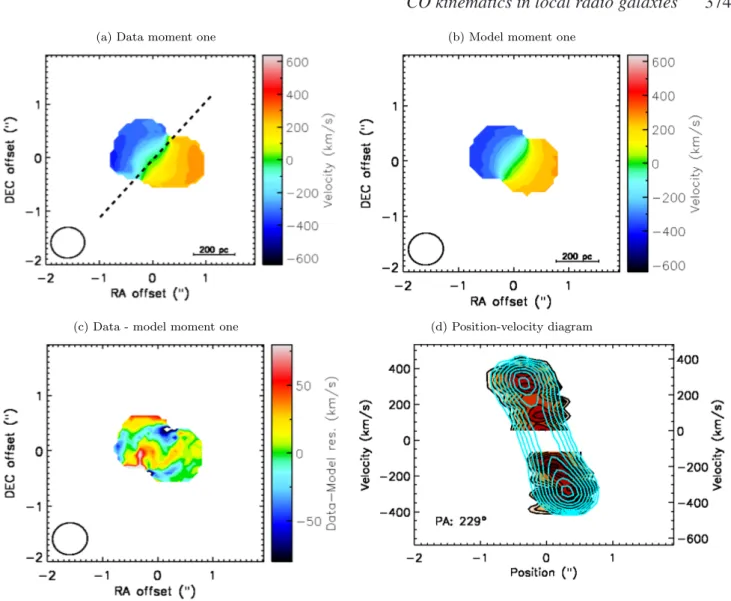
Figure 2. NGC 612 observed, model, and residual mean velocity maps and PVD as in Fig.1, created using a data cube with a channel width of 20 km s−1.
4.1 IC 1531
The barely resolved CO disc of IC 1531 mainly exhibits regular rotation pattern and morphology. Therefore, a simple axisymmetric model reproduces the observed gas features reasonably well (Fig.1). However, an s-shaped distortion is visible in the rotation pattern at ≈0.5 arcsec, along the zero-velocity iso-contour (Fig. 1a). Asymmetric structures are also present at the same position in the velocity curve, between ≈0 and ≈100 km s−1(Fig.1d). Such distortions may trace the presence of a warp and/or non-circular motions (e.g. inflow, outflow, streaming). We attempt to include both position and inclination angle warps in our model, but these are not favoured by the fitting routine. This may suggest that non-circular motions dominate, or that given the poor resolution of our data there was simply not enough information to constrain more complex models. Distortions not reproduced by the model probably give rise to the low-level residuals (≈−30 km s−1) visible in Fig.1(c) at one edge of the gas disc, at the position of the zero-velocity contour. Nevertheless, the best-fitting model in Fig.1shows no significant departures from the data, suggesting that any radial motions or asymmetries are small in amplitude and do not critically affect our analysis. Higher resolution observations are needed to investigate this object further.
4.2 NGC 612
NGC 612 is exceptional among our sources: we detect a large CO(2-1) disc extending ≈10 kpc along the major axis, with an estimated molecular gas mass of 2.0 × 10¹⁰M
"(about two order of magnitude larger than that in the other CO detections; see
Paper I).
In this case, our initial model leaves large residuals in the inner part of the disc (peak amplitudes ≈±80 km s−1). Furthermore, the sharp edges of the velocity curve (Fig. 2d) cannot be well reproduced. The best-fitting model shown in Fig. 2 is obtained assuming a ring-like CO distribution with a Gaussian surface brightness profile. The size of the central hole is left free to vary and is found to be ≈0.3 arcsec (180 pc; Table2). Some high-level residuals (peak amplitudes ≈±60 km s−1) are still visible in the central part of the gas distribution, possibly suggesting the presence of non-circular motions. Significant residuals (peak amplitudes ≈±40 km s−1) are also visible at the outer edges of the disc (Fig.2c) at the locations of the observed asymmetries (Fig.2a). These are likely to be associated with the presence of a warp. If present, this affects the disc only on the largest scales and for this reason we do not attempt to model it.
Downloaded from ht tps: //academic. oup. com/ mnras/ art icle/ 489/ 3/ 3739/ 5554765 by INA F T riest e (O sservat orio A st ronomico di T riest e), prandoni@ira. inaf .it on 06 November 2020
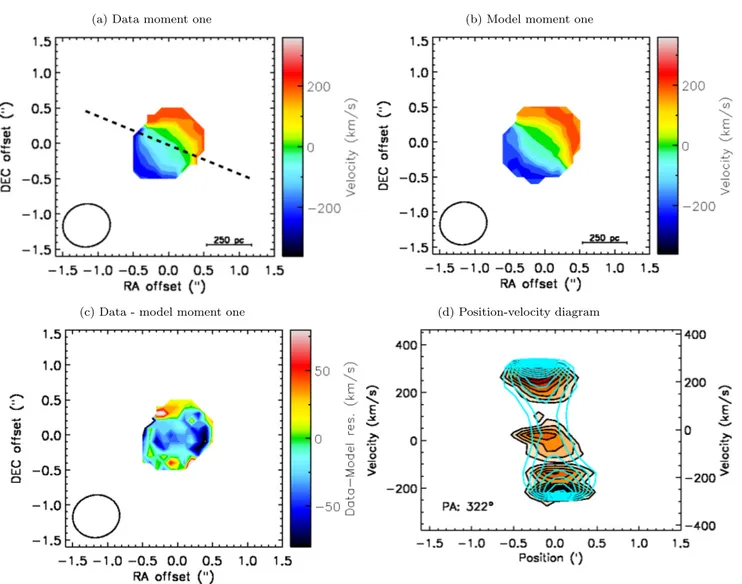
Figure 3. IC 4296 observed, model, and residual mean velocity maps and PVD as in Fig.1, created using a data cube with a channel width of 40 km s−1.
4.3 IC 4296
Although the basic model described in Section 3.1 provides a reasonable representation of the observations, the CO rotation pattern of IC 4296 is well reproduced only when accounting for the presence of a warp (Figs 3a and b). Specifically, we let the kinematic position angle vary linearly in the radial direction along the disc, finding a best-fitting range of 240–220◦(Table2). Nevertheless, low-level residuals (slightly larger than the channel width = 40 km s−1) are still visible along the disc minor axis (Fig.3c), possibly suggesting the presence of non-circular motions. It is hard, however, to establish whether such motions are truly present or not, given the resolution of the current data set (Table1). The gas distribution is well reproduced by this axisymmetric model, even though the gas disc is lopsided at its edges (Fig.3a). We note that an absorption feature against the radio core is detected in this source (seePaper I), giving rise to the hole in the gas distribution visible in the velocity curve (Fig.3d). The channels in which the CO absorption dominates are excluded from the model.
4.4 NGC 7075
The CO disc in NGC 7075 is barely resolved by our ALMA observations (see Paper I). Our best-fitting basic model shows
no significant departures from the observations, although some residuals are present (Fig.4c). Interestingly, there is an asymmetry in the PVD that is not reproduced by the model (Fig.4d). Further-more, a hole is visible in the gas distribution at positive velocities. These features indicate that some disturbance must be occurring in the gas disc (both morphologically and kinematically), but higher resolution observations would be needed to investigate the origin of the observed structures.
4.5 NGC 3557
The CO(2-1) emission of NGC 3557 shows a disc-like structure, but asymmetric features are evident in both the rotation pattern (Fig.5a) and the velocity curve (Fig.5d). Distortions are clearly visible in the mean velocity map at an RA offset of ≈−0.8 arcsec (positive velocities; Fig. 5a), coincident with an asymmetry in the PVD (Fig.5d). Furthermore, an increase of the gas velocity around the centre is visible at positive velocities. These features may result from various different phenomena (see Section 5 for details). However, a velocity increase around the galaxy centre is plausibly associated with the Keplerian upturn arising from material orbiting around the central SMBH (e.g. Davis et al.2017). Keplerian motions are expected in a potential dominated by an SMBH, and are visible in observations where the sphere of influence (SOI) of the
Downloaded from ht tps: //academic. oup. com/ mnras/ art icle/ 489/ 3/ 3739/ 5554765 by INA F T riest e (O sservat orio A st ronomico di T riest e), prandoni@ira. inaf .it on 06 November 2020
Figure 4. NGC 7075 observed, model, and residual mean velocity maps and PVD as in Fig.1, created using a data cube with a channel width of 40 km s−1.
SMBH is resolved and some emission arises from within the SOI. Spatially resolving the Keplerian region allows the SMBH mass to be constrained to high accuracy (see e.g. Davis et al.2017,2018; Onishi et al.2017).
To explore this possibility, we first verified that the spatial resolution of the combined observations allows us to resolve the SOI of the SMBH. Assuming a central stellar velocity dispersion of 282 km s−1 (Brough et al.2007), the SMBH mass would be log(MSMBH) + 8.82 M" (derived from the MSMBH–σ∗relation of Tremaine et al.(2002)). The resulting RSOI5is ≈60 pc, only slightly smaller than the spatial resolution of the combined observations (0.44 arcsec ≈ 90 pc). In order to take this feature into account and in the process to give an estimate of the SMBH mass at the centre of NGC 3557, we model the gas velocity by using the approach adopted by Onishi et al. (2017) and Davis et al. (2017).
The mass budget in the central part of ETGs is dominated by their stars, so the kinematics of the molecular gas around the galaxy centre contains contributions from both the luminous stellar mass and the SMBH. To remove the contribution of visible
5R
SOI= GMSMBH/σ∗2, where G is the gravitational constant, MSMBHis the
SMBH mass, and σ∗is the stellar velocity dispersion.
matter and calculate the SMBH mass at the centre of NGC 3557, we need to construct a mass model for the luminous component. This allows us to predict the circular velocity of the gas caused by the luminous matter, via the stellar mass-to-light ratio (M/L). The luminous matter distribution is parametrized using the multi-Gaussian expansion (MGE; Emsellem, Monnet & Bacon 1994) model adopted in the MGE FIT SECTORS package of Cappellari et al. (2002). In this technique, the 3D stellar mass distribution of the galaxy is modelled by deprojecting a 2D model of the observed stellar surface brightness and assuming a constant M/L. For our analysis, we used the archival HST Wide-Field and Planetary Camera 2 F555W image of NGC 3557 (seePaper I for details). Given the presence of a prominent dust ring seen at the centre of the galaxy, a longer wavelength high-resolution (e.g. HST) optical image would be needed to minimize dust extinction. However, such archival optical imaging is not available for NGC 3557, so we attempt to mitigate the effect of dust obscuration by masking the dusty region. The best-fitting MGE model is shown in Fig.6
and is tabulated in Table3. The circular velocity curve arising from this mass model is then used to model the CO velocity curve in KINMS, with the SMBH treated as point mass. The inclination and position angles are fitted as single values throughout the disc. The molecular gas distribution is modelled as described in Section 3.1.
Downloaded from ht tps: //academic. oup. com/ mnras/ art icle/ 489/ 3/ 3739/ 5554765 by INA F T riest e (O sservat orio A st ronomico di T riest e), prandoni@ira. inaf .it on 06 November 2020
Figure 5. NGC 3557 observed, mock, and residual mean velocity maps and PVD as in Fig.1, created using a data cube with a channel width of 22 km s−1.
The best-fitting model parameters of NGC 3557 are listed in Table4; a comparison between the observed and the modelled disc is shown in Fig.5.
The majority of the observed disc structures are reproduced well by our model, and accounting for the presence of an SMBH in the centre reproduces the velocity increase visible at positive velocities around the centre of the galaxy. We find a best-fitting MSMBH = (7.10 ± 0.02) × 108M
"(log(MSMBH) = 8.85 ± 0.02 M"), consistent with the expectation from the MSMBH–σ∗relation (e.g. Tremaine et al.2002; McConnell & Ma2013). Nevertheless, some significant residuals (≈40 km s−1) are visible in Fig.5(c) at the centre of the gas distribution. The model predicts a symmetrical velocity increase at both positive and negative velocities, while only the former appears in the data. Thus, while the SMBH mass determined earlier seems reasonable, we cannot definitively claim that a massive dark object is the cause of the observed central velocity structures in NGC 3557.
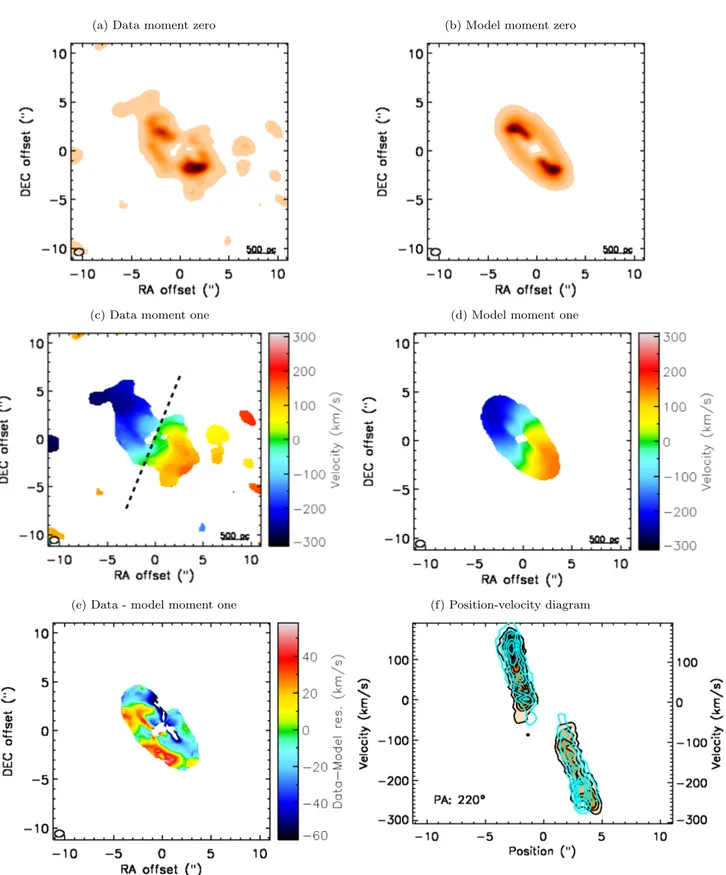
4.6 NGC 3100
The well-resolved CO(2-1) detection in NGC 3100 shows a ring-like structure extending 1.6 kpc along the major axis, with a disruption to the north-west of the nucleus (seePaper Iand Fig.7a). The velocity field (Fig.7c) indicates that the kinematics of the gas are dominated
by rotation, but with evident distortions in the rotation pattern. The iso-velocity contours are tilted and the major axis position angle changes moving from the edge to the centre of the ring, indicating the presence of a warp and/or non-circular motions.
In our model, we initially adopted an exponential surface bright-ness profile instead of the Gaussian used earlier (an exponential form has been shown to be appropriate in many ETGs; e.g. Davis et al.2013). We also included an inner truncation (i.e. a hole). Such a simple profile does not fit the observed gas distribution adequately, leaving large residuals in the moment one maps. We find instead that the molecular gas distribution in NGC 3100 is consistent with a two-armed spiral structure embedded in an exponential disc, with an inner truncation. Specifically, the disc profile is parametrized as +disc∝ $ exp%− r Rdisc & , r > Rhole, 0, r≤ Rhole.
The spiral pattern is modelled as a uniform brightness distribution along loci whose X and Y positions from the phase centre are described by
+spiral∝
x= [a cos θ ebθ,−a cos θ ebθ], y= [a sin θ ebθ,−a sin θ ebθ].
Downloaded from ht tps: //academic. oup. com/ mnras/ art icle/ 489/ 3/ 3739/ 5554765 by INA F T riest e (O sservat orio A st ronomico di T riest e), prandoni@ira. inaf .it on 06 November 2020
Figure 6. MGE model of NGC 3557 (red contours), overlaid on an HST optical (F555W) image (black contours). Panel (a) shows the whole galaxy, while panel (b) shows a zoom-in on the central region. The region masked due to dust is visible to the east of the galaxy nucleus in both panels.
Table 3. MGE parametrization of the NGC 3557 light profile. log10Ij. log10σj qj. (L",ipc−2) (arcsec) (1) (2) (3) 3.87 0.06 0.75 4.25 1.82 0.77 3.84 5.14 0.76
Note:Columns: Intensity (1), width (2), and axial ratio (3) of each Gaussian component.
Table 4. NGC 3557 best-fitting model parameters.
ID Parameter Unit Value
(1) Kinematic PA deg 211 ± 1.0 (2) Inclination deg 56 ± 1.0 (3) σgas km s−1 10 ± 1.0 (4) voffset(vcen) km s−1 15 ± 1.0 (3014) (5) Stellar M/L M"/L" 5.4 ± 0.1 (6) log(MSMBH) M" 8.85 ± 0.02
Note:Rows: (1) Kinematic position angle of the CO disc (i.e. the PA measured counterclockwise from North to the approaching side of the velocity field). (2) Inclination of the disc. (3) Gas velocity dispersion. (4) Velocity offset of the kinematic centre (i.e. offset with respect to the expected and observed velocity zero-point; the expected zero-point corresponds to the redshifted frequency of the CO(2-1) transition listed in
column (9) of Table1). The corresponding CO central velocity
is reported in parentheses. (5) Stellar mass-to-light ratio. (6) Logarithm of the SMBH mass.
The overall distribution has five free parameters in our MCMC code: the exponential disc scale length (Rdisc), the inner truncation radius (Rhole), the constants of the parametric form of the logarithmic spiral function (a and b), and the angle of the spiral arms from the
x-axis (θ). This model provides a significantly better fit to the data, reproducing well also the main features shown in the observed integrated intensity (moment 0) map (Fig. 7a). In particular, the regions of higher surface brightness at either side of the central hole are very well reproduced by the central spiral structure, as visible in Fig.7b.
We model the distortions in the rotation pattern by adding both a position angle and an inclination warp. We also assume that the disc is thin and the distribution axisymmetric. The velocity curve is parametrized following equation (1). The gas is assumed to be in purely circular motion. Table5summarizes the best-fitting (χ2
red= 1.3) model parameters. This model represents in general a good fit to the data (Fig.7), reproducing most of the asymmetries in the rotation pattern. Nevertheless, the velocity field shows significant residuals, with peak amplitudes of ≈±40 km s−1. This suggests that the adopted model is not a complete representation of the gas kinematics and points towards the presence of non-circular motions.
4.6.1 Non-circular motions
In order to characterize the nature of the residuals in the velocity field of NGC 3100 (Fig.7e) and to check for the presence of non-circular motions (i.e. non-zero radial velocities) in the plane of the CO disc, we use the KINEMETRYpackage (Krajnovi´c et al.
2006). This method is a generalization of surface photometry to the higher order moments of the line-of-sight velocity distribution, determining the best-fitting ellipses along which the profile of the moments can be extracted and analysed through harmonic expansion. Fig.8shows the kinematic parameters measured for the observed velocity field of NGC 3100. All the parameters are plotted versus the semi-major axis length of the fitted ellipses. According to the KINEMETRYformalism, , is the kinematic PA. The parameter
qis the flattening of the fitted ellipses, and can be interpreted as a measure of the opening angle of the iso-velocity contours. In the case of a thin disc (the assumption for NGC 3100), the flattening is
Downloaded from ht tps: //academic. oup. com/ mnras/ art icle/ 489/ 3/ 3739/ 5554765 by INA F T riest e (O sservat orio A st ronomico di T riest e), prandoni@ira. inaf .it on 06 November 2020
Figure 7. NGC 3100 observed and simulated integrated intensity maps (moment 0, panels a and b), observed, mock, and residual mean velocity maps (panels
c, d, and e), and PVD (panel f) as in Fig.1, created using a data cube with a channel width of 10 km s−1.
directly related to the inclination of the disc (q = cos i). k1is the first-order term of the harmonic expansion and describes the amplitude of the bulk motions (i.e. the rotation curve). k5is the fifth-order term of the harmonic expansion, indicating deviations from simple circular rotation: this term is sensitive to the presence of separate
kinematic components. In Fig.8, the k5parameter is plotted in terms of a k5/k1ratio, characterizing the level of non-circular motions with respect to the circular rotation component. According to Krajnovi´c et al. (2006), a single kinematic component is defined as having slowly varying , and q radial profiles, with a nearly featureless
Downloaded from ht tps: //academic. oup. com/ mnras/ art icle/ 489/ 3/ 3739/ 5554765 by INA F T riest e (O sservat orio A st ronomico di T riest e), prandoni@ira. inaf .it on 06 November 2020
Table 5. NGC 3100 best-fitting model parameters.
ID Parameter Unit Value
(1) Kinematic PA deg 190–250 (2) Inclination deg 20–80 (3) vflat km s−1 354 ± 0.01 (4) rturn arcsec 2.68 ± 0.01 (5) Rdisc arcsec 3.36 ± 0.01 (6) Rhole arcsec 0.9 ± 0.02 (7) σgas km s−1 33.8 ± 0.01 (8) voffset(vCO) km s−1 91.5 ± 0.01
Note:Rows: (1) Range of the CO disc kinematic position angle (i.e. the PA measured counterclockwise from North to the approaching side of the velocity field). (2) Range of the disc inclination. (3) Asymptotic (or maximum) circular velocity in the flat part of the rotation curve. (4) Effective radius at which the rotation curve turns over. (5) Scale length of the exponential surface brightness profile. (6) Radius of the central surface brightness cut-off. (7) Gas velocity dispersion. (8) Velocity offset of the kinematic centre (i.e. offset with respect to the expected and observed velocity point; the expected zero-point corresponds to the redshifted frequency of the CO(2-1)
transition listed in column (9) of Table1). The corresponding
central velocity is reported in parentheses.
velocity curve (k1 term) and a k5/k1 ratio consistent with zero. Instead, separate kinematic components can be identified when observing an abrupt change either with q > 0.1, or , > 10◦, or with a double hump in k1with a local minimum in between. The transition between the different components is often emphasized also by a peak in k5/k1(at the level of!0.1), which thus serves as an additional signature for such a change.
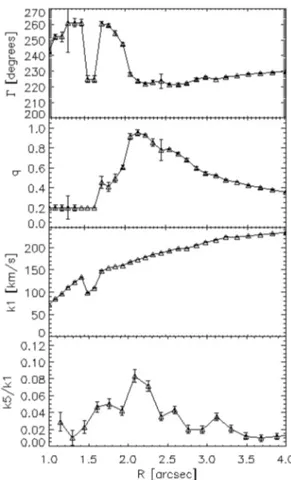
The curves in Fig.8show that in the inner region (r < 1.5 arcsec), the flattening is low, the circular velocity is rising, and the k5/k1ratio is mostly consistent with zero (i.e. k5≈ 0). The kinematic PA slightly changes in this region, suggesting the presence of a mild warp. The region between 1.5 and 2 arcsec is characterized by a sharp change of the PA (>10◦), likely indicating a kinematic twist. The presence of a kinematically distinct component in this region can be inferred by the slight drop of the circular velocity, accompanied by a rise of the k5/k1ratio (i.e. k5>0). The rising of the flattening parameter likely suggests that the two components (the inner and that within 1.5−2 arcsec) are kinematically separate. Between 2 and 2.5 arcsec, both the flattening and the k5/k1ratio reach their maximum, whereas the PA has another abrupt change. Beyond 2.5 arcsec, q and k5/k1decrease, with the latter becoming consistent with zero at the edge of the disc, and the PA remains almost constant. The velocity curve is rising and featureless from 2 arcsec to the edge of the map.
In summary, these complex features seem to indicate the presence of at least two separate kinematic components: an inner (r < 2.5 arcsec) and an outer (r > 2.5 arcsec) component. The harmonic decomposition also suggests changes in the kinematic PA (,) and inclination (q), consistent with the position angle and inclination warp we take into account in the disc modelling. In particular, at the best fit, we find that the inclination ranges from ≈80◦ in the inner region to ≈20◦towards the edges of the disc (Table5), reasonably in agreement with the variation observed in q. Similarly, the position angle varies between ≈190◦ and ≈250◦ at the best KINMS fit. The presence of two separate kinematic components
may also be compatible with the best-fitting parametrization of the CO distribution, consistent with an inner (r < 2.5 arcsec) two-armed spiral structure embedded in an outer exponential disc. The
Figure 8. Coefficients derived from the harmonic decomposition of the line-of-sight velocity field of NGC 3100 (see Section 4.6.1 for details). From the top to the bottom: kinematic PA; axial ratio of the best-fitting ellipses (directly related to the inclination in the approximation of a thin disc);
harmonic term k1, describing the rotation curve; k5/k1ratio, characterizing
the level of non-circular motions with respect to the circular rotation. k5
is the fifth-order term of the harmonic expansion and is used to trace the presence of non-circular motions. The x-axis indicates the distance from the nucleus along the disc major axis.
k5/k1ratio is non-zero, confirming that the radial motions are not negligible (10 per cent of the circular velocity at the peak) and this is likely to explain the 40 km s−1 residuals in the velocity map (Fig.7e).
5 D I S C U S S I O N
5.1 Kinematics of the molecular gas
Our work clearly shows that sizeable amounts of cold gas are confined in discs in the inner (sub-)kpc of LERGs (Paper I). The 3D modelling of these discs reveals that the gas kinematics are dominated by circular rotation, but with evident distortions (in both the morphology and kinematics) that are mostly not fully described by simple axisymmetric models. Such disturbances can trace interesting kinematic properties. In general, they indicate the presence of unrelaxed substructures in the gas disc, possibly caused by the presence of either warps or non-circular motions, or a combination of both. Indeed, both phenomena produce the same kinematic features (e.g. tilted or s-shaped velocity iso-contours). Differentiating between the two through disc modelling alone is not always straightforward, especially in discs where the gas
Downloaded from ht tps: //academic. oup. com/ mnras/ art icle/ 489/ 3/ 3739/ 5554765 by INA F T riest e (O sservat orio A st ronomico di T riest e), prandoni@ira. inaf .it on 06 November 2020
distribution is only marginally resolved (as in IC 1531, IC 4296, NGC 7075, and NGC 3557). In cases like these, however, a com-bination of observational and theoretical views can provide useful hints to put constraints on the physical processes giving rise to the observed features.
Lopsidedness, warps, and distortions, like those seen in the rotation patterns of NGC 612 and NGC 3100 (Figs 2a and 7c, respectively) and in the velocity curve of NGC 7075 (Fig. 4d), are expected when the gas has been accreted externally (i.e. from interactions or minor merger events) and is still in the process of settling into the potential of the host galaxy (e.g. Lauer et al.2005). This hypothesis will be extensively discussed in Section 5.3.
Deviations from purely circular motions in gas discs can be induced by various other mechanisms. Among these are bars in the stellar distribution, inner spiral perturbations (often related to the presence of a large-scale bar), and interactions between the gas and the radio jets (e.g. Alatalo et al.2011; Casasola et al.2011; Combes et al.2013; Garc´ıa-Burillo et al.2014; Oosterloo et al.
2017). All of these processes can cause radial inflow or outflow. Jet–gas interactions produce strong asymmetries in both the gas distribution (e.g. disruptions in the gas distribution caused by fragmentation of the gas clouds) and kinematics (e.g. outflows), giving rise to features similar to those seen in the rotation pattern and velocity curve of IC 1531 and NGC 3557. Indeed, indications of the presence of a jet–cold gas interaction in NGC 3557 have been recently claimed by Vila-Vilaro et al. (2019). Interestingly, IC 1531 and NGC 3557 are the two sources in our sample showing a significant misalignment between the jet and the disc rotation axes (at least in projection; see Paper I), making a scenario in which the radio jets pierce the surrounding cold gas disc plausible. Furthermore, in both cases, the observed asymmetries seem to be located in the direction of the jet axis (outlined in panel a of Figs 1 and 5). We then speculate about a possible jet–gas interaction in these two sources, although higher resolution data and/or other molecular gas transitions are needed to further explore this hypothesis.
Non-axisymmetric gravitational instabilities induced by the pres-ence of stellar bars also leave clear signs in the morphology and kine-matics of circumnuclear molecular gas distributions (e.g. Combes et al.2013), compatible with those observed in NGC 612 (Fig.2and Section 4). Cold gas discs in barred galaxies usually have nuclear gaps relying on bar-induced gravitational torques that force the gas outwards to the inner Lindblad resonance (ILR) or inwards towards the central SMBH (e.g. Combes2001). This process can also give rise to significant deviations from circular motions (e.g. Combes
2001,2006; Randriamampandry et al.2015), consistent with the presence of high residuals (with peak amplitudes of ±60 km s−1) in the central part of the NGC 612 CO disc (Fig.2c). Bars in edge-on galaxies also leave kinematic signatures in molecular gas PVDs, showing characteristic X-shapes (or simply sharp edges like those visible in Fig.2d) that are indicative of the presence of two velocity components along the line of sight (e.g. Alatalo et al.2013): an inner rapidly rising component associated with gas located within the ILR, and an outer slowly rising component associated with gas on nearly circular orbits beyond co-rotation. The disc in NGC 612, however, is viewed almost edge-on (Table 2); hence, projection effects (i.e. lines of sight passing through material at many different radii) prevent us from carrying out a detailed study of its complex kinematics. The study of the stellar light distribution (using high-resolution optical imaging) would be useful in this case: as bars also leave clear signatures in the optical morphology and the stellar kinematics (e.g. Emsellem et al.2001). However, the low spatial
resolution optical images currently available for NGC 612 (Paper I) prevent us from further investigating our hypothesis.
In summary, our analysis clearly shows that the observed molec-ular gas discs are not fully settled in a steady state into the stellar potential of the host galaxy. Although obvious observational limits do not allow us to draw strong conclusion in most of the cases, low-level dynamical disturbances can be identified in all the objects and may be associated with different underlying mechanisms (e.g. jet–gas interactions, stellar bars, external gas accretion, etc. ).
Disturbed CO discs are not commonly seen in local ETGs. In particular, significant differences are found between radio-loud (where the radio ‘loudness’ is essentially associated with the presence of the radio jets) and radio-quiet objects. Interferometric observations of 40 nearby ETGs (mostly radio-quiet) imaged in CO(1-0) with the Combined Array for Research in Millimeter-Wave Astronomy (CARMA) in the framework of the ATLAS3D survey show that 80 per cent of the discs are settled, both dynamically and morphologically (i.e. they show regular rotation patterns and morphologies, without evident departures from symmetry or devia-tions from purely circular modevia-tions; Alatalo et al.2013; Davis et al.
2013). Discs showing irregularities in their rotation pattern (such as s-shaped iso-velocity contours), warps, asymmetries, and/or disruptions in their morphology (i.e. unsettled discs; 20 per cent) are objects classified as low-luminosity (or ‘radio-weak’) AGN (on the basis of their 5 GHz radio emission; Nyland et al.2016), interacting systems or objects that have acquired their gas externally. However, the CO discs in the CARMA sample are imaged at much lower resolution (>4 arcsec) than ours. Thus, although the proximity of these objects (DL< 46 Mpc) allows us to sample spatial scales comparable to that of our observations (a few hundred parsecs) in most of the cases, caution is needed in drawing conclusions from this comparison. High-resolution (≤100 pc) ALMA observations of CO(2-1) discs in nearby ETGs have been presented by Boizelle et al. (2017). By analysing the kinematics of the five brightest CO discs (hosted by radio-quiet ETGs), they find that deviations from models assuming gas in purely circular motions are very small ("10 km s−1) and warping of the gas discs is of low magnitude in all the cases ("10◦), concluding that each CO dis-tribution can be considered both dynamically and morphologically settled.
The emerging picture is that CO discs in LERGs (and, in general, in radio-loud objects) are significantly more disturbed than in radio-quiet objects. This provides additional clues to the potential connection between ‘jet-mode’ AGN activity and the surrounding (sub-)kpc-scale molecular gas discs and, more generally, to the interplay between the AGN and its host galaxy.
5.2 NGC 3100: a case of fuelling?
NGC 3100 is certainly our most interesting case, particularly be-cause it shows two separate kinematic components within the gas disc, the inner one associated with a two-armed spiral perturbation (Section 4.6).
Nuclear spirals are frequently observed in the cores of nearby ETGs (e.g. Sim˜oes Lopes et al.2007), particularly in those hosting LINER-like AGN (e.g. Martini et al. 2003), and are usually associated with shocks in nuclear gas discs (e.g. Martini & Pogge
1999; Yuan & Yen2004; Maciejewski2004a,b; Combes2006; van de Ven & Fathi 2010). The gas is compressed along the spiral arms and the density enhanced. As a consequence, the gas surface brightness increases in the region of the spiral shock. This may explain the regions of higher surface brightness visible in the
Downloaded from ht tps: //academic. oup. com/ mnras/ art icle/ 489/ 3/ 3739/ 5554765 by INA F T riest e (O sservat orio A st ronomico di T riest e), prandoni@ira. inaf .it on 06 November 2020
integrated CO intensity map of NGC 3100 to either side of the central hole (Fig.7a), perfectly matching the location of the spiral arms in the best-fitting model (Fig.7b).
Different mechanism have been suggested for the formation of nuclear spirals (e.g. Fathi et al.2011). Non-axisymmetric potentials can cause a loss of the gas angular momentum due to torques and shocks, leading to the formation of inner spiral structures (e.g. Maciejewski & Sparke2000; Emsellem et al.2001; Heller, Shlosman & Englmaier2001; Shlosman2001,2005; Maciejewski
2004a,b; Fathi et al.2007). As mentioned earlier, non-axisymmetric perturbations can be induced by large-scale stellar bars. The associated gravitational potential gives rise to a shock front along the bar edges, leading to an inward/outward flow of material that can form nuclear spiral structures (e.g. Fathi et al. 2006; Casasola et al.2011; Combes et al.2013). However, the optical morphology and B-I colour map of NGC 3100 (seePaper I) do not provide much evidence for the presence of a bar in this galaxy. We then consider it to be unlikely that a stellar bar is driving the inner spiral features. Another mechanism that may form nuclear spiral arms is shock formation induced by jet–gas interactions (e.g. Veilleux, Cecil & Bland-Hawthorn2005). However, in this scenario, the location of the radio jets should be coincident with that of the spiral arms (e.g. Fathi et al.2011), while in NGC 3100 there is a significant misalignment between the two (seePaper Iand panel c of Fig.7). Non-axisymmetric perturbations can also occur if the molecular gas is accreted from outside the galactic system: in this case, the gas undergoes dynamical friction and then spirals towards the centre of the gravitational potential. In the central kpc scales, while it partially continues to spiral in, the gas angular momentum may also spread it into a disc. Nuclear (dust and gas) spirals, larger scale filaments, and warped distributions, like those seen in NGC 3100 (Fig.7andPaper I), are typical tracers of this process (e.g. Malkan, Gorjian & Tam1998; Sim˜oes Lopes et al. 2007), indicating material that has been accreted externally and is not yet fully relaxed into the potential of the host galaxy. Indeed, NGC 3100 is the best candidate among our sample sources for an external origin of the gas (see Section 5.3), probably via interaction with the companion spiral galaxy NGC 3095. We then favour external gas accretion as the mechanism giving rise to the spiral feature at the centre of the NGC 3100 gas distribution.
Nuclear spirals are often invoked as a promising mechanism capable of transporting gas from kpc scales to the nucleus and feeding the central SMBH. This hypothesis been discussed many times, from both theoretical and observational points of view (e.g. Wada, Meurer & Norman2002; Maciejewski2004a,b; Fathi et al.
2006,2011,2013; Sim˜oes Lopes et al.2007; Casasola et al.2008; Hopkins & Quataert2010; van de Ven & Fathi2010; Combes et al.
2013). One of the main problems linked to AGN fuelling is the removal of angular momentum from the gas. Spiral shocks and associated turbulence can induce streaming motions that cause the gas to lose or gain angular momentum and then to move inwards or outwards, respectively. The resulting radial motions can be a significant fraction of the underlying circular velocity (e.g. van de Ven & Fathi2010). We then argue that the non-circular motions in the plane of the CO disc of NGC 3100 (Section 4.6.1) may be associated with the inflow/outflow streaming motions induced by the spiral perturbation. In particular, the residuals in Fig.7e exhibit mostly redshifted/blueshifted velocities to the eastern/western side of the CO ring, respectively. This implies gas inflow/outflow depending on the relative orientation of each side with respect to our line of sight. The B-I colour map of NGC 3100 (Paper I) shows that the dust absorption is stronger at the eastern side of the ring,
indicating that this is the near side. This suggests that the molecular gas is likely (at least partially) inflowing.
Given these considerations, it seems reasonable to conclude that the molecular gas at the centre of NGC 3100 can feed the SMBH, fuelling the AGN. However, theoretical studies (e.g. Maciejewski 2004a,b; Hopkins & Quataert2010, 2011) indicate that spiral instabilities are capable of producing large accretion rates (1–10 M" yr−1), comparable to those required to sustain the brightest radiatively efficient AGN. The typical inflow rates estimated for LERGs like NGC 3100 indicate that, even when efficient mechanisms intervene to transport gas from kpc to ∼100 pc scales, other physical processes occur in the very inner regions of these objects, keeping the accretion rate low. Higher resolution observations probing the gas at scales relevant for the accretion process (%100 pc) would be needed to examine the kinematics around the central SMBH and draw more solid conclusions.
Finally, we note that the anticorrelation between the jet syn-chrotron and CO emission northward to the nucleus, along with other observational evidence, makes it plausible that there is a jet/gas interaction in this source (seePaper Ifor details). However, our modelling reveals no obvious kinematic signatures that can be attributed to such an interaction, likely indicating that, if present, this mechanism does not strongly affect the kinematics of the observed CO disc (at least at the current spatial resolution). A detailed analysis of the physics of the cold gas in NGC 3100 through ratios of multiple molecular line transitions (recently observed with ALMA during Cycle 6) will allow us to further investigate this issue (Ruffa et al. , in preparation).
5.3 Origin of the cold gas
The detection of a significant amount of molecular gas in the centre of LERGs, typically hosted by massive gas-poor ETGs, seems to point towards a recent regeneration of their gas reservoir (Young et al.2014). The origin of this gas, however, is still a subject of debate: it may be either internally generated or externally accreted. Disentangling these two scenarios may have important implications for our understanding of the fuelling mechanism of kinetic-mode AGN.
In the first scenario, in situ cold gas formation may be the result of either stellar evolution (i.e. stellar mass loss) or cooling from the hot halo. Cold gas supply through stellar mass loss can always be present. In the most massive ETGs (M∗> 1011 M"), evolved (primarily asymptotic giant branch) stars can inject gas and dust into the ISM at significant rates (>3 M"yr−1; e.g. Jungwiert, Combes & Palouˇs2001). However, the detection rate of molecular gas in local ETGs seems to be independent of galaxy properties, such as stellar mass (e.g. Oca˜na Flaquer et al.2010), possibly suggesting that the majority of the gas in these systems has been accreted via different mechanisms.
Large cold gas reservoirs can also be internally generated by cooling from the hot X-ray emitting gas phase, either smoothly (as predicted by e.g. Lagos et al.2014,2015; Negri et al.2014) or chaotically (as predicted in the framework of chaotic cold accretion models; see e.g. Gaspari et al.2015,2017). There is an established consensus that the hot halo provides the fuel source for LERGs, ei-ther directly or after cooling (e.g. Hardcastle et al.2007; Ching et al.
2017; Hardcastle2018; Gordon et al.2019). This seems particularly plausible for LERGs in high-density environments, where they are preferentially located (e.g. Best et al.2006; Hardcastle et al.2007; Best & Heckman2012; Sabater, Best & Argudo-Fern´andez2013; Ching et al.2017; Hardcastle2018). Indeed, a strong correlation
Downloaded from ht tps: //academic. oup. com/ mnras/ art icle/ 489/ 3/ 3739/ 5554765 by INA F T riest e (O sservat orio A st ronomico di T riest e), prandoni@ira. inaf .it on 06 November 2020