S H O R T R E P O R T
Open Access
Increased blood-cerebrospinal fluid transfer of
albumin in advanced Parkinson
’s disease
Valerio Pisani
1, Alessandro Stefani
1, Mariangela Pierantozzi
1, Silvia Natoli
2, Paolo Stanzione
1, Diego Franciotta
3and Antonio Pisani
1,4*Abstract
Background: Alterations in blood–brain barrier permeability have been proposed to represent a relevant factor contributing to Parkinson’s disease progression. However, few studies have addressed this issue in patients at different stages of disease.
Methods: Albumin was measured in cerebrospinal fluid and serum samples obtained from 73 non-demented subjects with idiopathic Parkinson’s disease and 47 age-matched control subjects. The albumin ratio (AR) was calculated to assess blood-cerebrospinal fluid and blood–brain barrier function. The group of patients with Parkinson’s disease included 46 subjects with Hoehn-Yahr staging between 1 and 2 and 27, with a score ranging from 2.5 to 4.
Results: Statistically significant differences in albumin ratio were found between patients with advanced disease, and both early-stage and unaffected groups. Conversely, early-phase patients did not differ from healthy subjects. Additionally, dopaminergic treatment seems to exert a possible effect on AR values.
Conclusions: Our study demonstrates that possible dysfunction of the blood-cerebrospinal fluid barrier,
blood–brain barrier, or both, characterize Parkinson’s disease progression. The associations between clinical scores, treatments and biochemical findings suggest a progressive impairment of barrier integrity during the course of the disease.
Keywords: Albumin ratio, Blood–brain barrier, Blood-cerebrospinal fluid barrier, Cerebrospinal fluid, Parkinson’s disease
Background
A growing body of evidence suggests an important role of inflammation in the pathophysiology of neurodegenerative diseases. Moreover, an impairment of brain barrier filter-ing systems through direct (leukocyte infiltration, toxins) or indirect (cytokines, growth factors) pathophysiological
mechanisms has been proposed in Parkinson’s disease
(PD) [1,2]. Particularly, a positron emission tomography (PET) study in PD patients revealed a dysfunction of the blood–brain barrier (BBB) transporter system [3], and increased BBB permeability has also been demonstrated in rat models of PD [4,5]. However, a detailed analysis on inflammation-induced changes of barriers that separate
blood from cerebrospinal fluid (CSF) and brain paren-chyma in PD is still lacking.
Choroid plexuses, namely the blood-CSF barrier (BCSFB), produce two-thirds of the CSF volume, the remaining one-third deriving from the BBB [6]. The ana-lysis of protein content on lumbar CSF specimens mainly allows the assessment of the functional integrity of the BCSFB, but not the isolated BBB [7,8]. Thus, in attempt to gain a better understanding on the role of BCSFB and BBB function on disease course, we analyzed paired CSF and serum samples and calculated albumin ratio (AR) of PD patients at different disease stages, including both early de novo subjects and clinically advanced ones. Methods
We screened 102 consecutively admitted and unselected subjects with idiopathic PD according to the UK PD
* Correspondence:[email protected]
1
Department of Neuroscience, University of Rome‘Tor Vergata’, Rome, Italy
4Laboratory of Neurophysiology, Santa Lucia Foundation, IRCCS, Rome, Italy
Full list of author information is available at the end of the article
JOURNAL OF
NEUROINFLAMMATION
© 2012 Pisani et al.; licensee BioMed Central Ltd. This is an Open Access article distributed under the terms of the Creative Commons Attribution License (http://creativecommons.org/licenses/by/2.0), which permits unrestricted use, distribution, and reproduction in any medium, provided the original work is properly cited.
Pisaniet al. Journal of Neuroinflammation 2012, 9:188 http://www.jneuroinflammation.com/content/9/1/188
Society Brain Bank criteria [9]. Patients underwent a thorough clinical and neurological evaluation compre-hensive of severity assessment (Unified PD Rating Scale (UPDRS) part III and Hoehn-Yahr staging (H&Y)), brain magnetic resonance imaging (MRI), and atraumatic lum-bar puncture for CSF analysis. CSF and blood samples were also obtained for diagnostic purposes from 47 age-matched control subjects (CTRL), hospitalized because of complaining non-specific pain, motor or sensory symptoms, though not presenting medical conditions known to impair BCSFB and BBB permeability (Table 1). In order to avoid any potential bias, we also added a sec-ond independent cohort of 11 subjects (IND) complain-ing a pharmacoresistant headache, without any evidence for subarachnoid hemorrhage or cerebral neoplasm. Ex-clusion criteria were: Mini Mental State Examination (MMSE) score <26, evidence of large cortico-subcortical lesions or confluent cerebral infarctions on MRI scans, subjects exhibiting low-back pain or radiculopathies, ab-normal CSF cell count (>4 cells/μl), and the presence of intrathecal IgG synthesis, whether quantitatively or quali-tatively assessed [8], on routine CSF analysis. All subjects underwent lumbar puncture in the morning of the same day of the clinical evaluation. Patients were punctured lying in lateral position with atraumatic needles. CSF was collected in polypropylene tubes using standard sterile techniques. The first sample (2 ml) was utilized for rou-tine analysis, while a second sample (5 ml) was collected to measure albumin-IgG concentration and oligoclonal bands. Blood specimens were also obtained at the same time of lumbar procedure. Immediately after collection, CSF samples were stored immediately on ice, sent to the
local laboratory, and processed within 1 h. Albumin and IgG concentrations were determined by immunonephelo-metry and oligoclonal bands by isoelectric focusing method. Then, albumin ratio (CSF albumin/serum albu-min concentration × 10-3), and IgG ratio (CSF IgG/serum IgG concentration × 10-3), as additional measures of BCSFB and BBB permeability, were calculated [7]. PD patients were then divided into two groups according to H&Y staging, considering 2 as the grouping cut-off score to compare early with advanced PD subjects [10]. All pro-cedures were carried out with the appropriate understand-ing and written consent of the subjects. The research protocol had been previously approved by the Ethical Committee of Policlinico Tor Vergata Foundation.
Statistical analysis
Data are reported as mean, standard deviation and med-ians (Table 1). Biochemical data, given their non-normal distribution, were separately assessed by one-factor non-parametric Kruskal-Wallis analysis of variance (ANOVA) for four groups. In case of significance, Mann–Whitney test was used to perform multiple comparisons; a post hoc Bonferroni correction was applied consider-ing P <0.016 as statistically significant. The χ2 test or Fisher exact test (if there were less than five observa-tions) were used for frequency data, in order to rule out the possibility that differences among groups could depend on random causality. P values less than 0.05 were considered significant. Analysis was per-formed using SigmaStat 3.5 software (Systat Software, Inc., Point Richmond, CA, USA).
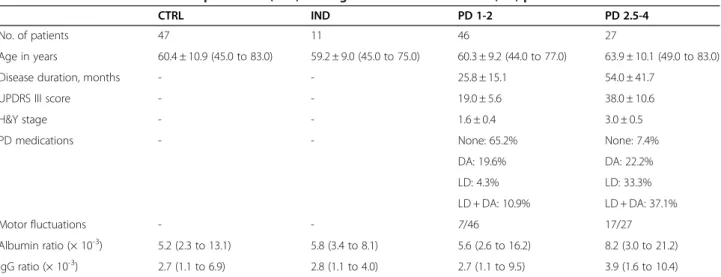
Table 1 Clinical data and cerebrospinal fluid (CSF) findings in Parkinson’s disease (PD) patients and controls
CTRL IND PD 1-2 PD 2.5-4
No. of patients 47 11 46 27
Age in years 60.4 ± 10.9 (45.0 to 83.0) 59.2 ± 9.0 (45.0 to 75.0) 60.3 ± 9.2 (44.0 to 77.0) 63.9 ± 10.1 (49.0 to 83.0)
Disease duration, months - - 25.8 ± 15.1 54.0 ± 41.7
UPDRS III score - - 19.0 ± 5.6 38.0 ± 10.6
H&Y stage - - 1.6 ± 0.4 3.0 ± 0.5
PD medications - - None: 65.2% None: 7.4%
DA: 19.6% DA: 22.2% LD: 4.3% LD: 33.3% LD + DA: 10.9% LD + DA: 37.1% Motor fluctuations - - 7/46 17/27 Albumin ratio (× 10-3) 5.2 (2.3 to 13.1) 5.8 (3.4 to 8.1) 5.6 (2.6 to 16.2) 8.2 (3.0 to 21.2) IgG ratio (× 10-3) 2.7 (1.1 to 6.9) 2.8 (1.1 to 4.0) 2.7 (1.1 to 9.5) 3.9 (1.6 to 10.4)
The top half of the table shows clinical data expressed as mean ± SD (minimum to maximum). The lower half shows biochemical values expressed as median (minimum to maximum).
CTRL = control group of healthy subjects; DA = dopamine agonists; H&Y = Hoehn-Yahr; IND = independent group with no neurological disease; LD = levodopa; PD 1–2 = Parkinson’s disease patients with H&Y stage ranging from 1 to 2; PD 2.5-4 = Parkinson’s disease patients with H&Y stage ranging from 2.5 to 4;
UPDRS = Unified Parkinson’s Disease Rating Scale.
Pisaniet al. Journal of Neuroinflammation 2012, 9:188 Page 2 of 4
Results
Among 102 PD patients screened, 29 did not meet eli-gible criteria. Specifically, 11 subjects were excluded be-cause of low MMSE scores, 8 reported intense low-back pain and 10 had confluent cerebral infarctions on MRI. Thus, we analyzed CSF/serum data from 73 PD patients, in comparison with control subjects. We found a signifi-cant difference in CSF/serum albumin ratio (P = 0.02) between the two groups. According to H&Y staging [10], PD patients (Table 1) were then divided into 2 groups: 46 patients with staging between 1 and 2 (PD 1–2) and 27 subjects ranging between 2.5 to 4 H&Y staging (PD 2.5-4). PD 1–2 group showed a mean disease duration of 25.8 ± 15.1 months and a mean UPDRS III score of 19.0 ± 5.6, whereas PD 2.5-4 group had a mean disease duration of 54.0 ± 41.7 months and a mean UPDRS III score of 38.0 ± 10.6. The mean ages of PD 1–2 and 2.5-4 patients (Table 1) did not significantly differ (P = 0.13).
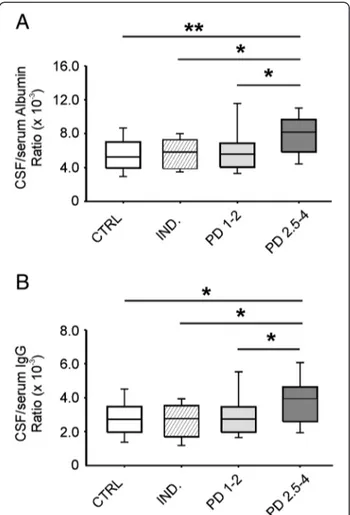
Albumin (P = 0.002) and IgG (P = 0.008) ratios were significantly different in the examined groups. PD 2.5-4 patients differed from CTRL, IND and PD 1–2 groups both in albumin (P <0.001, P <0.01 and P = 0.002, re-spectively) and IgG ratio values (P = 0.002, P <0.01 and P = 0.005, respectively). Conversely, no statistically sig-nificant difference (P >0.05) between PD 1–2 and CTRL, IND groups was found (Figure 1).
Then, we identified the normal cut-off value for AR (8.3 × 10⁻³), which corresponds to the 90th percentile of AR values in the CTRL group. The number of PD 2.5-4 patients with AR >8.3 × 10⁻³was higher than that of PD 1–2 patients (P = 0.015), thus confirming that the differ-ence between PD groups is not due to random causality. A possible effect of dopaminergic therapy on AR values was assessed by comparing patients with and without pharmacological treatment. The number of treated patients with AR >8.3 × 10⁻³was higher than that of un-treated patients (P = 0.035).
Discussion
The robust effort in search for biomarkers that might help monitoring degenerative processes has led to a renewed interest and application of lumbar puncture for research purposes in a variety of neurodegenerative dis-eases. CSF concentrations of protein produced within the CNS, such tau protein or α-synuclein, which is also abundantly expressed in red blood cells [11], do not de-pend on CNS barrier permeability [8]. However, meas-urement of promising markers of neurodegeneration could be affected by integrity of BBB and possible dys-functions of BCSFB. This issue is of relevance especially considering that changes in BBB permeability may occur in advanced PD [1,3], and changes have also been demonstrated in PD animal models [4,5]. Although the main cause of PD remains still unclear, several reports
suggest that microglial activation, reactive astrocytes, per-ipheral immune cells infiltration may be implicated in the development of the disease [2,12,13]. Moreover, an in-crease of brain barrier permeability could allow other ele-ments such as complement, toxins, and metals, normally excluded from the central compartment, to bypass BBB and potentially contribute to the progression of disease. Notably, a BBB dysfunction would likely contribute to alter also ion balance, disrupt transport system, for ex-ample, P-glycoprotein [3,14] or Na+-dependent levodopa pump activity [15], and potentially impair enzymatic con-stituents of the barrier.
In our study, we found AR values to be within the nor-mal range in early-staging PD patients, in accordance with previous data [16], whereas they were abnormally high in more advanced phases of the disease. AR is currently recognized as the most reliable marker of BCSFB perme-ability [7,8], but the BBB also contributes partially to CSF volume and composition [6]. Therefore, an increase of
Figure 1 Albumin and IgG ratios in Parkinson’s disease (PD) and control groups. Boxplots showing medians and percentiles referred to albumin (A) and IgG (B) ratios in PD subgroups (PD 1–2, PD 2.5-4) and control subjects (CTRL, IND). Statistically significant differences between groups are reported (*P <0.01; **P <0.001).
Pisaniet al. Journal of Neuroinflammation 2012, 9:188 Page 3 of 4
high molecular proteins in the CSF not only indicates BCSFB dysfunction but may also represent an index for BBB impairment. A hypothetical inflammation-dependent and locoregional increase in BBB permeability or a de-crease of CSF flow rate by a failure of choroidal Na-K ATPase [17] might explain the increase of blood-derived proteins in the CSF. BBB dysfunction, which is likely sus-tained by neuroinflammation [2-5], BCSFB hypofunction and decreased CSF flow rate [18], could be meaningful phenomena occurring in advanced stages of PD. However, it is questionable whether such abnormalities play a role as trigger events, participate in the pathogenic process, or are simply consequences of degeneration. Of note, in neu-rodegenerative diseases, a barrier compromise might also have significant implications for drug delivery, even if BBB alterations do not develop throughout an affected struc-ture in which neurodegeneration occurs, but rather in small localized areas within the structure [5]. Motor com-plications, such as dyskinesias, that become manifest in advanced stages of the disease after chronic levodopa treatment, could be related to inhomogeneous drug deliv-ery as a result of barrier compromise, or to a reduced cap-acity of the Na+ dependent transport system to remove levodopa from the brain extracellular fluid. The latter hy-pothesis well fits with a previous study on high levodopa availability in advanced PD patients [19].
Conclusions
In summary, future neuroimaging studies, along with analyses of proteins that are differently concentrated in the CSF on the basis of the CSF flow rate [8], will clarify the open issues generated by the present study. More insights into the function of CNS barriers could allow the identification of subsets of patients with different responses to drugs, leading to better-tailored therapies.
Competing interests
The authors declare that they have no competing interests.
Authors’ contributions
VP, DF and AP designed the study and wrote the paper. VP and MP enrolled the patients and performed clinical assessment. SN collected CSF samples for biochemical analysis and revised the manuscript. VP and SN carried out offline CSF data analysis and performed biostatistical comparisons. AS and DF gave their advice about the recruitment of patients and interpretation of data. PS supervised the whole investigation and revised the manuscript. All authors read and approved the final manuscript.
Acknowledgements
This investigation was supported by Ministry of Health (Progetto Finalizzato) and INAIL to AP.
Author details
1Department of Neuroscience, University of Rome‘Tor Vergata’, Rome, Italy. 2
Intensive Care Unit, University of Rome‘Tor Vergata’, Rome, Italy.
3Laboratory of Neuroimmunology, IRCCS, National Neurological Institute C.
Mondino, Pavia, Italy.4Laboratory of Neurophysiology, Santa Lucia Foundation, IRCCS, Rome, Italy.
Received: 8 May 2012 Accepted: 16 July 2012 Published: 8 August 2012
References
1. Weiss N, Miller F, Cazaubon S, Couraud PO: The blood–brain barrier in brain homeostasis and neurological diseases. Biochim Biophys Acta 2009, 1788:842–857.
2. Hirsch EC, Hunot S: Neuroinflammation in Parkinson’s disease: a target for neuroprotection? Lancet Neurol 2009, 8:382–397.
3. Kortekaas R, Leenders KL, van Oostrom JC, Vaalburg W, Bart J, Willemsen AT, Hendrikse NH: Blood–brain barrier dysfunction in parkinsonian midbrain in vivo. Ann Neurol 2005, 57:176–179.
4. Carvey PM, Zhao CH, Hendey B, Lum H, Trachtenberg J, Desai BS, Snyder J, Zhu YG, Ling ZD: 6-Hydroxydopamine-induced alterations in blood–brain barrier permeability. Eur J Neurosci 2005, 22:1158–1168.
5. Westin JE, Lindgren HS, Gardi J, Nyengaard JR, Brundin P, Mohapel P, Cenci MA: Endothelial proliferation and increased blood–brain barrier permeability in the basal ganglia in a rat model of 3,4-dihydroxyphenyl-L-alanine-induced dyskinesia. J Neurosci 2006, 26:9448–9461.
6. Thompson EJ: Cerebrospinal fluid. J Neurol Neurosurg Psychiatry 1995, 59:349–357.
7. Teunissen CE, Petzold A, Bennett JL, Berven FS, Brundin L, Comabella M, Franciotta D, Frederiksen JL, Fleming JO, Furlan R, Hintzen RQ, Hughes SG, Johnson MH, Krasulova E, Kuhle J, Magnone MC, Rajda C, Rejdak K, Schmidt HK, van Pesch V, Waubant E, Wolf C, Giovannoni G, Hemmer B, Tumani H, Deisenhammer F: A consensus protocol for the standardization of cerebrospinal fluid collection and biobanking. Neurology 2009, 73:1914–1922. 8. Reiber H: Dynamics of brain-derived proteins in cerebrospinal fluid. Clin
Chim Acta 2001, 310:173–186.
9. Gibb WR, Lees AJ: The significance of the Lewy body in the diagnosis of idiopathic Parkinson’s disease. Neuropathol Appl Neurobiol 1989, 15:27–44. 10. Evans JR, Mason SL, Williams-Gray CH, Foltynie T, Brayne C, Robbins TW,
Barker RA: The natural history of treated Parkinson’s disease in an incident, community based cohort. J Neurol Neurosurg Psychiatry 2011, 82:1112–1118.
11. Barbour R, Kling K, Anderson JP, Banducci K, Cole T, Diep L, Fox M, Goldstein JM, Soriano F, Seubert P, Chilcote TJ: Red blood cells are the major source of alpha-synuclein in blood. Neurodegener Dis 2008, 5:55–59. 12. McGeer PL, Itagaki S, Boyes BE, McGeer EG: Reactive microglia are positive
for HLA-DR in the substantia nigra of Parkinson’s and Alzheimer’s disease brains. Neurology 1988, 38:1285–1291.
13. L’Episcopo F, Tirolo C, Testa N, Caniglia S, Morale MC, Cossetti C, D’Adamo P, Zardini E, Andreoni L, Ihekwaba AE, Serra PA, Franciotta D, Martino G, Pluchino S, Marchetti B: Reactive astrocytes and Wnt/β-catenin signaling link nigrostriatal injury to repair in 1-methyl-4-phenyl-1,2,3,6-tetrahydropyridine model of Parkinson’s disease. Neurobiol Dis 2011, 41:508–527.
14. Droździk M, Białecka M, Myśliwiec K, Honczarenko K, Stankiewicz J, Sych Z: Polymorphism in the P-glycoprotein drug transporter MDR1 gene: a possible link between environmental and genetic factors in Parkinson’s disease. Pharmacogenetics 2003, 13:259–263.
15. Hawkins RA, Mokashi A, Simpson IA: An active transport system in the blood–brain barrier may reduce levodopa availability. Exp Neurol 2005, 195:267–271.
16. Haussermann P, Kuhn W, Przuntek H, Muller T: Integrity of the blood-cerebrospinal fluid barrier in early Parkinson’s disease. Neurosci Lett 2001, 300:182–184.
17. Fisone G, Snyder GL, Aperia A, Greengard P: Na+, K(+)-ATPase phosphorylation in the choroid plexus: synergistic regulation by serotonin/protein kinase C and isoproterenol/cAMP-PK/PP-1 pathways. Mol Med 1998, 4:258–265.
18. Silverberg GD, Huhn S, Jaffe RA, Chang SD, Saul T, Heit G, Von Essen A, Rubenstein E: Downregulation of cerebrospinal fluid production in patients with chronic hydrocephalus. J Neurosurg 2002, 97:1271–1275. 19. Woitalla D, Goetze O, Kim JI, Nikodem AB, Schmidt WE, Przuntek H, Muller T:
Levodopa availability improves with progression of Parkinson’s disease. J Neurol 2006, 253:1221–1226.
doi:10.1186/1742-2094-9-188
Cite this article as: Pisani et al.: Increased blood-cerebrospinal fluid transfer of albumin in advanced Parkinson’s disease. Journal of Neuroinflammation 2012 9:188.
Pisaniet al. Journal of Neuroinflammation 2012, 9:188 Page 4 of 4