Alma Mater Studiorum – Università di Bologna
DOTTORATO DI RICERCA IN
CHIMICA
Ciclo XXVII
Settore Concorsuale Di Afferenza: 03/D1 Chimica e Tecnologie Farmaceutiche, Tossicologiche e Nutraceutico-Alimentari
Settore Scientifico disciplinare: CHIM/08 Chimica Farmaceutica
TITOLO TESI
ORIGINAL ANALYTICAL METHODS FOR THE
DETERMINATION OF PSYCHOACTIVE
COMPOUNDS IN COMPLEX MATRICES
Presentata da: Emanuele Morganti
Coordinatore Dottorato
Relatore
Chiar.mo Prof. Aldo Roda
Chiar.ma Prof.ssa
Maria Augusta Raggi
3 “There is a crack in everything. That's how the light gets in.”
4
5
TABLE OF CONTENTS
1. INTRODUCTION ... 6
1.1. Drug abuse, drug addiction and doping ... 6
2. AIM OF THE THESIS WORK ... 8
3. ANALYSIS OF GAMMA-HYDROXYBUTIRIC ACID (GHB) IN HUMAN PLASMA BY CE-DAD WITH INDIRECT DETECTION ... 9
3.1. Introduction ... 9
3.2. Experimental ... 11
3.3. Results and discussion ... 16
3.4. Conclusions ... 37
4. DETERMINATION OF GHB IN DRIED BLOOD SPOTS FOR THERAPEUTIC DRUG MONITORING ... 38
4.1. Introduction ... 38
4.2. Results and discussion ... 46
4.3. Conclusions ... 52
5. ANALYSIS OF ADULTERANTS PRESENT IN STREET DRUGS BY CE-DAD ... 53
5.1. Introduction ... 53
5.2. Experimental ... 58
5.4. Conclusions ... 73
6. DEVELOPMENT OF A CONFIRMATORY HPLC MS/MS METHOD FOR THE ANALYSIS OF GLUCOCORTICOIDS IN HUMAN URINE ... 74
6.1. Introduction ... 74
6.2. Experimental ... 77
6.3. Results and discussion ... 83
6.4. Conclusions ... 91
FOOTNOTES ... 93
6
1. INTRODUCTION
1.1. Drug abuse, drug addiction and doping
Drug abuse is an important global problem with a strong economic, personal and social impact. In the “World Drug Report” 2014 the United Nations Office on Drugs and Crime (UNODC) estimates that, in 2012, between 162 and 324 million people, that is 3.5% to 7.0% of the population aged 15-64, used illicit substances at least once in the previous year and that about half of that number used illicit drugs at least once during the month before the assessment1. The problem is not limited to illicit substances, but concerns also legal psychoactive drugs, such as alcohol, tobacco and medications. Recently, there has been an increase in the non-medical use of prescription drugs, such as a number of opioid analgesics (used in the treatment of pain), tranquillizers and sedatives (employed to treat anxiety and sleep disorders) and prescription stimulants (prescribed for the treatment of attention deficit hyperactivity disorder (ADHD)). While in Europe the extent of this phenomenon has not been fully evaluated (though some European countries have reported non-medical use of prescriptions drugs), in the USA the problem has dramatically increased over the last years1,2.
Drug abuse can lead to the phenomenon of addiction, defined as a chronic, relapsing brain disease characterized by compulsive drug seeking and use, despite harmful consequences3,4. Addiction arises from the changes in the brain electrical structure that the drugs produce over time. Drugs of abuse activate the brain’s reward system, particularly the mesocorticolimbic dopaminergic pathway, producing positive reinforcing effects that powerfully compel people to keep using drugs, thus leading to addiction4. Moreover, long-term abuse causes neurobiological changes that impair cognitive function and may trigger mental disorders3. Besides effects on the brain, drug abuse has other serious health consequences, such as chronic diseases and organ failure associated with repeated use, blood-borne bacterial and viral infections (among injecting drug users, 17.9% is HIV positive and 50% is infected with HCV) and acute toxic effects, including overdose. Each year between 104,000 and 263,000 deaths are related to or associated with the use of illicit drugs and over half of these deaths are fatal overdose cases occurring mainly in young people in the
mid-7
thirties. In addition, drug abuse strongly affects society on multiple levels. For example, illicit drug use generates criminal activities, people under the influence of drugs can cause accidents and the risk of spreading infectious diseases is increased1,3. Different strategies can be employed to reduce drug abuse and limit its negative consequences. Prevention programs aimed to increase the awareness of drug-induced harms have proved to be effective in decreasing drug abuse3; controls carried out on people that perform particular tasks, such as those requiring high attention (e.g. driving), in order to ascertain drug intake can prevent accidents; proper medical treatment helps patients improve their health conditions and the quality of their lives and limits the social harm related to drug abuse.
8
2. AIM OF THE THESIS WORK
The aim of this thesis work was to develop original analytical methods for the determination of drugs with a potential for abuse, of substances used in the pharmacological treatment of drug addiction in biological samples and of potentially toxic compounds added to street drugs.
In fact reliable analytical methods can play an important role in this setting. They can be employed to reveal drug intake, allowing the identification of drug users and to assess drug blood levels, assisting physicians in the management of the treatment. Pharmacological therapy needs to be carefully monitored indeed in order to optimize the dose scheduling according to the specific needs of the patient and to discourage improper use of the medication.
In particular, methods have been developed in this thesis work for the detection of gamma-hydroxybutiric acid (GHB), prescribed for the treatment of alcohol dependence; glucocorticoids, one of the most abused pharmaceutical class to enhance sport performance; and adulterants, pharmacologically active compounds added to illicit drugs for recreational purposes. All the presented methods are based on capillary electrophoresis (CE) and high performance liquid chromatography (HPLC) coupled to various kinds of detectors (diode array detector, mass spectrometer); biological sample pre- treatment was carried out using different extraction techniques, namely liquid-liquid extraction (LLE) and solid phase extraction (SPE). Different kind of matrix have been considered: human plasma, dried blood spots, human urine, simulated seized powders. The developed analytical methods will be individually described and discussed in the following chapters.
9
3. ANALYSIS
OF
GAMMA-HYDROXYBUTIRIC
ACID (GHB) IN HUMAN PLASMA BY CE-DAD
WITH INDIRECT DETECTION
3.1. Introduction
Alcohol is one of the most frequently abused drugs and it has an high tendency to cause mental disorders and death as a result of chronic use1,5. According to a recent study, it appears to be more harmful than cannabis, lysergic acid diethylamide and ecstasy6. A substantial number of individuals are co-dependent on these drugs and this leads to an increased risk of medical complications and negative health consequences. Alcohol dependence still represents a significant global problem affecting millions of people in the world5 and it is responsible for an high demand of treatment, thus reflecting the considerable harm associated with alcohol abuse1,7. The combination of psychosocial support and pharmacological therapy showed to be the most effective approach to alcohol dependence7.
-Hydroxybutyric acid (GHB) is naturally occurring in the mammalian brain tissue where it is believed to act as a neurotransmitter8. It is also found in heart, liver, kidney, muscle and brown fat, but its function is still unknown. GHB has been found to be useful in the treatment of narcolepsy9 and of alcohol withdrawal7: it reduces craving and prevents withdrawal symptoms relieving the patient of the need to use alcohol, it has a low potential for abuse and a low risk of overdose fatalities.
On the other hand body builders have consumed the compound as it stimulates the secretion of growth hormone10.
Furthermore, it has recently become a public health issue as a club drug (called liquid ecstasy) and appears occasionally in drug-facilitated sexual assaults. This is due to its effects and chemical properties as it is colourless and odourless liquid, which can be easily mixed with drinks11.
The principal clinical effect of exogenously administered GHB is Central Nervous System depression, effect that may be mediated by a specific GHB receptor, binding to γ-aminobutyric acid (GABA) receptors, modulation of GABA levels or interactions with other neurotransmitters. The
10
range between the therapeutic effects and toxic ones is narrow, frequently resulting in headache, nausea, vomiting, respiratory depression and coma12.
Consequently, the correct determination of GHB is important in both forensic and clinical toxicology. Many previously reported analytical methods detect GHB in different biological matrices and involve the use of gas chromatography (GC)13,14,15,16,17,18,19, high performance liquid chromatography (HPLC)20,21,22 with different detector and capillary zone electrophoresis (CE)23,24,25.
The qualitative techniques include infrared (IR) spectroscopy15, nuclear magnetic resonance (NMR) spectroscopy16 and colorimetry17.
The outcome of GHB is highly variable depending on different factors, including individual metabolism. For this reason, it would be advisable to carefully monitor plasma levels of GHB in order to tailor the dose to each patient’s needs. To these purposes, it is desirable to have at disposal high-sensitivity, low-cost analytical methods to determine plasma levels of GHB.
The aim of the present work was to develop a CE-DAD method with indirect detection for the determination of GHB in human plasma in order to perform therapeutic drug monitoring in patients under treatment for alcohol abuse.
γ-Hydroxybutyric acid (GHB)
Hexanoic acid (IS)
γ-Aminobutyric acid (GABA)
11
3.2. Experimental
Chemicals
GHB (gamma-hydroxybutyric acid) has been provided by LGC Standards Srl (Sesto San Giovanni, Milan).
Hexanoic acid used as internal standard (IS) was provided by Janssen Chimica (Beerse, Belgium).
Methanol, used for dilutions, for the precipitation of the proteins and for the preparation of the background electrolyte (BGE), benzoic acid, used for the BGE, were supplied by Sigma Aldrich (Steinheim, Germany).
CTAB (cetyl-trimethylammonium bromide), used for the preparation of BGE, sodium hydrogen phosphate, used to prepare the phosphate buffer, and sodium hydroxide, were supplied by Carlo Erba (Milan, Italy).
The ultrapure water (18.2 MΩ cm) was obtained using a Milli-Q system supplied by Millipore (Milford, Massachusetts, USA)
Preparation of stock and working solutions
The stock solution (1 mg/mL) of GHB was purchased from the pharmaceutical manufacturer. The stock solutions (1 mg/mL) of hexanoic acid (SI) were prepared by diluting the solution of hexanoic acid with a density of 0.927 g / mL . the exact volume of 10.8 µL of this solution were diluted with MeOH in a 10 mL volumetric flask.
Working solutions were prepared, daily, by diluting stock solutions to desired concentrations, with a mixture of phosphate buffer 25 mM, pH 7.4 / MeOH (25:75 v/v). All solutions were stored in the freezer at a temperature of -20 ° C.
The backgound electrolyte (BGE) is constituted by a benzoate buffer 15 mM at pH 5.5 containing 0.5 mM CTAB and MeOH to 30% (v / v).
This buffer is prepared as follows: 91.5 mg of benzoic acid is weighted ad dissolved with approximately 25 mL of water, agitated on a plate heated to 37 ° C. let the solution col avoiding the
12
formation of benzoate cristals. CTAB (9.1 mg) and 15 mL of MeOH are added to the clear solution obtained. The solution is adjusted to pH 5.5 with 1 M NaOH, appropriately diluted, and then transferred to a 50 cc flask and brought to volume with water.
Sample collection
Blood samples (3 mL) were drawn from patients subjected to therapy with GHB at Drug Addiction Treatment Centres (Ser.T.) in Bologna (Italy). Blood samples were usually collected in the morning from fasting patients, 2-3 hours after the last drug administration. The study was approved by local review board and informed consent was obtained for experimentation with human subjects. Blood was stored in glass tubes containing ethylenediaminetetraacetic acid (EDTA) as the anticoagulant and then centrifuged (within 2 hours from collection) at 4000 rpm for 15 minutes at 5°C. The supernatant (plasma) was then transferred to polypropylene tubes and stored at -80°C until analysis. Blood samples from healthy volunteers, used as blank samples, were treated in the same way.
Sample pre-treatment
For the analysis of GHB in plasma samples, 100 µL of plasma were added to aliquots of 10 µL of GHB and SI (or IS only) taken from the stock solutions. MeOH was then added to this solution to obtain a final volume of 400 µL. The solution thus obtained was stirred for 3 minutes and then centrifuged (4000 rpm, 5° C, 10 minutes). The supernatant was collected and filtered through a cellulose filter 0.20 µm. The final solution was injected into the CE system.
Equipment
The instrument used for the analysis of GHB in plasma is a capillary electrophoresis system (CE-3D, Agilent, Palo Alto - CA, USA) equipped with a photodiode array detector (DAD).
13
UK) with the following characteristics: total length (TL) of 48.5 cm, effective length (EL) of 40.0 cm and internal diameter (ID ) of 50 microns.
The samples were injected from the anode side of the capillary by means of a pressure of 50 mbar for 25s.
The applied voltage was -30 kV. The wavelength of 210 nm was set for detection.
At the beginning of each day, the capillary was conditioned with ultrapure water, 1N NaOH, ultrapure water and BGE, for ten minutes each.
A Crison (Barcelona, Spain) MicropH 2000 pHmeter, a Hettich (Tuttlingen, Germany) Universal 32 R centrifuge and an IKA (Staufen, Germany) RV 10 rotary evaporator were also used.
Data were handled by means of ChemStation software from Agilent (Santa Clara, CA, United States).
Method validation
The method was validated according to USP XXXVIII 26 and “Crystal City”27,28 guidelines.
- Linearity, limit of quantitation, limit of detection
Aliquots of 10 µL of analyte standard solutions at six different concentrations, containing the IS at a constant concentration, were added to 100 µL of blank plasma. The resulting calibration standards were subjected to the previously described pretreatment procedure and then injected into the CE system. Calibrators were prepared in triplicate for each point and covered the following plasma range: 2.0-320 µg mL-1. The concentration of the IS was 20 µg mL-1. The analyte/IS peak-area ratios obtained were plotted against the corresponding concentrations of the analytes (expressed as µg mL-1) and the calibration curves were constructed by means of the least-square method.
The limit of detection (LOD) and limit of quantitation (LOQ) were calculated as the analyte concentrations which give rise to peaks whose heights are 3 and 10 times the baseline noise, respectively.
14
- Extraction yield and precision
For these assays plasma samples at three different concentrations of the analytes, corresponding to the lowest, the intermediate and the highest point of the calibration curve, were prepared. The samples, containing 2.0, 160.0 and 310.0 µg mL-1 of GHB and were subjected to the previously described pre-treatment procedure and injected into the CE. The analyte peak areas of the spiked samples were compared to those obtained injecting standard solutions at the same theoretical concentrations and the extraction yield (expressed as percentage value) was calculated.
The assays described above were repeated six times within the same day to obtain repeatability (intraday precision) and six times over six different days to obtain intermediate precision (interday precision), both expressed as percentage relative standard deviation values (RSD%).
- Selectivity
The selectivity of the method was evaluated with respect to endogenous and exogenous compounds. Blank plasma samples from six different healthy volunteers were processed in the absence of the IS and the resulting electropherograms were checked for possible interference at the retention time of the analytes and the IS. Selectivity towards exogenous substances was investigated by injecting into the CE system standard solutions of several compounds that could be co-administered in clinical practice. A substance was classified as interfering if it gave rise to a peak that was not baseline separated from those of the analytes or the IS.
- Stability
Stock solution stability was tested by comparing the analyte/IS peak-area ratios of a standard solution (containing 10 µg mL-1 of GHB) prepared from stock solutions stored for 1 month at -20°C with those of a standard solution at the same theoretical concentrations obtained from fresh stock solutions (n = 3). Stability assays were also carried out in blank plasma samples fortified with 10 µg mL-1 of GHB. Sample stability was evaluated over five hours at room temperature, after three freeze- thaw cycles and after 1 month of storage at -80°C (n = 3 per storage condition).
15
- Analysis of plasma samples from patients in treatment with GHB
For the analysis of GHB in real samples, 10 µL of SI were added to 100 µL of plasma samples collected from patients in therapy with Alcover®. The mixtures thus obtained were subjected to the procedure of precipitation with MeOH. The solution is then injected in the CE. The values of the ratios of the peak areas electrophoretic analyte / SI were interpolated on the calibration curve built on plasma samples to obtain plasma concentrations of the analyte.
- Accuracy
Analyte standard solutions at three different concentrations (in order to obtain analyte additions of 5.0, 20.0 and 50.0 µg mL-1 of GHB) were added to plasma samples collected from patients under Alcover® treatment whose analyte concentrations had been previously determined (n = 3 for each level); then, the mixtures were subjected to the pretreatment procedure. Accuracy was expressed as percentage recovery and was calculated according to the following formula: 100 ([after spiking] – [before spiking]) / [added], where [after spiking] is the sum of the concentrations of the analyte in the real plasma and in the analyte standard solution added; [before spiking] is the concentration of the analyte in the real sample; and [added] is the concentration of the analyte standard solution added to the real sample.
16
3.3. Results and discussion
Development of indirect spectrophotometric determination
GHB is a molecule that does not have unsaturation or other chromophores that allow direct detection by UV-visible spectrophotometry. To overcome this problem it can be derivatized, but this strategy sometimes is not reliable for analytical purposes.
An indirect spectrophotometric determination of the analyte can be done in CE, using, as a component of BGE, an ionic compound with advantageous absorption properties called probe.
In this case, for the determination of GHB has been used a BGE consisting of benzoic acid (Figure 2). Benzoic acid contains a chromophoric group, an aromatic carboxylic acid, that shows a an absorption maximum at 210 nm.
Each time that the analyte, migrating in the capillary, is located in front of the optical window, it is observed a negative peak on the absorption line produced by BGE: this peak is negative because the analyte considered shows no absorption.
17
BGE optimization
In capillary electrophoresis with indirect spectrophotometric detection the separation efficiency and sensitivity of the method is influenced by many factors: the concentration of the probe, the running buffer, the pH value, the concentration of the Electroosmotic Flow (EOF) modifier.
A good Background Electrolyte (BGE) for the indirect detection must provide a high molar extinction coefficient. The para-hydroxybenzoic acid and benzoic acid, both compounds which contain a chromophore group that allows indirect UV detection were evaluated as potential probes. It was chosen benzoic acid which allows a better detection of the analyte.
Very important is the mobility of the analytes within the BGE that can be controlled by changing the concentration of benzoate or the pH.
The effect of the concentration of benzoate, on the mobility of analytes, was studied using a Cetyl-Trimethyl-Ammonium Bromide (CTAB) concentration of 0.5 mM at pH 5.5, in the range between 10 mM and 25 mM. It is observed that the effective mobility of the analytes is reduced by increasing the concentration of benzoate, this reduction is due to an increase in total ionic strength of the electrolyte. The decrease of the mobility of the analytes is accompanied by a parallel increase in the migration time, which improves the resolution of GHB, especially in plasma samples of healthy volunteers, increasing the migration times of the analyte with respect to the interferences of the plasma.
However with increasing concentration of benzoate is a decrease of sensitivity in the detection, due to the decrease of the ratio of UV absorbance the analyte.
For this reason, a good compromise, in terms of sensitivity and resolution was obtained by choosing a concentration of benzoate equal to 15 mM.
The electrophoretic mobility of the analytes is pH dependent, because the ionization is directly related to the pH of BGE.
The pH of the BGE was studied in a range from 5 to 6.5, taking into account that the pKa of the analyte is ~ 4.5. It was chosen value of 5.5 because it was observed that in samples of healthy volunteer this value allowed to have migration times more similar to those of the standard solutions. This is probably attributable to an increase of the buffering power of BGE at effective pH of 5.5.
18
The EOF is considerably reduced, or even eliminated, if the BGE is added a cationic surfactant, so it was chosen to achieve this purpose the Cetyl-Trimethyl-Ammonium Bromide (CTAB). Tests were carried out also using, as surfactant, the Tetrabutylammonium Bromide (TBAB), in a concentration range between 0.25 mM and 0.5 mM, which, however, has led to a considerable increase of the migration times of the analyte, for this reason it was discarded.
Even the concentration of CTAB in the BGE was studied, in a range between 0.3 and 0.7 mM, and was observed as an increase in the mobility of the analytes proportional to the increase of the concentration of CTAB. However, increasing the concentration of CTAB is a reduction of sensitivity because it adds an anion which competes with the ions of the solute, while, for concentrations of CTAB less than 0.5 mM is observed a lack of reproducibility of migration times. A good compromise between resolution and sensitivity was achieved with a concentration of 0.5 mM CTAB.
The addition of an organic modifier which varies the mobility of the analytes in a selective manner can significantly reduce the interference. Since methanol is re quired by pretreatment of biological samples, which occurs through precipitation of the protein, this was added to the BGE.
The percentage of methanol is added has been studied in a range between 10% and 40%. From the analysis it was evident that the best results, in terms of stability and reproducibility of the electrophoretic system, were obtained with 30% methanol.
The optimal separation was therefore obtained using a BGE with the following composition:
- Benzoate buffer 15 mM pH 5.5 - 0.5 mM CTAB
19
Internal standard choice
As regards the selection of a suitable internal standard some compounds with no chromophore groups, as carboxylic acids, were tested. Among these, the most appropriate was found to be hexanoic acid (Figure 1) which, as GHB, does not absorb UV radiation: when it passes in front of the optical window it produces a negative peak. Furthermore it showed an electrophoretic behavior similar to that of the analyte. In fact his log P is comparable to GHB.
In this the experimental conditions, the migration time of the internal standard is slightly higher than GHB, but still allow short analysis times, less than 4 minutes. The hexanoic acid was used as IS at the concentration of 20 g / mL.
Optimization of injection conditions
Studies have been performed to optimize the injection conditions to increase the sensitivity of the method and avoid a reduction in efficiency. Several tests were carried out while maintaining the pressure constant at a value of 50 mbar and gradually increasin g the injection time from 5 seconds to 35 seconds. There is increased sensitivity of up to 25 seconds, follow it is observed a peak broadening with consequent loss of efficiency.
The optimum condition is reached by injecting pressure from the anod ic side at 50 mbar for 25 seconds.
Solvent used for dilution of the analytes
The solvent used to perform dilutions is made from a mixture 75:25 MeOH / 25 mM phosphate buffer at pH 7.4.
This choice has been very important as it has influenced both the height and the efficiency of both peaks.
During an initial screening of solvents to make the dilutions of the standard solutions, the use of methanol was observed to produce a marked increase in sensitivity, compared to the use of ultrapure water as shown in Figure 5 and Figure 6.
20
reproducibility of the times and areas was observed between the standard solutions and the plasma solutions. This phenomenon has been attributed to excessive ionic strength of the matrix compared to standard solutions and to the presence of a percentage of organic solvent resulting from the pretreatment procedure of the sample. To be able to compare the analysis of standard solutions the analysis of plasma samples, the conditions more similar to those of the matrix was reproduced using a 25 mM phosphate buffer pH 7.4 that mimics the characteristics of the plasma and the methanol which is used in pretreatment mixture in the same ratio 25:75. As can be seen, in the optimized electrophoretic conditions the analytes are well resolved within a short total run time and GHB is reasonably separated from EOF( Figure 7).
Figure 3. Electropherogram of standard water solution containing GHB (20 µg/mL) and hexanoic acid (IS) (20 µg/mL)
GHB IS
EOF GHB IS
21
GHB IS
IS GHB
EOF
Figure 4. Electropherogram of standard methanolic solution containing GHB (20 µg/mL) and hexanoic acid (IS) (20 µg/Ml)
Figure 5. Electropherogram of standard solution methanol : water 75:25 containing GHB (20 µg/mL) and hexanoic acid (20 µg/mL)
GHB IS
IS GHB
22 A re aG H B /A re aIS Method Validation - Calibration curve
A calibration curve for the standard solutions was built. The concentration range covered was between 0.5 and 80 g / mL. The concentration of the IS was 20 µg mL-1.
The analyte/IS peak-area ratios obtained were plotted against the corresponding concentrations of the analytes (expressed as µg mL-1) and the calibration curves were constructed by means of the least-square method. The equation of the calibration curve is:
y = 0,0592x - 0,002
while the corresponding correlation coefficient is:
R² = 0.9995
demonstrating a good linearity in this concentration range of the calibration curve is shown in Figure 6.
The limit of detection (LOD) and the limit of quantitation (LOQ) were found to be, respectively: LOD = 0.15 µg / mL LOQ = 0.5 µg / mL 5 4 3 2 1 0 20 40 60 80 100 GHB concentration (µg/mL)
23
- Repeatability and intermediate precision
The repeatability of the method was verified by running tests on standard solutions of GHB at 3 different concentrations in the same day. The concentrations of GHB analyzed were 0.5, 40 and 80 µg / mL, while the concentration of the SI is always remained constant at 20 µg / mL.
The data relating to the precision of the analysis results are good: the repeatability, expressed as intraday RSD% (relative standard deviation percentage) was found to be between 0.45% and 1.32% (Table 1). Even the intermediate precision, calculated as RSD% interday, was found to be good, with values between 0.71% and 1.91% (Table 2).
Table 1. Repeatability in standard solutions GHB
0,5 μg/mL 40 μg/mL GHB 80 μg/mL GHB
Area GHB / Area IS Area GHB / Area IS Area GHB / Area IS
1 0,0218 2,090 4,154 2 0,0213 2,070 4,106 3 0,0221 2,052 4,124 4 0,0220 2,076 4,116 5 0,0216 2,109 4,148 6 0,0217 2,082 4,122 RSD% 1,32% 0,92% 0,45%
24
Table 2. Intermediate precision in standard solutions GHB
0,5 μg/mL 40 μg/mL GHB 80 μg/mL GHB
Area GHB / Area IS Area GHB / Area IS Area GHB / Area IS
1 0,0224 2,038 4,152 2 0,0216 2,088 4,090 3 0,0221 2,118 4,116 4 0,0225 2,076 4,126 5 0,0215 2,098 4,068 6 0,0222 2,086 4,108 RSD% 1,91% 1,28% 0,71%
25
- Development of pretreatment procedure
The analysis of pharmacologically active compounds present in a biological matrix involves a preliminary treatment of the clean-up of the biological sample that may be made by various techniques: liquid-liquid extraction, protein precipitation (with organic solvents, with suitable saline solutions or with acids), procedures for solid phase extraction (SPE) or micro extraction (SPME, MEPS).
For the extraction of GHB from biological samples of plasma various pre-treatment procedures were tried including various SPE methods.
Considering the chemical and physical characteristics of GHB cartridges with different characteristics have been tested:
• SAX, strong anion exchange cartridges, and MAX cartridge mixed mode: d hydrophilic / lipophilic balance and anion exchange. Both were discarded due to the incompatibility of the eluent used with electrophoresis system.
• C8: do not recover the IS and the recovery of GHB is less than 70%.
• HLB cartridges hydrophilic / lipophilic balance, discarded because it restrains the GHB.
In light of the tests performed has abandoned the way of treatment by SPE for the clean-up of biological samples.
The precipitation by addition of organic solvents was performed using acetonitrile and methanol. The electropherograms obtained, Figure 8 and Figure 9, using acetonitrile as the precipitating agent, there is a yield lower than the extraction of methanol and also a minor purification.
The methanol was chosen as the precipitating agent and experiments have been made by adding to 100 µL of plasma, different volumes of methanol (from 200 µL to 600 µL). The best results in terms of yield of extraction were obtained by adding 300 µL of methanol, and then this volume was used to precipitate the plasma proteins.
26
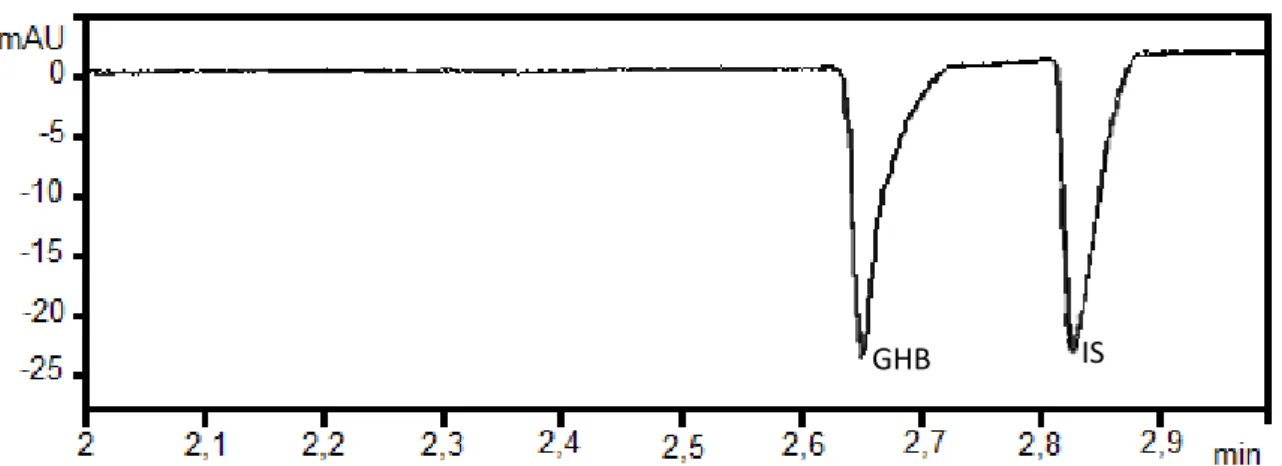
GHB IS
Figure 7 Electropherogram of fortified plasma sample spiked with GHB (20 µg/mL) and hexanoic acid (20 µg/mL) after acetonitrile protein precipitation pretreatment
Figure 8. Electropherogram of fortified plasma sample spiked with GHB (20 µg/mL) and hexanoic acid (20 µg/mL) after methanol protein precipitation pretretment (zoom of the peak area of interest)
IS
GHB
IS
GHB
27
- CE analysis of GHB in fortified plasma
After the setup of pretreatment procedure, the method has been applied to plasma samples. The electropherogram of a blank plasma sample collected from an healthy volunteer, after methanolic protein precipitation, is showed in Figure 9. It can be observed that the extraction procedure is able to remove the interferences from the matrix.
The electropherogram of a plasma fortified with 80 g / mL GHB (plasma concentration), corresponding to 20 g/mL(effective concentration), and 20 g / mL of IS is shown In Figure 10. The discrepancy between the concentration in plasma and the concentration in the injected solution is due to the 1:4 dilution of the sample introduced by the process of precipitation of the proteins.
The two peaks have good symmetry, they appear to be well separated and they have the same migration times observed in the analysis of standard solutions.
Figure 9. Electropherogram of blank plasma after sample pretreatment procedure
28
Figure 10. Electropherogram of plasma fortified with 80 µg/mL di GHB e 80 µg/mL di SI (plasmatic concentrations)
29 A re a G H B / A re aSI - Calibration curve
Calibration curve was set up for the analyte in fortified plasma and good linearity (r2 > 0.9993) was found over the concentration range from 2 to 320 µg / mL plasma concentration, (corresponding to 0.5 to 80 µg / mL in the injected solution).
The equation of the curve obtained by the method of least squares is found to be:
y = 0,0127x - 0,227
while the regression coefficient is:
R² = 0.9993
demonstrating a good linearity in this concentration range of the calibration curve shown in Figure 11.
The limit of detection (LOD) and the limit of quantitation (LOQ) were respectively: LOD = 0.6 g / mL; LOQ = 2 g / mLshowing a good sensitivity of the method.
4,5 4 3,5 3 2,5 2 1,5 1 0,5 0 50 100 150 200 250 300 350 GHB (µg/mL)
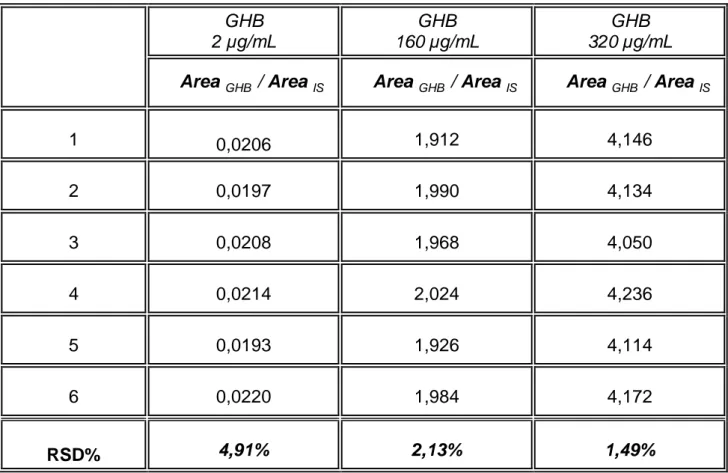
30 Analyte Concentration (μg/mL)a Extraction yeld (%) Repetability (RSD %) Interday Precision (RSD %) GHB 2 88,03 2,36 4,91 160 89,30 1,61 2,13 320 90,90 1,08 1,49
- Extraction yield and precision
The tests of repeatability, or intraday precision, and intermediate precision, or interday precision, have been performed on fortified plasma samples subjected to protein precipitation procedure with methanol. Both are expressed as percentage relative standard deviation values (RSD%)
Extraction yield and precision assays were carried out at three different concentrations, corresponding to the lowest, the intermediate and the highest point of each calibration curve. Three different concentrations of GHB: 2, 160 and 320 µg / mL were added to 100 µL of blank plasma, while the IS added is maintained at a constant concentration of 20 µg / mL.
The results of these assays are reported in Table 3. As can be seen, good extraction yield was obtained with values higher than 88%; the mean extraction yield of the IS was 95%. Precision was also satisfactory, with RSD values always lower than 4.9%.
The repeatability, expressed as RSD% intraday was found to be less than 2.36% (Table 4). Even the intermediate precision, calculated as RSD% interday, was found to be very good with values less than 4.91% (Table 5).
a = plasmatic concentration
31
Table 4.intraday precision in fortified plasma.
Table 5.Interday precision in fortified plasma GHB
2 μg/mL 160 μg/mL GHB 320 μg/mL GHB
Area GHB / Area IS Area GHB / Area IS Area GHB / Area IS
1 0,0204 1,996 4,022 2 0208 1,976 3,996 3 0,0200 1,936 4,090 4 0,0214 1,916 4,114 5 0,0203 1,974 4,068 6 0,0205 1,990 4,042 RSD% 2,36% 1,61% 1,08% GHB 2 μg/mL 160 μg/mL GHB 320 μg/mL GHB
Area GHB / Area IS Area GHB / Area IS Area GHB / Area IS
1 0,0206 1,912 4,146 2 0,0197 1,990 4,134 3 0,0208 1,968 4,050 4 0,0214 2,024 4,236 5 0,0193 1,926 4,114 6 0,0220 1,984 4,172 RSD% 4,91% 2,13% 1,49%
32
- Selectivity
The analysis of plasma samples from six different healthy volunteers showed no evidence of unacceptable interference from endogenous compounds at the retention time of the analytes and the IS. Several compounds that could be co-administered with GHB during clinical practice, such as antipsychotics, antidepressants, nonsteroidal anti-inflammatory and sedative-hypnotics, were tested for possible interference; none of them gave rise to peaks that could interfere with the determination of the analytes. including, all reported in Table 6.
Most of the substances have not been revealed in a normal electrophoretic run; other have different migration times with respect to the analyte, thus not interfere with the indirect revelation of GBH by CE- DAD, ensuring a high selectivity of the method.
ANALYTE Migration time (min) ANALYTE Migration time (min)
GHB 2,64 HEXANOIC ACID
(SI) 2,83
VALPROIC ACID 3,11 ISOBUTYRIC ACID 2,07 TOPIRAMATE n.d. GABAPENTIN n.d. SALICILIC ACID 4,17 (positive peak) ACETILSALICILIC ACID 4,5 (positive peak)
INDOMETACIN n.d. QUETIAPINE n.d. GABA n.d. VENLAFAXINE n.d. LEVOMEPROMAZINE n.d. CARBAMAZEPINE n.d.
33
- Stability
The mean difference in the analyte/IS peak-area ratios between a standard solution of the analytes prepared from stored stock solutions and a standard solution at the same nominal concentration obtained from fresh stock solutions was -0.1%, indicating that all the analytes were stable in methanol when stored at -20°C for 1 month.
Stability was also assessed in plasma samples fortified with known amount of the analytes and stored under various conditions. The concentrations of the analytes found after storage were compared to the respective theoretical concentrations. The mean differences observed were -0.5% for plasma sample kept at room temperature for 6 hours, -1.1% for samples subjected to three freeze-thaw cycles and -1.3% for samples stored at -80°C for 1 month. The loss of the analytes was not significant, indicating that the compounds are stable under the tested storage conditions.
34
Analysis of plasma samples from patients. Analysis of GHB in the plasma of patients under treatment with Alcover®
The validated method was then applied to the analysis of plasma specimens collected from patients treated with Alcover®. A 2 L aliquot of IS were added to a volume of 100 L of plasma sample. This mixture was subjected to the pretreatment procedure than injected. The electropherogram shown in Figure 12 is an example of a plasma sample from a patient treated with 50 mL / day of Alcover® corresponding to 8.75 g / day. The usual dosage for alcohol withdrawal is 50 mg/kg/die, for 3 times in a day corresponding to 10.5 g/day for a 70 kg adult male and could be augmented till 21g /die after 60 days of treatment.29
The value of the concentration of GHB obtained by interpolation on the plasma calibration curve is 35 µg /mL. The blood sampling was carried out 35 minutes after administration of the drug. The maximum plasma concentration is observed, in fact, after 30 minutes of administration. This low plasma value found, which is below the therapeutic range that can vary between 50 µg / mL and 120 µg / mL30, is consistent to clinical responses registered by the medical staff. In fact the patient was considered “non- responder” to the therapy.
A notable interindividual variability was found among the analysed patients in the plasmatic concentrations of GHB (Fig. 13). In some case plasma levels were below therapeutic range. These results support the importance of an appropriate monitoring to optimize administration, especially during the beginning of the therapy. It’s clear that these analytical data could be powerful tools supporting physicians in the pharmacological management of alcohol withdrawal.
35 0 2 4 6 8 10 12 14 16 18 20 22 Dose (mg /day-1 ) GH B pl asm a le vels (µ g m L -1 ) 10 20 30 40 50 60 70 80 90 100
Figure 12. Electropherogram of a plasma sample from a patient treated with 50 mL/day of Alcover® (8.75 g / day)
Figure 13. Plasma levels of GHB found in patients under Alcover® treatment plotted against the daily administered dose.
GHB IS
36
Accuracy
Method accuracy was evaluated by means of recovery assays. Standard solutions of the analytes at three different concentrations were added to plasma samples from patients under GHB treatment (n = 3 for each level) previously analysed and the percentage recovery was calculated. Results were satisfactory, as recovery values were always higher than 88.0%.
Table 7. Accuracy expressed as recovery % Analyt e Added concentration (μg/mL)a Recovery (%) GHB 20 88,76 80 92,97 200 93,84
37
3.4.
ConclusionsAn analytical method based on the use of a CE-DAD system, with indirect revelation has been developed for the analysis of GHB in plasma of alcoholic patients in therapy with Alcover®.A simple technique has been used to perform the clean-up of the matrix, based on the precipitation of the protein that allows to obtain high extraction yields (> 88%). Good results in terms of precision (RSD% always less than 4.91%) and accuracy (recoveries always above 89.0%). were obtained. The indirect revelation method gives a remarkable selectivity. Moreover the use of this electrophoretic technique implicates some other advantages as a limited use of organic solvents and very short time of analysis, always less than 5 minutes.
One of the novelties of this work is represented by the analysis of GHB based on an indirect DAD detection, taking advantage of GHB physical and chemical properties. When compared to other methods reported in the literature which make use of mass spectrometry
[17,18,20-23,25,27-34,36], CE with indirect DAD detection represents a good alternative, as it offers satisfactory
sensitivity and high selectivity, it requires less maintenance and it is less expensive. Moreover, it is less prone to suffer from matrix effect, which could be a drawback in mass spectrometry detection.
In conclusion the present work describes an innovative method that has proven to be accurate, fast and therefore suitable for therapeutic monitoring of alcoholic patients in therapy with Alcover®.
Acknowledgments
We would like to thank Dr. Maria Chiara Pieri (Ser.T. East, AUSL Bologna) for providing the blood samples of patients receiving Alcover®.
38
4. DETERMINATION OF GHB IN DRIED BLOOD
SPOTS FOR THERAPEUTIC DRUG MONITORING
4.1. Introduction
The purpose of the present work was the development of a rapid analytical method for the analysis of GHB in innovative biological matrix, dried blood spots (DBSs). The technique is based on capillary zone electrophoresis with indirect UV absorption detection at 210 nm.
One of the main difficulties physicians have to face in the management of GHB treatment is represented by an heterogeneous response pattern which is partly due to GHB large interindividual pharmacokinetic variability31. In fact, different studies have evidenced that GHB plasma levels vary for a given dose, so contributing to variability in clinical response In addition, during therapy, many patients take concomitant medications that might induce or inhibit some of the CYP isoforms involved in GHB metabolism, thus affecting its pharmacokinetics. This accentuates interindividual response variability and consequentially influences the clinical effects and the safety profile of the drug.
The measurement of hematic concentrations of GHB can help assess patient compliance, tailor the dose to the patient’s needs, minimize the risk of dose-related toxicity and can be useful for clinical decision making. Thus, an accurate therapeutic drug monitoring (TDM) of GHB should be carried out.
As blood (plasma, serum or whole blood) is the optimal matrix for TDM, the use of dried blood spot (DBS) sampling technique can be an attractive approach. In fact, DBSs are easily obtained by a finger prick. The resulting drops of blood are collected onto filter paper and allowed to dry. The use of DBSs offers several advantages: it avoids venous blood withdrawal, thus reducing patient worry, it simplifies storage and transport as no refrigeration is required and it decreases the risk of infection with blood-borne pathogens32 .
To the best of knowledge, no analytical method is currently available for the determination of GHB in DBSs by means of capillary electrophoresis from patients under alcohol withdrawal
39
treatment. In fact, papers from the literature deal with the determination of GHB in human plasma/serum33, urine, whole blood34 samples by means of HPLC methods with fluorecence detection35, Raman spectroscopy36 or GC coupled with mass spectrometry (MS)37.The proposed method is faster and simpler than the others present in literature, and did not require derivatisation step.
Therefore, given the importance of TDM for GHB and the advantages offered by DBS sampling technique, the aim of the present study was to optimize the method previously developed for the indirect determination of the GHB in human plasma (see page 4) for his analysis in DBS.
Chemicals
Methanolic stock solution of GHB (1 mg mL-1) was purchased from LGC Standards (Teddington, UK). Hexanoic acid, used as the internal standard (IS, Figure 1), was from Janssen Chemicals (Beerse, Belgium). Acetone and methanol, 85 % (w/w) phosphoric acid and disodium hydrogen phosphate were obtained from Sigma Aldrich.
TRIS (Tris(hydroxymethyl)aminomethane), TBAB Tetrabutylammonium Bromide,
isovanillic acid, didhydroxybenzoic acid, acetilsalicilic acid, phthalic acid were provided by Sigma Aldrich (Steinheim, Germania);
CTAB (Cetyl-Trimethylammonium Bromide), used for the preparation of BGE, and sodium hydroxide, were supplied by Carlo Erba (Milan, Italy).
Ultrapure water (18.2 MΩ cm) was obtained by means of a MilliQ apparatus by Millipore (Milford, MA, USA).
Preparation of stock and working solutions
The stock solution (1 mg/mL) of GHB was purchased from the pharmaceutical manufacturer. The stock solutions (1 mg/mL) of hexanoic acid (SI) were prepared by diluting the solution of hexanoic acid with a density of 0.927 g / mL. The exact volume of 10.8 µL of this solution were diluted with MeOH in a 10 mL volumetric flask.
Working standard solutions were prepared, daily, by diluting primary stock solutions to desired concentrations, in ultrapure water. All solutions were stored in the freezer at a temperature of 20 ° C. Stock solutions were stable for at least 3 months when stored at
-40
20°C (as assessed by CE assays).
Sample collection
DBS samples were obtained by puncturing the subjects (healthy volunteers and patients under GHB) on a finger with single use lancing device. The first drop of blood was wiped away
using dry sterile gauze, then the blood drops were collected on a FTA® card Whatman® International Ltd (Maidstone, Kent, UK ), paying attention not to go outside the pre-marked circles. The blood spots thus obtained were left to dry for 3 h in the dark at room temperature and then stored in a sealed paper bag (if necessary with a suitable desiccant, i.e. silica gel).
All the blood samples were collected between 8.00 a.m. and 10.00 a.m. from fasting patients under GHB at local Drug Addiction Treatment Centres (Ser.T.); this use for TDM was already authorised at the time of sampling.
Equipment
The instrument used for the analysis of GHB in plasma is a capillary electrophoresis system (CE-3D, Agilent, Palo Alto - CA, USA) equipped with a photodiode array detector (DAD).
The separation was conducted using a fused silica capillary (Composite Metal Services, Hallow UK) with the following characteristics: total length (TL) of 48.5 cm, effective length (EL) of 40.0 cm and internal diameter (ID ) of 75 microns.
The samples were injected from the anode side of the capillary by means of a pressure of 50 mbar for 10s.
The applied voltage was -30 kV. The wavelength of 210 nm was set for detection.
At the beginning of each day, the capillary was conditioned with ultrapure water, 1N NaOH, ultrapure water and BGE, for ten minutes each.
A Crison (Barcelona, Spain) MicropH 2000 pHmeter, a Hettich (Tuttlingen, Germany) Universal 32 R centrifuge, an IKA (Staufen, Germany) RV 10 rotary evaporator and a
microwave oven were also used. Whatman (Maidstone, UK) FTA® classic cards (WB120205) were used for DBS sample collection.
Data were handled by means of ChemStation software from Agilent (Santa Clara, CA, United States).
41
BGE preparation
Prior to use, the mobile phase was filtered through Varian nylon filters (47 mm diameter, 0.2 µm pore size) and degassed by sonication.
The backgound electrolyte (BGE) is constituted by a TRIS buffer 50 mM and benzoate buffer 7mM obtaining pH 8.9.
This buffer is prepared as follows: 50.4 mg of benzoic acid is weighted ad dissolved with approximately 25 mL of water, agitated on a plate heated to 37 ° C. The solution is cold avoiding the formation of benzoate cristals and 302,8 mg of TRIS are added to the clear solution obtained. The solution is adjusted to pH 8.9 with 1 M NaOH, appropriately diluted, and then transferred to a 50 cc flask and filled with ultrapure water. Prior to use, the BGE was filtered through Varian cellulose filters (47 mm diameter, 0.45 µm pore size) and degassed by sonication.
Figure 14.TRIS molecular structure
Extraction from DBS and sample pre-treatment
One or more DBS disks were cut out of the card after the addition of 10 µL of IS
solution (on CE concentration 10 µg mL-1) and were placed into a vial with 300 µL of methanol. The vial was put in a votex for 60 s, then it was sonicated for 5 minutes and finally centrifuged for 10 min at 4000 rpm. Then the extract was brought to dryness under vacuum using a rotary evaporator, dissolved again with 50 µL of methanol and directly injected to CE.
42
The volume of blood contained in the blood spot disks was determined by pipetting known volumes of blood (from 5 to 50 µL) onto the FTA® paper cards with a micropipette: the diameter of the regular-shaped blood spots was then measured and a calibration curve constructed. A power equation was fitted and the equation was used to determine the volume of blood contained in the DBS disks from patients:
y = 0.931 x0.352
where y and x were the diameter and the volume of blood spot, respectively. The volume of blood determined in this way was used for calculating the concentration of GHB in all samples analysed.
43
Method validation
The method was validated following USP XXXVIII26 and “Crystal City”27 guidelines.
- Linearity, limit of quantitation, limit of detection
Aliquots of 6,25 µL of GHB standard solutions at six different concentrations (in order to obtain on-capillary concentrations over the 1-200 µg mL-1 range), containing the IS at a constant concentration (in order to obtain on-capillary concentration of 25 µg mL-1), were added to DBS disks (after the addition DBS samples were left to dry for at least 1 h). The resulting fortified DBS were subjected to the previously described sample preparation and injected into the CE system. This procedure was done in triplicate for each point. The analyte/IS peak-area ratios were plotted against the corresponding concentrations of the analyte (expressed as ng mL-1) and the calibration curve was constructed by means of the least-square method.
The limit of detection (LOD) and limit of quantitation (LOQ) were calculated as the analyte concentrations which give rise to peaks whose heights are 3 and 10 times the baseline noise, respectively.
- Extraction yield and precision
Aliquots of 6,25 µL of GHB standard solutions at three different concentrations (in order to obtain on-capillary concentrations of 4, 50 and 100 µg mL-1), containing the IS at a constant concentration (in order to obtain on-capillary concentration of 25 µg mL-1) were added to DBS disks. The resulting spiked DBS were subjected to the previously described pre-treatment procedures and finally injected into the CE system. The analyte peak areas were compared to those obtained injecting standard solutions at the same theoretical concentrations and the absolute recovery was calculated.
44
repeatability (intraday precision) and six times over six different days to obtain intermediate precision (interday precision), both expressed as percentage relative standard deviation values (RSD%).
- Selectivity
Blank DBS samples from six different healthy volunteers were subjected to the sample pre-treatment procedure and injected into the CE system. The resulting chromatograms were checked for possible interference from endogenous compounds. The acceptance criterion was no interfering peak higher than an analyte peak corresponding to its LOD. Furthermore, standard solutions of several different compounds that could be co-administered in clinical practice were injected into the CE system. A substance was classified as interfering if it gave rise to a peak that was not baseline separated from those of the analytes or the IS.
- Stability
Stability assays were carried out in DBS samples from three patients stored at room temperature (25 ± 3°C) over a period of 1 month (n = 3). DBSs were kept in the dark and in paper bags with a suitable desiccant (i.e. silica gel). The concentrations of GHB found in the stored DBSs were compared to those obtained from the corresponding samples extracted and analysed immediately after initial spotting and drying.
- Accuracy
Accuracy was evaluated by means of recovery assays. Aliquots of 6,25 µL of GHB standard solutions at three different concentrations (i.e. 10, 50 and 100 µg mL-1 of GHB on-capillary concentrations) containing the IS at a constant concentration (in order to obtain on-capillary concentration of 25 µg mL-1) were added to real DBS or plasma samples from subjects under
45
Alcover® therapy whose content of GHB was previously determined.
Recovery values were calculated according to the following formula: 100 ([after spiking] – [before spiking]) / [added].
46
4.2. Results and discussion
Development of electrophoretic conditions
Initially, the same electrophoretic conditions used for the analysis of GHB in human plasma (i.e. small inner diameter capillary, 50 µm, combined with a mixture of benzoic acid CTAB and methanol as BGE) were applied (see page 10). However, for cheapness and simplicity the previous capillary was replaced by another one with grater inner diameter the same functional group but with a conventional inner diameter (4.6 mm instead of 3.0 mm). Consequently, the mobile phase was adapted to suit the chromatographic behaviour of the analyte and the IS on the new column: a mixture of phosphate buffer (25 mM, pH 6.4) and acetonitrile (45:55, v/v) gave satisfactory results.
Some trials were carried out to improve the performance of the CE system in terms of selectivity and sensitivity.
The electropherogram of a standard solution containing 50 µg mL-1 of MTD and 25 µg mL-1 of IS is shown in figure. Migration times (mr) are: GHB, tm = 3.0 min; IS, tm = 5.6 min.
Figure 15 electropherogram of a standard solution containing 50 µg mL-1
of MTD and 25 µg mL-1Migration times (mr) are: GHB, tm = 3.0 min; IS,
47
Development of the extraction from DBS
Several assays were carried out to obtain reliable results and to optimize extraction efficiency of molecules from DBSs. It may vary depending on the best combination of some operating parameters, such as the duration of the extraction procedure, the nature of the solvent employed and the technique used to aid the removal of the compounds from the filter paper.
Spiked DBSs were treated with different solvents or mixtures (acidic or basic buffers, methanol, acetonitrile, buffer/organic solvent mixtures): aprotic organic solvents proved to be unsuitable to remove GHB from the paper (extraction yields < 70%), while aqueous buffers eluted red blood cells which interfered with the assay. Only methanol gave promising results in terms of sample cleaning and extraction yields (> 90 %).
Extraction time and mixing technique were also tested. In particular, ultrasound and vortex agitation were investigated. The extraction efficiency for vortex and ultrasound agitation increased while increasing the duration of the extraction time from 1 to 5 minutes giving satisfactory extraction yield, hence, the combination of these techniques was adopted.
The methanol was then chosen as the precipitating agent; different volumes of methanol, from 200 µL to 600 μL were added to a dried blood spot of 25 µL (finely cut to increase the surface area). The best results in terms of yield of extraction were obtained by adding 300 µL of methanol, and then this volume was used to extract the analyte in solution and at the same time, precipitate the proteins.
The subsequent centrifugation step (4000 rpm for 10 min) allowed to separate the solid residue consisting of fragments of paper and denatured proteins by metabolic solution containing the analyte.
The use of pure methanol allowed to dry out the solution obtained by rotary evaporation and concentrate the analyte six times (from 300 µL to 50 µL).
48
Method Validation
Calibration curves were set up in blank matrices fortified with different concentrations of GHB and a constant concentration of the IS. Good linearity was found in the 1-200 µg mL-1 on-capillary concentration range . The LOD and LOQ values were 0.3 µg mL-1 and 1 µg mL-1, respectively.
Extraction yield and precision assays were carried out at three different concentration levels of GHB, corresponding to the lowest, the intermediate and the highest point of the calibration curve The results were satisfactory, being the extraction yield values higher than 90%; the mean extraction yield of the IS was 92%. Precision was also good, with RSD values always lower than 4.6%.
Table 8 validation parameters
Analita Concentration (μg/mL)a extraction yeld (%) Repeatabilit y (RSD %) intraday precision (RSD %) GHB 1 90,10 2,41 4,62 50 92,30 1,78 2,17 200 93,90 1,17 1,27
49
- Selectivity
The analysis of blank DBS and plasma samples from six healthy volunteers showed no evidence of unacceptable interference from endogenous compounds at the retention times of MTD and the IS. Standard solutions of some opioids and some antipsychotic, antidepressant and sedative-hypnotic drugs were injected into the CE system at concentrations higher than the upper limit of the calibration curve. None of them gave rise to peaks that could interfere with the determination of GHB.
- Stability
Stability was evaluated in DBS samples from 3 patients stored for 1 month at room temperature. The concentrations of GHB found in the specimens after storage were compared with those determined in the fresh samples, revealing a mean difference of -2.3%. This percentage of loss is not significant, especially if the relative long time of storage (1 month) is considered. Thus, GHB can be considered stable in DBS under the tested condition of storage.
50
SI GHB
Analysis of samples from patients
The method was applied to the analysis of DBS and plasma samples collected from 6 former alcohol addicted subjects under Alcover. As an example, the electropherogram of a DBS sample from one of these patients treated with 50 mg day-1 of GHB is reported in figure 16 , , a good correlation (r2 = 0.998) was obtained between the concentrations of GHB found in DBS and those found in the corresponding plasma samples, taking into account the presence of haematocrit in DBS and its absence in plasma. In fact, since the haematocrit is normally about 40–54% for men and 36-46% for women (mean 45%), the concentrations found in DBS samples were multiplied by a correction factor of 1.79 to obtain the corresponding plasma concentrations.
51
Analita Concentration added
(μg/mL)a Recovery (%) 1 90,16 5 90,66 50 92,84 Accuracy
Method accuracy was evaluated by means of recovery assays. Standard solutions of the analytes at three different concentrations were added to DBS or plasma samples from patients previously analysed and the percentage recovery was calculated. Accuracy was satisfactory, being recovery values always higher than 90.0%.
52
4.3. Conclusions
A reliable CE method with indirect DAD detection has been optimized for the determination of GHB in DBS and human plasma samples. GHB removal from DBSs was performed by means of ultrasound-assisted extraction, clean up and precipitation with methanol.. The reliability of DBS specimens in the determination of GHB blood levels was evaluated: the analyte proved to be stable in the DBS matrix for at least one month and the concentrations of GHB obtained from the analysis of DBS samples were perfectly comparable with those found in the corresponding plasma specimens. No interferences were found neither from the most common exogenous nor from endogenous compounds. Our procedure can offer a rapid, precise and accurate method for GHB determination in innovative biological fluids, which could be important for screening purposes in routine clinical analysis.
Since the outcome of alcoholic withdrawal therapy is highly variable depending on different factors, such as individual metabolism, it is of principal importance to accurately determine GHB blood levels in order to optimize the dosage in each subject. The developed method allows to perform TDM of patients under Alcover® treatment with all the advantages offered by DBS technique, including low invasiveness of the sampling procedure and low cost of sample collection, transport and storage.
53
5. ANALYSIS
OF
ADULTERANTS
PRESENT IN STREET DRUGS BY
CE-DAD
5.1. Introduction
The presence of pharmacologically active adulterants in seized illicit drugs is common, and many of these substances can cause unwanted local and systemic reactions, therefore contributing to the overall toxicity of the "street drug".
Due to this situation, the analytical information derived from the analysis of street drugs is very important for legal and crime investigation purposes. Capillary electrophoresis (CE) is well suited for the analysis of illicit drugs: it can separate a wide variety of solutes with high efficiency and selectivity, including highly polar, thermally labile and/or non-volatile compounds which could prove difficult to analyse via gas chromatography (GC) and high performance liquid chromatography (HPLC)38.
The aim of this study is the development of a micellar electrokinetic chromatography (MEKC) method suitable for the analysis of several different basic, acidic and neutral solutes, for the purpose of screening adulterants in seized substances.
The proposed method uses a BGE containing SDS in phosphate buffer, a 48.5 cm uncoated fused silica capillary and a photodiode array (PDA) detector set at 233 nm. It is capable of discriminating atropine, lidocaine, quinidine, acetaminophen, scopolamine, caffeine, theophylline, salicylic acid and tetramisole in their mixtures.
The illicit market of drugs of abuse is constantly evolving and the active ingredients, especially when they reach a status relevant business, may be subject to adulteration and sophistication.39
The main reason that pushes to dilute drugs is economic. In fact the so-called "cut" allows cost reduction in production that has as a direct result of the increase in profits of drug traffickers40.
54
understanding of the phenomena of "accidental overdose" of unexpected side effects and routes of distribution to various countries41
Among these are harmless diluents such as sugars, but also substances that induce a physiological response defined adulterants and processing residues, contaminants.
Substances that have a pharmacological, that mimic or enhance the effects of the drug are considered adulterants.
Adulterants can be in any illegal substance, at any concentration. It is important to recognize the presence of these substances when a person has a "mixed picture", a manifestation of unusual side effects, after taking an illegal substance. The synergistic effect produced by the presence of adulterants in the composition of "street drugs" can be a determining factor in the pathogenesis of acute intoxication by drugs as well as a previous or concomitant use of other substances such as alcohol or drugs may amplify the toxicity .Adulterants used are countless variations and ever new, difficult to categorize in analysis laboratories. For the Police Forces, tracking drugs requires constant updates and high costs: the lists of prohibited substances, despite efforts in the media and in research, are not always complete and still differ from state to state42. The content of adulterants increases in the various steps of the distribution chain43.