UNIVERSITA’ DEGLI STUDI DI NAPOLI
FEDERICO II
Ph.D Thesis in Chemical Sciences
XXXI CICLO
Targeted tandem mass spectrometry strategies to
quantify proteins biomarkers of inflammatory diseases
Anna Illiano
Tutor
Supervisor
Prof. Angela Amoresano
Prof. Marco Trifuoggi
Coordinator
Prof. Luigi Paduano
Beato l’uomo che si dedica alla sapienza e riflette con la sua intelligenza, che medita nel cuore le sue vie e con la mente ne penetra i segreti. [Siracide, 14:20-21]
Aknowledgments
Department of Chemical Sciences Prof. Angela Amoresano
Prof. Piero Pucci Prof. Leila Birolo Prof. Renata Piccoli Dr. Angela Arciello
Department of Molecular Medicine and Medical Biotechnology Prof. Margherita Ruoppolo
Department of Scienze Mediche Traslazionali Prof. Luigi Greco
Prof. Renata Auricchio Prof. Alfredo Nicosia
Grupo de Reumatologia de Instituto De Investigación Biomédica (INIBIC)-A Coruña (Es) Dott. Cristina Ruiz-Romero
Prof. Francisco Javier Blanco Garcíaz
Dott. Valentina Calamia Dott. Patricia Fuentez-Fernandez
Carabinieri RIS Department of Rome Ten.Col. Giuseppe Peluso
My colleagues: Dr.Gabriella Pinto Dr. Andrea Carpentieri Dr. Chiara Melchiorre Dr. Georgia Ntasi Dr. Carolina Fontanarosa Dr. Rosa Gaglione
INDEX
PAG.SUMMARY 1
CHAPTER 1 6
1.1 INTRODUCTION 6
1.1.1 OMICS AND SYSTEM BIOLOGY 6
1.1.2 COMPONENTS DATA 6
1.2 MASS SPECTROMETRY 8
1.2.1 ELECTROSPRAY (ESI) 10
1.2.2 QUADRUPOLE (Q) MASS ANALYSER 11
1.2.3 TANDEM MASS SPECTROMETRY 12
1.2.4 INSTRUMENTS FOR MS/MS ANALYSIS 12
1.2.5 QUADRUPOLE ION TRAP (IT) 13
1.2.6 LINEAR ION TRAP (LIT) 14
1.3 MASS SPECTROMETRY-BASED OMICS 18
1.3.1 MASS SPECTROMETRY-BASED METABOLOMICS 19
1.3.2 MASS SPECTROMETRY-BASED PROTEOMICS 21
1.3.3 SRM IN CLINICAL APPLICATIONS 23
CHAPTER 2 25
2.1 SRM METHOD 25
2.1.1 ANALYTICAL APPROACH 25
2.1.2 IDENTIFICATION OF TARGETED ANALYTES 25
2.1.3 SELECTION OF OPTIMAL TRANSITIONS 26
2.1.4 OPTIMIZATION OF SRM TRANSITIONS 27
2.1.5 VALIDATION OF THE TRANSITIONS AND MATRIX EFFECT 28
2.1.6 QUANTIFICATION BY SRM 30
2.2 REFERENCES 32
CHAPTER 3 35
3.1 INTRODUCTION 35
3.1.1 PHOSPHOLIPIDS AND PHOSPHATIDYLCHOLINE 36
3.1.2 PHOSPHATIDYLCHOLINE BIOSYNTESIS 37
3.1.3 CELIAC DISEASE 38
3.1.4 AIM OF THE STUDY 39
3.2 MATERIAL AND METHODS 42
3.2.1 MATERIAL 42
3.2.2 METHODS
3.2.3 METHOD VALIDATION
42 48
3.3 RESULTS AND DISCUSSION 50
3.3.1 METHOD SET UP 50
3.3.2 METHOD VALIDATION ON CD AND CTRL INFANT SERA SAMPLES 53
3.4 CONCLUSIONS 59
CHAPTER 4 62
4.1 INTRODUCTION 62
4.2 MATERIAL AND METHODS 65
4.2.1 CHEMICALS AND REAGENTS 65
4.2.2 CELL CULTURE 65
4.2.3 PREPARATION OF STANDARD SOLUTIONS AND IN SOLUTION DIGESTION 65 4.2.4 SAMPLE PREPARATION: IN SOLUTION DIGESTION OF LPS STIMULATED
THP1CELLULAR EXTRACTS
66 4.2.5 LC–MS/MS INSTRUMENTATION AND CONDITIONS: MRM TARGETED
PROTEOMIC APPROACH
66 4.2.6 METHOD VALIDATION LIMIT OF DETECTION AND QUANTITATION. 68
4.3 RESULTS 70
4.3.1 THP-1 DIFFERENTIATION AND LPS STIMULATION 70
4.3.2 MRM METHOD SET UP 73
4.3.3 MRM/MS METHOD APPLIED ON LPS STIMULATED THP-1 CELLS 75
4.3.4 TNF-Α 77 4.3.5 INF-Γ 78 4.3.6 IL-8 78 4.3.7 IL-10 78 4.4 CONCLUSIONS 80 4.5 REFERENCES 81 CHAPTER 5 83 5.1 INTRODUCTION 83
5.1.1 RHEUMATOID ARTHRITIS: ETIOLOGY, GENDER DISTRIBUTION AND SOCIAL IMPACT.
83
5.1.2 RHEUMATOID ARTHRITIS DIAGNOSIS 84
5.1.3 SERUM BIOMARKERS AND RA DIAGNOSIS 85
5.1.4 AIM OF THE STUDY 87
5.2 MATERIAS AND METHODS 88
5.2.1 SAMPLES 88
5.2.2 MATERIALS 88
5.2.3 SELECTION OF TARGET PEPTIDES 88
5.2.4 DESIGN OF MULTIPLE REACTION MONITORING (MRM) METHODS 88
5.2.5 SAMPLE PROCESSING 89
5.2.6 CALIBRATION CURVES AND SIS PEPTIDE MIXTURES 89
5.2.7 LC-MS/MS METHODS 90
5.2.8 DATA PROCESSING 90
5.3 RESULTS 92
5.3.1 ASSAY DEVELOPMENT 92
5.3.2 ANALYSIS OF RA SERUM SAMPLES 94
5.3.3 PRISM ANALYSIS 100 5.4 CONCLUSION 106 5.5 REFERENCES 107 5.6 SUPPORTING DATA 110 CHAPTER 6 119 6.1 INTRODUCTION 119
6.2.1 IN-SOLUTION DIGESTION OF PROTEINS FROM BIOLOGICAL MATRICES 122
6.2.2 TEST SPECIMENS 123
6.2.3 ANALYSIS OF REAL SAMPLES 124
6.2.4 LC-MS/MS ANALYSIS 124
6.2.5 MRM TARGETED PROTEOMIC APPROACH 125
6.3 RESULTS 127
6.3.1 SELECTION OF PROTEIN BIOMARKERS OF BIOLOGICAL MATRICES 127 6.3.2 DEVELOPMENT OF MRM METHODS SPECIFIC FOR EACH BIOLOGICAL
MATRIX AND A SINGLE MRM
129
6.3.3 ANALYSIS OF TEST SPECIMENS 131
6.3.4 ANALYSIS OF REAL CRIME SCENE SAMPLES 134
6.5 DISCUSSION 138
6.6 REFERENCES 141
6.7 SUPPLEMENTARY DATA 143
CHAPTER 7 174
7.1 INTRODUCTION 174
7.1.1 HUMAN COLORECTAL CARCINOMA 174
7.1.2 DNA MUTATIONS 174
7.1.3 HCT116 TUMOR LINE 175
7.2 MATERIALS AND METHODS 178
7.2.1 SAMPLE TREATMENT 178
7.2.2 DEVELOPMENT OF LC-MRM-MS METHOD 178
7.3 RESULTS AND DISCUSSION 181
7.4 CONCLUSION 188
7.5 REFERENCES 189
CHAPTER 8 190
8.1 SRM COMPARED TO OTHER QUANTIFICATION TECHNIQUES 190
8.2 ADVANTAGE OF SRM 191
1
Abstract
Mass spectrometry is a sensitive technique used to detect, identify and quantitate molecules based on their mass-to-charge (m/z) ratio in simple and complex mixtures. Originally developed almost 100 years ago to measure elemental atomic weights and the natural abundance of specific isotopes, MS was first used in the biological sciences to trace heavy isotopes through biological systems.
The following PhD project was involved in the application of advanced methods of mass spectrometry in Multiple Reaction Monitoring ion mode (MRM) into different metabolomics and proteomics research areas.
For the most part, the studies conducted over the past three years have had a single common thread: development and application of MRM mass spectrometry methods for the identification and quantification of targeted metabolites and/or proteins involved in inflammatory processes.
It is clear that, for each project, we started from the study of the different biological matrices to find the most effective extraction strategy for the target analytes and subsequent steps have covered in-depth literature studies to identify the best condition to perform chromatographic separation and the subsequent optimization of instrumental parameters.
The three main areas of application explored in these years concerned the following three points:
1. MRM/MS analysis of metabolites
In collaboration with Prof. Greco, Prof. Auricchio and Prof. Ruoppolo of the Department of Translational Medical Sciences and Department of Molecular Medicine and Medical Biotechnology of the University of Naples Federico II.
The project provided for the development of a method that allow the investigation of the lipidomic profile of genetically predisposed children to celiac disease in order to identify potential molecular biomarkers for disease prediction, first of all, in genetically predisposed patients but also for subjects whose clinical history is unknown.
Serum samples of two cohorts: 23 children who became coeliac and 23 not yet (used as control), do share a similar genetic background, since they come from families with one celiac proband and bear the specific HLA haplotype (DQ2 or DQ8). It does appear that the genetic profile may not explain fully the great differences found between the two cohorts. The
2
developed MRM method allowed to monitor and quantify 83 different classes of analytes and allowed us to identify some classes of lipids as putative molecular biomarkers by comparing the results obtained from the analysis of the samples of serum collected at 4 months, before introduction of gluten, at 12 months, with the introduction of gluten in the diet of the child and a t> 12 months for children who have been diagnosed with celiac disease.
2. MRM/MS analysis of proteins.
A peculiar feature of a MRM method is the ability to monitor multiple precursor ion-product ion transitions. This greatly increase the selectivity and specificity of the analysis and this represents a huge advantage in the proteomic field because each target analyte, in this case peptide, it can be identified within complex mixtures (such as biological fluids) by monitoring transitions closely related to its own amino acid sequence. Different biological aspects were investigated:
- The project, in collaboration with Prof. Piccoli and Dr. Arciello of the Department of Chemical Sciences of the University of Naples Federico II, involved the development and optimization of an MRM method for the quantification of proteins involved in inflammatory processes: TNF -α, INF-γ, IL-8 and IL-10 in THP-I cell samples. In particular,
differentiated cells have been treated with LPS, a well-known endotoxin, to stimulate the onset of an inflammatory process. A time course analysis was performed on differentiated and stimulated cells with LPS for 2h, 4h, 6h, 9h and 24h.
These analyses allowed to monitor the variation in protein expression during the whole inflammatory process, in both acute and late phase of the inflammation and the obtained data are consistent with published works. Quantitative analysis was conducted using the external standard method. In order to increase the selectivity and the specificity of the method, for each target protein, two or three peptides have been identified thanks to the aid of bioinformatic software which have a unique amino acid sequence and can be used as a stoichiometric representation of the protein in the quantitative analysis.
- Project in collaboration with prof. Francisco Blanco and Dr. Cristina Ruiz-Romero of the INIBIC Biomedical Research Institute of A Coruña, Spain. At this research institute I spent six months for the foreign period of the PhD.
3
In these months I have worked on both the optimization of a SIS-MRM/MS method for the quantification of proteins involved in rheumatoid arthritis (RA) pathogenesis and the application of this method to a cohort of 80 serum samples of subjects whom RA has been diagnosed. Quantitative analysis was performed using the internal standard method: stable isotope labelled standard peptides (SIS) were used. The target peptides belong to proteins that were statistically significant (p <0.05) in previous experiments of 8-plex iTRAQ and large-scale proteomics. RA diagnosis is complex and nowadays it is carried out by putting together radiographic data, DAS 28 and serum parameters such as C-reactive protein, rheumatoid factor (RF) and anti-citrullinated antibodies (ACPA) levels. The main problem in diagnostics is incurring false positives, as in the case of RF that shows the same trend also in other diseases like: chronic hepatitis, chronic viral infections, leukaemia, dermatomyositis, mononucleosis, scleroderma, Hashimoto's thyroiditis, systemic lupus erythematosus and Sjögren's syndrome.
First step involved the development of the method, the validation of the selected transitions and the choice of the concentration of labelled peptides to be added to the real samples to obtain the best signal/noise ratio. Reverse calibration curves for each heavy target peptide were realized and analytical parameters Detection limit (LOD), Quantification limit (LOQ) and linearity range were calculated.
The developed method was used for the identification and quantification of the 10 target proteins in a cohort of 80 samples of sera from RA patients subdivided into 4 sub-groups based on rheumatoid factor (RF) and anti-citrullinated antibodies (ACPA) values. The four sub-groups were: RF-/ACPA-, RF-/ACPA+, RF+/ACPA- and RF+/ACPA+.
Data analysis allowed to select some of the proteins monitored for the subsequent steps of method validation by using complementary techniques such as ELISA immunoassay.
3. MRM/MS analysis for discovery.
- An interesting application of mass spectrometry in MRM ion mode was in forensic field for the identification of biomarker proteins of biological fluids. This project was carried out in collaboration with Ten.Col. Peluso of the RIS department of the Carabinieri in Rome. The basic idea was to exploit the potential of mass spectrometry in MRM ion mode to identify
4
the nature of biological traces found at a crime scene from which the DNA was extracted. In this way it is possible to conduct complementary investigations on both the identity of the suspect and the sequence of events that lead to the crime. Presumptive and confirmatory tests are needed to be absolutely sure of the identity of the biological fluid found at a crime scene. These tests suffer from limitations due, above all, to poor specificity and to the necessity to conduct cascade tests to evaluate the nature of the trace. The developed MRM method allows to overcome these limitations as it allows to discriminate between four biological matrices: blood, saliva, seminal fluid and urine through a single analysis and through a single sample treatment, which involves hydrolysis with trypsin, to carry out the extraction DNA and the subsequent proteomic analysis.
- Project in collaboration with Prof Nicosia from Department of Molecular Medicine and Medical Biotechnologies of the University of Naples Federico II for the identification of proteins in HCT116 cells (human colorectal tumour cells) deriving from alternative splicing processes and which could be closely related to the onset and progression of this type of cancer. Previous studies performed on mRNA have shown that such alternative splicing phenomena lead to proteins that have a mutated sequence to C-ter. This sequence was used for setting up of the MRM / MS method thanks to the high specificity and selectivity that derives from the use of mass spectrometry in this mode, but above all the high sensitivity to which it is possible to arrive (amol/μL). A method was developed to identify the presence of 5 mutated proteins using the mutated C-ter aminoacidic sequence as molecular target and it was possible to verify the presence of these mutated sequences confirming the translation of these proteins.
Finally, for the method validation HT 29 and LS147T cell lines were used. The results seem promising, in all the selected cell lines the mutated proteins were detected. Further developments concern the implementation of the MRM / MS method developed with the use of isotopically labelled peptides to validate and perform quantitative analysis.
5
Results obtained in the present PhD thesis show the broad applicability of the MRM/MS methodology. This strategy was effective both during the discovery phase and for the quantitative analysis of metabolites and proteins, demonstrating high sensitivity, selectivity and specificity. The chance to simultaneously analyse a panel of numerous analytes allows to optimize analysis times and costs.
Finally, the "multiple" ability of this method allows all methods to be implemented by inserting the characteristic transitions of heavy isotopically labelled standards that have the same chemical and physical properties of the target molecules but different m/z ratio. The use of an internal standard is fundamental to evaluate the matrix effect, the efficiency of an extraction methodology and the identification of an analyte in complex samples.
Subsequent steps for the presented projects are mainly focused on the implementation of the developed MRM methods with isotopically labelled standards, the validation of the obtained results by complementary techniques (ELISA) and the development of kits that can be used in clinical practice for diagnostics or follow-up of patients suffering from various diseases or in forensic investigations.
6
Chapter 1
1.1 Introduction
1.1.1 Omics and system biology
‘Omic’ technologies adopt a holistic view of the molecules that make up a cell, tissue or organism. They are aimed primarily at the universal detection of genes (genomics), mRNA (transcriptomics), proteins (proteomics) and metabolites (metabolomics) in different biological compartments such as whole blood, plasma and urine. The integration of these techniques is called systems biology1.
Systems biology is based on the understanding that the whole is greater than the sum of the parts. It has been responsible for some of the most important developments in the science of human health and environmental sustainability2. It is a holistic approach to deciphering the complexity of biological systems integrating many scientific disciplines – biology, computer science, engineering, bioinformatics, physics and others – to predict how these systems change over time and under varying conditions, and to develop solutions to the world’s most pressing health and environmental issues.
Components data yield information regarding the specific molecular content of the cell or system. Interactions data specify the connectivity that exists among the molecular species, thereby defining the network 'scaffold' within the cell or system. Finally, functional-states data reveal the overall behaviour, or phenotype, of the cell or system 3.
This ability to design predictive, multiscale models enables our scientists to discover new biomarkers for disease, stratify patients based on unique genetic profiles, and target drugs and other treatments. Systems biology, ultimately, creates the potential for entirely new kinds of exploration, and drives constant innovation in biology-based technology and computation.4
1.1.2 Components data
Genomics. Genomics is defined as the study of the whole genome
sequence and the information contained therein. It is clearly the most mature of the omics-sciences. Since 1995, nearly 300 genome-sequencing projects, with representative species from each of the three kingdoms of life, have been completed 5and hundreds more are underway.
7
The genomic sequence is used to study the function of the numerous genes (functional genomics), to compare the genes in one organism with those of another (comparative genomics), or to generate the 3-D structure of one or more proteins from each protein family, thus offering clues to their function (structural genomics).
Genome annotation provide information about human and other major model organisms on complement of proteins and functional RNAs, transcription-factor-binding sites in genomic sequences and on complete set of translated open reading frames (ORFs) and the exon-intron structures from which they are assembled.
Transcriptomics. The transcriptome is the total mRNA in a cell or
organism and the template for protein synthesis in a process called translation. The transcriptome reflects the genes that are actively expressed at any given moment (Horgan RP 2011). Microarrays and serial analysis of gene expression (SAGE) represent the most well-used approaches and have been applied to many model systems, as well as to the study of genes that are predominantly expressed in stem cells, to classifying the molecular subtypes of human cancers, and to monitoring the host-cell transcriptional response to pathogens (Joyce A. R. 2006).
Proteomics. The proteome is defined as the set of all expressed proteins
in a cell, tissue or organism. Proteome analysis presents specialized analytical problems in two major areas: i) dynamic expression range and ii) diversity of protein expression (multiple protein forms). In order to clarify proteome– phenotype relationships, several studies are dedicated to the development of new technology to explain the link between protein-expression profiles and distinct cellular processes or conditions6. In particular, one strategy that is being developed involves overcoming the problem of detecting only the most highly represented proteins in biological samples by focusing on unique characteristic peptides for each protein or protein isoform .3
Metabolomics. The metabolome refers to the complete set of low
molecular weight compounds in a biological sample. These compounds are the substrates and byproducts of enzymatic reactions and have a direct effect on the phenotype of the cell. Metabolites are the final products of the genome, transcriptome and proteome integration. The metabolome consists of molecules that have high chemical and physical heterogeneity. Metabolomics is fast becoming a popular tool for studying the cellular state of many systems, including plants, the human red blood cell and microbes, as well as in
8
metabolic-engineering applications, in pharmacology and toxicology and in human nutritional studies.3
Lipidomics. Lipidomics is the systems-level analysis of lipids (fat
molecules) and their interactions. It is a science still in its infancy but one that promises to revolutionize biochemistry. Lipids are grouped into eight categories that share common physical and chemical properties, and there are currently some 38,000 documented lipids7.
Lipids that occur rarely or in small quantities are often the most effectual lipids in biological processes, meaning they are particularly important in disease diagnostics and in understanding pathology. Lipidomics can elucidate the pathology and treatment of many diseases such as cancer, diabetes, obesity, cardiovascular disease, arthritis, asthma, inflammatory bowel disease, Alzheimer's and others due to the associated disruption of lipid metabolic enzymes and pathways. A better understanding of lipidomics could significantly advance diagnostic medicine as well as provide novel treatment options8.
1.2 Mass spectrometry
Mass spectrometry is a reproducible methodology based on the determination of the molecular mass, which is not dependent on the experimental conditions. Most important features of mass spectrometry are: reproducibility, sensitivity, accuracy.
Mass spectrometry is based on the production of gas phase ions. These ions can interact with an electric field and can be resolved following their electro-dynamic attitude, which is dependent on their mass-to-charge ratio.
Today a wide variety of mass spectrometers is available, all sharing the capability to assign mass-to-charge values to ions, although the principles of operation and the types of experiments that can be done on these instruments differ greatly.
Mass spectrometers have four essential parts:
a) system for sample introduction
b) source that produces gas phase ions from the sample c) one or more mass analyser to separate ions
9 d) ion detector.
Sample under investigation is introduced into the ion source of the instrument where the sample molecules are ionized. These ions are extracted into the analyser region of the mass spectrometer where they are separated according to their mass-to-charge ratios (m/z). The separated ions are detected, and the generated signals sent to a data system where the m/z ratios are stored together with their relative abundance for presentation in the format of an m/z spectrum (Fig. 1.1).
A class of mass spectrometers can be distinguished on its ionization system and on the type of analyser, that is an essential component to define the accessible mass range, sensitivity and resolution.
All mass spectrometers are operated at very low pressure to prevent collisions of ions with residual gas molecules in the analyser during the flight from the ion source to the detector.
The most widespread ionization methods in biochemical analyses are Electrospray Ionization (ESI) and Matrix Assisted Laser Desorption Ionization (MALDI). Mass analysers as quadrupoles (Q), ion traps (IT), time-of-flight (TOF), or combination of these in “hybrid instruments”, are commonly used for their good resolution and sensitivity. TOF analysers are typically used in combination with MALDI sources (MALDI-TOF MS instruments). However, both MALDI sources and TOF analysers can be used in different configuration.
The coupling of Liquid Chromatography (LC) and tandem Mass Spectrometry (MS/MS) is a widely used analytical technique for quantitative
Figure 1: Working process of a mass spectrometer, from sample
10
and qualitative analysis. Electrospray Ionization (ESI), Atmospheric Pressure Chemical Ionization (APCI), or Photo Ionization (APPI) allow the ionization of various semi-volatile, thermally labile, and polar to non-polar compounds, such as pharmaceuticals, pesticides, personal care products, steroids, explosives, drugs of abuse etc., in trace levels. Generated ions will be transferred after ionization through a vacuum interface into the mass analyser.
1.2.1 Electrospray (ESI)
Electrospray Ionization (ESI) has had a tremendous impact over the last few years on the use of mass spectrometry in biological research. ESI is well suited to the analysis of polar molecules ranging from less than 100 Da to more than 1,000,000 Da in molecular weight. In contrast to MALDI, in which the sample is a dried, crystalline admixture of protein/peptide sample and matrix, the peptides or proteins to be analysed by ESI are in aqueous solution. Proteins and peptides exist as ions in solution because they contain functional groups whose ionization is controlled by the pH of the solution.
During standard electrospray ionization sample is dissolved in a polar, volatile solvent and pumped through a narrow, stainless steel capillary (Fig. 1.2). A high voltage of 3 or 5 kV is applied to the tip of the capillary situated within the ionization source of the mass spectrometer and the sample emerging from the tip is dispersed into a spray of highly charged droplets, a process that is aided by a co-axially introduced nebulising gas flowing around the outside of the capillary.
11
This gas, usually nitrogen, helps to direct the spray emerging from the capillary tip towards the mass spectrometer. The charged droplets diminish in size by solvent evaporation, assisted by a warm flow of nitrogen known as the drying gas which passes across the front of the ionization source. Eventually charged sample ions, free from solvent, are released from the droplets, some of which pass through a sampling cone or orifice into an intermediate vacuum region, and from there through a small orifice into the analyser of the mass spectrometer, which is held under high vacuum. Electrospray is known as a “soft” ionization method (such as MALDI) as the sample is ionized by the addition or removal of a proton, with very little extra energy remaining to cause fragmentation of the sample ions.
The peculiar aspect of this technique is the fact that it gives rise to multiply charged molecular-related ions such as (M+nH)n+ in positive ionization mode and (M-nH)n- in negative ionization mode. Because of the form assumed by the signal, this source is not useful to the analysis of complex mixtures. For this reason, RP-HPLC system is generally coupled to ESI-source. ESI source generally works with quadrupole and ion trap analysers.
1.2.2 Quadrupole (Q) mass analyser
Quadrupole mass analyser (Figure 3) has now become one of the most widely used types of mass analyser because of its ease of use, small size and relative low cost. It consists of four parallel rods that have fixed DC and alternating RF potentials applied to them. Ions produced in the source of the instrument are then focused and passed along the middle of the quadrupoles. Their motion will depend on the electric fields so that only ions of a particular
m/z will be in resonance and thus pass through to the detector following a stable
12
Figure 3:Quadrupole mass analyzer
All other ions do not have a stable trajectory through the quadrupole mass analyser and will collide with the quadrupole rods, never reaching the detector. The RF is varied to bring ions of different m/z into focus on the detector and thus build up a mass spectrum.
1.2.3 Tandem mass spectrometry
Tandem mass spectrometry (MS/MS) is used to produce structural information about a compound by fragmenting specific sample ions inside the mass spectrometer and identifying the fragment ions. Tandem mass spectrometry also enables specific compounds to be detected in complex mixtures because of their characteristic fragmentation patterns. Tandem mass spectrometry uses two stages of mass analysis, one to preselect an ion and the second to analyse fragments. Generally, in a tandem mass spectrometer the two analysers are separated by a collision cell where an inert gas (e.g. argon, xenon) collides with the selected sample ions and brings about their fragmentation.
1.2.4 Instruments for MS/MS analysis
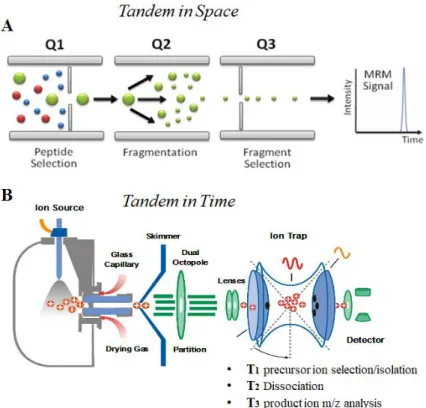
Instruments for tandem mass spectrometry can be classified as tandem in
space or tandem in time (Figure 4). Tandem in space means that ion selection,
ion fragmentation and fragments analysis, are events that occur in three different regions of the spectrometer; instruments of this type are the triple quadrupole (QqQ) and hybrid instruments such as Q-TOF, ESI-QqLIT or MALDI-TOF-TOF. In tandem in time instruments, those three steps of analysis occur in the same region of the spectrometer but in different times; three-dimensional ion trap are instruments classified as tandem in time.
13
Figure 4:Schematic representation of tandem-in-space (A) and tandem-in-time (B)
instruments.
A commonly used instrument is the triple quadrupole, where two resolving quadrupoles mass filters are separated by a fragmentation cell. These are considered to be “beam-type” mass spectrometers because they are most often used with a continuous ion beam: when one of the mass filters is scanning, most of the ions are rejected by the instrument, resulting in poor sample use and low sensitivity, whereas when the mass filters are not scanning, but are transmitting a pre-selected ion, sensitivity and sample use are very high. MSMS mass spectrometer are Quadrupole ion Trap, Linear ion trap and triple quadrupole.
1.2.5 Quadrupole ion trap (IT)
The quadrupole ion trap is based on the same principle as the quadrupole mass filter, except that the quadrupole field is generated within a three-dimensional trap. The trap consists of three electrodes, a ring electrode and two hemispherical end caps electrodes. These electrodes allow to trap ion in a small volume (Figure 5). In IT, ions are dynamically stored in a three-dimensional
14
quadrupole ion storage device. The RF and DC potentials can be scanned to eject successive m/z ratios from the trap into the detector.
Figure 5: Graphical representation of a Quadrupole Ion Trap geometry
The advantages of the ion-trap mass spectrometer include compact size, and the ability to trap and accumulate ions to increase the signal-to-noise ratio of a measurement. For these reasons, ion traps are used in fragmentation experiments. Conventional ion trap mass spectrometers operate with a three-dimensional (3D) quadrupole field, which confers to the analysis very high efficiency as regard the time to fill the ion trap and to generate a complete mass spectrum, but presents some problems as regard the trapping efficiencies, primarily due to their small volume. Thanks to the introduction of linear ion traps, characterized by a greater ion accumulation capacity and greater trapping efficiency, these problems have been overcome.
1.2.6 Linear ion trap (LIT)
Single quadrupole systems contain only one mass filtering quadrupole while triple quadrupole systems consist of three quadrupoles. Q1 and Q3 are working as mass filters while Q2 is acting as collision cell. Quadrupoles can be used in scanning or filtering mode. During a mass scan, DC and RF voltages are ramped resulting in the acquisition of full scan mass spectra. Such spectra are typically used for qualitative data analysis. However, scanning a quadrupole suffers from low sensitivity and slow scan speed. Thus, quantitative studies are performed with quadrupoles working in filtering mode. The most selective mode to use a single quadrupole MS is called Selected Ion Monitoring (SIM). Hereby, a fixed set of DC and RF voltages is applied to the quadrupole and thus only a single m/z can pass. Ions with different m/z are filtered out. A fundamental understanding of the scan modes associated with
15
the TQMS is essential for understanding the MS and MS/MS capabilities of the instrument.9.
Ion trapping can also be performed in linear 2D ion trap devices (LIT) (Le Blanc et al., 2003). The combination of triple quadrupole MS with LIT technology in a form of an instrument of configuration QqLIT, is particularly interesting because this instrument retains the classical triple quadrupole scan functions such as selected reaction monitoring (SRM), product ion (PI), neutral loss (NL) and precursor ion (PI) while also providing access to sensitive ion trap experiments. In addition, for peptide analysis, the enhanced multiply charged (EMC) scan allows an increase in selectivity, while the time- delayed fragmentation (TDF) scan provides additional structural information. The first commercially available instruments (Q-Trap TM) was manufactured by SCIEX and made available through the commercial area of Applied Biosystem.
The linear ion trap combines the advantages of a triple quadrupole with that of the three-dimensional ion trap guaranteeing very selective scanning of precursor ions and high sensitivity. Additional benefits of LITs include increased ion storage capacity and improved trapping efficiency. In addition, there is no inherent low-mass cut-off in the product ion spectra because fragmentation and ion-trapping steps are spatially separated.
Finally, in using Q3 as LIT it is possible to obtain MSn spectra. Moreover, Q3 is operated at a very low pressure (3 * 10-5 Torr) that insures that the ions entering the Q3 trap are collisionally cool enhancing and enhancing efficiency of MSn.
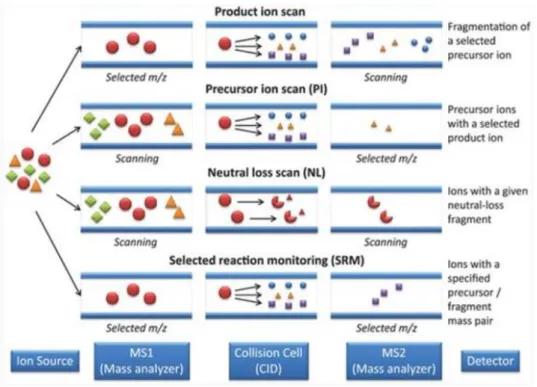
Figure 6 summarize the different scan mode in which this instrument can operate.
16
Figure 6: Four different scan mode in which a LIT can operate.
a) In the product or daughter ion scanning the Q1 is used to select user-specified sample ions arising from a particular analyte; usually the molecular-related (i.e. (M+H) + or (M-H) -) ions. These chosen ions pass into the q2, are bombarded by the gas molecules which cause fragment ions to be formed, and these fragment ions are analysed (i.e. separated according to their mass to charge ratios) by the Q3. All the fragment ions arise directly from the precursor ions specified in the experiment, and thus produce a fingerprint pattern specific to the compound under investigation. This type of experiment is particularly useful for generating peptide sequence information.
b) In the precursor or parent ion scanning the Q1 allows the transmission of all sample ions, while the Q3 is set to monitor specific fragment ions, which are generated by bombardment of the sample ions with the collision gas in the q2. This type of experiment is particularly useful for monitoring groups of compounds contained within a mixture which fragment to produce characteristic fragment ions.
c) In the constant neutral loss scanning both the Q1 and Q3 scan and collect data across the whole m/z range, but the two are off-set so that the second analyser allows only those ions which differ by a certain number of
17
mass units (equivalent to a neutral fragment) from the ions transmitted through the first analyser. This scan mode is used, for example, to identify phosphorylated peptides in a peptide mixture due to the typical fragmentation of these peptides consisting in loss of a phosphoric acid residue that correspond a mass shift of -98 Da.
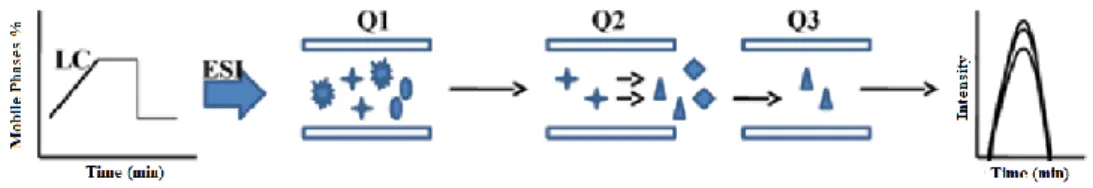
d) Selected Reaction Monitoring (SRM) is the most common mode of using a triple quadrupole MS/MS for quantitative analysis, allowing enhanced sensitivity and selectivity. The first quadrupole filters a specific precursor ion of interest. Ions generated in the ion source having a different m/z can not pass Q1. The collision cell is optimized to produce a characteristic product ion by collision of the precursor ion with a neutral collision gas, such as nitrogen. Generated product ions are transferred into the Q3 where only a specific m/z can pass. All other product ions are filtered out in Q3. In SRM mode, two stages of mass filtering are employed on a triple quadrupole mass spectrometer. In the first stage, an ion of interest (the precursor) is preselected in Q1 and induced to fragment by collisional excitation with a neutral gas in a pressurized collision cell (Q2). In the second stage, instead of obtaining full scan MS/MS where all the possible fragment ions derived from the precursor are mass analysed in Q3, only a small number of sequence-specific fragment ions (transition ions) are mass analysed in Q3 (Figure 7).
Figure 7:Typical diagram showing the selected reaction monitoring experiment. In this triple
quad, Q1 and Q3 act like a mass filter whereas Q2 acts as a collision cell for selected peptide ion.10
Thus, SRM mode works like a double mass filter which drastically reduces noise and increases selectivity. Single quadrupole and triple quadrupole systems allow the detection of many SRM transitions, respectively. This enables quantitation of many targeted analytes in a single experiment. Typically, additional SRM transitions must be detected to perform identification of quantified compounds. Hereby, the most intense ion is called the ‘quantifier’ and all additional ions are called ‘qualifiers’.
Selected reaction monitoring (SRM) coupled with stable isotope dilution mass spectrometry (SID-MS) using a triple quadrupole mass spectrometer is a
18
powerful method for quantitative measurement of target molecules. SRM methods, in principal, provide both absolute structural specificity for the analyte and relative or absolute measurement of analyte concentration when stable, isotopically-labelled standards are added to a sample in known quantities. When a synthetic, stable isotope labelled peptide is used as an internal standard, the concentration can be measured by comparing the signals from the exogenous labelled and endogenous unlabelled species. This can be done because they have the same physicochemical properties and differ only by mass. It has been a principal tool for quantification of small molecules in clinical chemistry for number of decades. MS-based quantitative assays have the necessary characteristics required for verification studies, namely: high specificity, sensitivity, multiplexing capability, and precision.
1.3 Mass Spectrometry-based omics
Dramatic technological advances in the biological sciences over the past few years have forged a new era of research including the emerging field of systems biology. Although the understanding of living organisms at the molecular system level is still in its infancy, it is evident that comprehensive investigations of the “omics cascade” with genomics, transcriptomics, proteomics, and metabolomics are important building blocks and will play a central role in this new science11. The integrative analysis of an organism’s response to a perturbation on the transcriptome, proteome, and metabolome levels will lead to a better understanding of the biochemical and biological mechanisms in complex systems.
Many "omics" techniques have been developed for one goal: identification of specific target compounds involved in diagnosis, prognosis, therapeutic response prediction and population screening of human disease. For example, recent ‘‘omics’’ technologies have opened a new road to biomarker discovery and early detection of cancer. A biomarker is a biologically derived molecule in the body, which is indicative of the progress or status of a disease.
Mass spectrometry (MS) is one of the key analytical technology on which the emerging ‘‘-omics’’ approaches are based. It may provide detection and quantization of thousands of proteins and biologically active metabolites from a tissue, body fluid or cell culture working in a ‘‘global’’ or ‘‘targeted’’ manner, down to ultra-trace levels. It can be expected that the high performance of MS technology, coupled to routine data handling, will soon
19
bring fruit in the request for a better understanding of human diseases, leading to new molecular biomarkers, hence affecting drug targets and therapies.
1.3.1 Mass spectrometry-based metabolomics
Mass spectrometry-based metabolomics aims at the comprehensive and quantitative analysis of wide arrays of metabolites in biological samples having very diverse physicochemical properties and occurring at different abundance levels.
Consequently, comprehensive metabolomics investigations are primarily a challenge for analytical chemistry and specifically mass spectrometry has vast potential as a tool for this type of investigation. Metabolomics require special approaches for sample preparation, separation, and mass spectrometric analysis. It primarily focuses on metabolic fingerprinting, a technique that analyses all detectable analytes in each sample with subsequent classification of samples and identification of differentially expressed metabolites, which define the sample classes.
Metabolome refers to the complete set of small-molecule metabolites (such as metabolic intermediates, hormones and other signalling molecules, and secondary metabolites) to be found within a biological sample, in a high dynamic range of concentrations, such as a single organism. Although the metabolome can be defined readily enough, it is not currently possible to analyse the entire range of metabolites by a single analytical method. Each type of cell and tissue has a unique metabolic ‘fingerprint’ that can elucidate organ or tissue-specific information, while the study of biofluids can give more generalized though less specialized information. Commonly used biofluids are urine and plasma, as they can be obtained invasively or relatively non-invasively, respectively.
A metabolite is usually defined as any molecule less than 1 kDa in size. In plant-based metabolomics, it is common to refer to "primary" and "secondary" metabolites. A primary metabolite is directly involved in the normal growth, development, and reproduction. A secondary metabolite is not directly involved in those processes, but usually has important ecological function. Examples include antibiotics and pigments. By contrast, in human-based metabolomics, it is more common to describe metabolites as being either endogenous (produced by the host organism) or exogenous. Metabolites of foreign substances such as drugs are termed xeno-metabolites. Global
20
metabolic fingerprinting and quantitative metabolite profiling represent two complementary strategies currently applied for metabolomic investigations11.
In most cases, the first step in a metabolite profiling experiment is to extract metabolites from the biological matrix. Extracted metabolites are often separated using GC/MS, LC/MS, or CE/MS. Critical to all MS-based approaches is the efficient desorption and ionization of metabolites, where the resulting gas phase ions can be separated by mass analysers such as quadrupole, time-of-flight, and ion trap. Ions are typically detected using a microchannel plate and photomultiplier tube and identified through comparison of exact mass, retention time, and fragmentation information with genuine standards and spectral databases12.
Nowadays, high throughput LC/SRM/MS allows simultaneous analysis of different class of small molecules, metabolites, or drugs in a short time, therefore enabling a quantitative profiling of hundreds to thousands of samples for target-based metabolite profiling13.
Among different types of mass spectrometers, a triple quadruple mass spectrometer is optimal for targeted metabolomics, based on its high sensitivity, high specificity, and excellent quantitation ability. Two stages of mass selection reside in a triple quadrupole mass spectrometer: precursor ion (MS1) and a fragment of the precursor ion (product ion, MS2) that produce a molecular weight and structure specific sensitive measurement for a given analyte. The potential power of utilizing a triple quadrupole mass spectrometry-based quantitation technique, namely, Selected Reaction Monitoring (SRM), for metabolomics has not been fully recognized until recently. A triple quadrupole mass spectrometry-based quantitation for small molecules has been heavily used by analytical chemists for analysing drug metabolites, hormones, pesticides, and herbicides with great precision (CV < 10%). To further increase selectivity and sensitivity of the triple quadrupole mass spectrometry-based quantitation assay, a front-end separation technique, such as LC, GC, or CE, is often added as the third dimension of separation. While a variety of separation techniques can be used to couple a triple quadrupole mass spectrometer, the polarity-based liquid chromatography (LC) stands out for its speed, simple sample pre-treatment, and numerous choices of types of commercially available columns based on different separation mechanisms such as reverse phase, normal phase, or hydrophilic interaction, etc14.
Mass spectrometry-based metabolomics offers quantitative analyses with high selectivity and sensitivity and the potential to identify metabolites.
21
Combination with a separation technique reduces the complexity of the mass spectra due to metabolite separation in a time dimension, provides isobar separation, and delivers additional information on the physicochemical properties of the metabolites. However, mass spectrometry-based techniques usually require a sample preparation step, which can cause metabolite losses, and based on the sample introduction system and the ionization technique used, specific metabolite classes may be discriminated. Therefore, parallel application of several techniques, for example, GC-MS and LC-MS is desired to study the metabolome comprehensively15.
1.3.2 Mass spectrometry-based proteomics
Recent successes illustrate the role of mass spectrometry-based proteomics as an indispensable tool for molecular and cellular biology and for the emerging field of systems biology. Proteomics was defined as the study of “the expressed protein complements of a genome at a specific time” by Wilkins in 1994. The terms “proteomics” and proteome” mirror the terms “genomics” and “genome”. The drivers of genomic and proteomic analyses are the technological achievements of the past decade that enable the quantitative analysis of the DNA sequence, mRNA and protein expression inside cells and include tools such as DNA microarrays, two-dimensional gel electrophoresis (2D-GE) and mass spectrometry (MS).
Nowadays proteomics can rely on powerful analytical protein-separation technologies (chromatography, electrophoresis), that serve to simplify complex protein mixtures to compare apparent differences in protein levels between two samples. However, the most powerful analytical tools for proteomic analysis is mass spectrometry (MS), whose instrumentation has undergone huge changes over the past years, culminating in the development of highly sensitive, robust instruments that can reliably analyse biomolecules, particularly proteins and peptides. The introduction of ES and MALDI (1980’s), in combination with the accessibility of genome sequence information, has revolutionized MS, thus allowing routine MS analysis of protein molecules. Two main strategies for protein ID by MS are currently used in proteomics: top-down and bottom-up proteomics. In top-down proteomics, intact proteins are introduced into a mass spectrometer and then subjected to gas-phase fragmentation16.
However, the purpose to multiply charged product ions has always been a weak point of this approach, because it may prevent the determination of
22
product ion masses. With the introduction of the modern mass spectrometers with high mass measurement accuracy, this obstacle has been overcome (e.g., modern MALDI TOF/TOF instruments). Conversely, in bottom-up proteomics, the proteins are firstly separated by gel electrophoresis or chromatography, subsequently digested by specific enzymes (e.g., trypsin to cut lysine and arginine) and then introduced into the mass spectrometer. Bottom-up proteomics approach is represented by peptide mass fingerprinting (PMF) and tandem MS analysis. PMF has largely characterized the early years of the proteomic era; it relies on the acquisition of mass spectra from a tryptic digest of a protein sample and on the measure of tryptic peptide masses searched against a protein database such as UniProt, employing different database search engines and performing, for each protein, an in silico tryptic digest, hence generating a theoretical spectrum. The best overlap between the experimental and theoretical mass spectra then identifies the protein.
The 1D- or 2D-SDS-PAGE-LC-MS/MS based proteomics, often called shotgun proteomics, is now the main bottom-up proteomics technological approach. The workflow provides the protein separation by 1D-SDSPAGE according to MW, followed by in-gel tryptic digestion, peptide analysis by nano-LC-MS/MS and protein ID by database searching, as above described17. While the application of shotgun proteomics workflows to tissues, cells, and organelles usually results appropriate, the analysis of body fluids (e.g., serum, blood, plasma, intestinal fluids, urine samples) is particularly difficult because of the complexity and of the high dynamic range of contained analytes.
Recently, LC MS/MS in SRM ion mode has emerged as a promising technique for such precise quantification of targeted proteins. Originally applied to the measurement of small molecules (such as metabolites or drugs), where a capillary chromatography column is connected in-line to the electrospray ionization source of the mass spectrometer 18. SRM exploits the unique capability of triple quadrupole (QQQ) mass spectrometers to act as mass filters and to selectively monitor a specific analyte molecular ion and one or several fragment ions generated from the analyte by collisional dissociation. The number of such fragment ions that reach the detector is counted over time, resulting in a chromatographic trace with retention time and signal intensity as coordinates. Several such precursor–fragment ion pairs, termed SRM transitions, can be sequentially and repeatedly measured at a periodicity that is fast compared to the analyte's chromatographic elution, yielding chromatographic peaks for each transition that allow for the concurrent quantification of multiple analytes. This multiplexing capability has led to the
23
term multiple reaction monitoring (MRM), which is frequently used as a synonym of SRM. When applied to proteomics, SRM measures peptides produced by the enzymatic digestion of a proteome as surrogates of the corresponding proteins. Molecular ions within a mass range focused around the mass of the targeted peptide are selected in the first mass analyser (Q1), fragmented at the peptide bonds by collision-activated dissociation (in Q2) and one or several of the fragment ions uniquely derived from the targeted peptide are measured by the second analyser (Q3). A suitably chosen set of SRM transitions therefore constitutes a specific assay to detect and quantify a target peptide and, by inference, a target protein in complex samples19.
The application of SRM to proteomics has been slow and not without complications. Proteins are large molecules and by themselves at present are not compatible with the technique. The ensuing questions of how many and which of the many peptides generated by tryptic digestion of each target protein constitute optimal inputs for SRM assays are therefore of critical importance. In addition, peptides generally yield more complex fragment-ion patterns than metabolites or drugs, thus complicating the choice of appropriate SRM transitions18.
1.3.3 SRM in clinical applications
The capability of SRM to quantify specific target compounds across a variety of samples appears particularly well suited for biomarker verification. Candidate biomarkers for their respective disease need to be verified across large sample sets to achieve enough statistical power, targeting easily accessible human specimens, such as serum or plasma20. Classically, biomarker verification relied on antibody-based assays, but recently SRM has emerged as an alternative because of its superior multiplexing capabilities of 50–100 analytes, the shorter and cheaper assay development and the capability to discriminate between protein isoforms.
Numerous examples of the application of SRM for the analysis of low molecular weight chemicals with biological relevance exist in the literature and these span a broad range of analytes including endogenous compounds, therapeutic agents and their metabolites, environmental toxicants and compounds of abuse or malicious intent. Recent examples of the use of SRM for analysing endogenous compounds in humans include the measurement of vitamins, steroids and neurotransmitters, multiple analyses of drugs and their metabolites are too numerous to list comprehensively, but include the measurement of therapeutic agents, such as warfarin, triazolam, nevirapine and
24
antibiotics, the measurement of drugs of abuse, such as heroin, cocaine and cannabinoids and the assay of performance enhancers, such as androgen and other stimulants. In addition, SRM has been utilised for the analysis of low molecular weight chemicals present in plants, fish and contaminated water courses, demonstrating the versatility and breadth of application of the technique for the routine quantification of low molecular weight products.21
Over the last ten years, several studies that applied SRM to protein analysis increased exponentially and the subject of such studies is progressively shifting from technological advances to biological or biomedical applications, a development that attests to the increasing maturity of the technology. A challenge in using SRM for candidate-biomarker verification is the required sensitivity for the quantification of low-abundance proteins, given a dynamic concentration range of plasma proteins over 12 orders of magnitude18. SRM has also been applied to study signalling pathways, for example, Wnt/β-catenin signalling, a system of high biological and biomedical importance given its deregulation in different types of cancer. Similarly, SRM has been used to quantitatively monitor linked to mammalian stem cell renewal and pluripotency in nuclear extracts from mouse embryonic stem cell22.
25
Chapter 2
2.1 SRM method
2.1.1 Analytical approach
Targeted metabolomics and proteomics focus on the quantitative measurements of a specific subset of known analytes representative of biologically relevant processes by LC-MS/MS in Selected Reaction Monitoring scan mode. This approach was shown to be a valuable tool to identify altered pathways in pathological conditions and/or to define therapeutic modes of action.
Aim of this project was the development of robust and versatile analytical procedures for the direct determination and quantification of proteins or metabolites in different biological samples.
The methodological approach developed here are based on different steps: 1) identification of a set of proteins and metabolites of interest capable of satisfying a specific biological or clinic request 2) selection of transitions maximizing sensitivity and selectivity 3) optimization of SRM transitions by tuning acquisition parameters of the mass spectrometer 4) validation of the transitions in biological matrix to account to unspecific contributions of fragment ions background 5) quantification by SRM.
2.1.2 Identification of targeted analytes
The first step of a targeted experiment is the selection of a set of compounds of interest. Depending on the sensitivity and accuracy required, hundreds and eventually up to 1000 analytes can be targeted in a single LC-MS analysis after the transitions have been optimized. The selection of the metabolites and proteins set might be based on previous experiments or the scientific literature or to make possible in vitro and in vivo studies for specific disease.
In particular, for proteins analyses specific peptides (proteotypic peptides)23. that are unique for target protein and easily detectable by mass spectrometry should be chosen. The uniqueness of a peptide sequence in a proteome can be determined, in principle, from the genomic information, but the true complexity of proteomes is generally difficult to predict. The choice of peptides with favourable mass spectrometry properties is thus crucial, as it determines the sensitivity of the assay. Nowadays, information from prior experiments conducted on natural proteomes are available in different database
26
as, for example, PeptideAtlas24, the Global Proteome Machine Database (GPMDB)25, that can be used for identification of peptides that can be reproducibly detected and are thus likely associated with the most intense signals.
Numerous software tools for evaluating the best SRM peptides have emerged such as Skyline26. Among the parameters critical for predicting peptides were hydrophobicity, charge, energetic and structural properties.
In general, short hydrophilic and long hydrophobic peptides should be avoided, whereas fully tryptic peptides with an average length of ~10 amino acids, devoid of residues prone to artefactual or post-translational modifications should be targeted, like peptide susceptible to undergo glycosylation, phosphorylation, etc. might to lead to bias as they can be present in various forms27.
2.1.3 Selection of optimal transitions
The combination of m/z settings for the first and third quadrupole is referred as “transition”, it is important to select transition ions that maximize sensitivity and specificity of the SRM experiment. Several in silico methods are available, and continue to be refined, which facilitate the choice of the transitions. Transitions can be selected from (1) libraries of previously collected MS/MS spectra in online repositories, (2) computational tools that predict fragmentation, (3) analysis of synthetic peptide standards. Several software tools, for facilitating transition selection have been described. The current practice is to select two transitions in metabolomic analysis and at least two to five most intense transitions per peptides for proteomic investigations. Skyline utilizes the ProteoWizard libraries 28to allow analysis of data from all MS instrument platforms, thus providing a vendor-neutral resource for sharing and creation of both methods and results across instrument platforms. Skyline facilitates the generation and refinement of proteomic peptide lists from protein sequences or database entries, both by utilizing online MS/MS spectral repositories and by supporting the generation of custom-built libraries based upon sets of locally acquired tandem spectral data.
Skyline creates transition lists and vendor-specific instrument methods that can be imported directly into instrument control software for MS instruments from several vendors. Skyline also provides a platform for standardized analysis of SRM result files for peak integration and visualization and data quality assessment across multiple analyses. Finally, Skyline allows
27
the export of processed data in custom report formats compatible with subsequent statistical analyses, publication, and database deposition29. However, there is a physical limit to the number of transitions that can be measured in the same analysis. The SRM cycle time is the product of the number of transitions recorded in the cycle and the time spent on acquiring each transition signal (dwell time). A too long a cycle time, due to too many monitored transitions, hence an insufficient number of data points to reconstruct the chromatographic elution profile of the targeted peptide, compromising accurate quantification. Alternatively, this results in a low dwell time and a reduced signal-to-noise ratio, compromising the detection of low-abundance components. This generates the well-known trade-off between the number of transitions and the limit of detection of an SRM experiment30.
2.1.4 Optimization of SRM transitions
In order to increase the limit of detection and quantification of the SRM assays mass spectrometry parameters that are molecule-dependent (such as declustering potential or cone voltage) or transition-dependent (for example, collision energy) needs to be optimized.
In primis, ionization devices and experimental conditions, such as flow
rate, solvents and background, can influence charge state distributions and the process of dissolvation and dissociation of ion clusters supported by a voltage potential (referred to as ‘declustering potential' (DP), ‘fragmentor voltage' or ‘ion transfer capillary offset voltage' depending on the manufacturer) must be optimized.
During fragmentation singly charged y ions are the predominant type of fragments generated by CID in a linear collision cell. Only small b ions are usually observed. Fragments with m/z values close to the precursor should be avoided as such transitions are usually noisy. Fragments with m/z values above the precursor generally display the highest selectivity, as the singly charged chemical background cannot result in fragments with higher m/z than the precursor. In contrast, tryptic peptide ions are predominantly doubly or triply charged with one charge at each terminus. Upon fragmentation, one charge is lost and therefore a part of the fragments has an m/z value bigger than the precursor value. A parameter that is of considerable importance is the collision energy, that is tuned to optimize the intensity of the fragment ions of interest: with increasing collision energy, a larger part of the precursor ions is fragmented, and fragment ion intensity increases until this increase is overcompensated by the losses due to secondary fragmentation events. The
28
optimal collision energy is approximately linearly correlated with the precursor mass for a given charge state. However, particular peptides or fragments deviate considerably from the predicted value.
The easiest and most systematic way of optimizing ionization and fragmentation conditions is to test possible transitions in direct infusion mode and ramp the parameters. This process is partly automated by add-ons for the acquisition software.
2.1.5 Validation of the transitions and matrix effect
Transitions extracted for an SRM assay should be validated by addressing the likelihood that the chosen transitions and their intensity distribution are associated with the target peptide or metabolite. Each transition selected for a specific target should be evaluated in the context of the actual biological matrix to account for unspecific contributions of the fragment ions deriving from co-eluting species with similar properties.
Plasma is probably the most complex biological matrix, so it is important to evaluate the matrix effect that can affect the goodness of the analysis and the quality of the result obtained. Whilst this is readily achievable for low molecular weight markers, it provides a major challenge when looking for proteins or peptides. It has been estimated that human plasma contains proteins that span 10 orders of magnitude of concentration and includes resident plasma proteins (high and medium abundance) and signalling proteins such as hormones and cytokines (low abundance).
Specifically, the matrix affects not only ion suppression, a major pitfall for the analyst, but also detection capability, repeatability and accuracy.
The mechanism of the matrix effect in LC–MS, well described by Trufelli et al.201131, is not fully understood. One of the most important aspects is competition between an analyte and a co-eluting matrix component during ionization. As a result, there is a decrease in analyte ionization (ion suppression) or an increase in this ionization (ion enhancement). The matrix effect depends strongly on the type of ionization source. In ESI droplets are produced and a greater number of additives (from eluents or sample matrices) may lower evaporation efficiency and the ability of analytes to reach the gas phase.
Reactions in the electrospray source depend on the properties of solvents and additives (like volatility, viscosity, pH or electrolyte concentration), the physicochemical properties of analytes (pKa, hydrophobicity, proton affinity or ion solvation energy) and the operating parameters of LC–MS instruments
29
(flow rate, temperature and voltage). Hence, all these variables make ionization a highly complex and changeable process. Furthermore, co-eluting components may produce similar ions in MS or MS/MS experiments, which leads to the erroneous interpretation of results, especially when these components are present at high concentrations in the extract and eluted in the same retention window as the target compounds.
Several strategies have been put forward to eliminate the problems resulting from matrix 32,33. The most effective of them is exhaustive sample clean-up used immunoaffinity depletion of highly abundant plasma proteins in combination with peptide fractionation by strong- or mixed-mode cation exchange chromatography, which can help to remove interferents, and improves the LOQs to 1–10 ng ml− but it does run the risk of analyte loss. The second strategy is to improve chromatographic separation. This allows the analytes to be eluted in an appropriate period of time, in order to avoid co-elution with matrix components. A third approach is to dilute the final extract several times so that fewer matrix components will be injected into the analytical system
The matrix effect can be compensated for with appropriate calibration methods, firstly, by using calibration standards in pure solvents, and secondly, by using standards in the matrix 33.
Finally, the standard-addition method is a much cheaper and useful approach when no blank matrix is available for the calibration. A known amount of analyte (spike) is introduced into aliquots of sample extracts containing the target compound, so that any co-extracted impurity is accounted for in the calibration; however, the volume of standard added must be small enough to prevent sample extract dilution. By using this methodology, the unknown concentration initially present in the sample can be calculated by extrapolation.
At this point, for each analyte the recovery value (%) is estimated by measuring the concentration of analyte added to real samples (spiked samples) according to the following formula:
𝑅𝑒𝑐𝑜𝑣𝑒𝑟𝑦 (%) =𝑐1− 𝑐2 𝑐3
× 100 Where:
C1: analyte concentration measured after the addition C2: analyte concentration measured before the addition